Article

Novel Dual-Signal SiO2-COOH@MIPs Electrochemical Sensor for Highly Sensitive Detection of Chloramphenicol in Milk

1
School of Agricultural Engineering and Food Science, Shandong University of Technology, No. 266 Xincun Xilu, Zibo 255049, China
2
Shandong Provincial Engineering Research Center of Vegetable Safety and Quality Traceability, No. 266 Xincun Xilu, Zibo 255049, China
3
Zibo City Key Laboratory of Agricultural Product Safety Traceability, No. 266 Xincun Xilu, Zibo 255049, China
*
Author to whom correspondence should be addressed.
Sensors 2023, 23(3), 1346; https://doi.org/10.3390/s23031346
Submission received: 24 December 2022 / Revised: 16 January 2023 / Accepted: 19 January 2023 / Published: 25 January 2023
(This article belongs to the Special Issue Chemical Sensors in Analytical Chemistry)

Abstract

:
In view of the great threat of chloramphenicol (CAP) to human health and the fact that a few producers have illegally used CAP in the food production process to seek economic benefits in disregard of laws and regulations and consumer health, we urgently need a detection method with convenient operation, rapid response, and high sensitivity capabilities to detect CAP in food to ensure people’s health. Herein, a molecularly imprinted polymer (MIP) electrochemical sensor based on a dual-signal strategy was designed for the highly sensitive analysis of CAP in milk. The NiFe Prussian blue analog (NiFe-PBA) and SnS2 nanoflowers were modified successively on the electrode surface to obtain dual signals from [Fe(CN)6]3−/4− at 0.2 V and NiFe-PBA at 0.5 V. SiO2-COOH@MIPs that could specifically recognize CAP were synthesized via thermal polymerization using carboxylated silica microspheres (SiO2-COOH) as carriers. When the CAP was adsorbed by SiO2-COOH@MIPs, the above two oxidation peak currents decreased at the same time, allowing the double-signal analysis. The SiO2-COOH@MIPs/SnS2/NiFe-PBA/GCE sensor used for determining CAP was successfully prepared. The sensor utilized the interactions of various nanomaterials to achieve high-sensitivity dual-signal detection, which had certain innovative significance. At the same time, the MIPs were synthesized using a surface molecular imprinting technology, which could omit the time of polymerization and elution and met the requirements for rapid detection. After optimizing the experimental conditions, the detection range of the sensor was 10−8 g/L–10−2 g/L and the limit of detection reached 3.3 × 10⁻⁹ g/L (S/N = 3). The sensor had satisfactory specificity, reproducibility, and stability, and was successfully applied to the detection of real milk samples.

1. Introduction

Chloramphenicol (CAP) is a broad-spectrum antibiotic commonly used to treat bacterial infections caused by Gram-positive and Gram-negative bacteria [1]. Unfortunately, CAP ultimately enters and causes serious harm to the body [2,3]. In view of the huge threat of CAP to human health, many countries such as the United States, China, and Canada have issued decrees to explicitly prohibit the use of CAP in the food production process [4]. It is worrying that there are still many producers who pursue economic benefits by illegally using CAP in the food production process, regardless of the regulations and the health of consumers. Therefore, a detection method with convenient operation, rapid response, and high sensitivity capabilities is needed to detect CAP in food to preserve people’s health.
Among the various detection methods, electrochemical methods have received extensive attention due to their fast detection speeds, ease of operation, and low detection costs [5,6,7]. For the sake of achieving high specificity in detection, some recognition elements with specific recognition capabilities such as antibodies [8,9], aptamers [10,11], enzymes [12], and molecularly imprinted polymers (MIPs) [13,14,15] have been extensively utilized. Among the many recognition elements, MIPs are favored by many researchers because of their cost-effectiveness and high stability. MIPs are a class of polymers synthesized with target molecules as templates, which have a specific selective recognition function [16,17]. However, as most MIPs cannot achieve the purpose of the high-sensitivity detection of target molecules due to their poor electrical conductivity [18], the selection of nanomaterials with excellent conductivity to enhance the electrochemical signal is a problem that must be considered [19,20,21].
Prussian blue analog (PBA) is a novel compound formed by replacing the iron element in Prussian blue (PB) with other elements such as cobalt and nickel without destroying the crystal structure [22]. It has been widely utilized in electrochemical energy storage [23], electrocatalysis [24], and other fields. It is worth noting that the redox of multiple metal ions occurs in PBA, which means that under certain conditions, PBA itself can provide a detection signal for electrochemical analyses. As a transition metal chalcogenide [25], SnS2 has received extensive attention in the fields of photocatalysis [26] and gas sensing [27], on account of its two-dimensional layered structure, excellent chemical stability, and large surface area. At the same time, due to its good electrical conductivity and sandwich-like structure, which can provide reaction sites, SnS2 also has good application prospects in the field of electrochemistry. Controlling the morphology of MIPs in the synthesis process by selecting different carriers can make the particle size distribution more uniform. Compared with most other sensors using electropolymerization to prepare molecularly imprinted polymers, the electropolymerization and elution times were reduced, which was more in line with the requirements for rapid detection.
Here, we prepared a new dual-signal electrochemical sensor based on SiO2-COOH@MIPs for the quantitative detection and analysis of CAP in milk. The NiFe-PBA was initially modified on the electrode surface to furnish a second detection signal. The Ni ions in NiFe-PBA were oxidized under the action of SnS2 nanoflowers, which led to further amplification of the second detection signal [28]. Meanwhile, the three-dimensional flower-like structure of the SnS2 nanoflowers could also increase the specific surface area of the electrode, which provided more attachment sites for the next modified materials. The surface molecular imprinting technology (SMIT) was used to synthesize MIPs with SiO2 microspheres as the carriers, which acted as the recognition elements, and we carried out the specific recognition and detection of CAP. When the sensor was inserted into the CAP solution, the oxidation peak current of [Fe(CN)6]3−/4− (Iprobe) at 0.20 V and the oxidation peak current of NiFe-PBA (Isubstrate) at 0.50 V could be observed to decrease simultaneously. The changes could be attributed to the re-adsorption of CAP by the imprinted cavity, hindering the electron transfer rate. The sensor achieved the high-sensitivity detection of CAP by analyzing the changes in the ID value (ID = Iprobe + Isubstrate) after the CAP was re-adsorbed.

2. Experimental Section

The following components are introduced in the Supplementary Materials, namely the instruments and medicines required for the experiment (Supplementary Materials 2.1); the preparation procedure for the NiFe-PBA (Supplementary Materials 2.2), SnS2 nanoflowers (Supplementary Materials 2.3), SiO2 (Supplementary Materials 2.4.1), SiO2-COOH (Supplementary Materials 2.4.2), SiO2-COOH@MIPs, and SiO2-COOH@NIPs (Supplementary Materials 2.4.3); the procedure for the adsorption experiment and the pretreatment of GCE (Supplementary Materials 2.5 and 2.6); the parameters of the electrochemical measurement(Supplementary Materials 2.7); and the processing procedure for the actual sample (Supplementary Materials 2.8).

Preparation of SiO2-COOH@MIPs/SnS2/NiFe-PBA/GCE Sensor

We synthesized NiFe-PBA, SnS2, and SiO2-COOH@MIPs according to the steps in Scheme 1a–c (the specific synthesis process is described in detail in the Supplementary Materials). For the sake of obtaining a 1.0 mg/mL NiFe-PBA solution, the NiFe-PBA was dissolved in ultrapure water and sonicated for 15 min. Following the same operation steps, a 1.0 mg/mL SnS2 nanoflower solution was attained. Then, 10 μL of NiFe-PBA solution was dropped on the surface of the polished glassy carbon electrode to dry naturally at room temperature. After the NiFe-PBA solution was completely dry, 10 μL of SnS2 nanoflower solution was modified onto the NiFe-PBA/GCE surface. Ultimately, the sensor was obtained by modifying 10 μL of 10 mg/mL SiO2-COOH@MIPs on the SnS2/NiFe-PBA/GCE surface (Scheme 1d).

3. Results and Discussion

3.1. Characterization of the Prepared Materials

3.1.1. NiFe-PBA

The morphological features of NiFe-PBA were characterized using scanning electron microscopy (SEM) and transmission electron microscopy (TEM). As shown in Figure 1A,B, the as-synthesized NiFe-PBA material had a typical nanocube structure with a smooth surface and uniform size, with an average size of 100 nm. By comparing the main diffraction peaks in the x-ray diffraction (XRD) detection results for NiFe-PBA with the data for PB (JCPDS No. 73-0687), we could more intuitively know that the NiFe-PBA had been successfully prepared and had high crystallinity (Figure 1C).
The ingredients in NiFe-PBA were further analyzed via X-ray photoelectron spectroscopy (XPS). The full measured spectrum of NiFe-PBA (Figure 1D) showed that there were five elements (Ni, Fe, C, N, and O) in the NiFe-PBA. Six peaks can be observed in the Figure 1E. The peaks of Ni2+ 2p3/2 and Ni2+ 2p1/2 appeared at 856.2 eV and 873.9 eV, respectively, and the two peaks at 858.3 eV and 875.1 eV belonged to Ni3+ 2p3/2 and Ni3+ 2p1/2, respectively. The remaining two peaks were noticeable satellite peaks (863.2 eV and 880.7 eV). In the spectrum of Fe 2p, five peaks could be observed (Figure 1F). The peaks of Fe2+ 2p3/2 and Fe2+ 2p1/2 appeared at 708.4 eV and 720.9 eV, respectively, and the two peaks at 709.7 eV and 723.4 eV belonged to Fe3+ 2p3/2 and Fe3+ 2p1/2, respectively. The remaining peak was a more obvious satellite peak (711.1 eV), which was consistent with previous reports in the literature [29]. The XPS spectra demonstrated that the two elements existed in NiFe-PBA in Ni3+/2+ and Fe3+/2+ valence states. The three peaks shown in the C 1s spectrum (Figure 1G) at 284.8, 286.4, and 294.1 eV correspond to C=C, C-N, and C=O, respectively. There was only one peak in the N 1s spectrum at 398 eV (Figure 1H).

3.1.2. SnS2 Nanoflowers

In this study, SEM, TEM, mapping, XPS, XRD, and the Randles–Sevcik equation were used to fully characterize and analyze the properties of SnS2 nanoflowers. The relevant experimental data are shown in Supplementary Material 3.1.2.

3.1.3. SiO2-COOH@MIPs

SEM, TEM, Fourier transform infrared (FT-IR) spectroscopy, and a thermo-gravimetric analysis (TGA) were used to characterize and analyze SiO2-COOH@MIPs. The relevant experimental data are shown in Supplementary Material 3.1.3.

3.2. Electrochemical Investigation of SiO2-COOH@MIPs/SnS2/NiFe-PBA/GCE

The electrochemical performances of electrodes modified with different materials were characterized using the differential pulse voltammetry (DPV) technique. As shown in Figure 2A, only one oxidation peak appeared in the DPV curve of the bare electrode. Dropping the poorly conductive NiFe-PBA onto the bare electrode surface resulted in a decrease in the oxidation peak current at 0.20 V and the appearance of a new oxidation peak at 0.50 V. However, the peak value at 0.50 V was too minute to achieve the purpose of detection. Therefore, we introduced SnS2 nanoflowers with good electrical conductivity, and the three-dimensional flower-like structure of the SnS2 nanoflowers increased the specific surface area and provided more attachment sites. Notably, when SnS2 nanoflowers were decorated on the NiFe-PBA/GCE surface, the peak current of the oxidation peaks at 0.20 V and 0.50 V was significantly enhanced and reached a maximum value. Since the as-prepared SiO2-COOH @MIPs did not have electrical conductivity, the oxidization peak-to-peak current at [Fe(CN)6]3−/4− and NiFe-PBA were both weakened when the SiO2-COOH@MIPs were decorated on the SnS2/NiFe-PBA/GCE surface. However, the surfaces of SiO2-COOH@MIPs had abundant imprinted cavities similar in structure and size to the template molecule after elution, which provided channels for electron transfer. The two peak currents were less weakened. When the as-prepared electrode was placed in a certain concentration of CAP solution, the CAP was adsorbed specifically to fill the imprinted cavities on the SiO2-COOH@MIPs, which hindered the electron transfer. The peak currents of the two oxidation peaks were significantly reduced. The SiO2-COOH@MIPs/SnS2/NiFe-PBA/GCE sensor had been successfully fabricated as demonstrated by the above tests. Combined with Figure 2B, this allowed us to better prove the above conclusion.
The different assembly steps of the sensor were further characterized using EIS, and the results are shown in Figure 2C. Compared with the bare electrode, when the NiFe-PBA with poor conductivity was modified on the electrode surface, the impedance increased and the diameter of the semicircle became larger. When SnS2 with good conductivity was further modified on the electrode surface, the impedance decreased and the diameter of the semicircle became smaller. When the electrode surface was further modified with SiO2-COOH@MIPs, the impedance increased due to the poor conductivity of SiO2-COOH@MIPs. As the adsorption process went on, the imprinted cavity on the electrode surface was occupied, which hindered the transfer of electrons and further increased the impedance. The results of the EIS analysis were similar to those of the CV and DPV analyses, which further proved that the sensor preparation process was successful.

3.3. Optimization of Conditions

Here, we define the ΔID value (ΔID = ΔIprobe + ΔIsubstrate) that represents the sum of the current differences between elution and incubation.

3.3.1. Molar Ratio of CAP to MAA

The ability of MIPs to re-adsorb CAP varied with the molar ratio of CAP to MAA (Figure 3A). When the MCAP/MMAA ratio increased from 2:1 to 1:4, the ΔID value steadily increased. However, when the molar ratio of CAP to MAA increased from 1:4 to 1:6, the ΔID value gradually decreased. This phenomenon could be explained by the copolymerization of the crosslinker and functional monomer during the actual reaction. The presence of excessive functional monomers could lead to polymerization between the functional monomers and reduce the number of imprinted cavities with specific recognition ability, thereby reducing the adsorption capacity of the MIP. We could conclude that the optimal MCAP.MMAA ratio was 1:4.

3.3.2. Molar Ratio of CAP to EGDMA

Figure 3B shows the effect of the molar ratio of the template molecule CAP to the crosslinker EGDMA on the ability of MIPs to re-adsorb CAP. The ΔID value also changed significantly with the change in the amount of crosslinking agent added. The ΔID value continually increased when the MCAP:MEGDMA ratio rose from 1:5 to 1:20. This was because the more EGDMA we added, the more CAP was bound when forming the MIPs.
It was common sense that the more EGDMA we added, the more the CAP formed MIPs and the more specific recognition cavities formed after elution. However, the ΔID values continued to decrease when the MCAP:MEGDMA ratio rose from 1:20 to 1:30 because the excess crosslinker interfered with the ability of the MIPs to specifically recognize CAP. By contrasting the ΔID value, the optimal molar ratio of CAP, MAA, and EGDMA was determined to be 1:4:20.

3.3.3. Adsorption Time

The performance of the sensor was also affected by the adsorption time. As the adsorption time steadily increased, the ΔID value also increased gradually, which could be attributed to the fact that a large number of target molecules were specifically adsorbed into the cavity of the MIPs with the increase in time, hindering the transfer of electrons. The maximum value of ΔID was reached at 20 min (Figure 3C). When the adsorption time continued to extend, we found that the ΔID value decreased slightly. This phenomenon could be attributed to the expansion and deformation of MIPs caused by prolonged immersion, resulting in the detachment of some target molecules from the MIPs.

3.3.4. Elution Times

The elution times were also one of parameters that needed to be optimized for the sensor because the number of imprinted cavities with specific recognition target molecules was directly affected by the elution times. According to the UV absorption spectrum of the eluate in Figure 3D (inset), the UV absorption peak (278 nm) of CAP in the fifth eluate was close to zero, indicating that the template molecule CAP could be completely removed after five elution phases. However, combined with the statistical graph in Figure 3D, the ΔID reached the maximum value in the third elution phase. When the elution continued, the ΔID showed a significant downward trend. This might have been because the excessive number of elution phases reduced the imprinted cavity, which could specifically recognize the target molecule, by disrupting the 3D imprinted structure of the MIPs. Therefore, three elution phases was selected as the optimal number.

3.4. Adsorption Studies

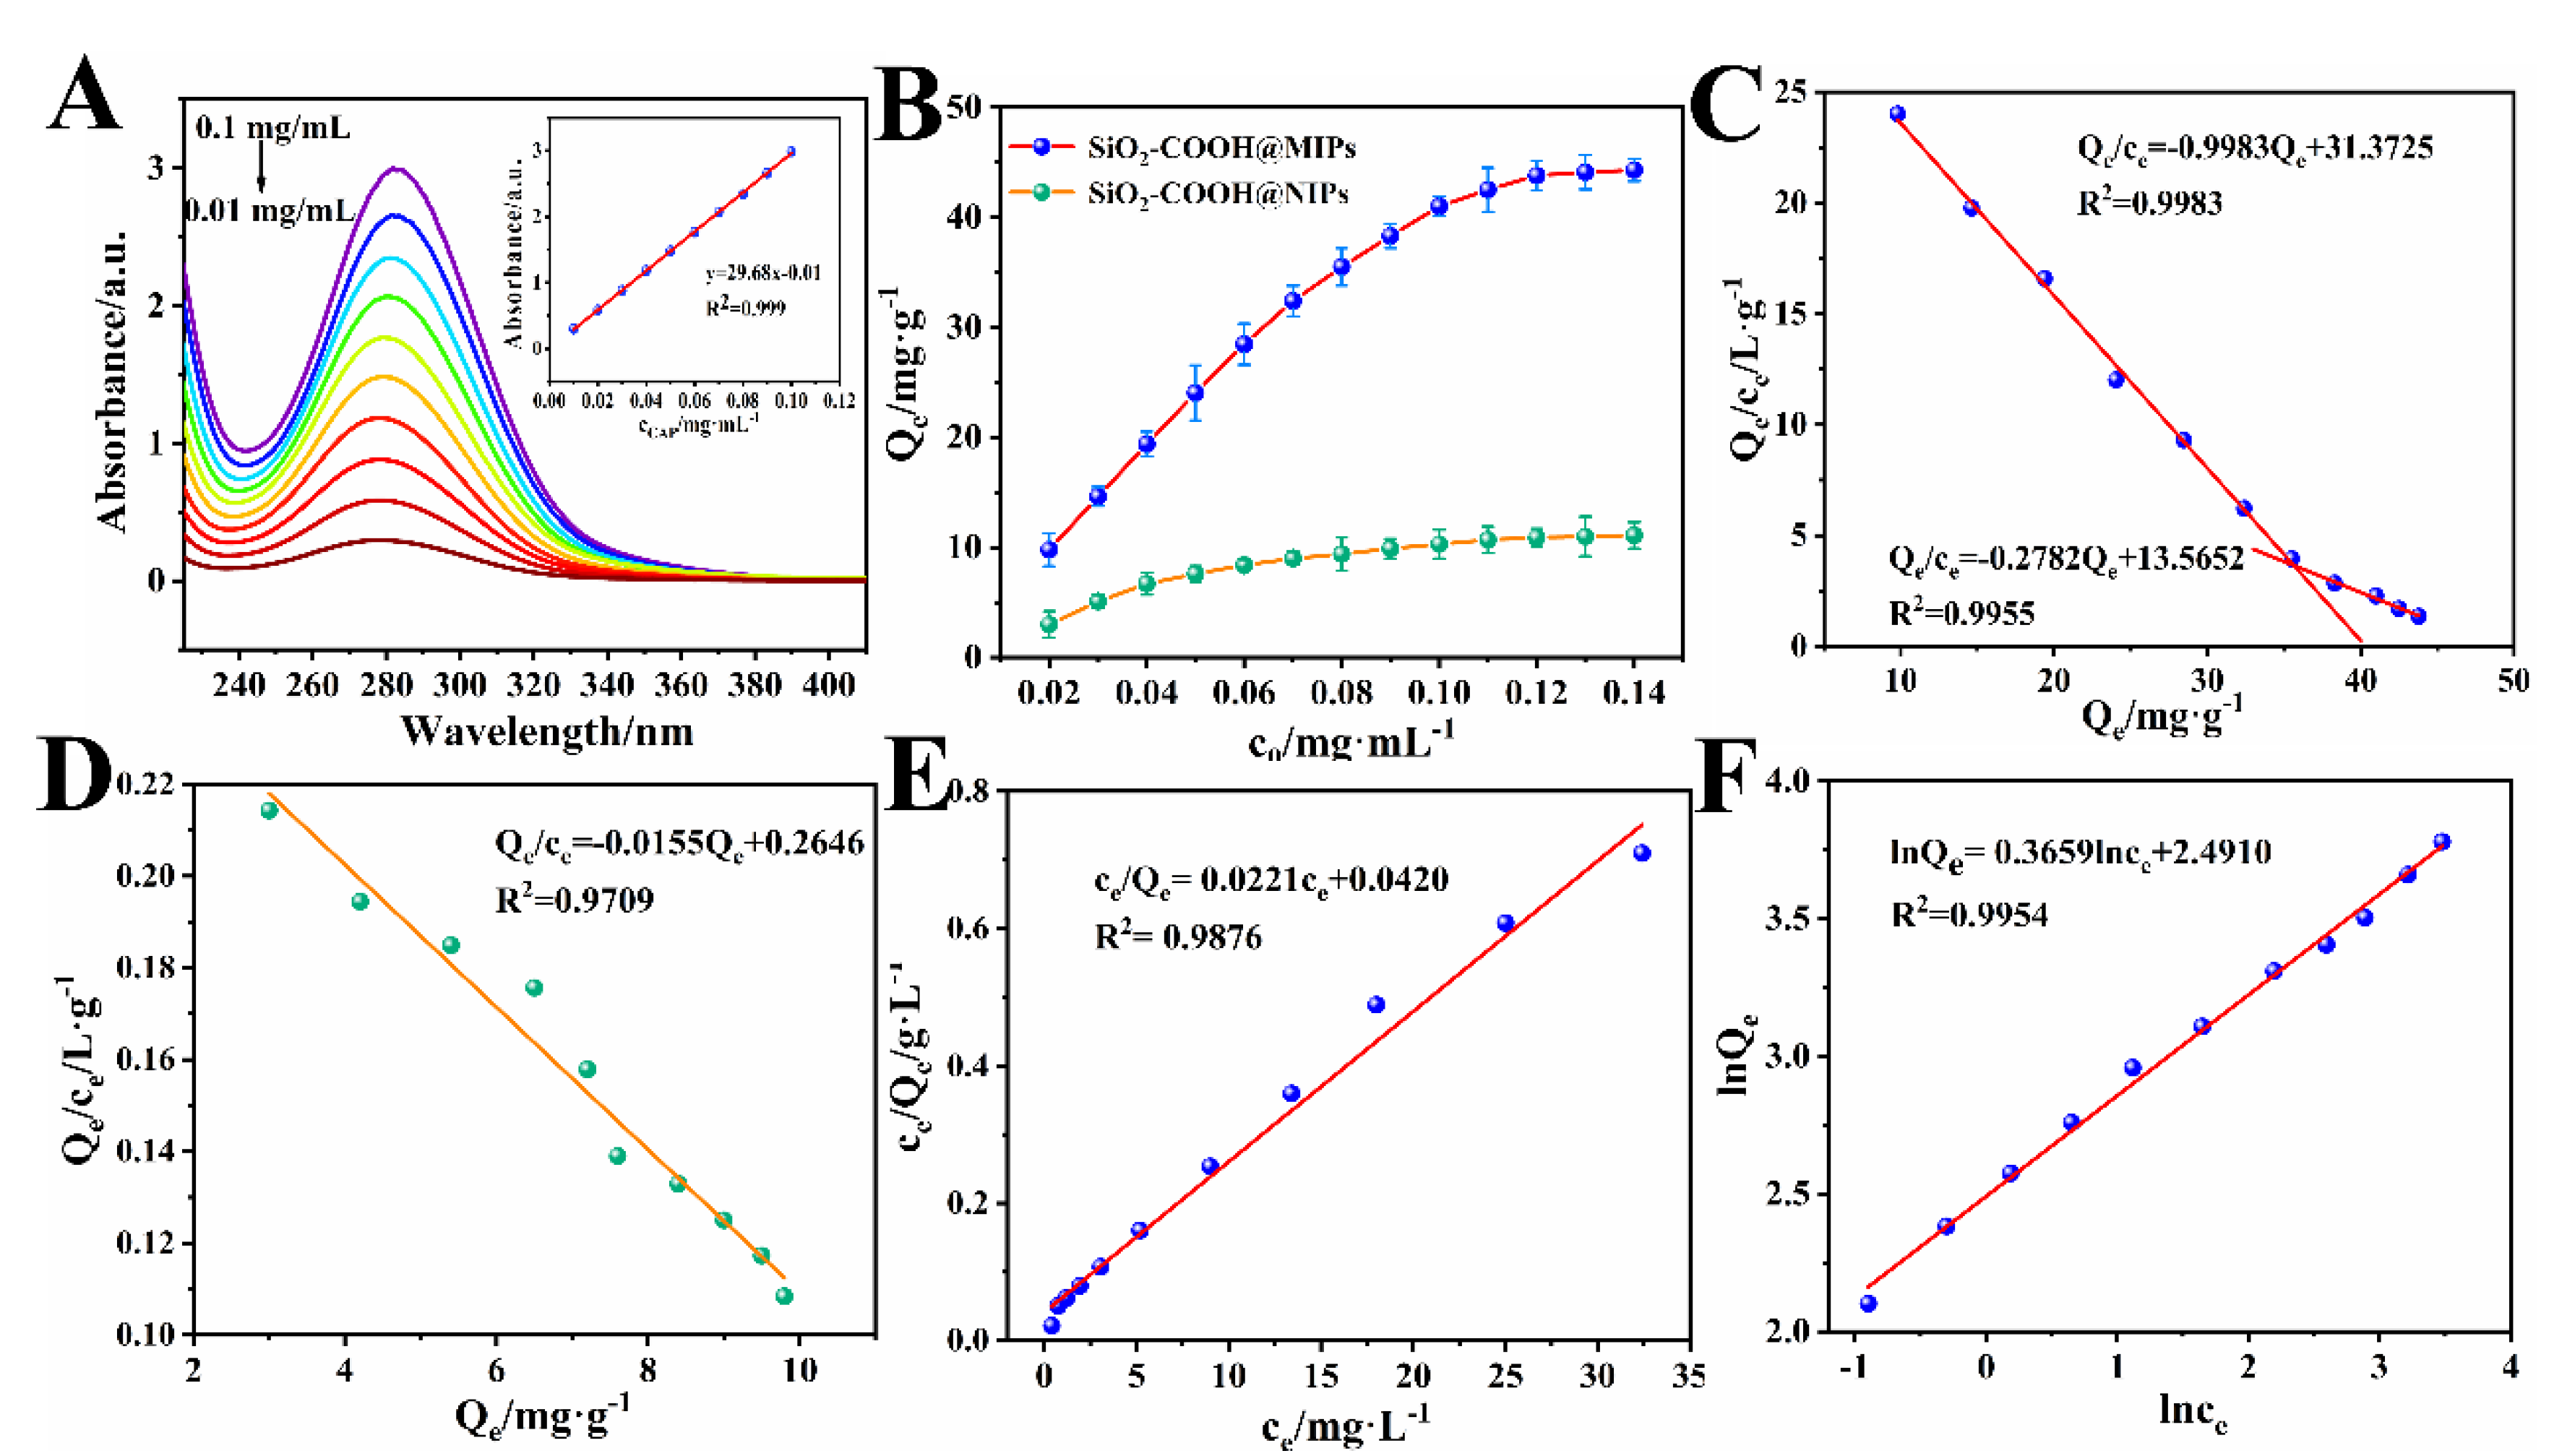
The absorbance values of different concentrations (0.01 mg/mL–0.1 mg/mL) of CAP standard solutions were measured using a UV spectrophotometer, and the results are shown in Figure 4A. Then, taking the concentration of the CAP solution as the abscissa and the absorbance value as the ordinate, the standard curve was drawn (R2 = 0.999), as shown in the illustration in Figure 4A.

3.4.1. Adsorption Isotherm Analysis

The adsorption isotherm curve was one of the important factors for studying the adsorption mechanism, which could reflect the interactions between the template molecules and SiO2-COOH@MIPs during the adsorption process [30]. The equilibrium adsorption capacity (Qe) of SiO2-COOH@MIPs was 44.3 mg/g, which was 3.6 times higher than that of SiO2-COOH@NIPs (12.1 mg/g) (Figure 4B). Compared with SiO2-COOH@NIPs, the high specific binding ability of SiO2-COOH@MIPs to CAP could be attributed to the large number of imprinted cavities in the SiO2-COOH@MIPs, which could specifically recognize CAP.
The Scatchard equation is a commonly used analytical method to analyze the binding properties of MIPs. The Scatchard equation formula is as follows [31]:
Q e C e = Q m Q e K d
where Qm (mg/g) is the maximum adsorption capacity of the binding site and Kd (mg/L) is the dissociation constant of the binding site.
By performing a Scatchard model analysis on the adsorption isotherm, the fitting curve as shown in Figure 4C,D could be obtained, and the data obtained via fitting and calculation are recorded in Table S1. From Figure 4C, we found that there were two fitting curves with different slopes in the Scatchard model analysis of the CAP adsorption by SiO2-COOH@MIPs, indicating that there might be two different binding sites for the adsorption of CAP by SiO2-COOH@MIPs. A further analysis showed that the Kd values of the two fitted curves were 1.286 mg/L and 3.595 mg/L, respectively. It could be concluded that the two binding sites exhibited high affinity and low affinity, respectively. Comparing the Kd value of the SiO2-COOH@NIPs with those of the SiO2-COOH@MIPs, we were surprised to find that the Kd value of the SiO2-COOH@NIPs was much larger than the two Kd values of the SiO2-COOH@MIPs. This phenomenon occurred because the SiO2-COOH@NIPs did not specifically recognize and bind to the imprinted cavity of CAP.
The adsorption behavior of the SiO2-COOH@MIPs was further analyzed using Langmuir and Freundlich isothermal models (Figure 4E,F), where the Langmuir model was suitable for monolayer adsorption and the Freundlich model was suitable for multilayer adsorption. The data obtained from the fitting calculation are recorded in Table S2. The Langmuir formula and the Freundlich formula are as follows [32]:
C e Q e = C e Q m + 1 K L · Q m
ln Q e = ln K F + ln C e n
where KL (L/mg) is the adsorption constant of the Langmuir formula, KF (L/mg) is the adsorption constant of the Freundlich formula, and n is the constant of the adsorption strength of the polymer. According to Table S2, the value of 1/n was 0.366 (0.1 < 1/n < 1) [33]. This indicated that the SiO2-COOH@MIPs had good adsorption capacity for CAP under the optimal experimental conditions. At the same time, the table shows that the correlation value of the Langmuir model (R2 = 0.988) was smaller than that of the Freundlich model (R2 = 0.994), which indicated that the process of CAP adsorption was more suitably described by the Freundlich model, while the adsorption process was dominated by multi-molecular layer adsorption.

3.4.2. Adsorption Kinetics Analysis and Selective Adsorption Analysis

In this study, the adsorption kinetics and selective adsorption of SiO2-COOH@MIPs and SiO2-COOH@NIPs were investigated. The pseudo-first-order kinetics equation and pseudo-second-order kinetics equation were used to fit the adsorption data. The specific data are recorded in Supplementary Material 3.4.2.

3.5. Capability Assessment of the SiO2-COOH@MIPs/SnS2/NiFe-PBA/GCE Sensor

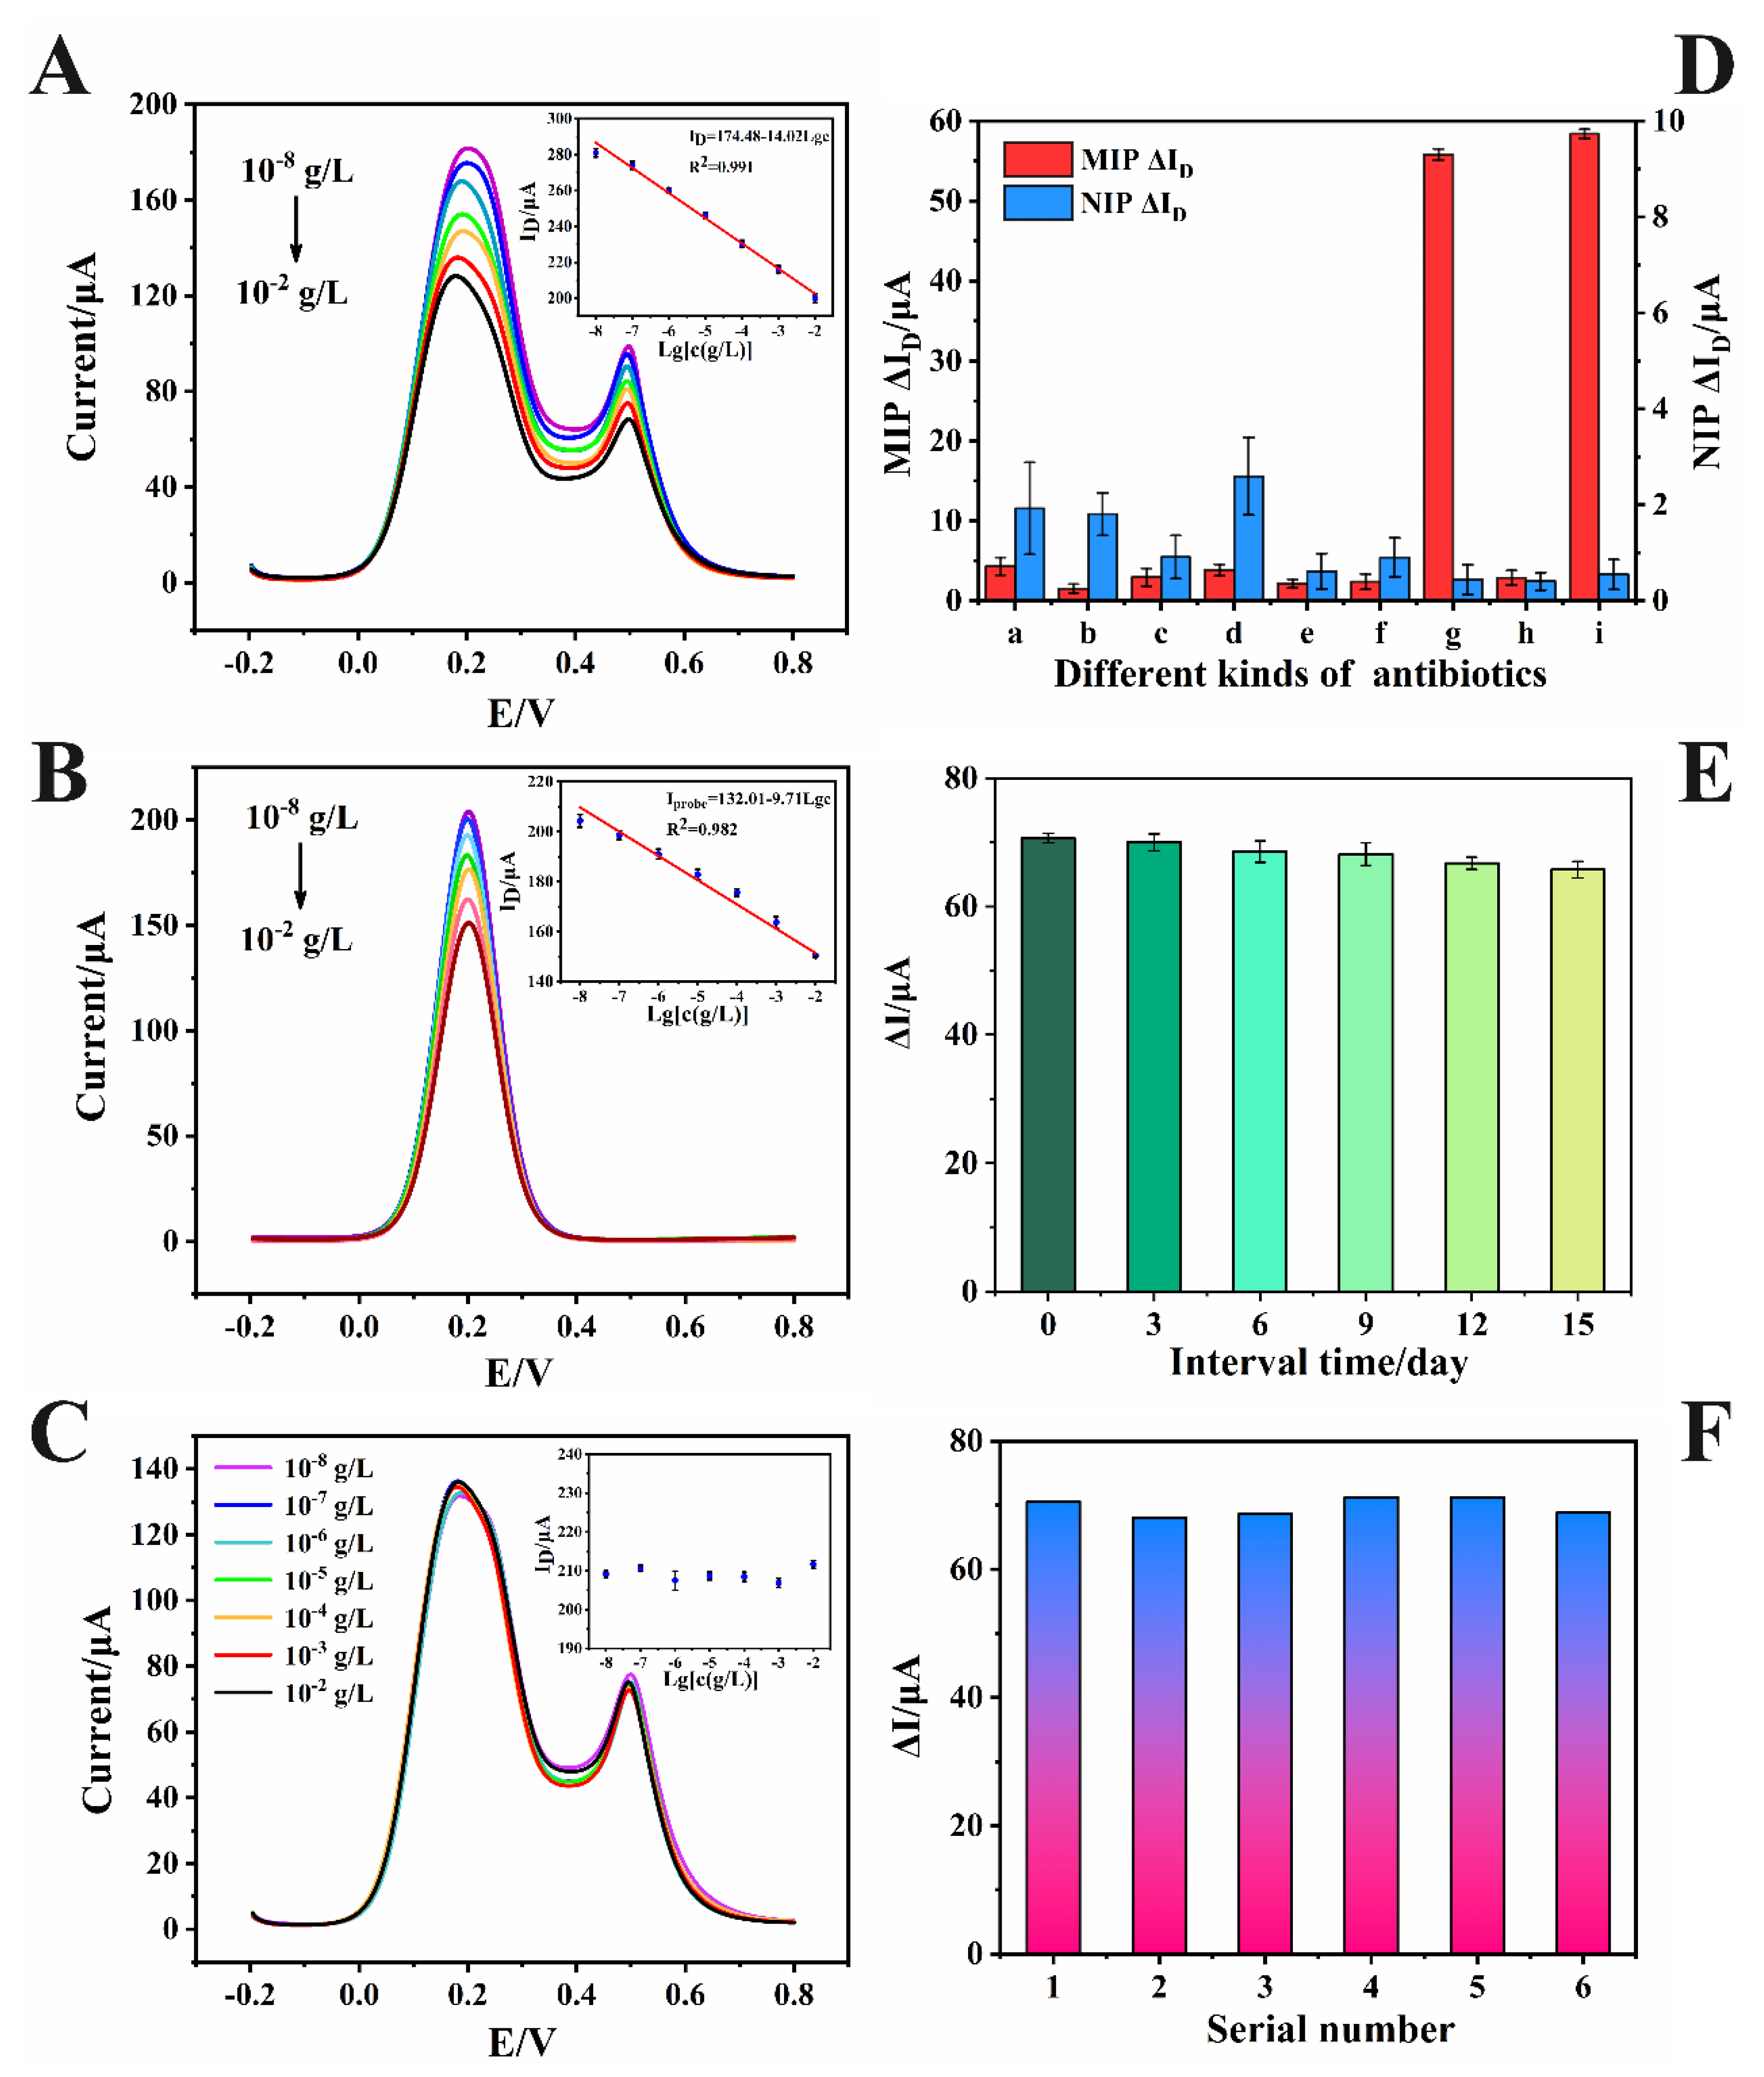
Under the optimum tentative conditions, the sensor was used to detect CAP solutions with different concentrations (10−8 g/L-10−2 g/L) to test the capacity of the sensor to detect and analyze CAP. When the CAP concentration gradually increased, the oxidization peak-to-peak current of the [Fe(CN)6]3−/4− and NiFe-PBA gradually decreased; that is, the ID value gradually decreased (Figure 5A). There was a good linear relationship between the obtained ID value and the logarithm of the CAP concentration. The linear equation was ID = 174.48 − 14.02 Lgc (R2 = 0.991), and the LOD was 3.3 × 10⁻⁹ g/L (S/N = 3).
To demonstrate the merits of dual-signal MIPs sensors, we also prepared single–signal SiO2-COOH@MIPs/SnS2/GCE sensors (Figure 5B) as well as SiO2-COOH@NIPs/SnS2/NiFe-PBA/GCE sensors (Figure 5C) as controls. It can be seen from Figure 5B that the detection range of the single–signal sensor was 10−8 g/L-10−2 g/L, and the linear equation was Iprobe = 132.01 − 9.71 Lgc (R2 = 0.982). By comparing the sensitivity of the single–signal sensor (9.71 μA/(g/L)) and the dual-signal sensor (14.02 μA/(g/L)), the sensitivity of the dual-signal sensor was better, and higher sensitivity detection could be achieved. It can be seen from Figure 5C that after the sensor modified by SiO2-COOH@NIPs was adsorbed in distinct concentrations of CAP solution, no obvious linear relationship between the ID value and CAP concentration was found. Table 1 summarizes some of the published methods used for CAP detection. From the comparison data, it was obvious that the sensor designed in this paper had better detection ability.
To explore the specificity of the SiO2-COOH@MIPs/SnS2/NiFe-PBA/GCE sensor and the SiO2-COOH@NIPs/SnS2/NiFe-PBA/GCE sensor, this study measured the ΔID value in a mixed solution containing 10−4 g/L CAP and 10−3 g/L of interfering substances. As shown in Figure 5D, the ability of the SiO2-COOH@MIPs to specifically recognize the CAP was not affected by the interfering substances, and the ability of the SiO2-COOH@MIPs to recognize the CAP was much higher than the SiO2-COOH@NIPs.
For the purpose of testing the stability of the sensor (Figure 5E), we prepared 24 SiO2-COOH@MIPs/SnS2/NiFe-PBA/GCE electrodes under optimal and identical conditions, divided them into 6 groups, and stored them at 4 °C in a refrigerator. We removed a group of electrodes every three days, put them into the CAP solution at a concentration of 1.0 × 10⁻³ g/L for adsorption, and calculated the ΔID value. After 15 days, the ΔID value of the last set of electrodes remained at 93.91% of the initial value. The above series of experiments fully demonstrated the excellent stability of the sensor. The reproducibility test was carried out using 6 electrodes (Figure 5F). The sensor prepared under optimal conditions was immediately placed in a CAP solution at a concentration of 10−3 g/L for adsorption and the ΔID value was calculated. The relative standard deviation (RSD) of the ΔID value of the 6 GCEs was merely 1.85%, indicating that the sensor had excellent reproducibility.

3.6. Real Sample Analysis

We tested the performance of the constructed sensor in the detection of real samples using the standard additive method. Table 2 shows the detection results of the sensor in the actual sample. The recovery range of the standard addition was 97.7~104.1%, and the RSD was less than 4.68%. The detection results showed that the SiO2-COOH@MIPs/SnS2/NiFe-PBA/GCE sensor had gratifying detection accuracy and convincing reliability in real sample detection, and was a promising CAP detection tool.

4. Conclusions

In this paper, a molecularly imprinted electrochemical sensor based on a dual-signal analysis was constructed for the detection of chloramphenicol in milk. The prepared SiO2-COOH@MIPs/SnS2/NiFe-PBA/GCE using the combination of molecular imprinting technology and electrochemical sensing technology had a wider detection range (10−8 g/L–10−2 g/L), a lower LOD (3.3 × 10⁻⁹ g/L), and higher sensitivity (14.02 μA/(g/L)), with good specificity and reproducibility, satisfactory stability, and excellent recovery (97.7~104.1%) in actual sample detection at the same time. This paper was based on the interactions of multiple nanomaterials to achieve dual-signal high-sensitivity detection, which had certain innovative significance. At the same time, the detection method proposed in this paper also had certain reference significance for the detection of target substances in other fields. However, molecularly imprinted electrochemical sensors also face some challenges, such as the incomplete elution of template molecules and difficulties with single-synthesis methods. Therefore, exploring new elution methods and synthesis methods in future work is still an important research direction.

Supplementary Materials

The following supporting information can be downloaded at: https://www.mdpi.com/article/10.3390/s23031346/s1, Figure S1. (A) SEM image of NiFe-PBA SnS2 nanoflowers. (B) TEM image of SnS2 nanoflowers. (C) EDS mapping image of SnS2 nanoflowers. (D) EDS spectrum of SnS2 nanoflowers. (E) XRD image of SnS2 nanoflowers. XPS spectra of SnS2 nanoflowers: (F) full-survey spectrum, (G) S 2p spectrum and (H) Sn 3d spectrum. Figure S2. Cyclic voltammetry curves of GCE (A) and SnS2/GCE (C) at different scan rates. Linear relationship of the square root of scan rate to oxidation peak current and reduction peak current, respectively (GCE(B); SnS2/GCE (D)). Figure S3. (A) SEM image of SiO2; (B) SEM image of SiO2-COOH@MIPs; (C) TEM image of SiO2; (D) TEM image of SiO2-COOH@MIPs; (E) FTIR images and (F) TGA images of (a) SiO2; (b) SiO2-COOH and (c) SiO2-COOH@MIPs. Figure S4. (A) Adsorption kinetics curves for the adsorption of different concentrations of CAP by SiO2-COOH@MIPs and SiO2-COOH@NIPs. Pseudo-first-order kinetics equation (B), pseudo-second-order kinetics equation (C) of SiO2-COOH@MIPs in the adsorption kinetics test of CAP. (D) Chemical structures of five antibiotics CAP, FFC, OFX, NOR and TAP. (E) Adsorption capacity of SiO2-COOH@MIPs and SiO2-COOH@NIPs for CAP, FFC, OFX, NOR and TAP. Table S1: Scatchard parameters of SiO2-COOH@MIPs and SiO2-COOH@NIPs for the adsorption of CAP. Table S2: Langmuir and Freundlich parameters of SiO2-COOH@MIPs and SiO2-COOH@NIPs for the adsorption of CAP. Table S3: Pseudo-first-order and Pseudo-second-order parameters of SiO2-COOH @MIPs for the adsorption of CAP [27,28,30,41,42,43,44,45,46].

Author Contributions

Conceptualization, L.G. and X.S.; methodology, L.G.; software, L.G.; validation, L.G., M.L. and J.H.; formal analysis, F.L. and Y.Z.; investigation, L.G.; resources, L.G., Y.G. and X.S.; data curation, L.G.; writing—original draft preparation, L.G.; writing—review and editing, L.G., Y.G., Y.Z. and X.S.; visualization, L.G.; supervision, L.G., Y.G. and X.S.; project administration, X.S.; funding acquisition, F.L. and X.S. All authors have read and agreed to the published version of the manuscript.

Funding

This work was supported by the National Natural Science Foundation of China (No. 31772068, 31872909, 32001781) and Shandong Provincial Natural Science Foundation (ZR2020QC249).

Institutional Review Board Statement

Not applicable.

Informed Consent Statement

Not applicable.

Data Availability Statement

Not applicable.

Conflicts of Interest

The authors declare no conflict of interest.

References

  1. Xiong, R.; Wei, X.; Jiang, W.; Lu, Z.; Tang, Q.; Chen, Y.; Liu, Z.; Kang, J.; Ye, Y.; Liu, D. Photodegradation of chloramphenicol in micro-polluted water using a circulatory thin-layer inclined plate reactor. Chemosphere 2022, 291, 132883. [Google Scholar] [CrossRef] [PubMed]
  2. Vinothkumar, V.; Abinaya, M.; Chen, S.-M. Ultrasonic assisted preparation of CoMoO4 nanoparticles modified electrochemical sensor for chloramphenicol determination. J. Solid State Chem. 2021, 302, 122392. [Google Scholar] [CrossRef]
  3. Wu, M.; Jing, T.; Tian, J.; Qi, H.; Shi, D.; Zhao, C.; Chen, T.; Zhao, Z.; Zhang, P.; Guo, Z. Synergistic effect of silver plasmon resonance and p-n heterojunction enhanced photoelectrochemical aptasensing platform for detecting chloramphenicol. Adv. Compos. Hybrid Mater. 2022, 5, 2247–2259. [Google Scholar] [CrossRef]
  4. Wang, Q.; Qi, X.; Chen, H.; Li, J.; Yang, M.; Liu, J.; Sun, K.; Li, Z.; Deng, G. Fluorescence determination of chloramphenicol in milk powder using carbon dot decorated silver metal-organic frameworks. Microchim. Acta 2022, 189, 272. [Google Scholar] [CrossRef] [PubMed]
  5. Buledi, J.A.; Mahar, N.; Mallah, A.; Solangi, A.R.; Palabiyik, I.M.; Qambrani, N.; Karimi, F.; Vasseghian, Y.; Karimi-Maleh, H. Electrochemical quantification of mancozeb through tungsten oxide/reduced graphene oxide nanocomposite: A potential method for environmental remediation. Food Chem. Toxicol. 2022, 161, 112843. [Google Scholar] [CrossRef]
  6. Buledi, J.A.; Shah, Z.-U.-H.; Mallah, A.; Solangi, A.R. Current Perspective and Developments in Electrochemical Sensors Modified with Nanomaterials for Environmental and Pharmaceutical Analysis. Curr. Anal. Chem. 2022, 18, 102–115. [Google Scholar] [CrossRef]
  7. Buledi, J.A.; Solangi, A.R.; Hyder, A.; Khand, N.H.; Memon, S.A.; Mallah, A.; Mahar, N.; Dragoi, E.N.; Show, P.; Behzadpour, M.; et al. Selective oxidation of amaranth dye in soft drinks through tin oxide decorated reduced graphene oxide nanocomposite based electrochemical sensor. Food Chem. Toxicol. 2022, 165, 113177. [Google Scholar] [CrossRef]
  8. Zhou, S.; Guo, L.; Xu, X.; Song, S.; Liu, L.; Kuang, H.; Zhu, Y.; Xu, L.; Xu, C. Ultrasensitive paper sensor for simultaneous detection of alpha-amanitin and beta-amanitin by the production of monoclonal antibodies. Food Chem. 2022, 396, 133660. [Google Scholar] [CrossRef]
  9. Peng, J.; Liu, L.; Xu, L.; Song, S.; Kuang, H.; Cui, G.; Xu, C. Gold nanoparticle-based paper sensor for ultrasensitive and multiple detection of 32 (fluoro)quinolones by one monoclonal antibody. Nano Res. 2016, 10, 108–120. [Google Scholar] [CrossRef]
  10. Liu, N.; Liu, R.; Zhang, J. CRISPR-Cas12a-mediated label-free electrochemical aptamer-based sensor for SARS-CoV-2 antigen detection. Bioelectrochemistry 2022, 146, 108105. [Google Scholar] [CrossRef]
  11. Yue, F.; Li, F.; Kong, Q.; Guo, Y.; Sun, X. Recent advances in aptamer-based sensors for aminoglycoside antibiotics detection and their applications. Sci. Total Environ. 2021, 762, 143129. [Google Scholar] [CrossRef]
  12. Wang, G.; Liu, J.; Yue, F.; Shen, Z.; Xu, D.; Fang, H.; Chen, W.; Wang, Z.; Li, P.; Guo, Y.; et al. Dual enzyme electrochemiluminescence sensor based on in situ synthesis of ZIF-67@AgNPs for the detection of IMP in fresh meat. LWT 2022, 165, 113658. [Google Scholar] [CrossRef]
  13. Yang, H.; Song, H.; Suo, Z.; Li, F.; Jin, Q.; Zhu, X.; Chen, Q. A molecularly imprinted electrochemical sensor based on surface imprinted polymerization and boric acid affinity for selective and sensitive detection of P-glycoproteins. Anal. Chim. Acta 2022, 1207, 339797. [Google Scholar] [CrossRef]
  14. Liang, Y.; Wang, H.; Xu, Y.; Pan, H.; Guo, K.; Zhang, Y.; Chen, Y.; Liu, D.; Zhang, Y.; Yao, C.; et al. A novel molecularly imprinted polymer composite based on polyaniline nanoparticles as sensitive sensors for parathion detection in the field. Food Control 2022, 133, 108638. [Google Scholar] [CrossRef]
  15. Mostafiz, B.; Bigdeli, S.A.; Banan, K.; Afsharara, H.; Hatamabadi, D.; Mousavi, P.; Hussain, C.M.; Keçili, R.; Ghorbani-Bidkorbeh, F. Molecularly imprinted polymer-carbon paste electrode (MIP-CPE)-based sensors for the sensitive detection of organic and inorganic environmental pollutants: A review. Trends Environ. Anal. 2021, 32, e00144. [Google Scholar] [CrossRef]
  16. Ramanavicius, S.; Ramanavicius, A. Development of molecularly imprinted polymer based phase boundaries for sensors design (review). Adv. Colloid Interface Sci. 2022, 305, 102693. [Google Scholar] [CrossRef]
  17. Soomro, A.N.; Shaikh, H.; Malik, M.I.; Buledi, J.A.; Qazi, S.; Solangi, A. Fluorene intercalated graphene oxide based CoQ10 imprinted polymer composite as a selective platform for electrochemical sensing of CoQ10. RSC Adv. 2022, 12, 31639–31649. [Google Scholar] [CrossRef]
  18. Hu, X.; Tang, Y.; Xia, Y.; Liu, Y.; Zhao, F.; Zeng, B. Antifouling ionic liquid doped molecularly imprinted polymer-based ratiometric electrochemical sensor for highly stable and selective detection of zearalenone. Anal. Chim. Acta 2022, 1210, 339884. [Google Scholar] [CrossRef]
  19. Taqvi, S.I.H.; Solangi, A.R.; Buledi, J.A.; Khand, N.H.; Junejo, B.; Memon, A.F.; Ameen, S.; Bhatti, A.; Show, P.L.; Vasseghian, Y.; et al. Plant extract-based green fabrication of nickel ferrite (NiFe(2)O(4)) nanoparticles: An operative platform for non-enzymatic determination of pentachlorophenol. Chemosphere 2022, 294, 133760. [Google Scholar] [CrossRef]
  20. Memon, A.F.; Ameen, S.; Khand, N.H.; Qambrani, N.; Buledi, J.A.; Junejo, B.; Solangi, A.R.; Taqvi, S.I.H.; Dragoi, E.N.; Zare, N.; et al. Electrochemical monitoring of bisphenol-s through nanostructured tin oxide/Nafion/GCE: A solution to environmental pollution. Chemosphere 2022, 303, 135170. [Google Scholar] [CrossRef]
  21. Qambrani, N.; Buledi, J.A.; Khand, N.H.; Solangi, A.R.; Ameen, S.; Jalbani, N.S.; Khatoon, A.; Taher, M.A.; Moghadam, F.H.; Shojaei, M.; et al. Facile Synthesis of NiO/ZnO nanocomposite as an effective platform for electrochemical determination of carbamazepine. Chemosphere 2022, 303, 135270. [Google Scholar] [CrossRef] [PubMed]
  22. Guari, Y.; Cahu, M.; Félix, G.; Sene, S.; Long, J.; Chopineau, J.; Devoisselle, J.-M.; Larionova, J. Nanoheterostructures based on nanosized Prussian blue and its Analogues: Design, properties and applications. Coord. Chem. Rev. 2022, 461, 214497. [Google Scholar] [CrossRef]
  23. Chen, J.; Wei, L.; Mahmood, A.; Pei, Z.; Zhou, Z.; Chen, X.; Chen, Y. Prussian blue, its analogues and their derived materials for electrochemical energy storage and conversion. Energy Storage Mater. 2020, 25, 585–612. [Google Scholar] [CrossRef]
  24. Xiong, D.; Lu, C.; Chen, C.; Wang, J.; Kong, Y.; Liu, T.; Ying, S.; Yi, F.-Y. CoFeP nanocube-arrays based on Prussian blue analogues for accelerated oxygen evolution electrocatalysis. J. Power Sources 2022, 520, 230884. [Google Scholar] [CrossRef]
  25. Meng, X.; Bi, M.; Xiao, Q.; Gao, W. Ultrasensitive gas sensor based on Pd/SnS2/SnO2 nanocomposites for rapid detection of H2. Sensors Actuat. B-Chem. 2022, 359, 131612. [Google Scholar] [CrossRef]
  26. Sharma, K.; Patial, S.; Singh, P.; Khan, A.A.P.; Saini, V.; Nadda, A.K.; Hussain, C.M.; Nguyen, V.-H.; Nguyen, C.C.; Hac Nguyen, T.B.; et al. Strategies and perspectives of tailored SnS2 photocatalyst for solar driven energy applications. Sol. Energy 2022, 231, 546–565. [Google Scholar] [CrossRef]
  27. Zhu, Q.; Gu, D.; Liu, Z.; Huang, B.; Li, X. Au-modified 3D SnS2 nano-flowers for low-temperature NO2 sensors. Sensors Actuat. B-Chem. 2021, 349, 130775. [Google Scholar] [CrossRef]
  28. Niu, Q.; Bao, C.; Cao, X.; Liu, C.; Wang, H.; Lu, W. Ni-Fe PBA hollow nanocubes as efficient electrode materials for highly sensitive detection of guanine and hydrogen peroxide in human whole saliva. Biosens. Bioelectron. 2019, 141, 111445. [Google Scholar] [CrossRef]
  29. Qin, M.; Ren, W.; Jiang, R.; Li, Q.; Yao, X.; Wang, S.; You, Y.; Mai, L. Highly Crystallized Prussian Blue with Enhanced Kinetics for Highly Efficient Sodium Storage. ACS Appl. Mater. Interfaces 2021, 13, 3999–4007. [Google Scholar] [CrossRef]
  30. Chen, Q.; Liu, X.; Yang, H.; Zhang, S.; Song, H.; Zhu, X. Preparation and evaluation of magnetic graphene oxide molecularly imprinted polymers (MIPs-GO-Fe3O4@SiO2) for the analysis and separation of tripterine. React. Funct. Polym. 2021, 169, 105055. [Google Scholar] [CrossRef]
  31. He, Y.; Tan, S.; Abd Ei-Aty, A.M.; Hacimuftuoglu, A.; She, Y. Magnetic molecularly imprinted polymers for the detection of aminopyralid in milk using dispersive solid-phase extraction. RSC Adv. 2019, 9, 29998–30006. [Google Scholar] [CrossRef] [Green Version]
  32. Garcia, S.M.; Wong, A.; Khan, S.; Sotomayor, M. A simple, sensitive and efficient electrochemical platform based on carbon paste electrode modified with Fe3O4@MIP and graphene oxide for folic acid determination in different matrices. Talanta 2021, 229, 122258. [Google Scholar] [CrossRef]
  33. Li, H.; Lin, Y.; Guan, W.; Chang, J.; Xu, L.; Guo, J.; Wei, G. Biosorption of Zn(II) by live and dead cells of Streptomyces ciscaucasicus strain CCNWHX 72-14. J. Hazard. Mater. 2010, 179, 151–159. [Google Scholar] [CrossRef]
  34. Wei, L.; Jiao, F.; Wang, Z.; Wu, L.; Dong, D.; Chen, Y. Enzyme-modulated photothermal immunoassay of chloramphenicol residues in milk and egg using a self-calibrated thermal imager. Food Chem. 2022, 392, 133232. [Google Scholar] [CrossRef]
  35. Yao, T.; Yao, S. Magnetic ionic liquid aqueous two-phase system coupled with high performance liquid chromatography: A rapid approach for determination of chloramphenicol in water environment. J. Chromatogr. A 2017, 1481, 12–22. [Google Scholar] [CrossRef] [Green Version]
  36. Kawano, S.-I.; Hao, H.-Y.; Hashi, Y.; Lin, J.-M. Analysis of chloramphenicol in honey by on-line pretreatment liquid chromatography–tandem mass spectrometry. Chin. Chem. Lett. 2015, 26, 36–38. [Google Scholar] [CrossRef]
  37. Chang, H.; Lv, J.; Zhang, H.; Zhang, B.; Wei, W.; Qiao, Y. Photoresponsive colorimetric immunoassay based on chitosan modified AgI/TiO2 heterojunction for highly sensitive chloramphenicol detection. Biosens. Bioelectron. 2017, 87, 579–586. [Google Scholar] [CrossRef]
  38. Ma, P.; Guo, H.; Duan, N.; Ma, X.; Yue, L.; Gu, Q.; Wang, Z. Label free structure-switching fluorescence polarization detection of chloramphenicol with truncated aptamer. Talanta 2021, 230, 122349. [Google Scholar] [CrossRef]
  39. He, Z.-J.; Kang, T.-F.; Lu, L.-P.; Cheng, S.-Y. An electrochemiluminescence aptamer sensor for chloramphenicol based on GO-QDs nanocomposites and enzyme-linked aptamers. Electroanal. Chem. 2020, 860, 113870. [Google Scholar] [CrossRef]
  40. Geng, L.; Huang, J.; Zhai, H.; Shen, Z.; Han, J.; Yu, Y.; Fang, H.; Li, F.; Sun, X.; Guo, Y. Molecularly imprinted electrochemical sensor based on multi-walled carbon nanotubes for specific recognition and determination of chloramphenicol in milk. Microchem. J. 2022, 182, 107887. [Google Scholar] [CrossRef]
  41. Fan, J.-P.; Xu, X.-K.; Xu, R.; Zhang, X.-H.; Zhu, J.-H. Preparation and characterization of molecular imprinted polymer functionalized with core/shell magnetic particles (Fe3O4 @SiO2@MIP) for the simultaneous recognition and enrichment of four taxoids in Taxus × media. Chem Eng. J. 2015, 279, 567–577. [Google Scholar] [CrossRef]
  42. Yue, F.; Li, H.; Kong, Q.; Liu, J.; Wang, G.; Li, F.; Yang, Q.; Chen, W.; Guo, Y.; Sun, X. Selection of broad-spectrum aptamer and its application in fabrication of aptasensor for detection of aminoglycoside antibiotics residues in milk. Sensor Actuat B-Chem. 2022, 351, 130959. [Google Scholar] [CrossRef]
  43. Xu, Y.; Huang, T.; Wang, S.; Meng, M.; Yan, Y. SiO2-coated molecularly imprinted sensor based on Si quantum dots for selective detection of catechol in river water. J. Environ. Chem. Eng. 2022, 10, 106850. [Google Scholar] [CrossRef]
  44. Liu, Y.; Huang, Z.; He, W.; Chen, M.; Tu, W.; Zhu, M.; Gan, D.; Liu, S. Multifunctional stable PDA/RGO/MOFs&SiO2-COOH membrane with excellent flux and anti-fouling performance for the separation of organic dye and oil/water. Surf. Interfaces 2022, 33, 102183. [Google Scholar]
  45. Sun, J.; Guo, W.; Ji, J.; Li, Z.; Yuan, X.; Pi, F.; Zhang, Y.; Sun, X. Removal of patulin in apple juice based on novel magnetic molecularly imprinted adsorbent Fe3O4@SiO2@CS-GO@MIP. Lwt 2020, 118, 108854. [Google Scholar] [CrossRef]
  46. Hao, Y.; Gao, Y.; Song, H.; Niu, Y.; Chen, X.; Liu, X.; Gao, R.; Wang, S. Fabrication of metal coordination-synergistic magnetic imprinted microspheres based on ligand-free Fe3O4-Cu for specific recognition of bovine hemoglobin. Talanta 2021, 233, 122496. [Google Scholar] [CrossRef]
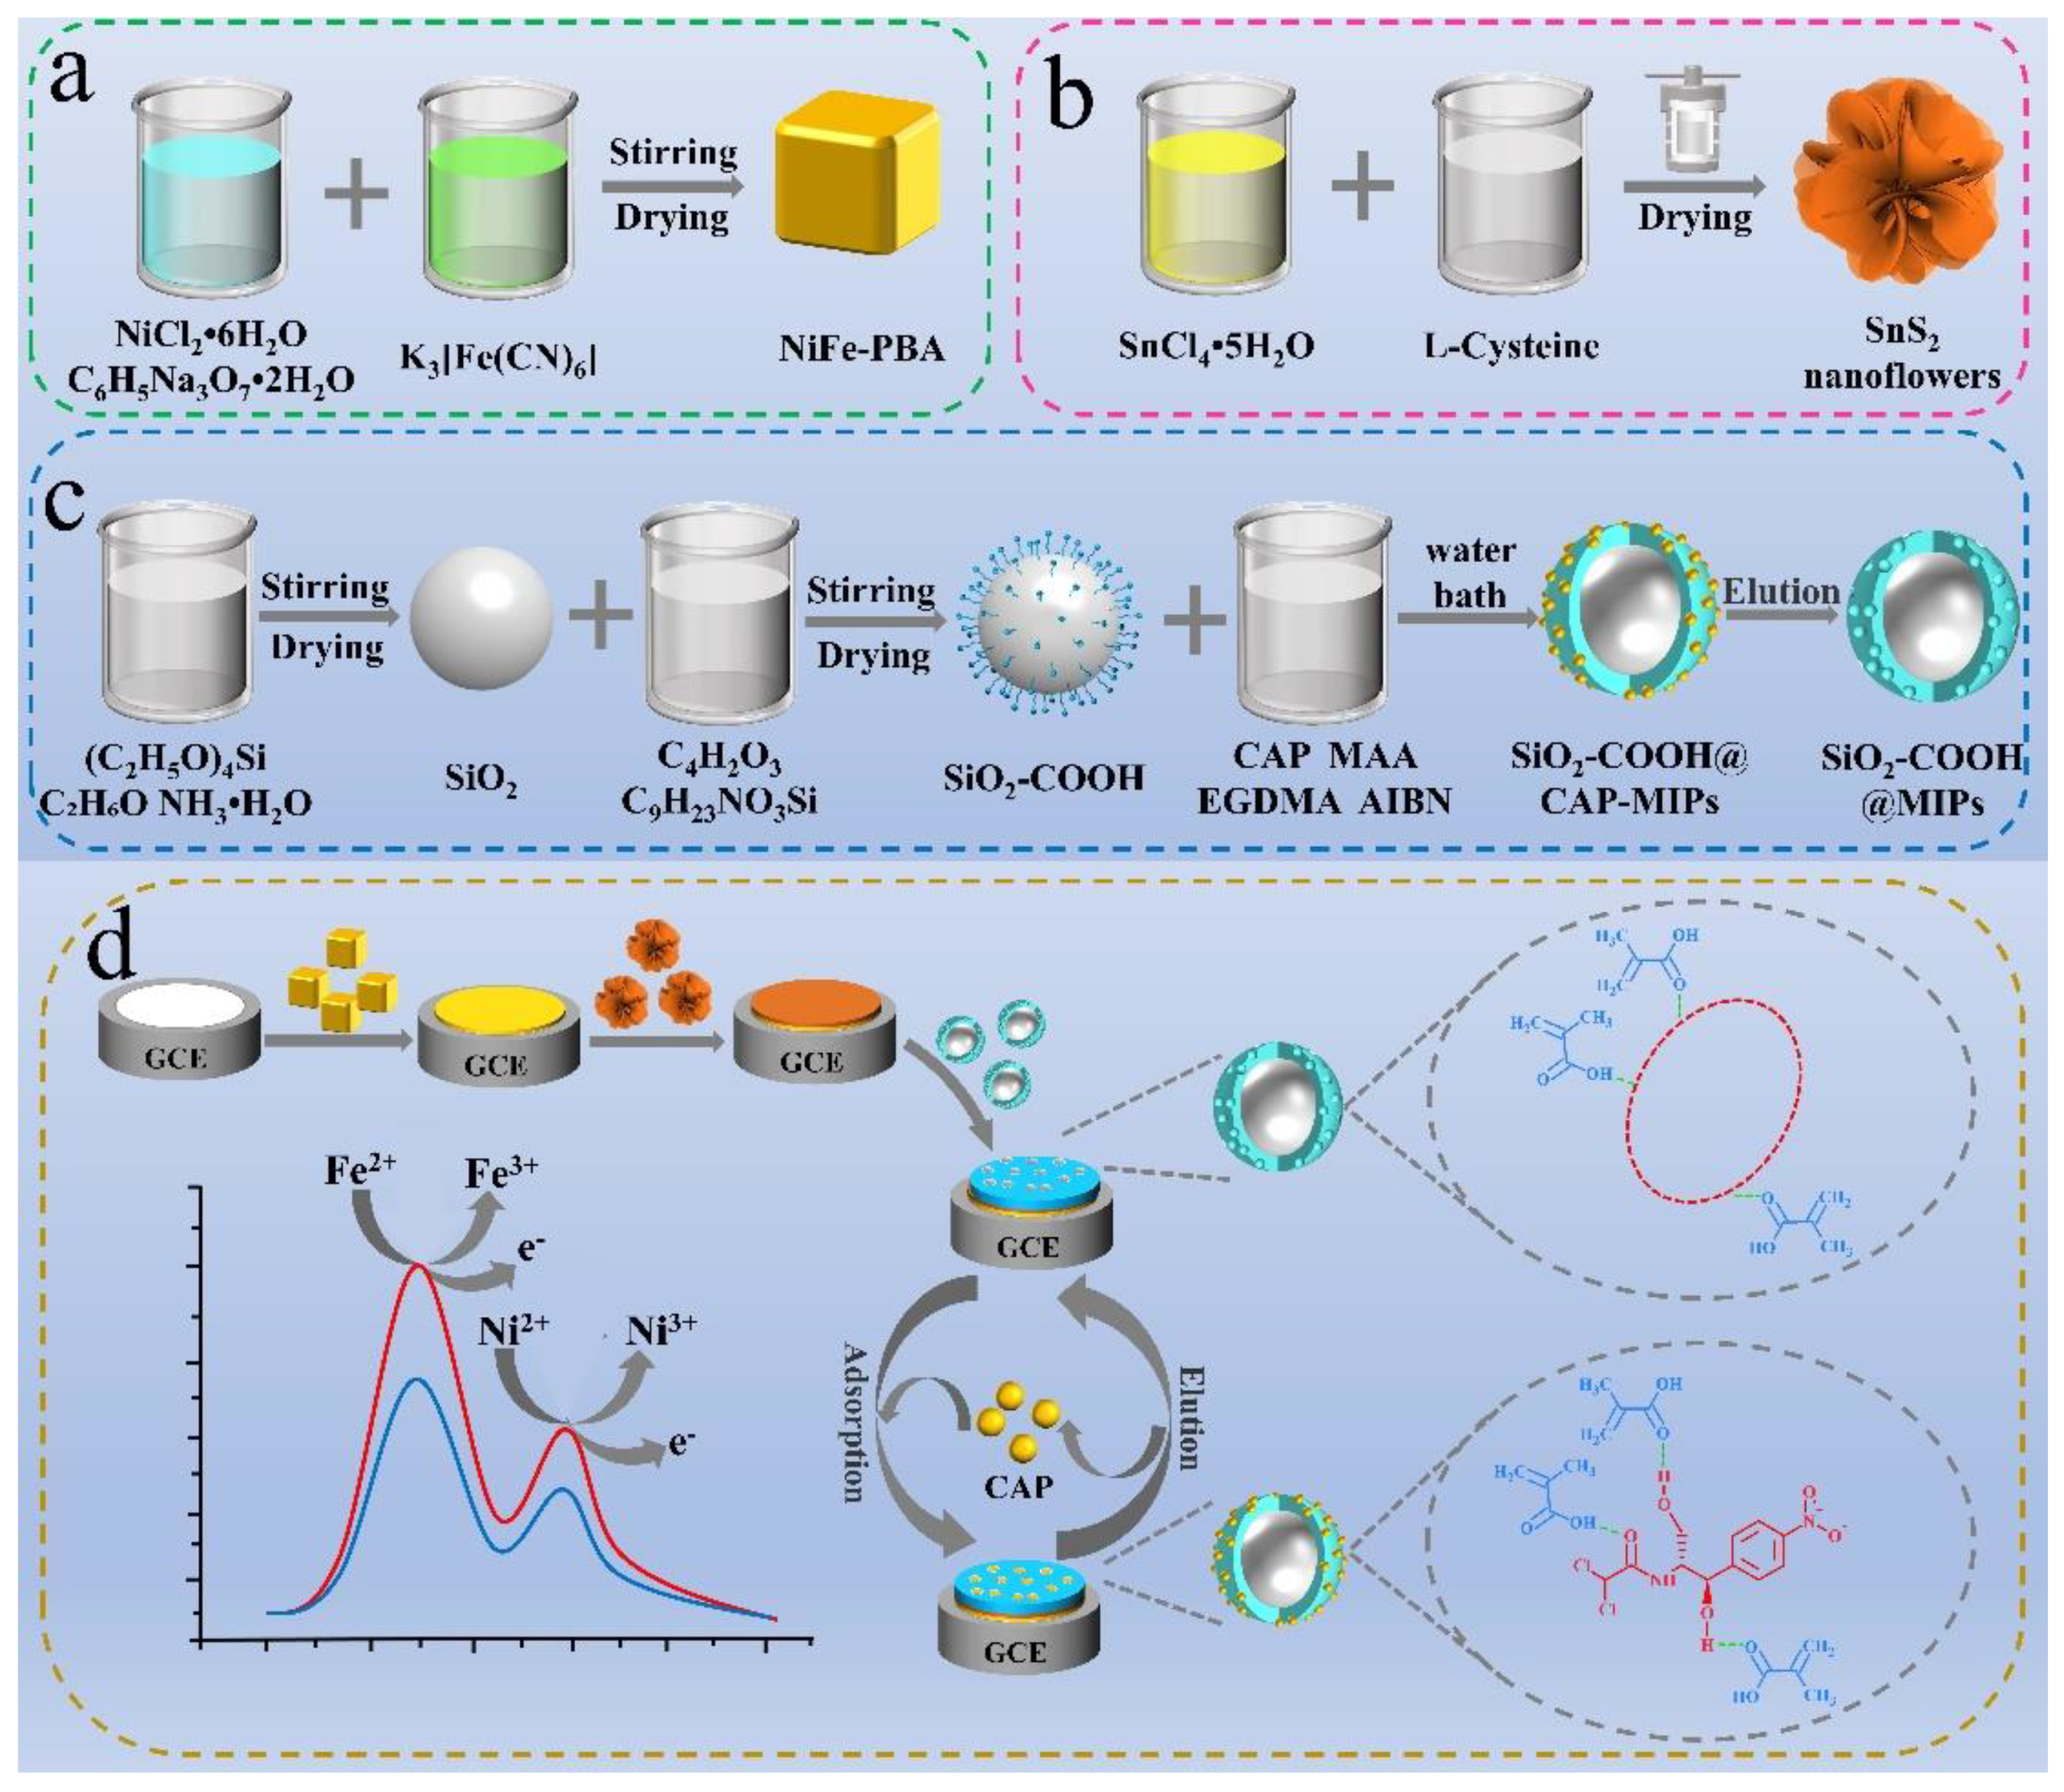
Scheme 1. Preparation procedure for (a) NiFe-PBA, (b) SnS2 nanoflowers, and (c) SiO2-COOH@MIPs. (d) Schematic diagram of the novel dual-signal SiO2-COOH@MIPs electrochemical sensor preparation process.
Sensors 23 01346 sch001
Figure 1. (A) SEM image, (B) TEM image, and (C) XRD image of NiFe-PBA. XPS spectra of NiFe-PBA: (D) full spectrum of XPS detection of NiFe-PBA; (E) Ni 2p spectrum, (F) Fe 2p spectrum, (G) C 1s spectrum, and (H) N 1s spectrum from the XPS detection of NiFe-PBA.
Sensors 23 01346 g001
Figure 2. (A) DPV, (B) CV, and (C) EIS curves of electrode surfaces modified with different materials. Electrochemical measurements were performed in solutions containing 5 mmol/L[Fe(CN)6]3−/4− and 0.1 mol/L KCl.
Sensors 23 01346 g002
Figure 3. Discovering the best experimental parameters: (A) MCAP/MMAA ratio; (B) MCAP/MEGDMA ratio; (C) adsorption time; (D) elution times (illustration: the UV absorption spectrum of CAP in eluate after elution times of t = 1, 2, 3, 4 and 5; n = 3).
Sensors 23 01346 g003
Figure 4. (A) UV absorbance curves of CAP solutions with different concentrations (0.01 mg/mL–0.1 mg/mL) (illustration: the standard curve obtained by fitting different CAP concentrations with their corresponding absorbance values). (B) Adsorption isotherms for the adsorption of different concentrations of CAP by SiO2-COOH@MIPs and SiO2-COOH@NIPs. Scatchard model fitting curves of adsorption isotherms of SiO2-COOH@MIPs (C) and SiO2-COOH@NIPs (D). The adsorption isotherm fitting curves of SiO2-COOH@MIPs (Langmuir adsorption model (E); Freundlich adsorption model (F)) (n = 3).
Sensors 23 01346 g004
Figure 5. (A) DPV response for SiO2-COOH@MIPs/SnS2/NiFe-PBA/GCE in solutions containing 5 mmol/L [Fe(CN)6]3−/4− and 0.1 mol/L KCl relative to various concentrations of CAP from 10−8 g/L to 10−2 g/L. Illustration: Plot of linear calibration with R2 = 0.991. (B) DPV response for SiO2-COOH@MIPs/SnS2/GCE in solutions containing 5 mmol/L [Fe(CN)6]3−/4− and 0.1 mol/L KCl relative to various concentrations of CAP from 10−8 g/L to 10−2 g/L. Illustration: Plot of linear calibration with R2 = 0.982. (C) DPV response for SiO2-COOH@NIPs/SnS2/NiFe-PBA/GCE in solutions containing 5 mmol/L [Fe(CN)6]3−/4− and 0.1 mol/L KCl relative to various concentrations of CAP from 10−8 g/L to 10−2 g/L. Illustration: There was no linear relationship. The SiO2-COOH@MIPs/SnS2/NiFe-PBA/GCE plots of (D) specificity ((a) florfenicol; (b) ofloxacin; (c) norfloxacin; (d) thiamphenicol; (e) kanamycin; (f) tetracycline; (g) chloramphenicol; (h) a–f; (i) a–g.), (E) stability, and (F) reproducibility (n = 3).
Sensors 23 01346 g005
Table 1. Comparative study of this work with previously reported sensors for the detection of CAP.
MethodLinear Range
(ng/mL)
LOD
(ng/mL)
Reference
ELISA1.0 × 10−2–1.0 × 1029.0 × 10−3[34]
HPLC12.3–2.2 × 1030.14[35]
HPLC-MSIMS0.02–52.0 × 10⁻²[36]
Colorimetry8.5 × 10−3–4.18.5 × 10−3[37]
Fluorescence3.2 × 10−2–3.21.9 × 10−2[38]
ECL-enzyme-Apt3.2 × 10−4–0.323.2 × 10−4[39]
Electrochemistry-MIPs0.1–1.0 × 1033.3 × 10−2[40]
Electrochemistry-MIPs1.0 × 10−2–1.0 × 1043.3 × 10−3This work
Table 2. Recovery rates and RSD with different concentrations of CAP in milk samples (n = 3).
SampleSpiked
(g/L)
Detected
(g/L)
Recovery
(%)
RSD
(%)
Milk00--
1.0 × 10−70.981 × 10−798.12.19
1.0 × 10−60.977 × 10−697.72.73
1.0 × 10−51.041 × 10−5104.13.44
1.0 × 10−40.992 × 10−499.24.68
1.0 × 10−31.027 × 10−3102.74.31
Disclaimer/Publisher’s Note: The statements, opinions and data contained in all publications are solely those of the individual author(s) and contributor(s) and not of MDPI and/or the editor(s). MDPI and/or the editor(s) disclaim responsibility for any injury to people or property resulting from any ideas, methods, instructions or products referred to in the content.