

Comparison of Individual Sensors in the Electronic Nose for Stress Detection in Forest Stands

 and
and
Abstract
:1. Introduction
- Is the specific substance that identifies stressed trees detectable by the Sniffer4D electronic nose?
- What sensors will correlate with distance from stressed trees?
- Can stress be detected by these sensors even above treetops using UAVs where the concentration is hypothetically lower?
2. Materials and Methods
2.1. Study Site
2.2. Data Collection
2.3. Electronic Nose
2.4. Analysis of Sensors Data
3. Results
4. Discussion
5. Conclusions
Author Contributions
Funding
Institutional Review Board Statement
Informed Consent Statement
Data Availability Statement
Conflicts of Interest
Appendix A


References
- Seidl, R.; Thom, D.; Kautz, M.; Martin-Benito, D.; Peltoniemi, M.; Vacchiano, G.; Wild, J.; Ascoli, D.; Petr, M.; Honkaniemi, J.; et al. Forest Disturbances under Climate Change. Nat. Clim. Chang. 2017, 7, 395–402. [Google Scholar] [CrossRef]
- Fearnside, P.M. Deforestation Soars in the Amazon. Nature 2015, 521, 423. [Google Scholar] [CrossRef]
- Yuan, K.; Zhu, Q.; Zheng, S.; Zhao, L.; Chen, M.; Riley, W.J.; Cai, X.; Ma, H.; Li, F.; Wu, H.; et al. Deforestation Reshapes Land-Surface Energy-Flux Partitioning. Environ. Res. Lett. 2021, 16, 024014. [Google Scholar] [CrossRef]
- Bowman, D.M.J.S.; Balch, J.K.; Artaxo, P.; Bond, W.J.; Carlson, J.M.; Cochrane, M.A.; D’Antonio, C.M.; DeFries, R.S.; Doyle, J.C.; Harrison, S.P.; et al. Fire in the Earth System. Science 2009, 324, 481–484. [Google Scholar] [CrossRef] [PubMed]
- Zhu, Q.; Li, F.; Riley, W.J.; Xu, L.; Zhao, L.; Yuan, K.; Wu, H.; Gong, J.; Randerson, J. Building a Machine Learning Surrogate Model for Wildfire Activities within a Global Earth System Model. Geosci. Model Dev. 2022, 15, 1899–1911. [Google Scholar] [CrossRef]
- Kautz, M.; Meddens, A.J.H.; Hall, R.J.; Arneth, A. Biotic Disturbances in Northern Hemisphere Forests—A Synthesis of Recent Data, Uncertainties and Implications for Forest Monitoring and Modelling: Biotic Disturbances in Northern Hemisphere Forests. Glob. Ecol. Biogeogr. 2017, 26, 533–552. [Google Scholar] [CrossRef]
- Seidl, R.; Donato, D.C.; Raffa, K.F.; Turner, M.G. Spatial Variability in Tree Regeneration after Wildfire Delays and Dampens Future Bark Beetle Outbreaks. Proc. Natl. Acad. Sci. USA 2016, 113, 13075–13080. [Google Scholar] [CrossRef]
- Stadelmann, G.; Bugmann, H.; Wermelinger, B.; Bigler, C. Spatial Interactions between Storm Damage and Subsequent Infestations by the European Spruce Bark Beetle. For. Ecol. Manag. 2014, 318, 167–174. [Google Scholar] [CrossRef]
- Chinellato, F.; Faccoli, M.; Marini, L.; Battisti, A. Distribution of Norway Spruce Bark and Wood-Boring Beetles along Alpine Elevational Gradients: Norway Spruce Bark and Wood Beetles along Altitude. Agric. For. Entomol. 2014, 16, 111–118. [Google Scholar] [CrossRef]
- Senf, C.; Seidl, R.; Hostert, P. Remote Sensing of Forest Insect Disturbances: Current State and Future Directions. Int. J. Appl. Earth Obs. Geoinf. 2017, 60, 49–60. [Google Scholar] [CrossRef] [PubMed] [Green Version]
- Meigs, G.W.; Kennedy, R.E.; Cohen, W.B. A Landsat Time Series Approach to Characterize Bark Beetle and Defoliator Impacts on Tree Mortality and Surface Fuels in Conifer Forests. Remote Sens. Environ. 2011, 115, 3707–3718. [Google Scholar] [CrossRef]
- Pajares, G. Overview and Current Status of Remote Sensing Applications Based on Unmanned Aerial Vehicles (UAVs). Photogramm. Eng. Remote Sens. 2015, 81, 281–330. [Google Scholar] [CrossRef]
- Burgués, J.; Marco, S. Environmental Chemical Sensing Using Small Drones: A Review. Sci. Total Environ. 2020, 748, 141172. [Google Scholar] [CrossRef] [PubMed]
- Hall, R.J.; Castilla, G.; White, J.C.; Cooke, B.J.; Skakun, R.S. Remote Sensing of Forest Pest Damage: A Review and Lessons Learned from a Canadian Perspective. Can. Entomol. 2016, 148, S296–S356. [Google Scholar] [CrossRef]
- Klouček, T.; Komárek, J.; Surový, P.; Hrach, K.; Janata, P.; Vašíček, B. The Use of UAV Mounted Sensors for Precise Detection of Bark Beetle Infestation. Remote Sens. 2019, 11, 1561. [Google Scholar] [CrossRef]
- Huo, L.; Persson, H.J.; Lindberg, E. Early Detection of Forest Stress from European Spruce Bark Beetle Attack, and a New Vegetation Index: Normalized Distance Red & SWIR (NDRS). Remote Sens. Environ. 2021, 255, 112240. [Google Scholar] [CrossRef]
- Smigaj, M.; Gaulton, R.; Suárez, J.C.; Barr, S.L. Canopy Temperature from an Unmanned Aerial Vehicle as an Indicator of Tree Stress Associated with Red Band Needle Blight Severity. For. Ecol. Manag. 2019, 433, 699–708. [Google Scholar] [CrossRef]
- Vošvrdová, N.; Johansson, A.; Turčáni, M.; Jakuš, R.; Tyšer, D.; Schlyter, F.; Modlinger, R. Dogs Trained to Recognise a Bark Beetle Pheromone Locate Recently Attacked Spruces Better than Human Experts. For. Ecol. Manag. 2023, 528, 120626. [Google Scholar] [CrossRef]
- Fuentes, S.; Tongson, E.; Unnithan, R.R.; Gonzalez Viejo, C. Early Detection of Aphid Infestation and Insect-Plant Interaction Assessment in Wheat Using a Low-Cost Electronic Nose (E-Nose), Near-Infrared Spectroscopy and Machine Learning Modeling. Sensors 2021, 21, 5948. [Google Scholar] [CrossRef]
- Marković, D.; Vujičić, D.; Tanasković, S.; Đorđević, B.; Ranđić, S.; Stamenković, Z. Prediction of Pest Insect Appearance Using Sensors and Machine Learning. Sensors 2021, 21, 4846. [Google Scholar] [CrossRef]
- Paczkowski, S.; Datta, P.; Irion, H.; Paczkowska, M.; Habert, T.; Pelz, S.; Jaeger, D. Evaluation of Early Bark Beetle Infestation Localization by Drone-Based Monoterpene Detection. Forests 2021, 12, 228. [Google Scholar] [CrossRef]
- Kuhlmann, G.; Henne, S.; Meijer, Y.; Brunner, D. Quantifying CO2 Emissions of Power Plants With CO2 and NO2 Imaging Satellites. Front. Remote Sens. 2021, 2, 689838. [Google Scholar] [CrossRef]
- Schlyter, F.; Birgersson, G. Individual Variation in Bark Beetle and Moth Pheromones—A Comparison and an Evolutionary Background. Ecography 1989, 12, 457–465. [Google Scholar] [CrossRef]
- Ramakrishnan, R.; Hradecký, J.; Roy, A.; Kalinová, B.; Mendezes, R.C.; Synek, J.; Bláha, J.; Svatoš, A.; Jirošová, A. Metabolomics and Transcriptomics of Pheromone Biosynthesis in an Aggressive Forest Pest Ips Typographus. Insect Biochem. Mol. Biol. 2022, 140, 103680. [Google Scholar] [CrossRef]
- Pickett, J.A.; Wadhams, L.J.; Woodcock, C.M. Developing Sustainable Pest Control from Chemical Ecology. Agric. Ecosyst. Environ. 1997, 64, 149–156. [Google Scholar] [CrossRef]
- Martins, C.B.C.; Zarbin, P.H.G. Volatile Organic Compounds of Conspecific-Damaged Eucalyptus Benthamii Influence Responses of Mated Females of Thaumastocoris Peregrinus. J. Chem. Ecol. 2013, 39, 602–611. [Google Scholar] [CrossRef]
- Paré, P.W.; Tumlinson, J.H. Plant Volatiles as a Defense against Insect Herbivores. Plant Physiol. 1999, 121, 325–332. [Google Scholar] [CrossRef]
- Martins, C.; Vidal, D.; Gomes, S.; Zarbin, P. Volatile Organic Compounds (VOCs) Emitted by Ilex Paraguariensis Plants Are Affected by the Herbivory of the Lepidopteran Thelosia Camina and the Coleopteran Hedypathes Betulinus. J. Braz. Chem. Soc. 2017, 28, 1204–1211. [Google Scholar] [CrossRef]
- Valencia-Ortiz, M.; Marzougui, A.; Zhang, C.; Bali, S.; Odubiyi, S.; Sathuvalli, V.; Bosque-Pérez, N.A.; Pumphrey, M.O.; Sankaran, S. Biogenic VOCs Emission Profiles Associated with Plant-Pest Interaction for Phenotyping Applications. Sensors 2022, 22, 4870. [Google Scholar] [CrossRef]
- Jaakkola, E.; Gärtner, A.; Jönsson, A.M.; Ljung, K.; Olsson, P.-O.; Holst, T. Spruce Bark Beetle (Ips typographus) Infestation Cause up to 700 Times Higher Bark BVOC Emission Rates from Norway Spruce (Picea abies). Biogeosci. Discuss. 2022. in review. [Google Scholar] [CrossRef]
- Ghimire, R.P.; Kivimäenpää, M.; Blomqvist, M.; Holopainen, T.; Lyytikäinen-Saarenmaa, P.; Holopainen, J.K. Effect of Bark Beetle (Ips typographus L.) Attack on Bark VOC Emissions of Norway Spruce (Picea abies Karst.) Trees. Atmos. Environ. 2016, 126, 145–152. [Google Scholar] [CrossRef]
- Rahmani, R.; Hedenström, E.; Schroeder, M. SPME Collection and GC-MS Analysis of Volatiles Emitted during the Attack of Male Polygraphus Poligraphus (Coleoptera, Curcolionidae) on Norway Spruce. Z. Nat. C 2015, 70, 265–273. [Google Scholar] [CrossRef] [PubMed]
- Zhou, B.; Wang, J. Use of Electronic Nose Technology for Identifying Rice Infestation by Nilaparvata Lugens. Sens. Actuators B Chem. 2011, 160, 15–21. [Google Scholar] [CrossRef]
- Cellini, A.; Blasioli, S.; Biondi, E.; Bertaccini, A.; Braschi, I.; Spinelli, F. Potential Applications and Limitations of Electronic Nose Devices for Plant Disease Diagnosis. Sensors 2017, 17, 2596. [Google Scholar] [CrossRef] [PubMed]
- ÚHÚL: Informace o Lesním Hospodářství. Available online: https://geoportal.uhul.cz/mapy/mapylhpovyst.html (accessed on 18 November 2022).
- Půdní Mapa 1:50,000. Available online: https://mapy.geology.cz/pudy/# (accessed on 18 November 2022).
- Portál ČHMÚ: Historická Data: Počasí: Mapy Charakteristik Klimatu. Available online: https://www.chmi.cz/historicka-data/pocasi/mapy-charakteristik-klimatu (accessed on 18 November 2022).
- Sniffer4D–Mobile Air Poluttant Mapping System–Drone-Based Air Pollutant Mapping System. Available online: http://sniffer4d.eu/ (accessed on 18 November 2022).
- Ogris, N.; Ferlan, M.; Hauptman, T.; Pavlin, R.; Kavčič, A.; Jurc, M.; de Groot, M. RITY–A Phenology Model of Ips Typographus as a Tool for Optimization of Its Monitoring. Ecol. Model. 2019, 410, 108775. [Google Scholar] [CrossRef]
- Wermelinger, B. Ecology and Management of the Spruce Bark Beetle Ips Typographus—A Review of Recent Research. For. Ecol. Manag. 2004, 202, 67–82. [Google Scholar] [CrossRef]
- Abdullah, A.H.; Sudin, S.; Mat Ajit, M.I.; Ahmad Saad, F.S.; Kamaruddin, K.; Ghazali, F.; Ahmad, Z.A.; Abu Bakar, M.A. Development of ESP32-Based Wi-Fi Electronic Nose System for Monitoring LPG Leakage at Gas Cylinder Refurbish Plant. In Proceedings of the 2018 International Conference on Computational Approach in Smart Systems Design and Applications (ICASSDA), Kuching, Malaysia, 15–17 August 2018; pp. 1–5. [Google Scholar] [CrossRef]
- Sudama, K.A.; Rivai, M.; Aulia, D.; Mujiono, T. Electronic Nose Based on Gas Sensor Array and Neural Network for Indoor Hydrogen Gas Control System. In Proceedings of the 2022 1st International Conference on Information System & Information Technology (ICISIT), Yogyakarta, Indonesia, 26–27 July 2022; pp. 187–192. [Google Scholar] [CrossRef]
- Arroyo, P.; Meléndez, F.; Suárez, J.I.; Herrero, J.L.; Rodríguez, S.; Lozano, J. Electronic Nose with Digital Gas Sensors Connected via Bluetooth to a Smartphone for Air Quality Measurements. Sensors 2020, 20, 786. [Google Scholar] [CrossRef]
- Rahman, S.; Alwadie, A.S.; Irfan, M.; Nawaz, R.; Raza, M.; Javed, E.; Awais, M. Wireless E-Nose Sensors to Detect Volatile Organic Gases through Multivariate Analysis. Micromachines 2020, 11, 597. [Google Scholar] [CrossRef]
- Hedworth, H.; Page, J.; Sohl, J.; Saad, T. Investigating Errors Observed during UAV-Based Vertical Measurements Using Computational Fluid Dynamics. Drones 2022, 6, 253. [Google Scholar] [CrossRef]
- Wang, T.; Han, W.; Zhang, M.; Yao, X.; Zhang, L.; Peng, X.; Li, C.; Dan, X. Unmanned Aerial Vehicle-Borne Sensor System for Atmosphere-Particulate-Matter Measurements: Design and Experiments. Sensors 2019, 20, 57. [Google Scholar] [CrossRef]
- Valente, J.; Almeida, R.; Kooistra, L. A Comprehensive Study of the Potential Application of Flying Ethylene-Sensitive Sensors for Ripeness Detection in Apple Orchards. Sensors 2019, 19, 372. [Google Scholar] [CrossRef] [PubMed] [Green Version]


| Data Collection | Sample Number | Sample Category | Mean | Standard Deviation |
|---|---|---|---|---|
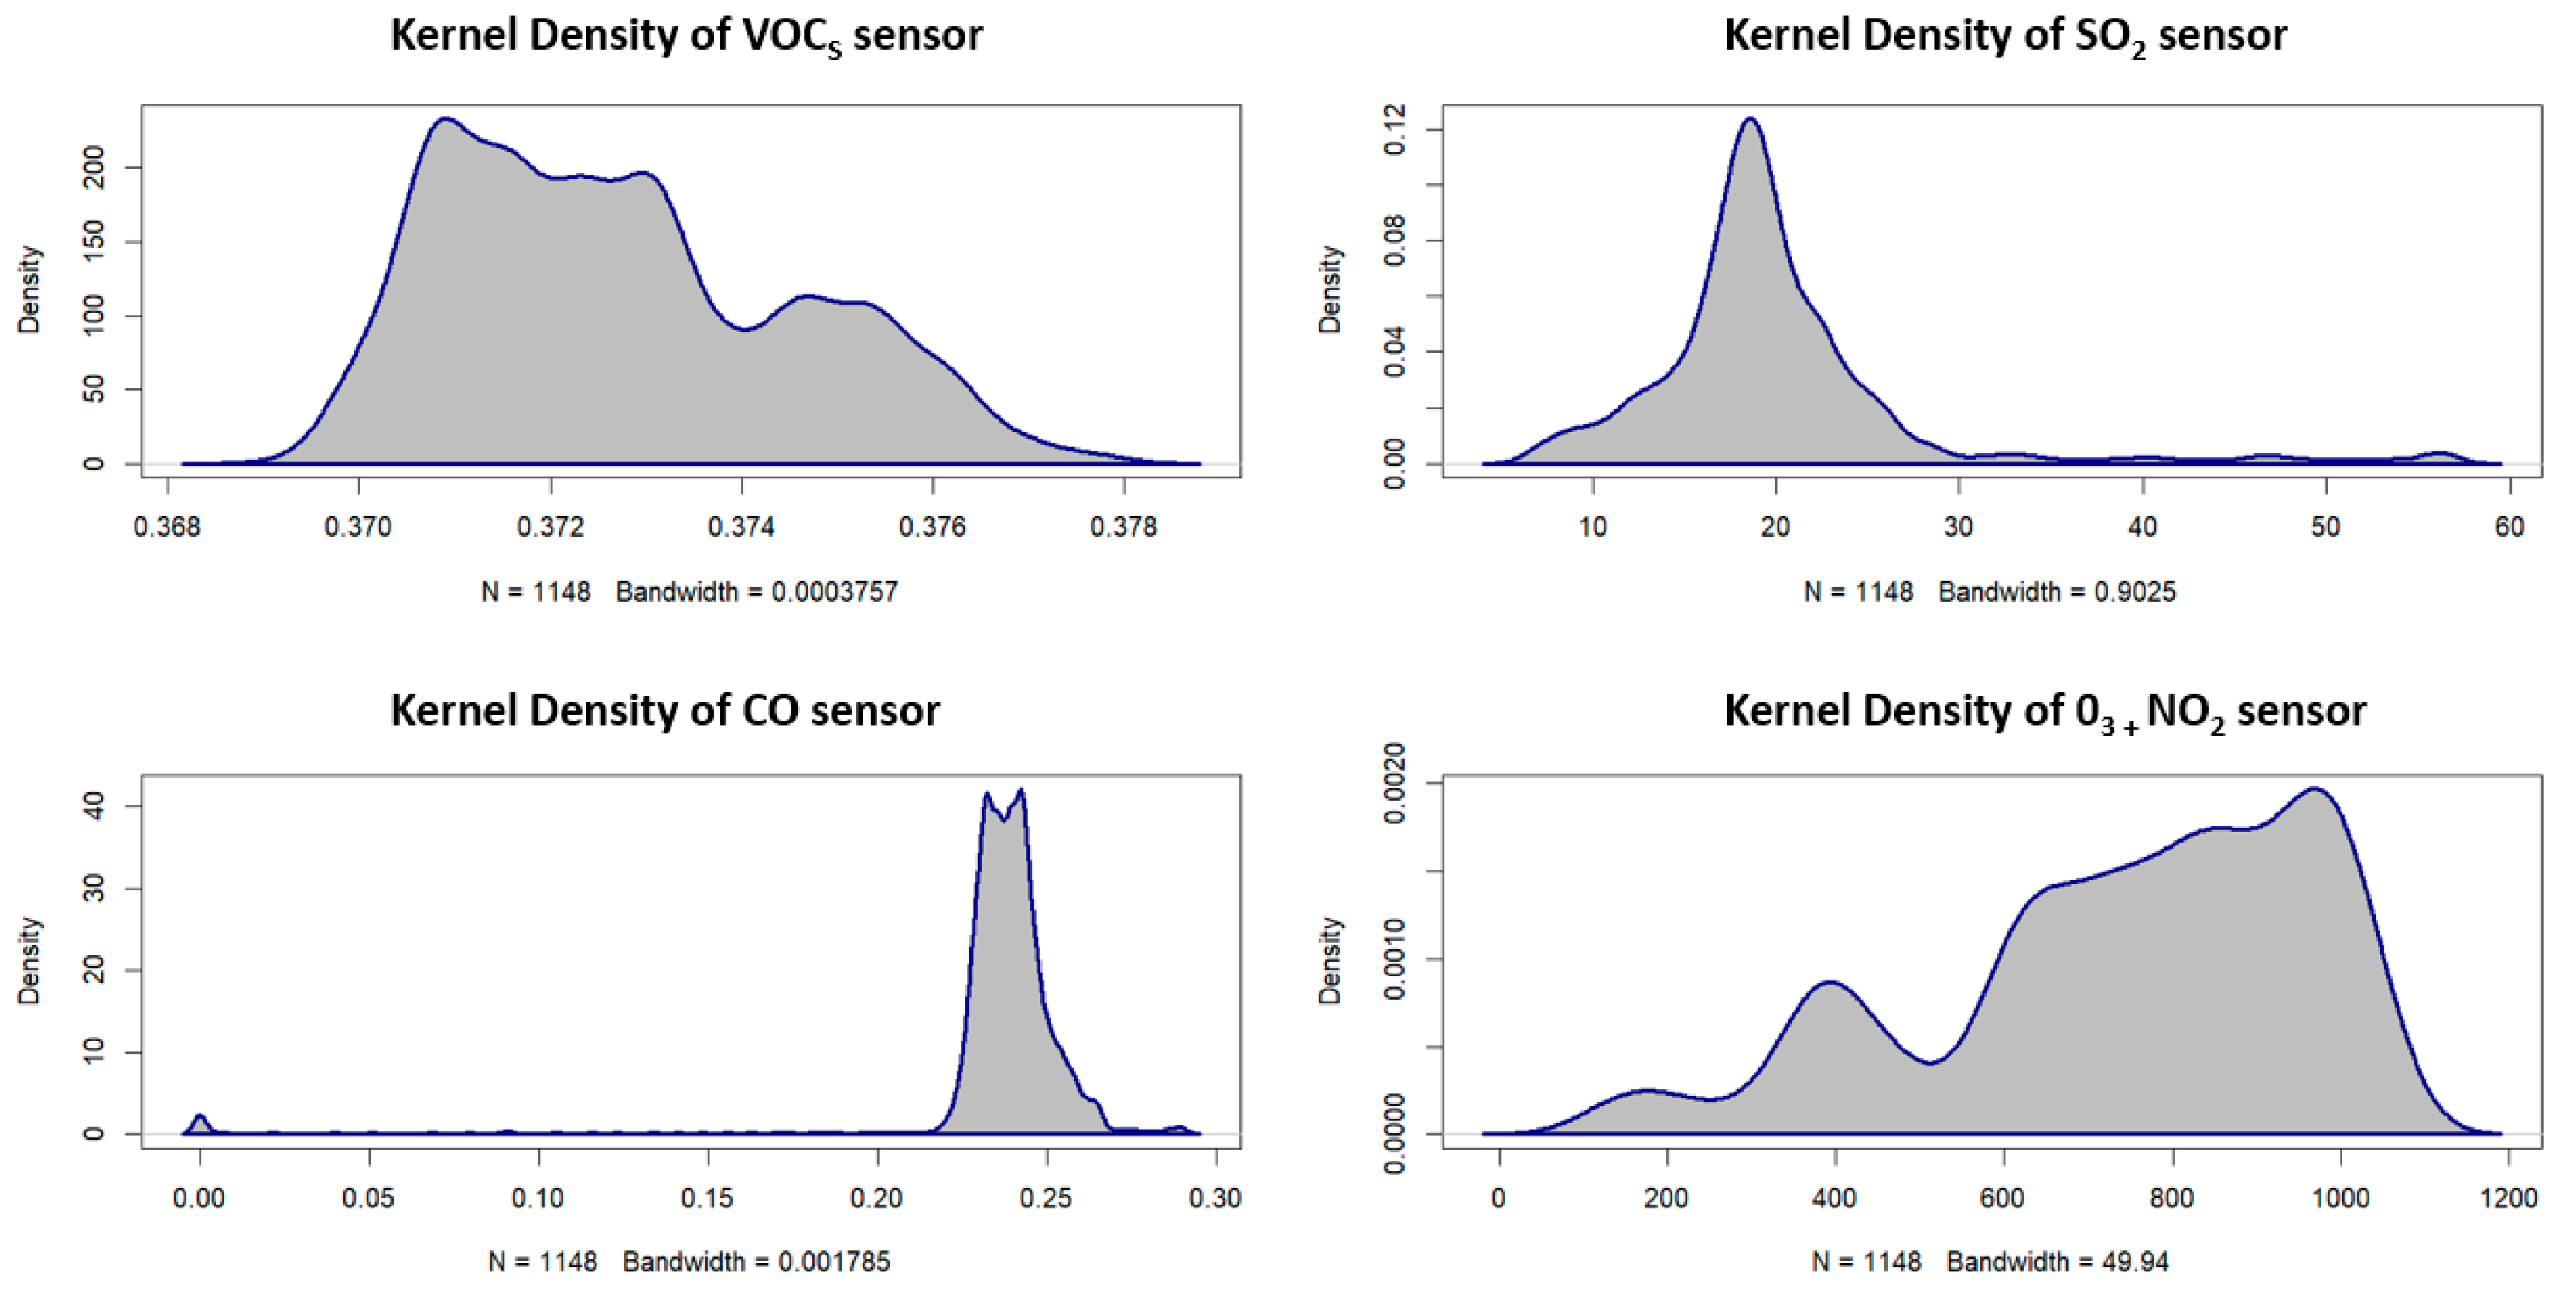
| First ground measurement | 1148 | VOCs | 0.372 | 0.001 |
| SO2 | 20.007 | 7.486 | ||
| CO | 0.235 | 0.032 | ||
| O3 + NO2 | 741.040 | 227.101 | ||
| PM1.0 | 16.541 | 1.102 | ||
| PM2.5 | 22.951 | 1.740 | ||
| PM10 | 25.614 | 1.774 | ||
| CxHy | 0.079 | 0.003 | ||
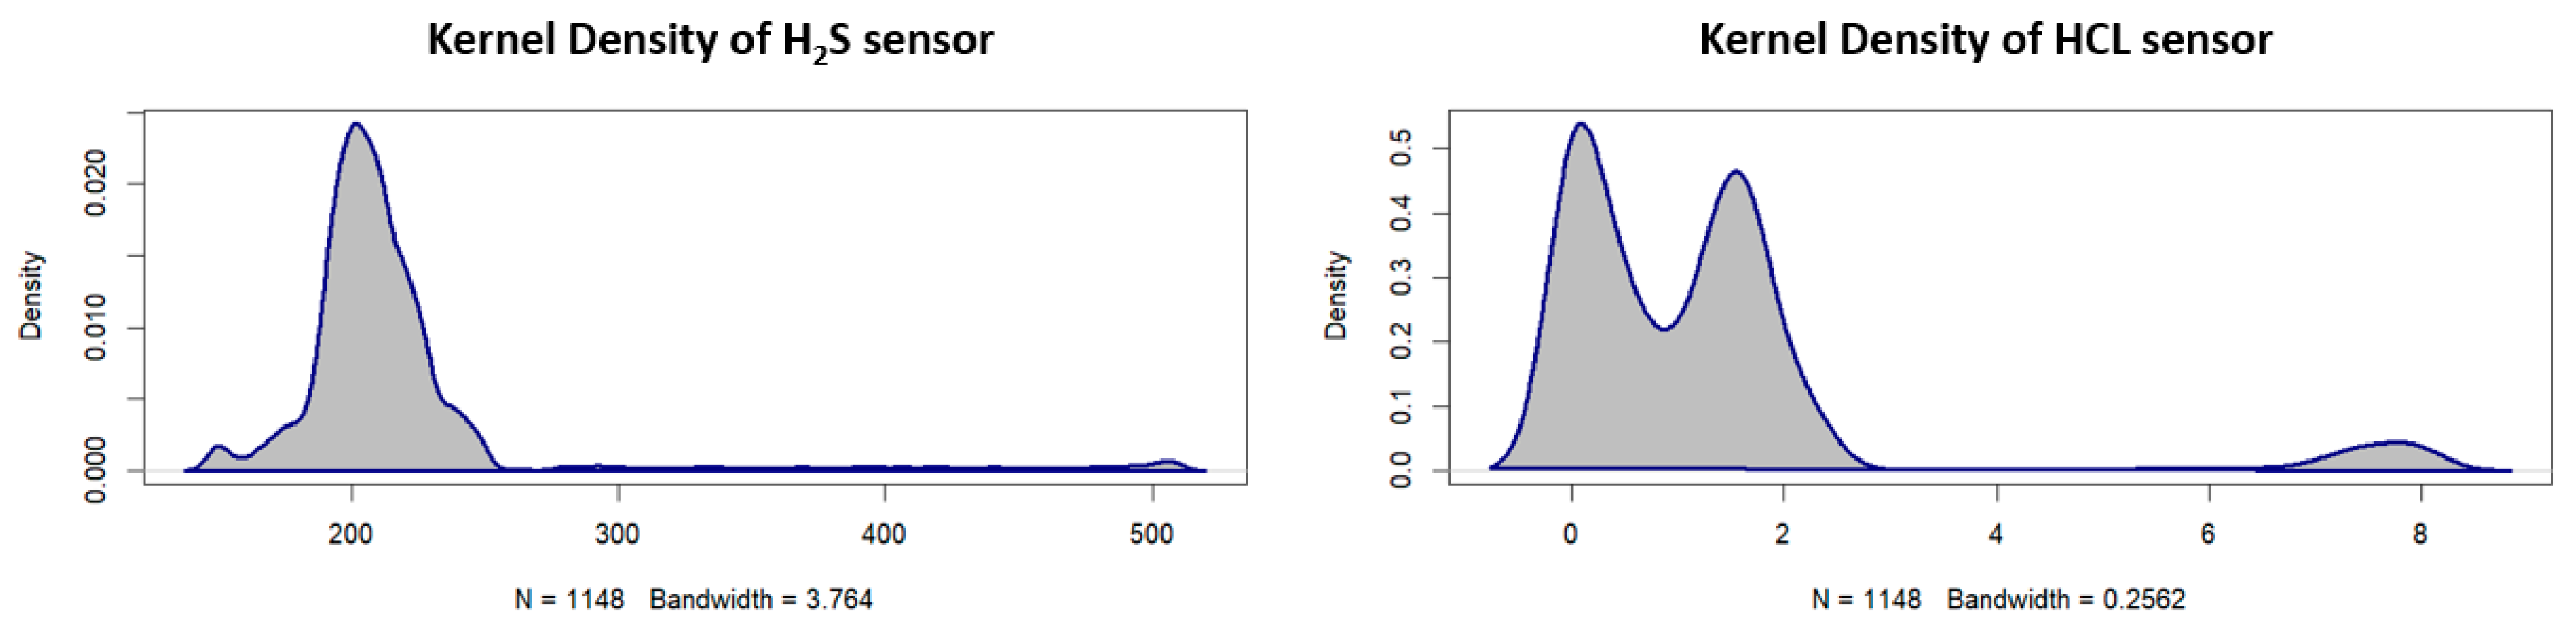
| H2S | 217.614 | 53.369 | ||
| HCL | 1.263 | 1.693 | ||
| Second ground measurement | 811 | VOCs | 0.376 | 0.001 |
| SO2 | 30.709 | 8.624 | ||
| CO | 0.253 | 0.035 | ||
| O3 + NO2 | 135.970 | 23.466 | ||
| PM1.0 | 15.260 | 0.769 | ||
| PM2.5 | 20.059 | 1.363 | ||
| PM10 | 22.520 | 1.513 | ||
| CxHy | 0.085 | 0.003 | ||
| H2S | 269.391 | 54.577 | ||
| HCL | 1.912 | 1.832 | ||
| UAV measurement | 815 | VOCs | 0.376 | 0.002 |
| SO2 | 23.378 | 5.061 | ||
| CO | 0.211 | 0.026 | ||
| O3 + NO2 | 171.156 | 25.642 | ||
| PM1.0 | 15.781 | 0.890 | ||
| PM2.5 | 21.509 | 1.247 | ||
| PM10 | 23.927 | 1.320 | ||
| CxHy | 0.085 | 0.001 | ||
| H2S | 217.501 | 11.957 | ||
| HCL | 0 | 0 |
| Data Collection | Condition of Trees | Sensor | Pearson’s Correlation Coefficient |
|---|---|---|---|
| First ground measurement | Dead trees | VOCs | 0.322 |
| SO2 | −0.209 | ||
| CO | 0.071 | ||
| O3 + NO2 | 0.629 | ||
| PM1.0 | 0.300 | ||
| PM2.5 | 0.284 | ||
| PM10 | 0.237 | ||
| CxHy | −0.071 | ||
| H2S | −0.132 | ||
| HCL | −0.456 | ||
| Second ground measurement | Dead trees | VOCs | −0.036 |
| SO2 | −0.360 | ||
| CO | 0.394 | ||
| O3 + NO2 | 0.108 | ||
| PM1.0 | 0.189 | ||
| PM2.5 | 0.000 | ||
| PM10 | −0.052 | ||
| CxHy | −0.146 | ||
| H2S | −0.432 | ||
| HCL | −0.378 |
| Data Collection | Condition of Trees | Sensor | Pearson’s Correlation Coefficient |
|---|---|---|---|
| First ground measurement | Early stage of infestation | VOCs | 0.230 |
| SO2 | −0.164 | ||
| CO | 0.062 | ||
| O3 + NO2 | 0.648 | ||
| PM1.0 | 0.274 | ||
| PM2.5 | 0.285 | ||
| PM10 | 0.219 | ||
| CxHy | −0.076 | ||
| H2S | −0.100 | ||
| HCL | −0.427 | ||
| Second ground measurement | Early stage of infestation | VOCs | 0.165 |
| SO2 | −0.480 | ||
| CO | 0.337 | ||
| O3 + NO2 | −0.150 | ||
| PM1.0 | 0.231 | ||
| PM2.5 | −0.048 | ||
| PM10 | −0.068 | ||
| CxHy | −0.339 | ||
| H2S | −0.486 | ||
| HCL | −0.118 |
| Data Collection | Condition of Trees | Sensor | Pearson’s Correlation Coefficient |
|---|---|---|---|
| UAV measurement | Early stage of infestation | VOCs | 0.445 |
| SO2 | 0.415 | ||
| CO | 0.464 | ||
| O3 + NO2 | 0.501 | ||
| PM1.0 | −0.020 | ||
| PM2.5 | −0.033 | ||
| PM10 | 0.021 | ||
| CxHy | 0.065 | ||
| H2S | 0.250 | ||
| HCL | NA | ||
| UAV measurement | Dead trees | VOCs | 0.346 |
| SO2 | 0.294 | ||
| CO | 0.377 | ||
| O3 + NO2 | 0.357 | ||
| PM1.0 | −0.006 | ||
| PM2.5 | −0.101 | ||
| PM10 | −0.056 | ||
| CxHy | 0.140 | ||
| H2S | 0.140 | ||
| HCL | NA |
Disclaimer/Publisher’s Note: The statements, opinions and data contained in all publications are solely those of the individual author(s) and contributor(s) and not of MDPI and/or the editor(s). MDPI and/or the editor(s) disclaim responsibility for any injury to people or property resulting from any ideas, methods, instructions or products referred to in the content. |
© 2023 by the authors. Licensee MDPI, Basel, Switzerland. This article is an open access article distributed under the terms and conditions of the Creative Commons Attribution (CC BY) license (https://creativecommons.org/licenses/by/4.0/).
Share and Cite
Hüttnerová, T.; Paczkowski, S.; Neubert, T.; Jirošová, A.; Surový, P. Comparison of Individual Sensors in the Electronic Nose for Stress Detection in Forest Stands. Sensors 2023, 23, 2001. https://doi.org/10.3390/s23042001
Hüttnerová T, Paczkowski S, Neubert T, Jirošová A, Surový P. Comparison of Individual Sensors in the Electronic Nose for Stress Detection in Forest Stands. Sensors. 2023; 23(4):2001. https://doi.org/10.3390/s23042001
Chicago/Turabian StyleHüttnerová, Tereza, Sebastian Paczkowski, Tarek Neubert, Anna Jirošová, and Peter Surový. 2023. "Comparison of Individual Sensors in the Electronic Nose for Stress Detection in Forest Stands" Sensors 23, no. 4: 2001. https://doi.org/10.3390/s23042001