

Driver Attention Assessment Using Physiological Measures from EEG, ECG, and EDA Signals †


Abstract
:1. Introduction
2. Materials and Methods
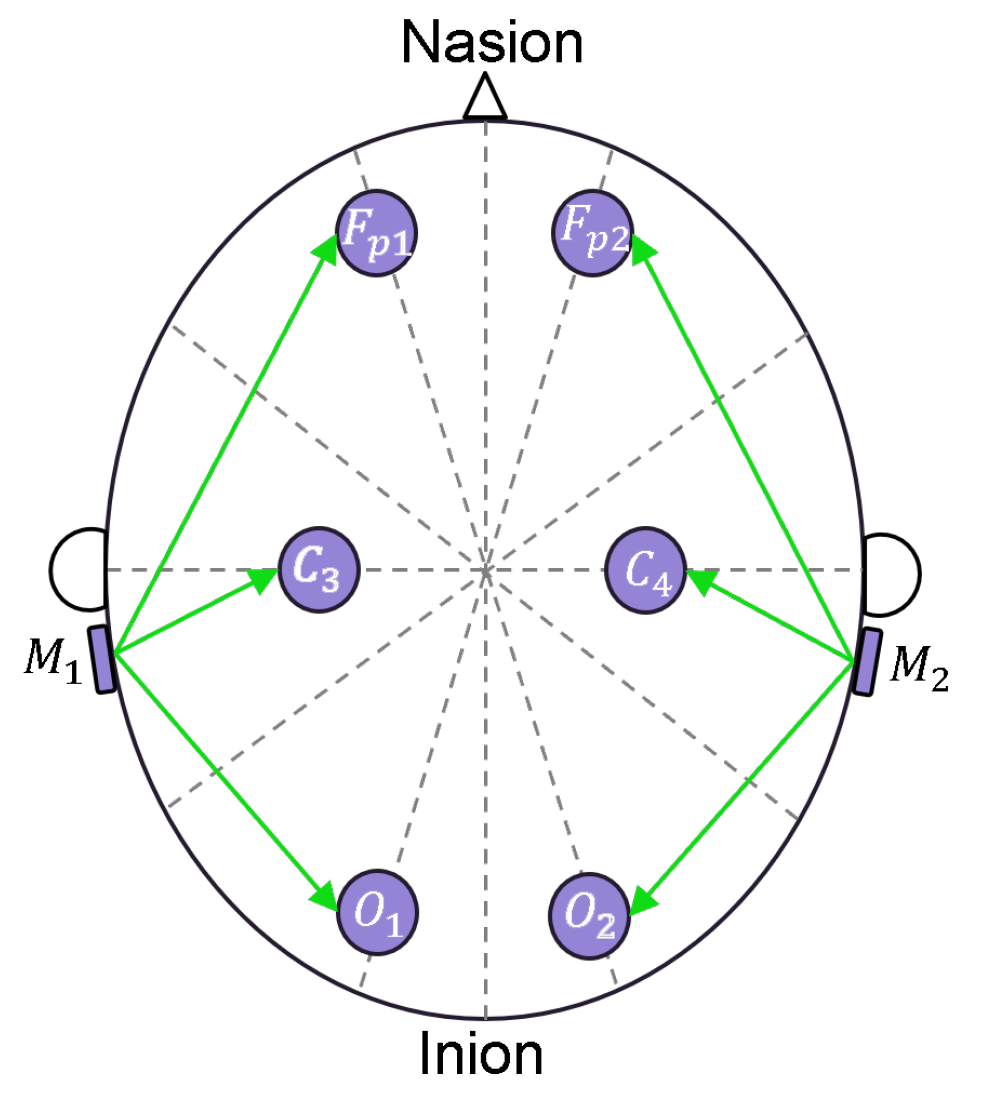
2.1. Sensor Description
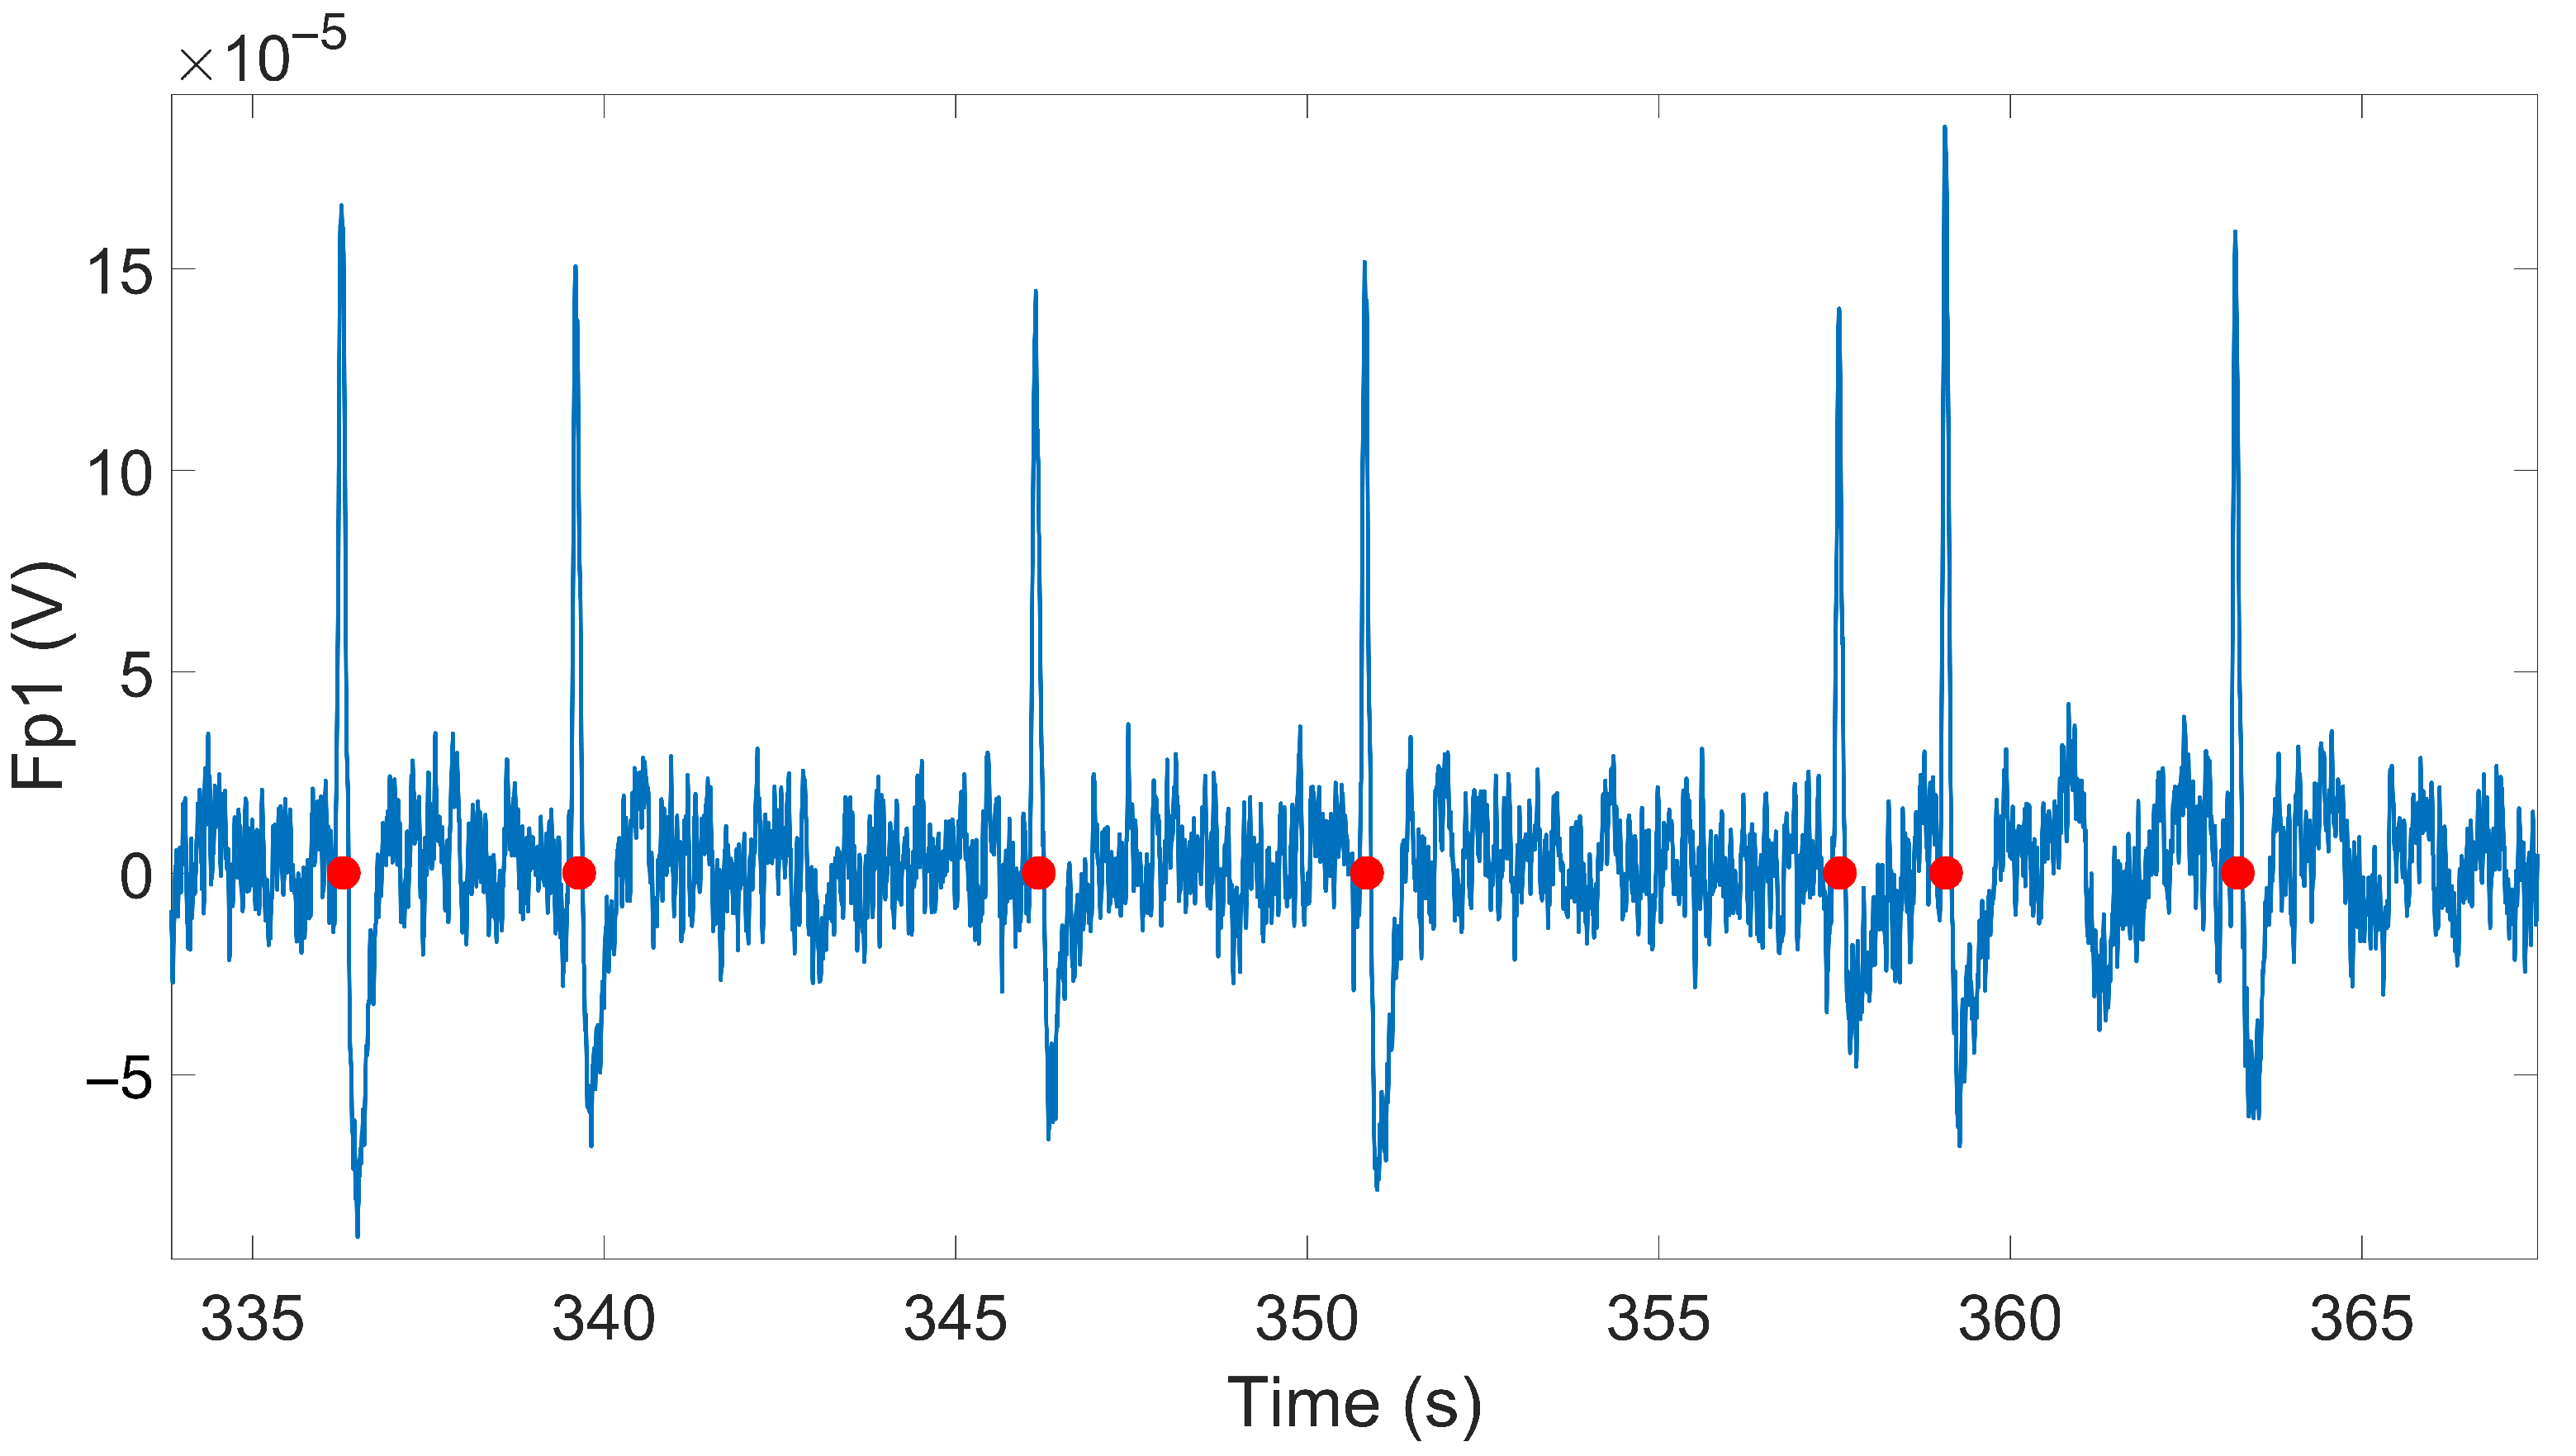
2.2. Signal Processing
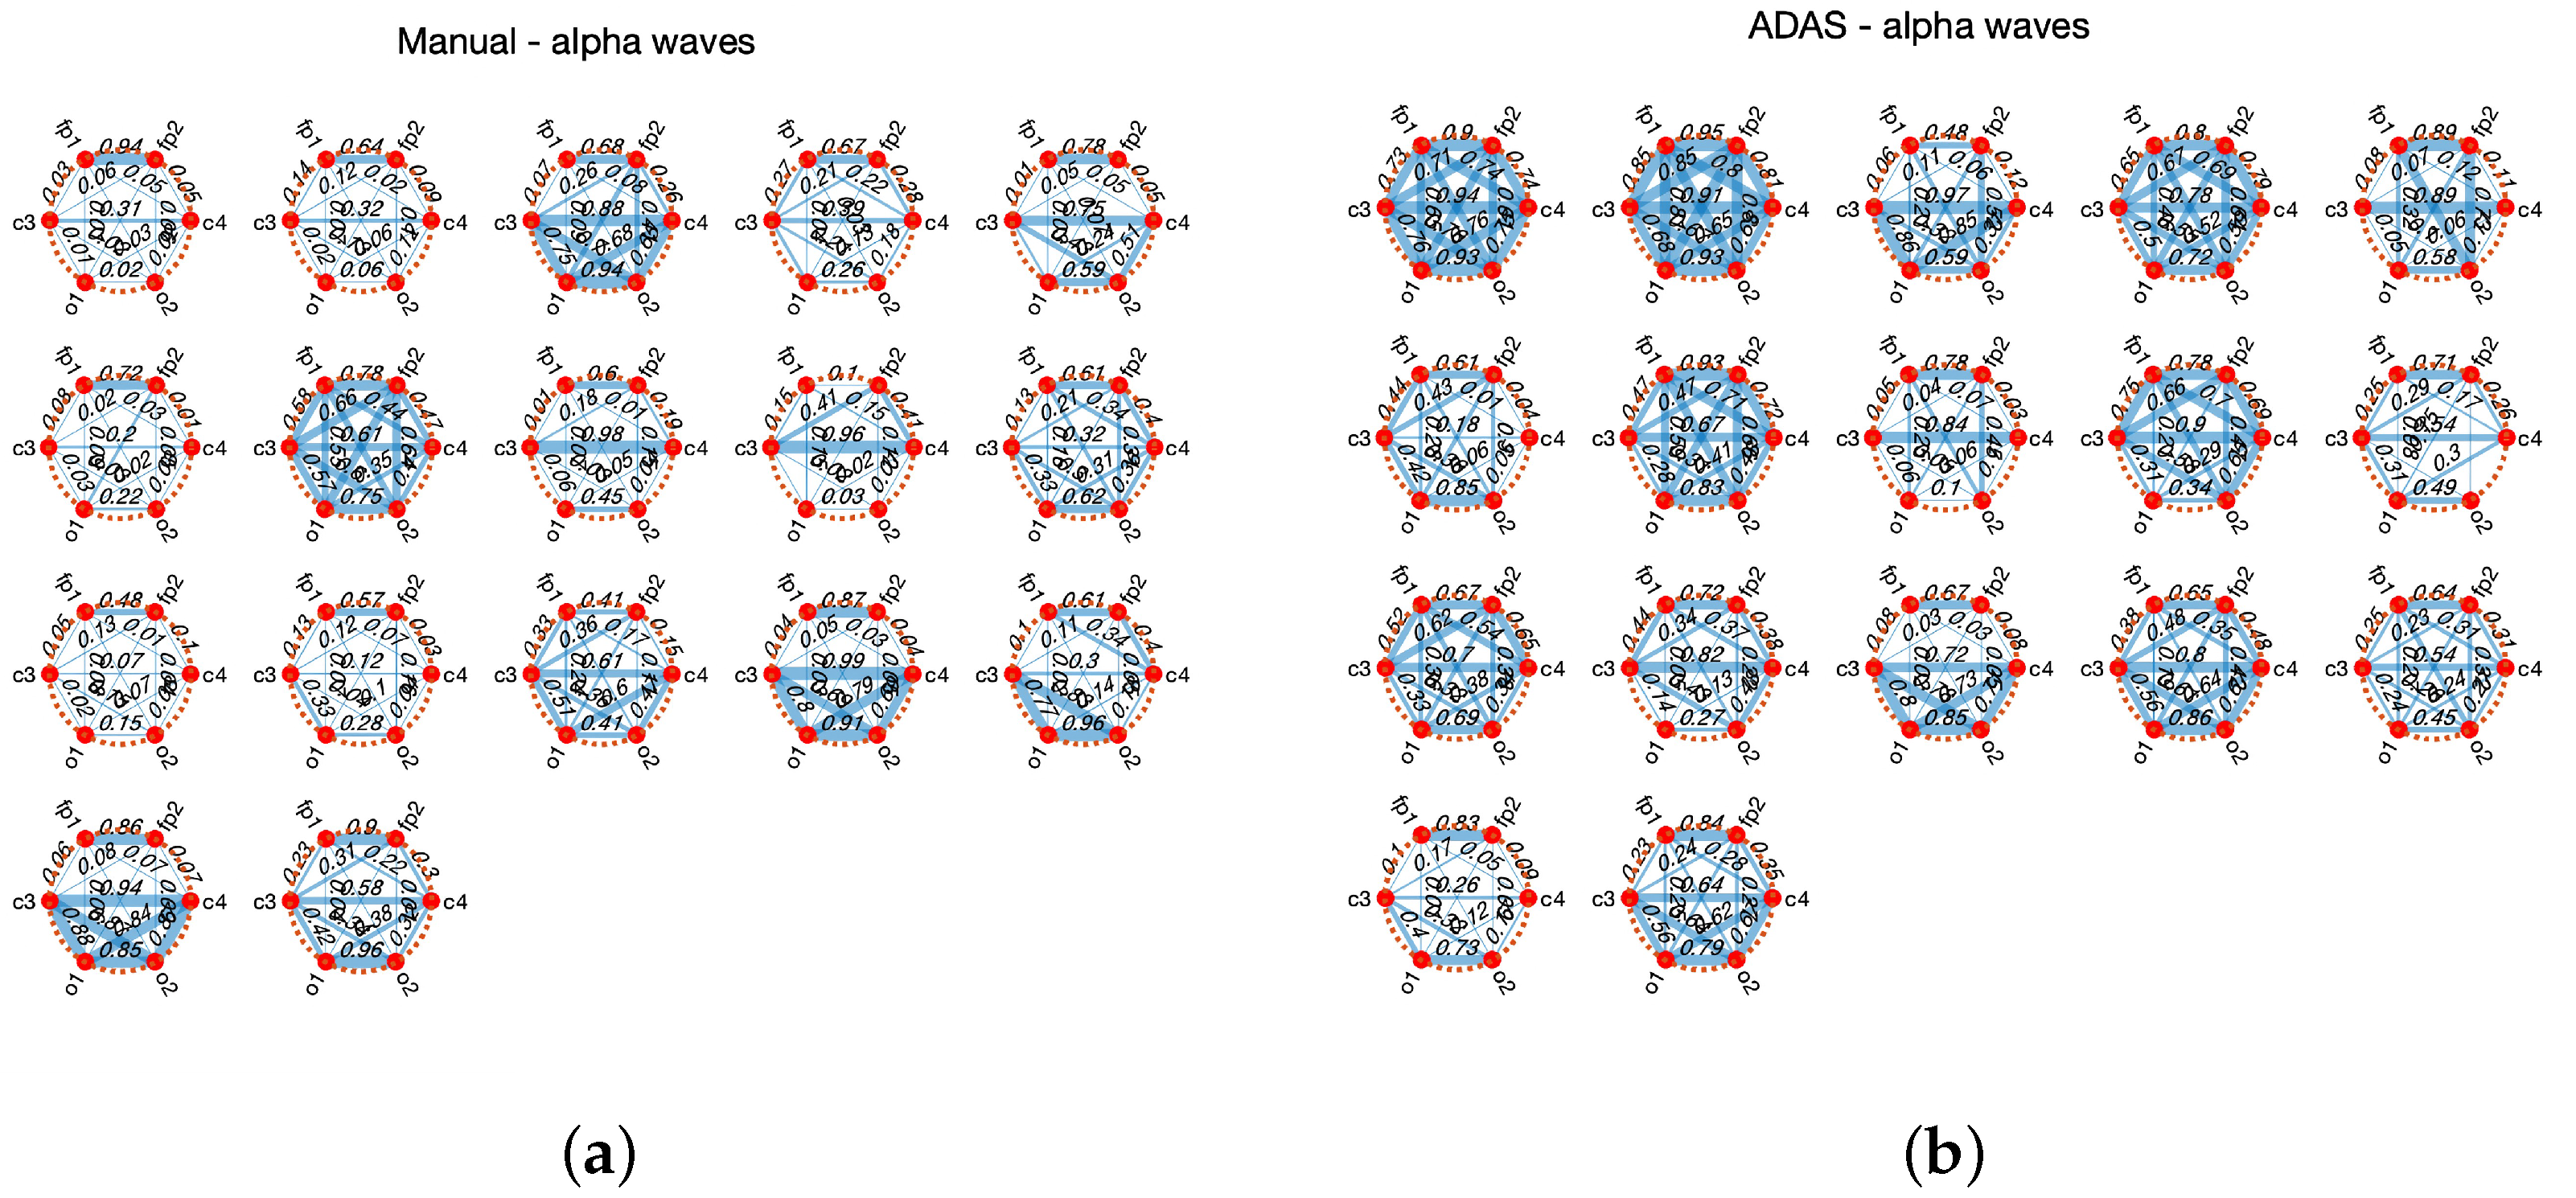
2.3. Statistical Tests and Methods
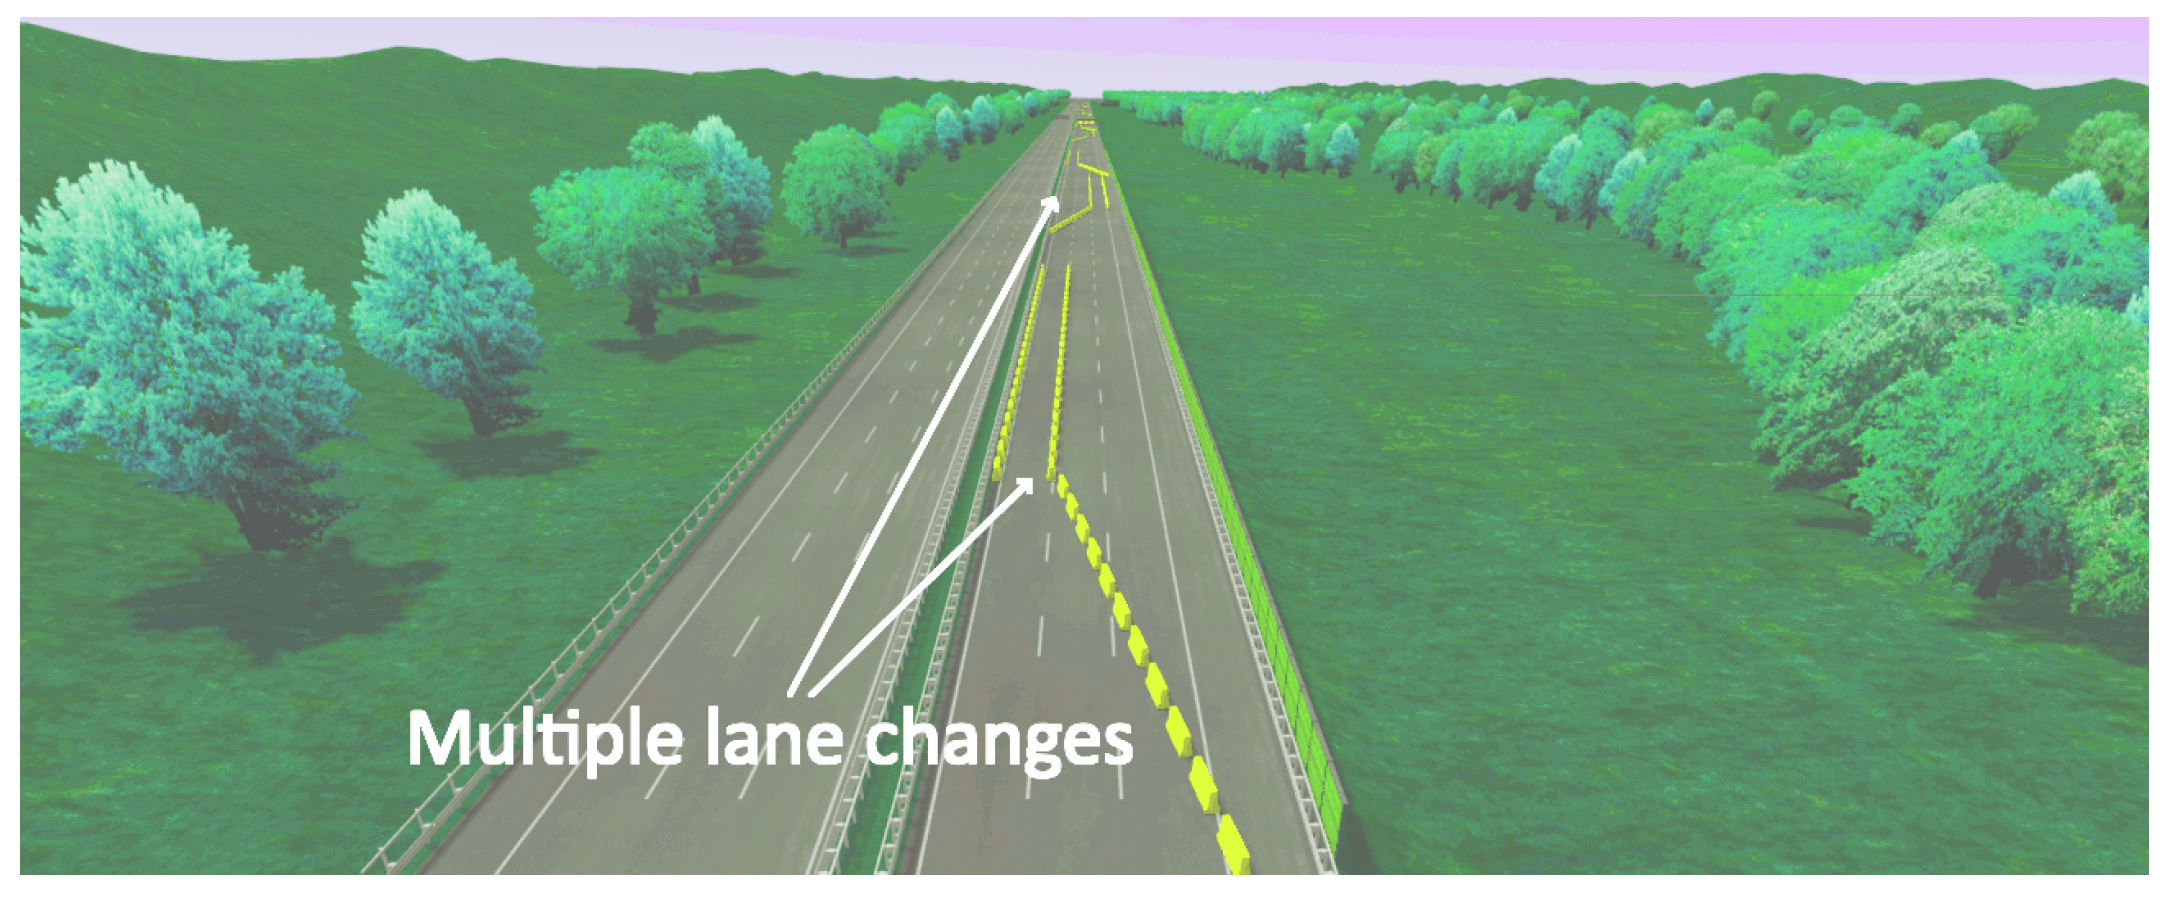
3. Experimental Setup
4. Experimental Results
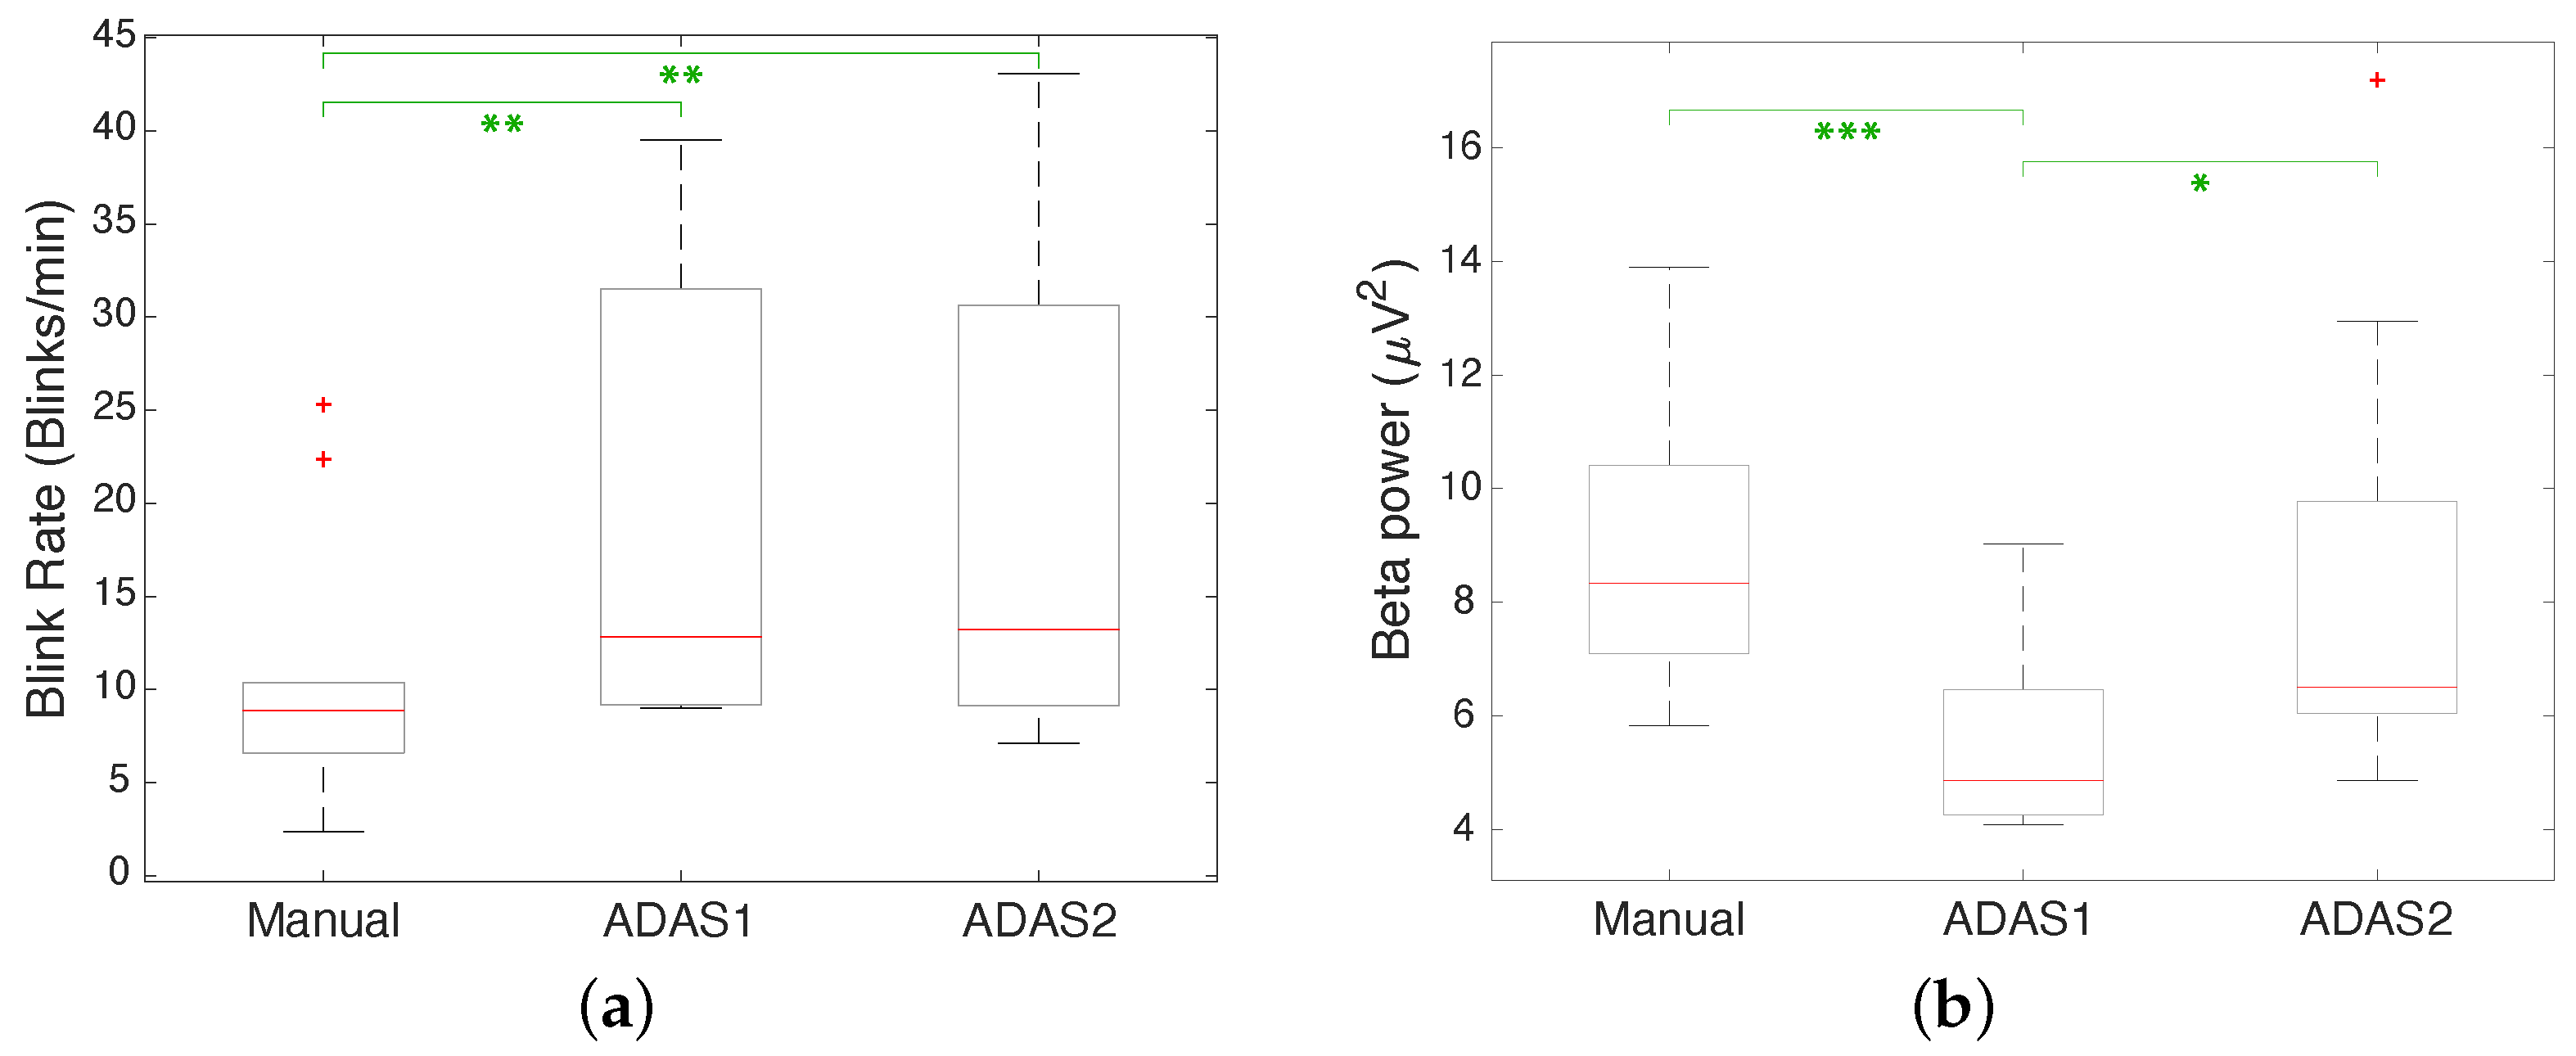
4.1. Experiment 1
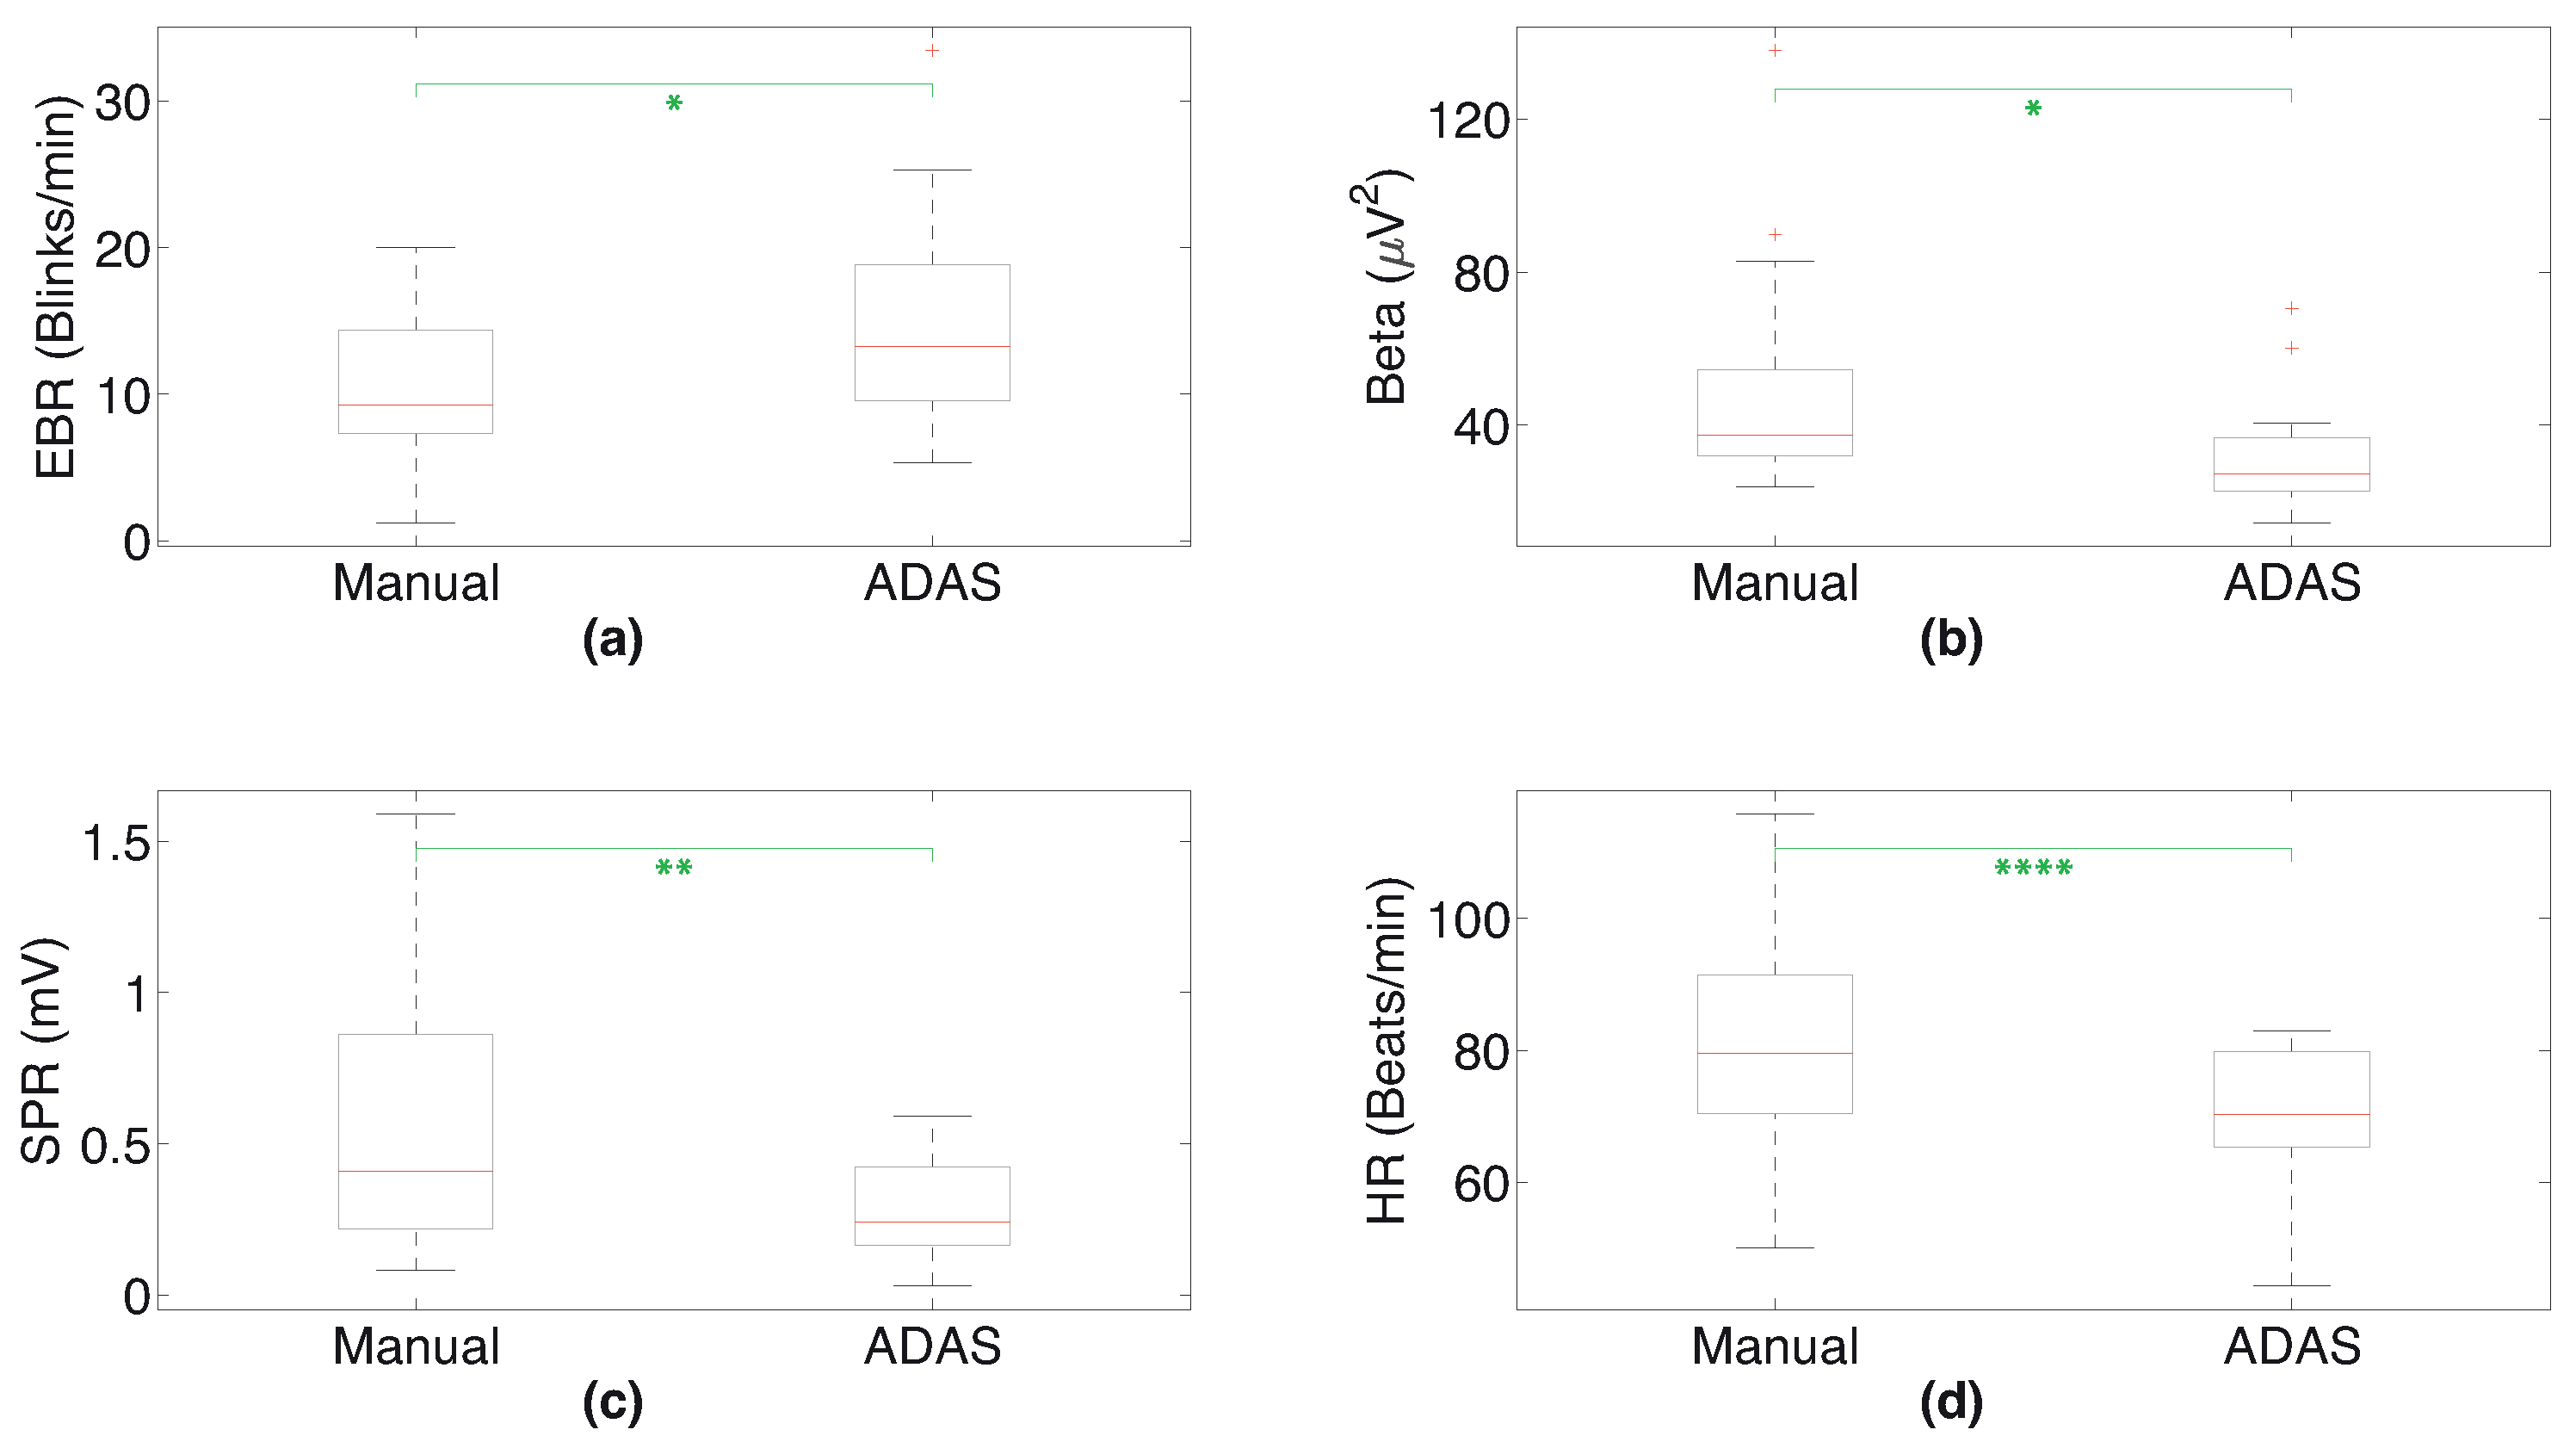
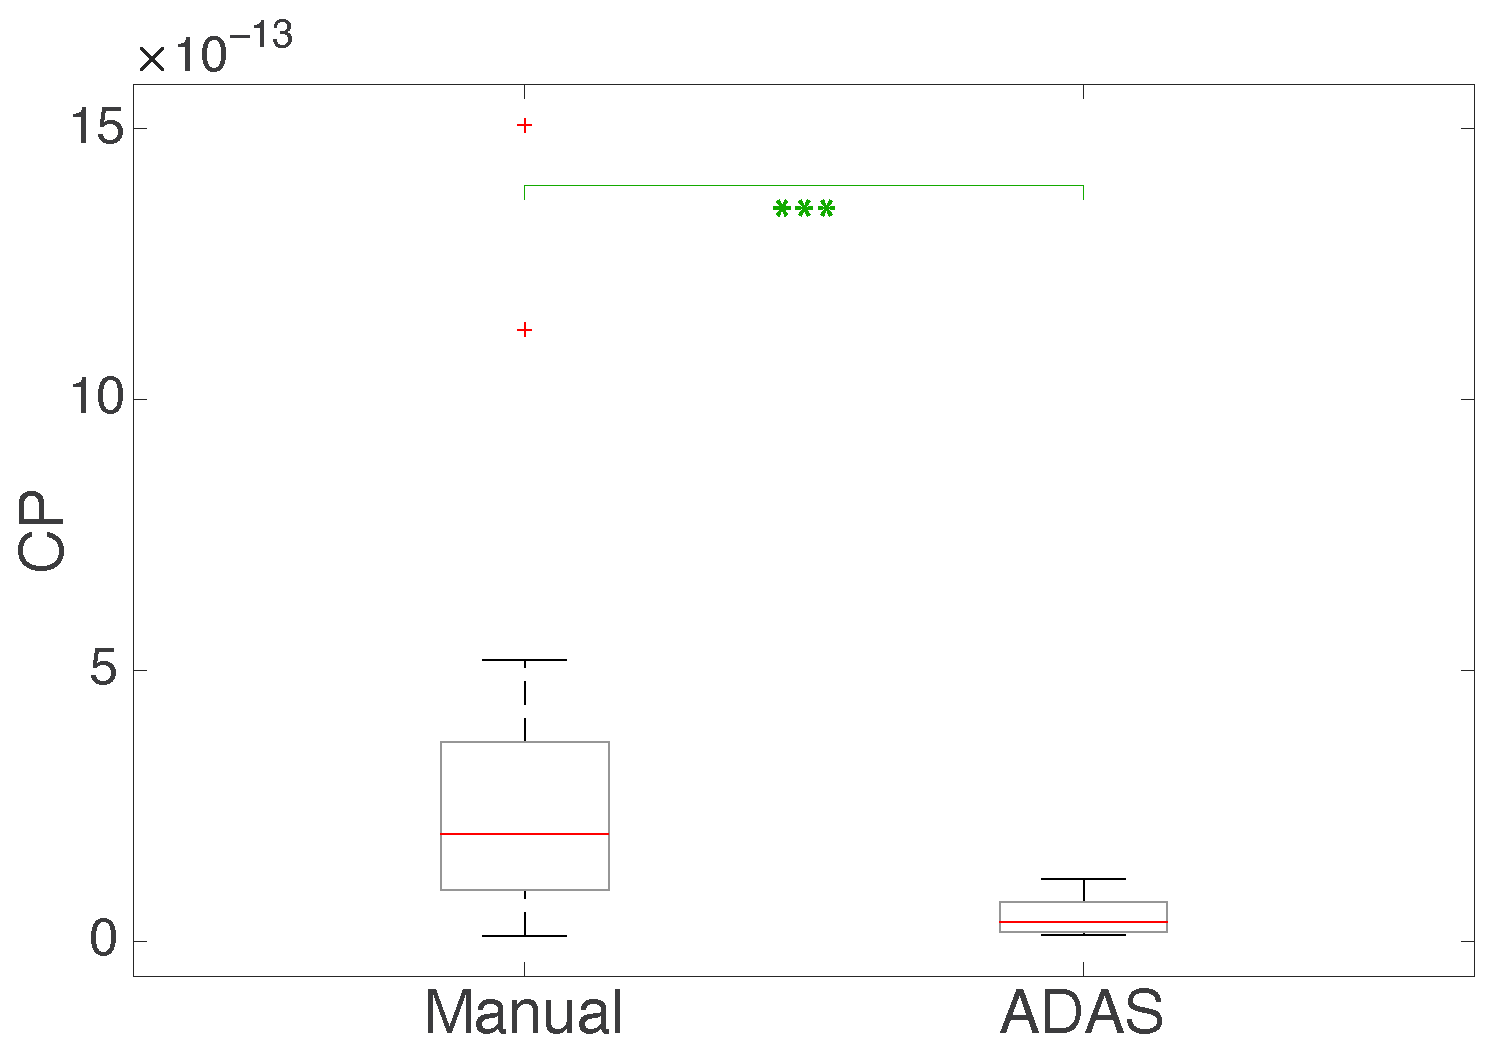
4.2. Experiment 2
5. Discussion
5.1. Experiment 1
5.2. Experiment 2
5.3. Strengths and Weaknesses of Our System
6. Conclusions
Author Contributions
Funding
Institutional Review Board Statement
Informed Consent Statement
Data Availability Statement
Conflicts of Interest
Abbreviations
| SPR | Skin Potential Response |
| EDA | Electrodermal Activity |
| EEG | Electroencephalogram |
| ECG | Electrocardiogram |
| HR | Heart Rate |
| EBR | Eye Blink Rate |
| RMS | Root Mean Square |
| GUI | Graphical User Interface |
References
- Decae, R. Annual Statistical Report on Road Safety in the EU 2020; European Commission, Director General for Transport: Brussels, Belgium, 2021. [Google Scholar]
- Directorate-General for Mobility and Transport. Road Safety: Europe’s Roads Are Getting Safer but Progress Remains too Slow. Mobility and Transport News, 11 June 2020. [Google Scholar]
- Singh, S. Critical Reasons for Crashes Investigated in the National Motor Vehicle Crash Causation Survey; Traffic Safety Facts Crash•Stats. Report No. DOT HS 812 506; National Highway Traffic Safety Administration: Washington, DC, USA, 2018.
- Stanton, N.A.; Salmon, P.M. Human error taxonomies applied to driving: A generic driver error taxonomy and its implications for intelligent transport systems. Saf. Sci. 2009, 47, 227–237. [Google Scholar] [CrossRef]
- Treat, J.R.; Tumbas, N.S.; McDonald, S.T.; Shinar, D.; Hume, R.D.; Mayer, R.; Stansifer, R.; Castellan, N.J. Tri-Level Study of the Causes of Traffic Accidents: Final Report. Executive Summary; Technical Report; Indiana University, Institute for Research in Public Safety: Bloomington, IN, USA, 1979. [Google Scholar]
- Aarts, L.; Van Schagen, I. Driving speed and the risk of road crashes: A review. Accid. Anal. Prev. 2006, 38, 215–224. [Google Scholar] [CrossRef] [PubMed]
- Beanland, V.; Fitzharris, M.; Young, K.L.; Lenné, M.G. Driver inattention and driver distraction in serious casualty crashes: Data from the Australian National Crash In-depth Study. Accid. Anal. Prev. 2013, 54, 99–107. [Google Scholar] [CrossRef] [PubMed]
- Regan, M.A.; Hallett, C.; Gordon, C.P. Driver distraction and driver inattention: Definition, relationship and taxonomy. Accid. Anal. Prev. 2011, 43, 1771–1781. [Google Scholar] [CrossRef] [PubMed]
- Johansson, G. Visual motion perception. Sci. Am. 1975, 232, 76–89. [Google Scholar] [CrossRef] [PubMed]
- Cullen, K.E. Vestibular processing during natural self-motion: Implications for perception and action. Nat. Rev. Neurosci. 2019, 20, 346–363. [Google Scholar] [CrossRef]
- Kandel, E.R.; Schwartz, J.H.; Jessell, T.M.; Siegelbaum, S.; Hudspeth, A.J.; Mack, S. (Eds.) Principles of Neural Science; McGraw-Hill: New York, NY, USA, 2000; Volume 4. [Google Scholar]
- Nash, C.J.; Cole, D.J.; Bigler, R.S. A review of human sensory dynamics for application to models of driver steering and speed control. Biol. Cybern. 2016, 110, 91–116. [Google Scholar] [CrossRef]
- Schwarz, C.; Gaspar, J.; Miller, T.; Yousefian, R. The detection of drowsiness using a driver monitoring system. Traffic Inj. Prev. 2019, 20, S157–S161. [Google Scholar] [CrossRef]
- Kashevnik, A.; Lashkov, I.; Ponomarev, A.; Teslya, N.; Gurtov, A. Cloud-based driver monitoring system using a smartphone. IEEE Sens. J. 2020, 20, 6701–6715. [Google Scholar] [CrossRef]
- Daza, I.G.; Bergasa, L.M.; Bronte, S.; Yebes, J.J.; Almazán, J.; Arroyo, R. Fusion of optimized indicators from Advanced Driver Assistance Systems (ADAS) for driver drowsiness detection. Sensors 2014, 14, 1106–1131. [Google Scholar] [CrossRef]
- Koesdwiady, A.; Soua, R.; Karray, F.; Kamel, M.S. Recent trends in driver safety monitoring systems: State of the art and challenges. IEEE Trans. Veh. Technol. 2016, 66, 4550–4563. [Google Scholar] [CrossRef]
- Hussain, I.; Young, S.; Park, S.J. Driving-induced neurological biomarkers in an advanced driver-assistance system. Sensors 2021, 21, 6985. [Google Scholar] [CrossRef] [PubMed]
- Ancillon, L.; Elgendi, M.; Menon, C. Machine Learning for Anxiety Detection Using Biosignals: A Review. Diagnostics 2022, 12, 1794. [Google Scholar] [CrossRef] [PubMed]
- Lal, S.K.; Craig, A. A critical review of the psychophysiology of driver fatigue. Biol. Psychol. 2001, 55, 173–194. [Google Scholar] [CrossRef]
- Stuldreher, I.V.; Thammasan, N.; Van Erp, J.B.; Brouwer, A.M. Physiological synchrony in EEG, electrodermal activity and heart rate detects attentionally relevant events in time. Front. Neurosci. 2020, 14, 575521. [Google Scholar] [CrossRef]
- Teplan, M. Fundamentals of EEG measurement. Meas. Sci. Rev. 2002, 2, 1–11. [Google Scholar]
- Liu, N.H.; Chiang, C.Y.; Chu, H.C. Recognizing the degree of human attention using EEG signals from mobile sensors. Sensors 2013, 13, 10273–10286. [Google Scholar] [CrossRef]
- Maffei, A.; Angrilli, A. Spontaneous eye blink rate: An index of dopaminergic component of sustained attention and fatigue. Int. J. Psychophysiol. 2018, 123, 58–63. [Google Scholar] [CrossRef]
- Raskin, D.C. Attention and arousal. In Electrodermal Activity in Psychological Research; Academic Press: Cambridge, MA, USA, 1973; pp. 125–155. [Google Scholar]
- Gola, M.; Magnuski, M.; Szumska, I.; Wróbel, A. EEG beta band activity is related to attention and attentional deficits in the visual performance of elderly subjects. Int. J. Psychophysiol. 2013, 89, 334–341. [Google Scholar] [CrossRef]
- Palacios-García, I.; Silva, J.; Villena-González, M.; Campos-Arteaga, G.; Artigas-Vergara, C.; Luarte, N.; Rodríguez, E.; Bosman, C.A. Increase in beta power reflects attentional top-down modulation after psychosocial stress induction. Front. Hum. Neurosci. 2021, 15, 630813. [Google Scholar] [CrossRef]
- Affanni, A.; Najafi, T.A. Drivers’ Attention Assessment by Blink Rate Measurement from EEG Signals. In Proceedings of the 2022 IEEE International Workshop on Metrology for Automotive (MetroAutomotive), Modena, Italy, 4–6 July 2022; pp. 128–132. [Google Scholar]
- Zontone, P.; Affanni, A.; Piras, A.; Rinaldo, R. Stress recognition in a simulated city environment using Skin Potential Response (SPR) signals. In Proceedings of the 2021 IEEE International Workshop on Metrology for Automotive (MetroAutomotive), Bologna, Italy, 1–2 July 2021; pp. 135–140. [Google Scholar]
- Zontone, P.; Affanni, A.; Piras, A.; Rinaldo, R. Exploring Physiological Signal Responses to Traffic-Related Stress in Simulated Driving. Sensors 2022, 22, 939. [Google Scholar] [CrossRef] [PubMed]
- Zontone, P.; Affanni, A.; Bernardini, R.; Del Linz, L.; Piras, A.; Rinaldo, R. Emotional response analysis using electrodermal activity, electrocardiogram and eye tracking signals in drivers with various car setups. In Proceedings of the 2020 28th European Signal Processing Conference (EUSIPCO), Amsterdam, The Netherlands, 18–21 January 2021; pp. 1160–1164. [Google Scholar] [CrossRef]
- Zontone, P.; Affanni, A.; Bernardini, R.; Del Linz, L.; Piras, A.; Rinaldo, R. Analysis of Physiological Signals for Stress Recognition with Different Car Handling Setups. Electronics 2022, 11, 888. [Google Scholar] [CrossRef]
- Affanni, A.; Aminosharieh Najafi, T.; Guerci, S. Development of an EEG Headband for Stress Measurement on Driving Simulators. Sensors 2022, 22, 1785. [Google Scholar] [CrossRef] [PubMed]
- Jasper, H.H. The Ten-Twenty Electrode System of the International Federation. Electroencephalogr. Clin. Neurophysiol. 1958, 10, 371–375. [Google Scholar]
- Affanni, A. Wireless Sensors System for Stress Detection by Means of ECG and EDA Acquisition. Sensors 2020, 20, 2026. [Google Scholar] [CrossRef]
- Delorme, A.; Makeig, S. EEGLAB: An open source toolbox for analysis of single-trial EEG dynamics including independent component analysis. J. Neurosci. Methods 2004, 134, 9–21. [Google Scholar] [CrossRef]
- Hayashi, T.; Okamoto, E.; Nishimura, H.; Mizuno-Matsumoto, Y.; Ishii, R.; Ukai, S. Beta Activities in EEG Associated with Emotional Stress. Int. J. Intell. Comput. Med. Sci. Image Process. 2009, 3, 57–68. [Google Scholar] [CrossRef]
- González, A.; Santapau, M.; Gamundí, A.; Pereda, E.; González, J.J. Modifications in the Topological Structure of EEG Functional Connectivity Networks during Listening Tonal and Atonal Concert Music in Musicians and Non-Musicians. Brain Sci. 2021, 11, 159. [Google Scholar] [CrossRef]
- Kleifges, K.; Bigdely-Shamlo, N.; Kerick, S.E.; Robbins, K.A. Blinker: Automated extraction of ocular indices from eeg enabling large-scale analysis. Front. Neurosci. 2017, 11, 12. [Google Scholar] [CrossRef]
- Affanni, A.; Piras, A.; Rinaldo, R.; Zontone, P. Dual channel Electrodermal activity sensor for motion artifact removal in car drivers’ stress detection. In Proceedings of the 2019 IEEE Sensors Applications Symposium (SAS), Sophia Antipolis, France, 11–13 March 2019; pp. 1–6. [Google Scholar] [CrossRef]
- University of Udine—Laboratory of Sensors and Biosignals—BioSensLab. 2022. Available online: https://www.biosenslab.it (accessed on 15 January 2023).
- Karson, C.N. Physiology of normal and abnormal blinking. Adv. Neurol. 1988, 49, 25–37. [Google Scholar]
- Jongkees, B.; Colzato, L. Spontaneous eye blink rate as predictor of dopamine-related cognitive function—A review. Neurosci. Biobehav. Rev. 2016, 71, 58–82. [Google Scholar] [CrossRef] [PubMed]
- Barbato, G.; Ficca, G.; Muscettola, G.; Fichele, M.; Beatrice, M.; Rinaldi, F. Diurnal variation in spontaneous eye-blink rate. Psychiatry Res. 2000, 93, 145–151. [Google Scholar] [CrossRef] [PubMed]
- Cardona, G.; García, C.; Serés, C.; Vilaseca, M.; Gispets, J. Blink Rate, Blink Amplitude, and Tear Film Integrity during Dynamic Visual Display Terminal Tasks. Curr. Eye Res. 2011, 36, 190–197. [Google Scholar] [CrossRef] [PubMed]
- Zontone, P.; Affanni, A.; Bernardini, R.; Piras, A.; Rinaldo, R. Low-complexity classification algorithm to identify drivers’ stress using electrodermal activity (EDA) measurements. In Biomedical Engineering and Computational Intelligence, Proceedings of The World Thematic Conference—Biomedical Engineering and Computational Intelligence, BIOCOM 2018; Springer International Publishing: Cham, Switzerland, 2020; pp. 25–33. [Google Scholar] [CrossRef]
- Zontone, P.; Affanni, A.; Bernardini, R.; Del Linz, L.; Piras, A.; Rinaldo, R. Supervised learning techniques for stress detection in car drivers. Adv. Sci. Technol. Eng. Syst. J. 2020, 5, 22–29. [Google Scholar] [CrossRef]
- Smith, P.; Shah, M.; da Vitoria Lobo, N. Determining driver visual attention with one camera. IEEE Trans. Intell. Transp. Syst. 2003, 4, 205–218. [Google Scholar] [CrossRef]
- Brandt, T.; Stemmer, R.; Rakotonirainy, A. Affordable visual driver monitoring system for fatigue and monotony. In Proceedings of the 2004 IEEE International Conference on Systems, Man and Cybernetics (IEEE Cat. No. 04CH37583), The Hague, The Netherlands, 10–13 October 2004; Volume 7, pp. 6451–6456. [Google Scholar]
- Baldwin, K.C.; Duncan, D.D.; West, S.K. The driver monitor system: A means of assessing driver performance. Johns Hopkins APL Tech. Dig. 2004, 25, 269–277. [Google Scholar]
- Walter, M.; Eilebrecht, B.; Wartzek, T.; Leonhardt, S. The smart car seat: Personalized monitoring of vital signs in automotive applications. Pers. Ubiquitous Comput. 2011, 15, 707–715. [Google Scholar] [CrossRef]
- Chi, Y.M.; Cauwenberghs, G. Wireless non-contact EEG/ECG electrodes for body sensor networks. In Proceedings of the 2010 International Conference on Body Sensor Networks, Singapore, 7–9 June 2010; pp. 297–301. [Google Scholar]
- Uskovas, G.; Valinevicius, A.; Zilys, M.; Navikas, D.; Frivaldsky, M.; Prauzek, M.; Konecny, J.; Andriukaitis, D. Driver cardiovascular disease detection using seismocardiogram. Electronics 2022, 11, 484. [Google Scholar] [CrossRef]
- Gomez-Clapers, J.; Casanella, R. A fast and easy-to-use ECG acquisition and heart rate monitoring system using a wireless steering wheel. IEEE Sens. J. 2011, 12, 610–616. [Google Scholar] [CrossRef]
- Schires, E.; Georgiou, P.; Lande, T.S. Vital sign monitoring through the back using an UWB impulse radar with body coupled antennas. IEEE Trans. Biomed. Circuits Syst. 2018, 12, 292–302. [Google Scholar] [CrossRef]
- Sidikova, M.; Martinek, R.; Kawala-Sterniuk, A.; Ladrova, M.; Jaros, R.; Danys, L.; Simonik, P. Vital sign monitoring in car seats based on electrocardiography, ballistocardiography and seismocardiography: A review. Sensors 2020, 20, 5699. [Google Scholar] [CrossRef] [PubMed]


| Manual | ADAS1 | ADAS2 | ||||
|---|---|---|---|---|---|---|
| Subject | EBR | Beta Power | EBR | Beta Power | EBR | Beta Power |
| 1 | 2.36 | 8.29 | 9.01 | 4.68 | 9.13 | 6.63 |
| 2 | 25.31 | 8.71 | 31.53 | 6.90 | 43.08 | 9.77 |
| 3 | 8.82 | 13.89 | 12.14 | 5.05 | 9.13 | 4.86 |
| 4 | 22.37 | 6.07 | 39.53 | 4.25 | 41.58 | 5.55 |
| 5 | 10.37 | 10.41 | 9.90 | 6.46 | 15.99 | 6.31 |
| 6 | 7.03 | 7.09 | 9.20 | 4.63 | 9.92 | 7.10 |
| 7 | 9.95 | 8.38 | 34.37 | 5.24 | 30.65 | 6.05 |
| 8 | 5.74 | 7.10 | 9.17 | 4.10 | 7.13 | 17.19 |
| 9 | 5.74 | 7.10 | 21.03 | 9.03 | 15.03 | 12.94 |
| 10 | 6.60 | 5.83 | 13.51 | 4.08 | 11.47 | 6.37 |
| EBR p-Value | |||
|---|---|---|---|
| ADAS1 vs. ADAS2 | Manual vs. ADAS1 | Manual vs. ADAS2 | |
| t-Test | 0.83 | 0.008 | 0.006 |
| Wilcoxon | 0.969 | 0.038 | 0.054 |
| Beta Power p-Value | |||
| t-Test | 0.044 | 0.001 | 0.797 |
| Wilcoxon | 0.025 | 0.003 | 0.326 |
| Subject | Manual | ADAS | ||||||
|---|---|---|---|---|---|---|---|---|
| EBR | Beta Power | SPR RMS | Mean HR | EBR | Beta Power | SPR RMS | Mean HR | |
| 1 | 16.39 | 37.45 | 1.05 | 100.72 | 25.27 | 40.47 | 0.59 | 82.95 |
| 2 | 6.64 | 42.07 | 0.22 | 79.29 | 16.52 | 29.59 | 0.35 | 70.31 |
| 3 | 5.93 | 33.48 | 0.38 | 69.55 | 5.36 | 14.54 | 0.10 | 63.53 |
| 4 | 19.29 | 33.47 | 0.08 | 69.97 | 18.07 | 24.49 | 0.22 | 59.06 |
| 5 | 20.01 | 54.38 | 0.87 | 70.56 | 13.41 | 21.68 | 0.42 | 69.41 |
| 6 | 11.99 | 26.13 | 0.16 | 88.51 | 17.22 | 25.55 | 0.29 | 76.57 |
| 7 | 9.23 | 29.75 | 0.18 | 77.17 | 5.65 | 30.31 | 0.03 | 69.04 |
| 8 | 10.10 | 89.73 | 0.27 | 76.50 | 10.84 | 60.21 | 0.24 | 70.16 |
| 9 | 4.02 | 23.70 | 0.86 | 50.14 | 9.60 | 20.73 | 0.12 | 44.30 |
| 10 | 7.55 | 32.35 | 1.02 | 84.91 | 9.46 | 25.79 | 0.17 | 77.64 |
| 11 | 1.25 | 50.85 | 0.32 | 115.79 | 5.36 | 23.20 | 0.23 | 78.54 |
| 12 | 8.07 | 30.91 | 0.67 | 79.52 | 13.27 | 27.32 | 0.51 | 66.04 |
| 13 | 7.73 | 52.85 | 1.59 | 104.07 | 21.17 | 36.77 | 0.43 | 80.88 |
| 14 | 19.29 | 54.54 | 0.84 | 83.56 | 23.30 | 70.60 | 0.47 | 80.19 |
| 15 | 8.47 | 82.87 | 0.41 | 91.40 | 11.01 | 31.91 | 0.15 | 80.09 |
| 16 | 13.71 | 137.82 | 0.79 | 65.02 | 33.44 | 36.71 | 0.24 | 58.84 |
| 17 | 12.44 | 35.06 | 0.21 | 91.40 | 12.85 | 19.91 | 0.23 | 79.73 |
| mean | 10.71 | 49.85 | 0.58 | 82.24 | 14.81 | 31.75 | 0.28 | 71.02 |
| Measurement | Manual vs. ADAS |
|---|---|
| EBR | 0.017 |
| beta power | 0.013 |
| SPR RMS | 0.004 |
| mean HR | 0.00006 |
| Measurement | Manual vs. ADAS |
|---|---|
| EBR | 0.12 |
| beta power | 0.008 |
| SPR RMS | 0.054 |
| mean HR | 0.033 |
| SPR RMS × mean HR × beta power/EBR | 0.0004 |
Disclaimer/Publisher’s Note: The statements, opinions and data contained in all publications are solely those of the individual author(s) and contributor(s) and not of MDPI and/or the editor(s). MDPI and/or the editor(s) disclaim responsibility for any injury to people or property resulting from any ideas, methods, instructions or products referred to in the content. |
© 2023 by the authors. Licensee MDPI, Basel, Switzerland. This article is an open access article distributed under the terms and conditions of the Creative Commons Attribution (CC BY) license (https://creativecommons.org/licenses/by/4.0/).
Share and Cite
Aminosharieh Najafi, T.; Affanni, A.; Rinaldo, R.; Zontone, P. Driver Attention Assessment Using Physiological Measures from EEG, ECG, and EDA Signals. Sensors 2023, 23, 2039. https://doi.org/10.3390/s23042039
Aminosharieh Najafi T, Affanni A, Rinaldo R, Zontone P. Driver Attention Assessment Using Physiological Measures from EEG, ECG, and EDA Signals. Sensors. 2023; 23(4):2039. https://doi.org/10.3390/s23042039
Chicago/Turabian StyleAminosharieh Najafi, Taraneh, Antonio Affanni, Roberto Rinaldo, and Pamela Zontone. 2023. "Driver Attention Assessment Using Physiological Measures from EEG, ECG, and EDA Signals" Sensors 23, no. 4: 2039. https://doi.org/10.3390/s23042039
APA StyleAminosharieh Najafi, T., Affanni, A., Rinaldo, R., & Zontone, P. (2023). Driver Attention Assessment Using Physiological Measures from EEG, ECG, and EDA Signals. Sensors, 23(4), 2039. https://doi.org/10.3390/s23042039