


Signal Quality Analysis for Long-Term ECG Monitoring Using a Health Patch in Cardiac Patients

 , , , , , and
Abstract
:1. Introduction
2. Materials
2.1. Benchmarking Dataset
- Class 0: Onset–offset beat, P-peak, T-peak, and QRS complex are easily identified.
- Class 1: QRS complex duration is not distinguishable; PR interval and other points in the ECG are unclear.
- Class 2: The QRS complexes and peaks cannot be identified accurately.
2.2. Clinical Study
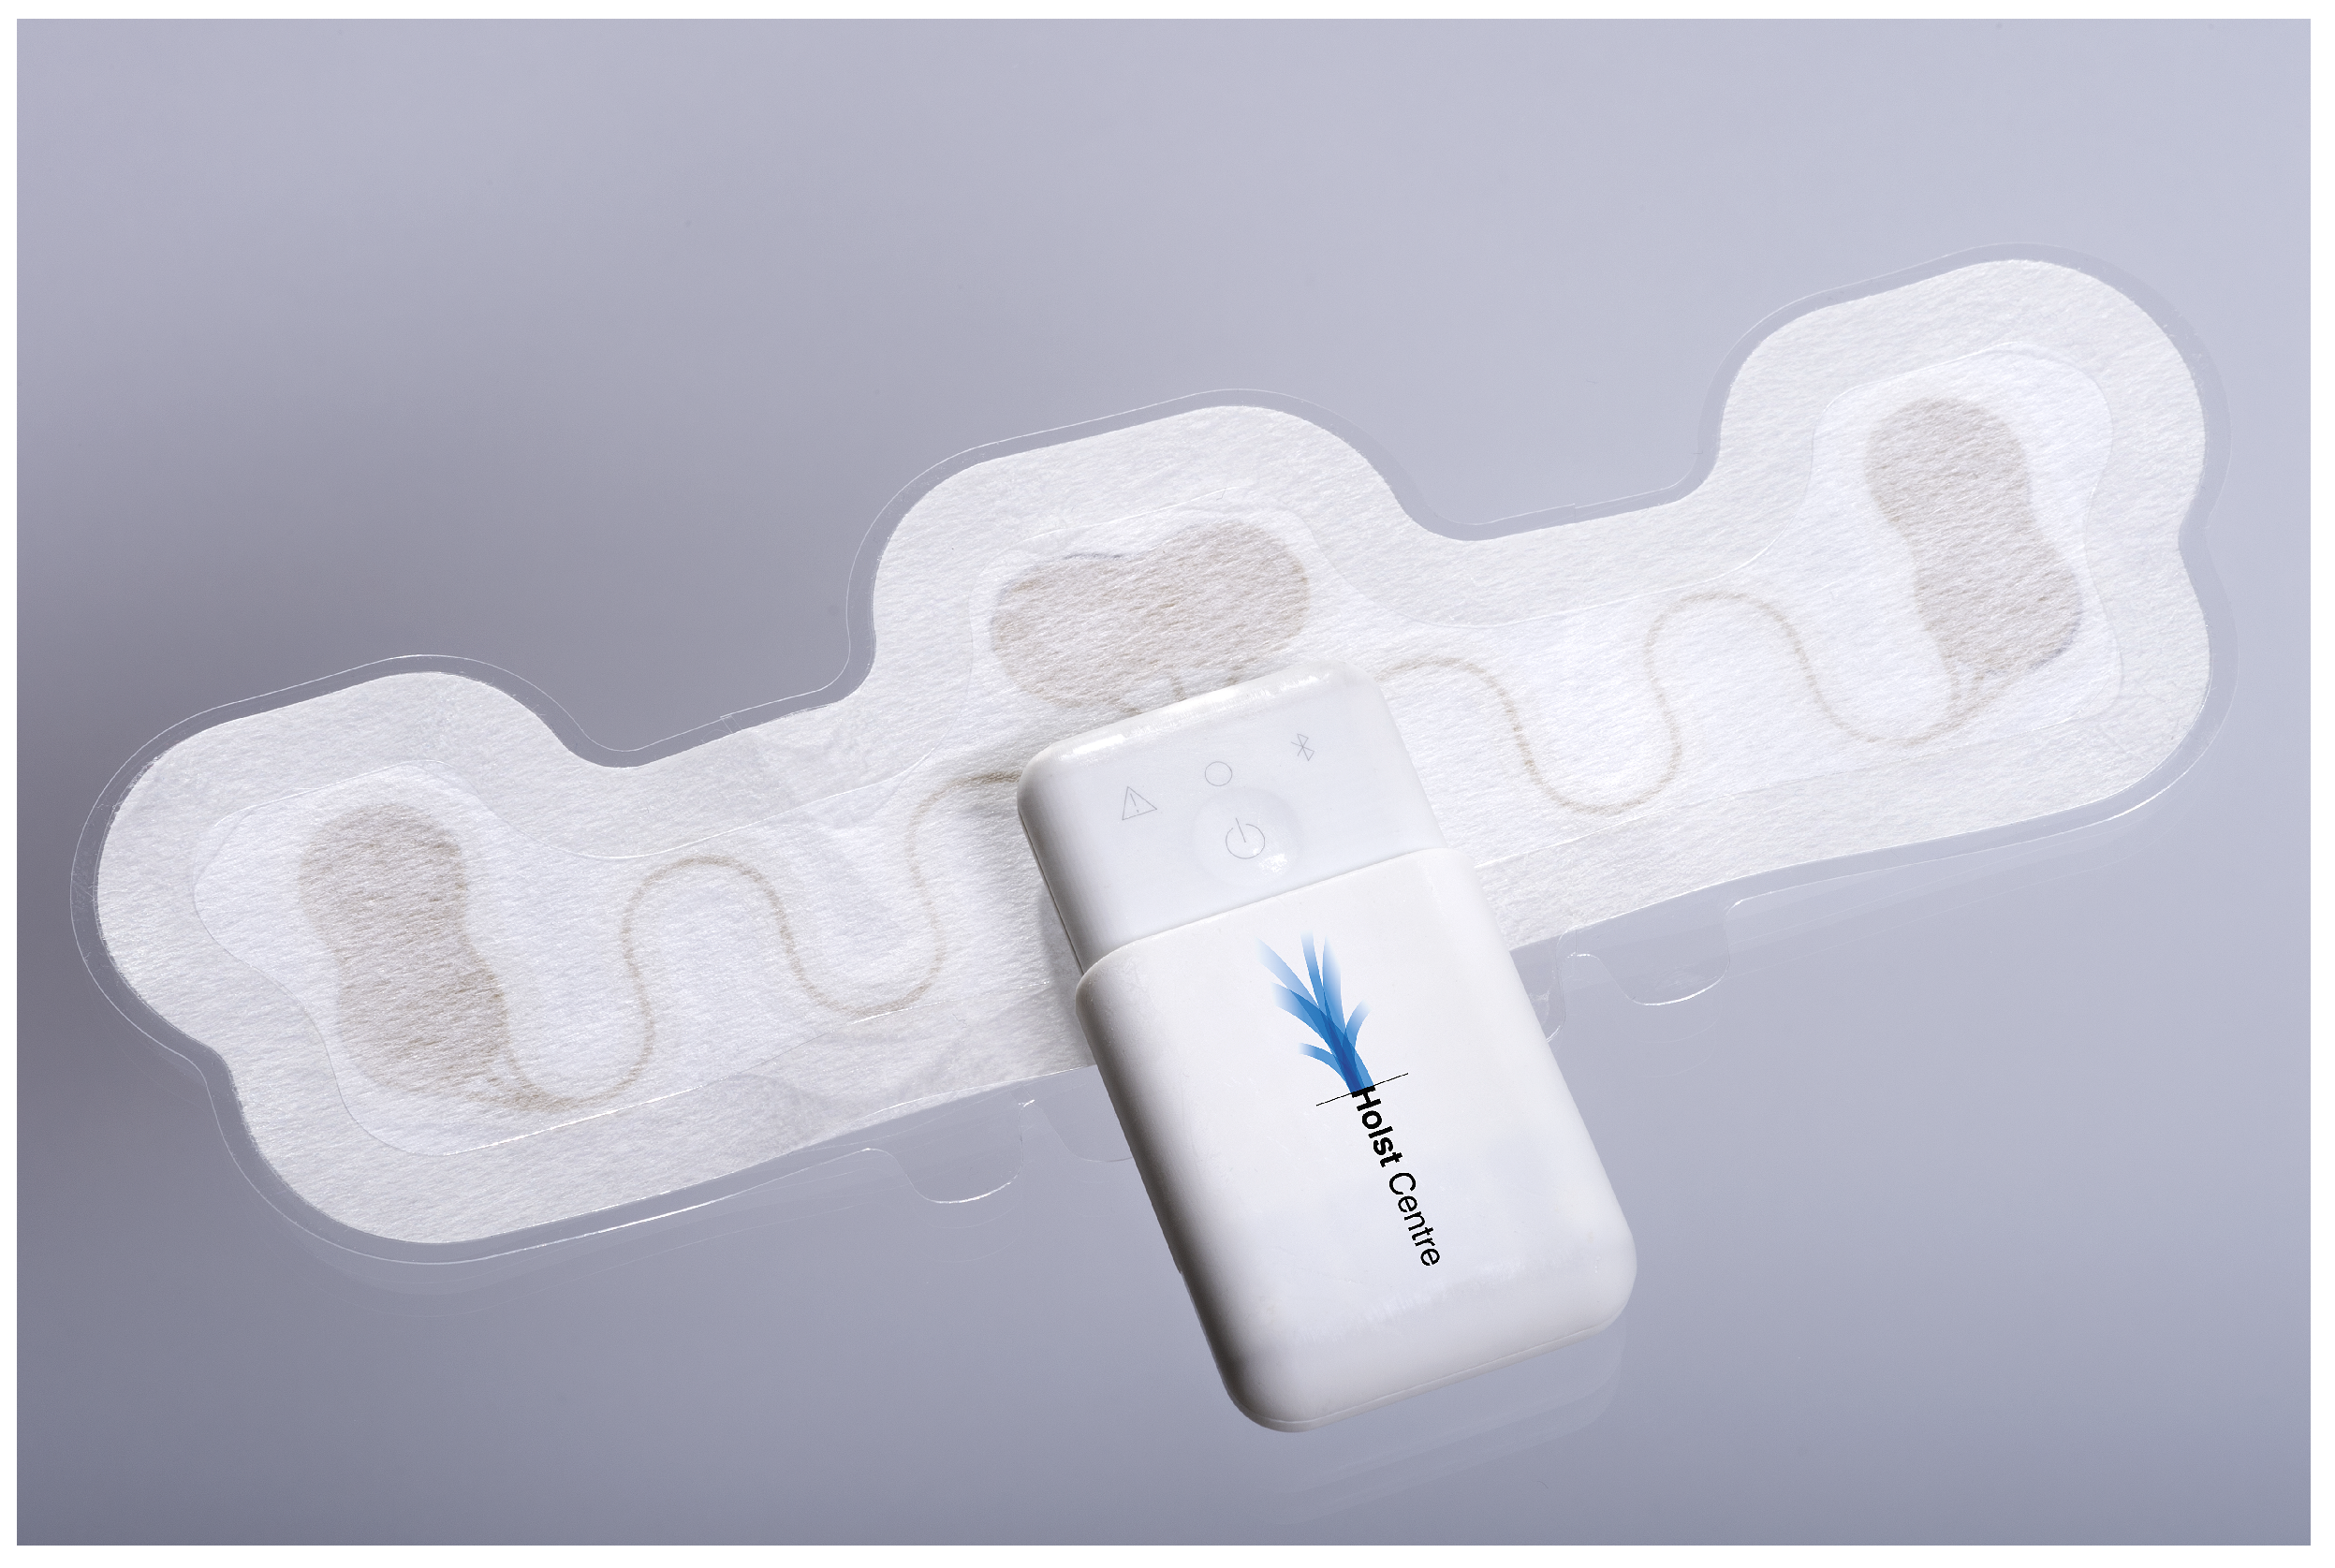
2.2.1. Device
2.2.2. Dataset
3. Methods
- The first stage aimed to find an SQI metric. For this purpose, the benchmarking of four different SQIs on the QDB, introduced in Section 3.2, was performed.
- The second stage analyzed the quality of the data collected on cardiac patients. The best-performing SQI was applied on this dataset and the changes in quality during the days were analyzed.
3.1. Preprocessing
3.2. Signal Quality Indicators
3.2.1. Sqi Based on the Average Qrs Complex ()
3.2.2. Sqi Based on Fuzzy Classifier ()
3.2.3. Sqi Based on Heart Rate Variability ()
3.2.4. Sqi Based on Ecg Morphology ()
3.3. Sqi Comparison
3.4. Analysis of Quality Changes
- Daytime and night: the ECG data was split into daytime (assumed to be from 7:00 to 23:00) and night (assumed to be from 23:00 to 7:00). Boxplots were used to analyze the distribution of the quality of all the windows in the daytime and night moments.
- Full days: the average quality and the standard deviation of all the windows in 24 h were computed. The 24 h were calculated as the hours between 00:00 and 23:59.
4. Results
4.1. Sqi Comparison
4.2. Analysis of Quality Changes
5. Discussion
6. Conclusions
Supplementary Materials
Author Contributions
Funding
Institutional Review Board Statement
Informed Consent Statement
Data Availability Statement
Conflicts of Interest
Abbreviations
| AF | atrial fibrillation |
| Ag/AgCl | silver/silver chloride |
| BPM | beats per minute |
| CCS | chronic coronary syndrome |
| CVD | cardiovascular disease |
| HR | heart rate |
| HRV | heart rate variability |
| QIs | quality indexes |
| RMSSD | root mean square of successive differences between normal heartbeats |
| SD | standard deviation |
| SQI | signal quality indicator |
References
- Nattel, S. New ideas about atrial fibrillation 50 years on. Nature 2002, 415, 219–226. [Google Scholar] [CrossRef] [PubMed]
- Vemmos, K.; Boubouchairopoulou, N.; Stafylas, P.; Vitsou, E.; Giannakoulas, G.; Ntaios, G.; Milionis, H.; Hahalis, G.; Parthenakis, F.; Tsioufis, K. Estimation of the economic burden of atrial fibrillation-related stroke in Greece. Expert Rev. Pharm. Outcomes Res. 2022, 22, 429–435. [Google Scholar] [CrossRef]
- Cotte, F.E.; Chaize, G.; Gaudin, A.F.; Samson, A.; Vainchtock, A.; Fauchier, L. Burden of stroke and other cardiovascular complications in patients with atrial fibrillation hospitalized in France. Europace 2016, 18, 501–507. [Google Scholar] [CrossRef] [PubMed]
- Wilkins, E.; Wilson, L.; Wickramasinghe, K.; Bhatnagar, P.; Leal, J.; Luengo-Fernandez, R.; Burns, R.; Rayner, M.; Townsend, N. European Cardiovascular Disease Statistics 2017 Edition. 2017. Available online: https://ehnheart.org/images/CVD-statistics-report-August-2017.pdf (accessed on 20 January 2023).
- Zoni-Berisso, M.; Lercari, F.; Carazza, T.; Domenicucci, S. Epidemiology of atrial fibrillation: European perspective. Clin. Epidemiol. 2014, 6, 213. [Google Scholar] [CrossRef] [PubMed]
- Garcia, T.B. 12-Lead ECG: The Art of Interpretation; Jones & Bartlett Publishers: Sudbury, MA, USA, 2013. [Google Scholar]
- Fruytier, L.A.; van de Sande, D.A.; Kemps, H.M. Exercise-related major adverse cardiovascular events in asymptomatic recreational master athletes: A case series. Eur. Heart J.-Case Rep. 2022, 6, ytac309. [Google Scholar] [CrossRef] [PubMed]
- Steijlen, A.S.; Jansen, K.M.; Albayrak, A.; Verschure, D.O.; Van Wijk, D.F. A novel 12-lead electrocardiographic system for home use: Development and usability testing. JMIR mHealth uHealth 2018, 6, e10126. [Google Scholar] [CrossRef]
- Tooley, J.E.; Turakhia, M.P. Is it time for a consumerized or home-based 12-lead electrocardiogram? EP Eur. 2022, 24, 357–358. [Google Scholar] [CrossRef]
- Chang, R.K. Resting 12-lead ECG tests performed by patients at home amid the COVID-19 pandemic—Results from the first 1000 patients. J. Electrocardiol. 2022, 73, 108–112. [Google Scholar] [CrossRef] [PubMed]
- Zimetbaum, P.; Goldman, A. Ambulatory arrhythmia monitoring: Choosing the right device. Circulation 2010, 122, 1629–1636. [Google Scholar] [CrossRef] [PubMed]
- Ramasamy, S.; Balan, A. Wearable sensors for ECG measurement: A review. Sens. Rev. 2018, 38, 412–419. [Google Scholar] [CrossRef]
- Hassan, M.F.u.; Lai, D.; Bu, Y. Characterization of Single Lead Continuous ECG Recording with Various Dry Electrodes. In Proceedings of the ICCBB ’19, 2019 3rd International Conference on Computational Biology and Bioinformatics, Association for Computing Machinery, New York, NY, USA, 17 October 2019; pp. 76–79. [Google Scholar]
- Karaoğuz, M.R.; Yurtseven, E.; Aslan, G.; Deliormanlı, B.G.; Adıgüzel, Ö.; Gönen, M.; Li, K.M.; Yılmaz, E.N. The quality of ECG data acquisition, and diagnostic performance of a novel adhesive patch for ambulatory cardiac rhythm monitoring in arrhythmia detection. J. Electrocardiol. 2019, 54, 28–35. [Google Scholar] [CrossRef]
- Steinberg, C.; Philippon, F.; Sanchez, M.; Fortier–Poisson, P.; O’Hara, G.; Molin, F.; Sarrazin, J.F.; Nault, I.; Blier, L.; Roy, K.; et al. A novel wearable device for continuous ambulatory ECG recording: Proof of concept and assessment of signal quality. Biosensors 2019, 9, 17. [Google Scholar] [CrossRef] [PubMed]
- Turakhia, M.P.; Hoang, D.D.; Zimetbaum, P.; Miller, J.D.; Froelicher, V.F.; Kumar, U.N.; Xu, X.; Yang, F.; Heidenreich, P.A. Diagnostic utility of a novel leadless arrhythmia monitoring device. Am. J. Cardiol. 2013, 112, 520–524. [Google Scholar] [CrossRef] [PubMed]
- Rosenberg, M.A.; Samuel, M.; Thosani, A.; Zimetbaum, P.J. Use of a noninvasive continuous monitoring device in the management of atrial fibrillation: A pilot study. Pacing Clin. Electrophysiol. 2013, 36, 328–333. [Google Scholar] [CrossRef] [PubMed]
- Nault, I.; André, P.; Plourde, B.; Leclerc, F.; Sarrazin, J.F.; Philippon, F.; O’Hara, G.; Molin, F.; Steinberg, C.; Roy, K.; et al. Validation of a novel single lead ambulatory ECG monitor–Cardiostat™–Compared to a standard ECG Holter monitoring. J. Electrocardiol. 2019, 53, 57–63. [Google Scholar] [CrossRef]
- Fu, Y.; Zhao, J.; Dong, Y.; Wang, X. Dry electrodes for human bioelectrical signal monitoring. Sensors 2020, 20, 3651. [Google Scholar] [CrossRef]
- Eskandarian, L.; Toossi, A.; Nassif, F.; Golmohammadi Rostami, S.; Ni, S.; Mahnam, A.; Alizadeh Meghrazi, M.; Takarada, W.; Kikutani, T.; Naguib, H.E. 3D-Knit Dry Electrodes using Conductive Elastomeric Fibers for Long-Term Continuous Electrophysiological Monitoring. In Advanced Materials Technologies; Wiley Online Library: Hoboken, NJ, USA, 2022; p. 2101572. [Google Scholar]
- Chlaihawi, A.A.; Narakathu, B.B.; Emamian, S.; Bazuin, B.J.; Atashbar, M.Z. Development of printed and flexible dry ECG electrodes. Sens. Bio-Sens. Res. 2018, 20, 9–15. [Google Scholar] [CrossRef]
- Jung, H.C.; Moon, J.H.; Baek, D.H.; Lee, J.H.; Choi, Y.Y.; Hong, J.S.; Lee, S.H. CNT/PDMS composite flexible dry electrodesfor long-term ECG monitoring. IEEE Trans. Biomed. Eng. 2012, 59, 1472–1479. [Google Scholar] [CrossRef]
- Baek, J.Y.; An, J.H.; Choi, J.M.; Park, K.S.; Lee, S.H. Flexible polymeric dry electrodes for the long-term monitoring of ECG. Sens. Actuators A Phys. 2008, 143, 423–429. [Google Scholar] [CrossRef]
- Yokus, M.A.; Jur, J.S. Fabric-based wearable dry electrodes for body surface biopotential recording. IEEE Trans. Biomed. Eng. 2015, 63, 423–430. [Google Scholar] [CrossRef]
- Oh, T.I.; Yoon, S.; Kim, T.E.; Wi, H.; Kim, K.J.; Woo, E.J.; Sadleir, R.J. Nanofiber web textile dry electrodes for long-term biopotential recording. IEEE Trans. Biomed. Circuits Syst. 2012, 7, 204–211. [Google Scholar]
- Searle, A.; Kirkup, L. A direct comparison of wet, dry and insulating bioelectric recording electrodes. Physiol. Meas. 2000, 21, 271. [Google Scholar] [CrossRef] [PubMed]
- Meziane, N.; Webster, J.; Attari, M.; Nimunkar, A. Dry electrodes for electrocardiography. Physiol. Meas. 2013, 34, R47. [Google Scholar] [CrossRef] [PubMed]
- Jabaudon, D.; Sztajzel, J.; Sievert, K.; Landis, T.; Sztajzel, R. Usefulness of ambulatory 7-day ECG monitoring for the detection of atrial fibrillation and flutter after acute stroke and transient ischemic attack. Stroke 2004, 35, 1647–1651. [Google Scholar] [CrossRef] [PubMed]
- Barrett, P.M.; Komatireddy, R.; Haaser, S.; Topol, S.; Sheard, J.; Encinas, J.; Fought, A.J.; Topol, E.J. Comparison of 24-hour Holter monitoring with 14-day novel adhesive patch electrocardiographic monitoring. Am. J. Med. 2014, 127, 95-e11. [Google Scholar] [CrossRef]
- Smital, L.; Haider, C.R.; Vitek, M.; Leinveber, P.; Jurak, P.; Nemcova, A.; Smisek, R.; Marsanova, L.; Provaznik, I.; Felton, C.L.; et al. Real-time quality assessment of long-term ECG signals recorded by wearables in free-living conditions. IEEE Trans. Biomed. Eng. 2020, 67, 2721–2734. [Google Scholar] [CrossRef]
- Cai, Z.; Li, J.; Zhang, X.; Shen, Q.; Murray, A.; Liu, C. How accurate are ECG parameters from wearable single-lead ECG system for 24-hours monitoring. In Proceedings of the 2019 Computing in Cardiology (CinC), IEEE, Singapore, 8–11 September 2019; pp. 1–4. [Google Scholar]
- Mahmoudinejad, S.A.; Safdarian, N. Evaluating morphological features of electrocardiogram signals for diagnosing of myocardial infarction using classification-based feature selection. J. Med. Signals Sens. 2021, 11, 79. [Google Scholar]
- Nemcova, A.; Smisek, R.; Opravilová, K.; Vitek, M.; Smital, L.; Maršánová, L.; Brno University of Technology ECG Quality Database (BUT QDB). PhysioNet. 2020. Available online: https://physionet.org/content/butqdb/1.0.0/ (accessed on 20 January 2023).
- Van Rossum, G.; Drake, F.L., Jr. Python Reference Manual; Centrum voor Wiskunde en Informatica: Amsterdam, The Netherlands, 1995. [Google Scholar]
- Makowski, D.; Pham, T.; Lau, Z.J.; Brammer, J.C.; Lespinasse, F.; Pham, H.; Schölzel, C.; Chen, S.H.A. NeuroKit2: A Python toolbox for neurophysiological signal processing. Behav. Res. Methods 2021, 53, 1689–1696. [Google Scholar] [CrossRef]
- Varon, C.; Morales, J.; Lázaro, J.; Orini, M.; Deviaene, M.; Kontaxis, S.; Testelmans, D.; Buyse, B.; Borzée, P.; Sörnmo, L.; et al. A Comparative Study of ECG-derived Respiration in Ambulatory Monitoring using the Single-lead ECG. Sci. Rep. 2020, 10, 5704. [Google Scholar] [CrossRef]
- Rahman, S.; Karmakar, C.; Natgunanathan, I.; Yearwood, J.; Palaniswami, M. Robustness of electrocardiogram signal quality indices. J. R. Soc. Interface 2022, 19, 20220012. [Google Scholar] [CrossRef]
- Zhao, Z.; Zhang, Y. SQI quality evaluation mechanism of single-lead ECG signal based on simple heuristic fusion and fuzzy comprehensive evaluation. Front. Physiol. 2018, 9, 727. [Google Scholar] [CrossRef]
- Lipponen, J.A.; Tarvainen, M.P. A robust algorithm for heart rate variability time series artefact correction using novel beat classification. J. Med. Eng. Technol. 2019, 43, 173–181. [Google Scholar] [CrossRef]
- European Society of Cardiology the North American Society of Pacing Electrophysiology. Heart rate variability: Standards of measurement, physiological interpretation, and clinical use. Circulation 1996, 93, 1043–1065. [Google Scholar] [CrossRef]
- Bigger, J.T.; Fleiss, J.L.; Steinman, R.C.; Rolnitzky, L.M.; Schneider, W.J.; Stein, P.K. RR Variability in Healthy, Middle-Aged Persons Compared With Patients With Chronic Coronary Heart Disease or Recent Acute Myocardial Infarction. Circulation 1995, 91, 1936–1943. [Google Scholar] [CrossRef] [PubMed]
- Orphanidou, C.; Bonnici, T.; Charlton, P.; Clifton, D.; Vallance, D.; Tarassenko, L. Signal-Quality Indices for the Electrocardiogram and Photoplethysmogram: Derivation and Applications to Wireless Monitoring. IEEE J. Biomed. Health Inform. 2015, 19, 832–838. [Google Scholar] [CrossRef]
- Zhao, L.; Li, P.; Li, J.; Liu, C. Influence of ectopic beats on heart rate variability analysis. Entropy 2021, 23, 648. [Google Scholar] [CrossRef] [PubMed]
- Cysarz, D.; Lange, S.; Matthiessen, P.F.; Leeuwen, P.v. Regular heartbeat dynamics are associated with cardiac health. Am. J. Physiol.-Regul. Integr. Comp. Physiol. 2007, 292, R368–R372. [Google Scholar] [CrossRef]
- Estévez-Báez, M.; Carricarte-Naranjo, C.; Jas-García, J.D.; Rodríguez-Ríos, E.; Machado, C.; Montes-Brown, J.; Leisman, G.; Schiavi, A.; Machado-García, A.; Luaces, C.S.; et al. Influence of heart rate, age, and gender on heart rate variability in adolescents and young adults. In Advances in Medicine and Medical Research; Springer: Cham, Switzerland, 2018; pp. 19–33. [Google Scholar]
- Saul, J.P.; Berger, R.D.; Albrecht, P.; Stein, S.; Chen, M.H.; Cohen, R. Transfer function analysis of the circulation: Unique insights into cardiovascular regulation. Am. J. Physiol.-Heart Circ. Physiol. 1991, 261, H1231–H1245. [Google Scholar] [CrossRef]
- Allen, J.; Murray, A. Assessing ECG signal qu ality on a coronary care unit. Physiol. Meas. 1996, 17, 249. [Google Scholar] [CrossRef]


| Characteristic | Values (n = 15) |
|---|---|
| Age (years) | 40.6 ± 19.64 |
| Male (n,%) | 6 (40) |
| BMI (kg/m2) | 22.82 ± 3.98 |
| Characteristic | Values (n = 6) |
|---|---|
| Age (years) | 69.8 ± 6.2 |
| Male (n, %) | 6 (100) |
| BMI (kg/mm2) | 25.3 ± 1.8 |
| Patient ID | Usable Data (Hours) | HR Max | ||
|---|---|---|---|---|
| 2–4 | Total | Daytime | Night | |
| 1 | 118.8 | 78.9 | 39.9 | 151 |
| 2 | 117.03 | 78.03 | 39.01 | 96 |
| 3 | 99.0 | 67.2 | 31.8 | 137 |
| 4 | 119.97 | 80.08 | 39.9 | 127 |
| 5 | 119.6 | 79.7 | 39.9 | 166 |
| 6 | 52.8 | 36.8 | 16.0 | 139 |
| Cumulative | 627.19 | 420.71 | 206.51 | NA |
| QDB | ||
|---|---|---|
| Class 0 | Excellent | SQI |
| Class 1 | Barely Acceptable | SQI |
| Class 2 | Unacceptable | SQI |
| Symbol | Meaning |
|---|---|
| ns | p-value > 0.05 |
| * | p-value ≤ 0.05 |
| * | p-value ≤ 0.01 |
| ** | p-value ≤ 0.001 |
| *** | p-value ≤ 0.0001 |
| Day | 2 | 3 | 4 | 5 | 6 |
|---|---|---|---|---|---|
| p-value | 0.68571 | 0.4857 | 1.0 | 0.48571 | 0.88571 |
Disclaimer/Publisher’s Note: The statements, opinions and data contained in all publications are solely those of the individual author(s) and contributor(s) and not of MDPI and/or the editor(s). MDPI and/or the editor(s) disclaim responsibility for any injury to people or property resulting from any ideas, methods, instructions or products referred to in the content. |
© 2023 by the authors. Licensee MDPI, Basel, Switzerland. This article is an open access article distributed under the terms and conditions of the Creative Commons Attribution (CC BY) license (https://creativecommons.org/licenses/by/4.0/).
Share and Cite
Campero Jurado, I.; Lorato, I.; Morales, J.; Fruytier, L.; Stuart, S.; Panditha, P.; Janssen, D.M.; Rossetti, N.; Uzunbajakava, N.; Serban, I.B.; et al. Signal Quality Analysis for Long-Term ECG Monitoring Using a Health Patch in Cardiac Patients. Sensors 2023, 23, 2130. https://doi.org/10.3390/s23042130
Campero Jurado I, Lorato I, Morales J, Fruytier L, Stuart S, Panditha P, Janssen DM, Rossetti N, Uzunbajakava N, Serban IB, et al. Signal Quality Analysis for Long-Term ECG Monitoring Using a Health Patch in Cardiac Patients. Sensors. 2023; 23(4):2130. https://doi.org/10.3390/s23042130
Chicago/Turabian StyleCampero Jurado, Israel, Ilde Lorato, John Morales, Lonneke Fruytier, Shavini Stuart, Pradeep Panditha, Daan M. Janssen, Nicolò Rossetti, Natallia Uzunbajakava, Irina Bianca Serban, and et al. 2023. "Signal Quality Analysis for Long-Term ECG Monitoring Using a Health Patch in Cardiac Patients" Sensors 23, no. 4: 2130. https://doi.org/10.3390/s23042130
APA StyleCampero Jurado, I., Lorato, I., Morales, J., Fruytier, L., Stuart, S., Panditha, P., Janssen, D. M., Rossetti, N., Uzunbajakava, N., Serban, I. B., Rikken, L., de Kok, M., Vanschoren, J., & Brombacher, A. (2023). Signal Quality Analysis for Long-Term ECG Monitoring Using a Health Patch in Cardiac Patients. Sensors, 23(4), 2130. https://doi.org/10.3390/s23042130