1. Introduction
Cardiovascular diseases (CVD) represent a major societal and economic burden [
1], with specific cardiac events and symptoms such as embolic stroke, heart failure, or atrial fibrillation (AF) incorporating a large portion of healthcare costs [
2,
3], e.g., Eur 210 billion a year in Europe (2017) [
4]. Considering AF alone, it is predicted that, by 2030, 15.9 million people in the US and 14–17 million people in Europe will suffer from AF [
5]. Electrocardiography (ECG) is an important tool for the diagnosis and evaluation of patients with CVD. A 12-lead wired ECG system is currently used in clinical practice to provide the highest resolution and best visualization of the entire heart for clinical assessment [
6]. An exercise ECG can provide additional information about the heart during stress. Therefore, long-term monitoring during physical activities in home settings will potentially lead to a more accurate diagnosis and prevention of CVD in specific populations [
7].
The traditional 12-lead design is not well suited for prolonged patient monitoring at home, while dedicated 12-lead systems for short-term home monitoring start to populate the market [
8,
9,
10], they are not designed to provide comfortable and long-term continuous monitoring in home settings. This problem has been addressed with the use of Holter monitors, which are wearable devices for heart rate monitoring that provide ECG signal acquisition for 24–72 h. Newer Holter devices can record for longer periods of up to 2 weeks [
11]. However, the wired framework of the Holter and the use of wet gel electrodes increases the likelihood of measurement noise during motion [
12,
13] and reduces wear possibilities, e.g., it cannot be used during showering and necessitates replacement of the wet gel electrodes upon drying out of the gel.
In the past few years, sensors and technologies have been proposed to allow monitoring of patients at home and in everyday activities [
14,
15,
16,
17,
18], with the majority being single-lead ECG solutions (also known as health patches), which in most cases rely on using wet resistive gel electrodes. Wet resistive gel electrodes will dehydrate after a few days of usage, eventually limiting long-term usability and reducing the quality of the signal over time [
19,
20]. Therefore, self-adhesive dry electrodes have been explored as alternatives since they can extend the duration of monitoring [
21,
22,
23,
24,
25]. Studies show that dry electrodes behave better in terms of impedance and noise reduction performance than Ag/AgCl electrodes if properly shielded [
26,
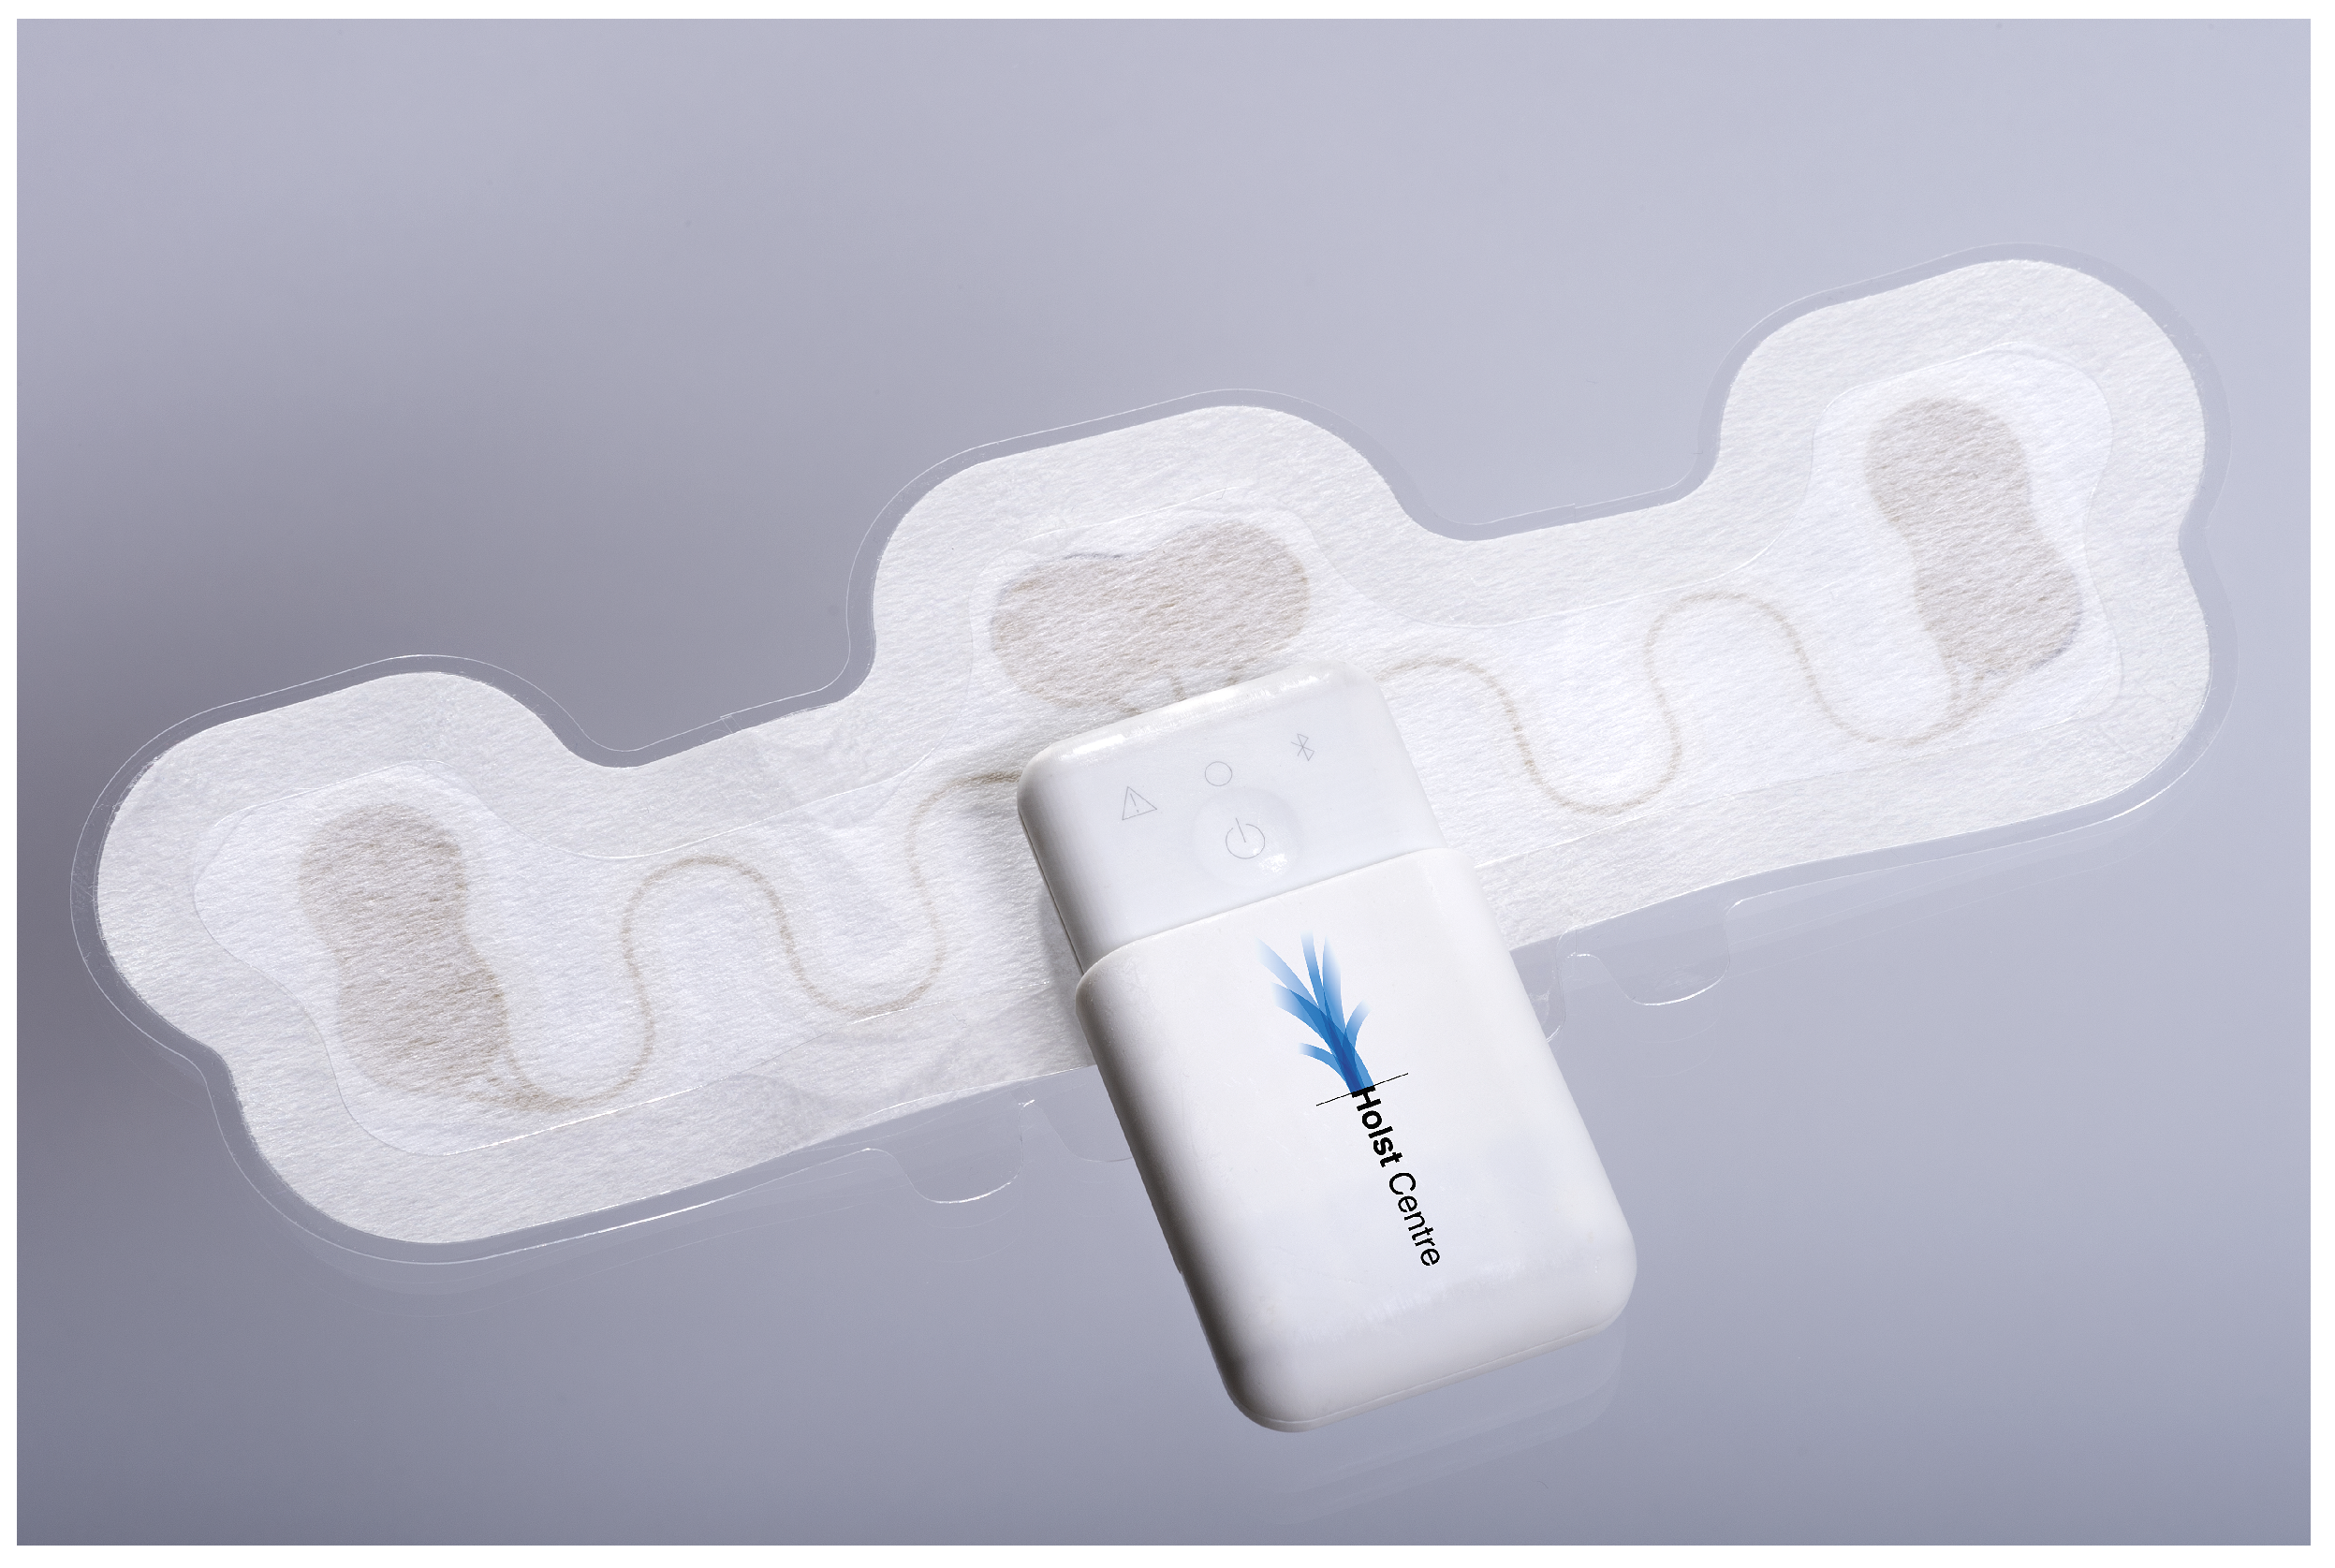
27]. Within this study, a
Vital Signs patch research platform (TNO Holst Centre.
https://executivereport.holstcentre.com/innovation-updates/health-vitality/health-patch/ accessed on 20 January 2023) was used to ensure optimized skin–electrode contact for longer-term wear within a hybrid printed electronic format. Self-adhesive dry electrode technology was used and the overall patch was designed to be thin, durable, and lightweight for use in all daily activities.
Examples of using health patches for CVD monitoring include the detection of AF/flutter, for example in [
28] a patch device was used for AF screening. AF was identified in 5.7% of patients who did not show any evidence of AF in normal ECG and Holter monitoring. Other studies with health patches were focused on comparing the performance of such devices against Holter monitoring systems in detecting CVD, where the single-lead health patches identified most of the arrhythmia events and showed a beat-per-minute correlation compared to the Holter system higher than 90% [
14,
15,
16,
17,
18]. Health patches have also been reported to correctly identify more cardiac events than the Holter monitor in remote settings over a prolonged use period [
29].
Signal quality monitoring is a paramount initial step for ECG analysis and cardiac markers or event detection. Currently, different metrics can be used for ECG signal quality assessment: signal-to-artifact ratio [
13], signal-to-noise ratio [
30], beats per minute (BPM) [
31], and other derived features such as the slowest, the average, and the fastest heart rate (HR) [
32]. However, previous studies did not assess the change in signal quality over time, which is an important factor in characterizing single-lead patches and possibly improving the materials used and the design.
The goal of this work is to analyze the quality of ECG signals recorded in a home setting during five consecutive days using a Vital Signs patch featuring self-adhesive dry electrodes technology. The changes in quality were studied between the days and between daytime and night. To address the goal we have selected a two-step approach. The first step is the comparison of four algorithms for signal quality assessment. As this requires a gold standard, a publicly available database with annotated quality was used. Afterward, the best-performing quality metric was applied to an ECG dataset collected on six patients with chronic coronary syndrome (CCS) who wore the Vital Signs patch for 5 days continuously.
The paper is organized as follows:
Section 2 presents the datasets used and the experimental setup. Methods and algorithms used are detailed in
Section 3, and
Section 4 shows the results of our approach. Finally,
Section 5 and
Section 6 discuss the results and provide conclusions and future work suggestions.
5. Discussion
Four SQIs have been compared in this work using the QDB dataset since quality annotations were available.
was the best performing SQI, with not only the highest overall accuracy but also a more balanced performance in all the classes compared to the other three SQIs. It should be considered that the performance of
could be improved with an adaptation of the number of standard deviations. However, considering our targeted subject group, cardiac patients, an SQI based on HRV may not be suitable due to the abnormal beats, given the fact that indexes derived from HRV are significantly affected by irregular heartbeats [
43], which commonly occur in heart diseased populations [
44]. Furthermore, HRV is known to change based on many variables, such as ageing, gender, or medication intake [
45,
46].
resulted in being too optimistic in the quality scores, misclassifying almost all the segments with unacceptable quality.
, on the other hand, was the lowest performing SQI. Approaches based on an average template are implicitly assuming the overall quality of the segment is acceptable. However, depending on the used window size this may not be the case, for example, due to the presence of motion artifacts.
Considering the dataset recorded with the cardiac patients, it is worth mentioning that, as already mentioned in
Section 2, data loss was present. There could be a link between the data loss and the activities performed by the patients. For example, in the case of patient 6, the data was not recorded after the third day, this could be due to poor electrode contact and motion artifacts since the patient performed three long cycling sessions for 174, 140, and 240 min on days 3, 4, and 6, respectively, as visible in
Table S1. However, further analysis and evaluations are required to reach a conclusion on this point.
The best performing SQI, , was applied in the cardiac dataset. The SQIs may have different performances with cardiac patients since their ECG signals could include for example arrhythmia, premature ventricular contractions, or premature atrial contractions. A preprocessing step to discard irregular QRS complexes was indeed included to mitigate the effect that possible differences in ECG morphology were expected in this population. To further assess if the performance of the SQI is comparable between the two populations, quality annotations of the cardiac dataset are required. This should be considered in future works.
By comparing the distributions of the quality assessed per minute between daytime and night, differences can be observed. In
Figure 8, the median of the quality during the night is consistently higher compared to the daytime. This was already expected as there were fewer motion artifacts and resting HR led to a better morphology [
47]. Patient 3 is the only one with a median quality below 0.5 for most days (4 out of 5), along with the lowest quality during the nights. Considering the quality was already poor from day one, it is possible that the patch was not properly applied. Overall, the median quality for patient 6 is particularly low during the daytime compared to all the other patients but not during the night. As mentioned above, this could be associated with the amount of physical activity performed since, according to the diary visible in
Table S1, patient 6 had a total of 650 min of physical activity, being the second most active person after patient 3 (1070 min). In the statistical test performed to compare daytime and night, all patients had all or a majority of
p-values
. Therefore, the quality during the daytime is not directly associated with the quality at night and the difference between the quality in the two cases is statistically significant.
Figure 10 presents the average and the standard deviation of the quality during full days. Patient 3, as already mentioned, has the worst quality with the average quality in all the days being below
. The average quality of both patients 2 and 3 decreases after the third day. The Wilcoxon–Mann–Whitney test was performed to assess whether there is a significant difference between the average qualities of the baseline (day 1) and the average qualities of days 2–6 for all the patients. The results suggest there is no statistically significant change in quality over time. Therefore, even if there are changes in quality during the days, these changes are not statistically significant in all patients.
This study can be considered a first pilot for the use of the Vital Signs patch in cardiac patients. The use of wearable technologies in this population could lead to more accurate CVD screening and diagnosis. However, differences in the ECG morphology in this population compared to the healthy subjects group need to be expected. By analyzing patients, we can find the activities that degrade ECG signal quality (such as biking) and use this to find future solutions from experimental setup to data processing. Therefore, SQIs, which represent an important initial step for ECG signals evaluation before further processing (e.g., automated cardiac events detection), should be further developed taking into account the targeted population. Quality annotations on ECG collected on cardiac patients are required to further develop in this direction.


 ,
, 


