Article

Advantageous Strain Sensing Performances of FBG Strain Sensors Equipped with Planar UV-Curable Resin

1
Key Laboratory of Optoelectronic Devices and Systems of Ministry of Education and Guangdong Province, College of Physics and Optoelectronic Engineering, Shenzhen University, Shenzhen 518060, China
2
Optical Fiber Sensing Engineering Technology R&D Center of Guangdong Province, T&S Communications Co., Ltd., Shenzhen 518118, China
*
Authors to whom correspondence should be addressed.
Sensors 2023, 23(5), 2811; https://doi.org/10.3390/s23052811
Submission received: 31 January 2023 / Revised: 1 March 2023 / Accepted: 2 March 2023 / Published: 3 March 2023
(This article belongs to the Section Optical Sensors)

Abstract

:
The existing optical strain sensors based on fiber Bragg grating (FBG) have limitations, such as a complex structure, a limited strain range (±200 με) and poor linearity performance (R-squared value < 0.9920); these limitations affect their potential practical applications. Here, four FBG strain sensors equipped with planar UV-curable resin are investigated. The proposed FBG strain sensors have a simple structure, a large strain range (±1800 με) and excellent linearity performance (R-squared value ≥ 0.9998); they further produce the following performances: (1) good optical properties, including an undistorted Bragg peak shape, narrow bandwidth (−3 dB bandwidth ≤ 0.65 nm) and a high side mode suppression ratio (SMSR, the absolute value of SMSR ≥ 15 dB); (2) good temperature sensing properties with high temperature sensitivities (≥47.7 pm/°C) and a good linearity performance (R-squared value ≥ 0.9990); and (3) excellent strain sensing properties with no hysteresis behavior (hysteresis error ≤ 0.058%) and excellent repeatability (repeatability error ≤ 0.045%). Based on their excellent properties, the proposed FBG strain sensors are expected to be applied as high-performance strain sensing devices.

1. Introduction

Surface strain measurement is one of the most important monitoring methods for the structural health monitoring of aerospace, civil and mechanical engineering buildings and infrastructures [1,2]. As a measuring tool, electric strain gauge (ESG) sensors are widely used to monitor surface strain [1,2,3,4]. However, in some harsh environments, such as those with high temperatures, high radiation and high pressures [5], ESG sensors are not suitable for strain monitoring because of their disadvantages of non-insulation, susceptibility to electromagnetic interference and a short lifetime [6]. However, fiber Bragg grating (FBG) sensors have received extensive attention and are very suitable for harsh environment applications due to possessing many excellent advantages, such as electrical isolation, multiplexing, long-service life and immunity to electromagnetic interference [7,8]. Typically, FBG sensors are often used to measure temperature [9,10] and strain [11,12]. However, an important limitation of the engineering applications of FBG sensors is the sensitivity of the wavelength to both temperature and strain [13]. To address this problem, Nascimento et al. used the reference FBG method to discriminate the temperature and bidirectional strain [14]. Mokhtar et al. enhanced the discrimination between the temperature and strain in real sensing applications by designing a sensor packaging structure [15]. In addition, a hybrid sensing network (constituting of an FBG and Fabry-Perot cavity) was proposed to discriminate the temperature and strain in 2019 [16]. Moreover, Huang et al. decoupled temperature and stress by adjusting fiber morphologies [17]. As a common FBG sensor, the FBG strain sensors are often used to measure the deformation of a structure [18,19]. Typically, uncoated FBG strain sensors have a strain sensitivity of 1.2 pm/με for a Bragg wavelength of 1550 nm. To enhance the strain sensitivity of FBG strain sensors, a sensitivity-enhanced FBG strain sensor based on a substrate with a lever structure was developed by Li et al. [20]. In addition, a higher sensitivity FBG strain sensor based on a flexible hinge bridge displacement magnification structure was designed by Liu et al. [21]. However, the structural complexity of the abovementioned FBG strain sensors is a real challenge. In addition, the strain range (±200 με) of the abovementioned FBG strain sensors is limited because of the use of an uncoated FBG with low mechanical strength. However, material-coated (such as metal-coated or polymer-coated) FBG sensors have high mechanical strength [22,23]. Recently, a novel Fabry-Perot interferometer (FPI) fabrication method based on ultraviolet (UV)-resin coating was proposed [24]. The linear relationship curves of the wavelength and the strain for FPI based on UV- curable resin were obtained; however, the linearity performance of the FPI was not sufficient (i.e., R-squared value < 0.9990) [25]. Moreover, the linearity performance of the UV-resin coated FBG sensors was even lower (i.e., R-squared value < 0.9920) [26]. In addition, resin coated composite samples with polarimetric fiber or highly birefringent fiber sensors embedded in the multi-layer composite structure are fabricated [27,28], but the strain linearity of the polarimetric fiber sensors (R-squared value ≤ 0.9992), the hysteresis behavior and the repetition of the sensors were limited. The abovementioned limitations, i.e., the complex structure, limited strain range and poor linearity performance, affect their potential practical applications.
In this study, four FBG strain sensors equipped with planar UV-curable resin are fabricated. The proposed FBG strain sensors have a simple structure, a large strain range (±1800 με) and an excellent linearity performance (R-squared value ≥ 0.9998). In addition, the hysteresis behavior and the repeatability of the four FBG strain sensors are discussed. The experimental results show that the four FBG strain sensors have excellent strain sensing properties, including no hysteresis behavior (hysteresis error ≤ 0.058%) and excellent repeatability (repeatability error ≤ 0.045%). Because of these advantages, the proposed FBG strain sensors are anticipated to be applied as high-performance strain sensing devices.

2. Principle and Fabrication of the FBG Strain Sensor

2.1. Principle of the Uncoated FBG and Coated FBG

The FBG is a kind of periodic refractive index modulation structure along with the fiber core and is fabricated by exposing the photosensitized fiber core to ultraviolet (UV) light. The structure and principle of the uncoated FBG are illustrated in Figure 1a. If incident/broadband light is directed into the FBG, it will reflect a narrowband spectral component (i.e., the reflected light), called the Bragg wavelength ( λ B ). According to Bragg’s law, the Bragg wavelength is expressed as follows [21]:
λ B = 2 n e f f Λ
where n e f f is the effective refractive index of the fiber core and Λ is the grating period. The Bragg wavelength will be shifted when the FBG is exposed to an external physical perturbation, such as heat and stress. The Bragg wavelength shift ( Δ λ ) induced by ambient temperature change ( Δ T ) and the axial strain acting on the FBG ( ε ) is expressed as follows [21]:
Δ λ / λ B = ( 1 P e ) ε + ( α + ξ ) Δ T
where P e , α and ξ are the photo-elastic constant, thermal expansion coefficient and thermo-optic coefficient of the optical fiber, respectively. If the ambient temperature does not change, Equation (2) will be expressed as follows:
Δ λ / λ B = ( 1 P e ) ε
typically, the strain sensitivity of an uncoated FBG is approximately 1.2 pm/με when λ B = 1550   nm and P e = 0.22 . However, for a material coated FBG, the strain sensitivity has a slight difference due to the presence of the coated material. Figure 1b shows the structure and left view of the FBG coated with a planar UV-curable resin. The planar UV-curable resin requires UV-irradiation and heating treatment. As shown in Figure 1b, the FBG is completely embedded into the planar UV-curable resin.

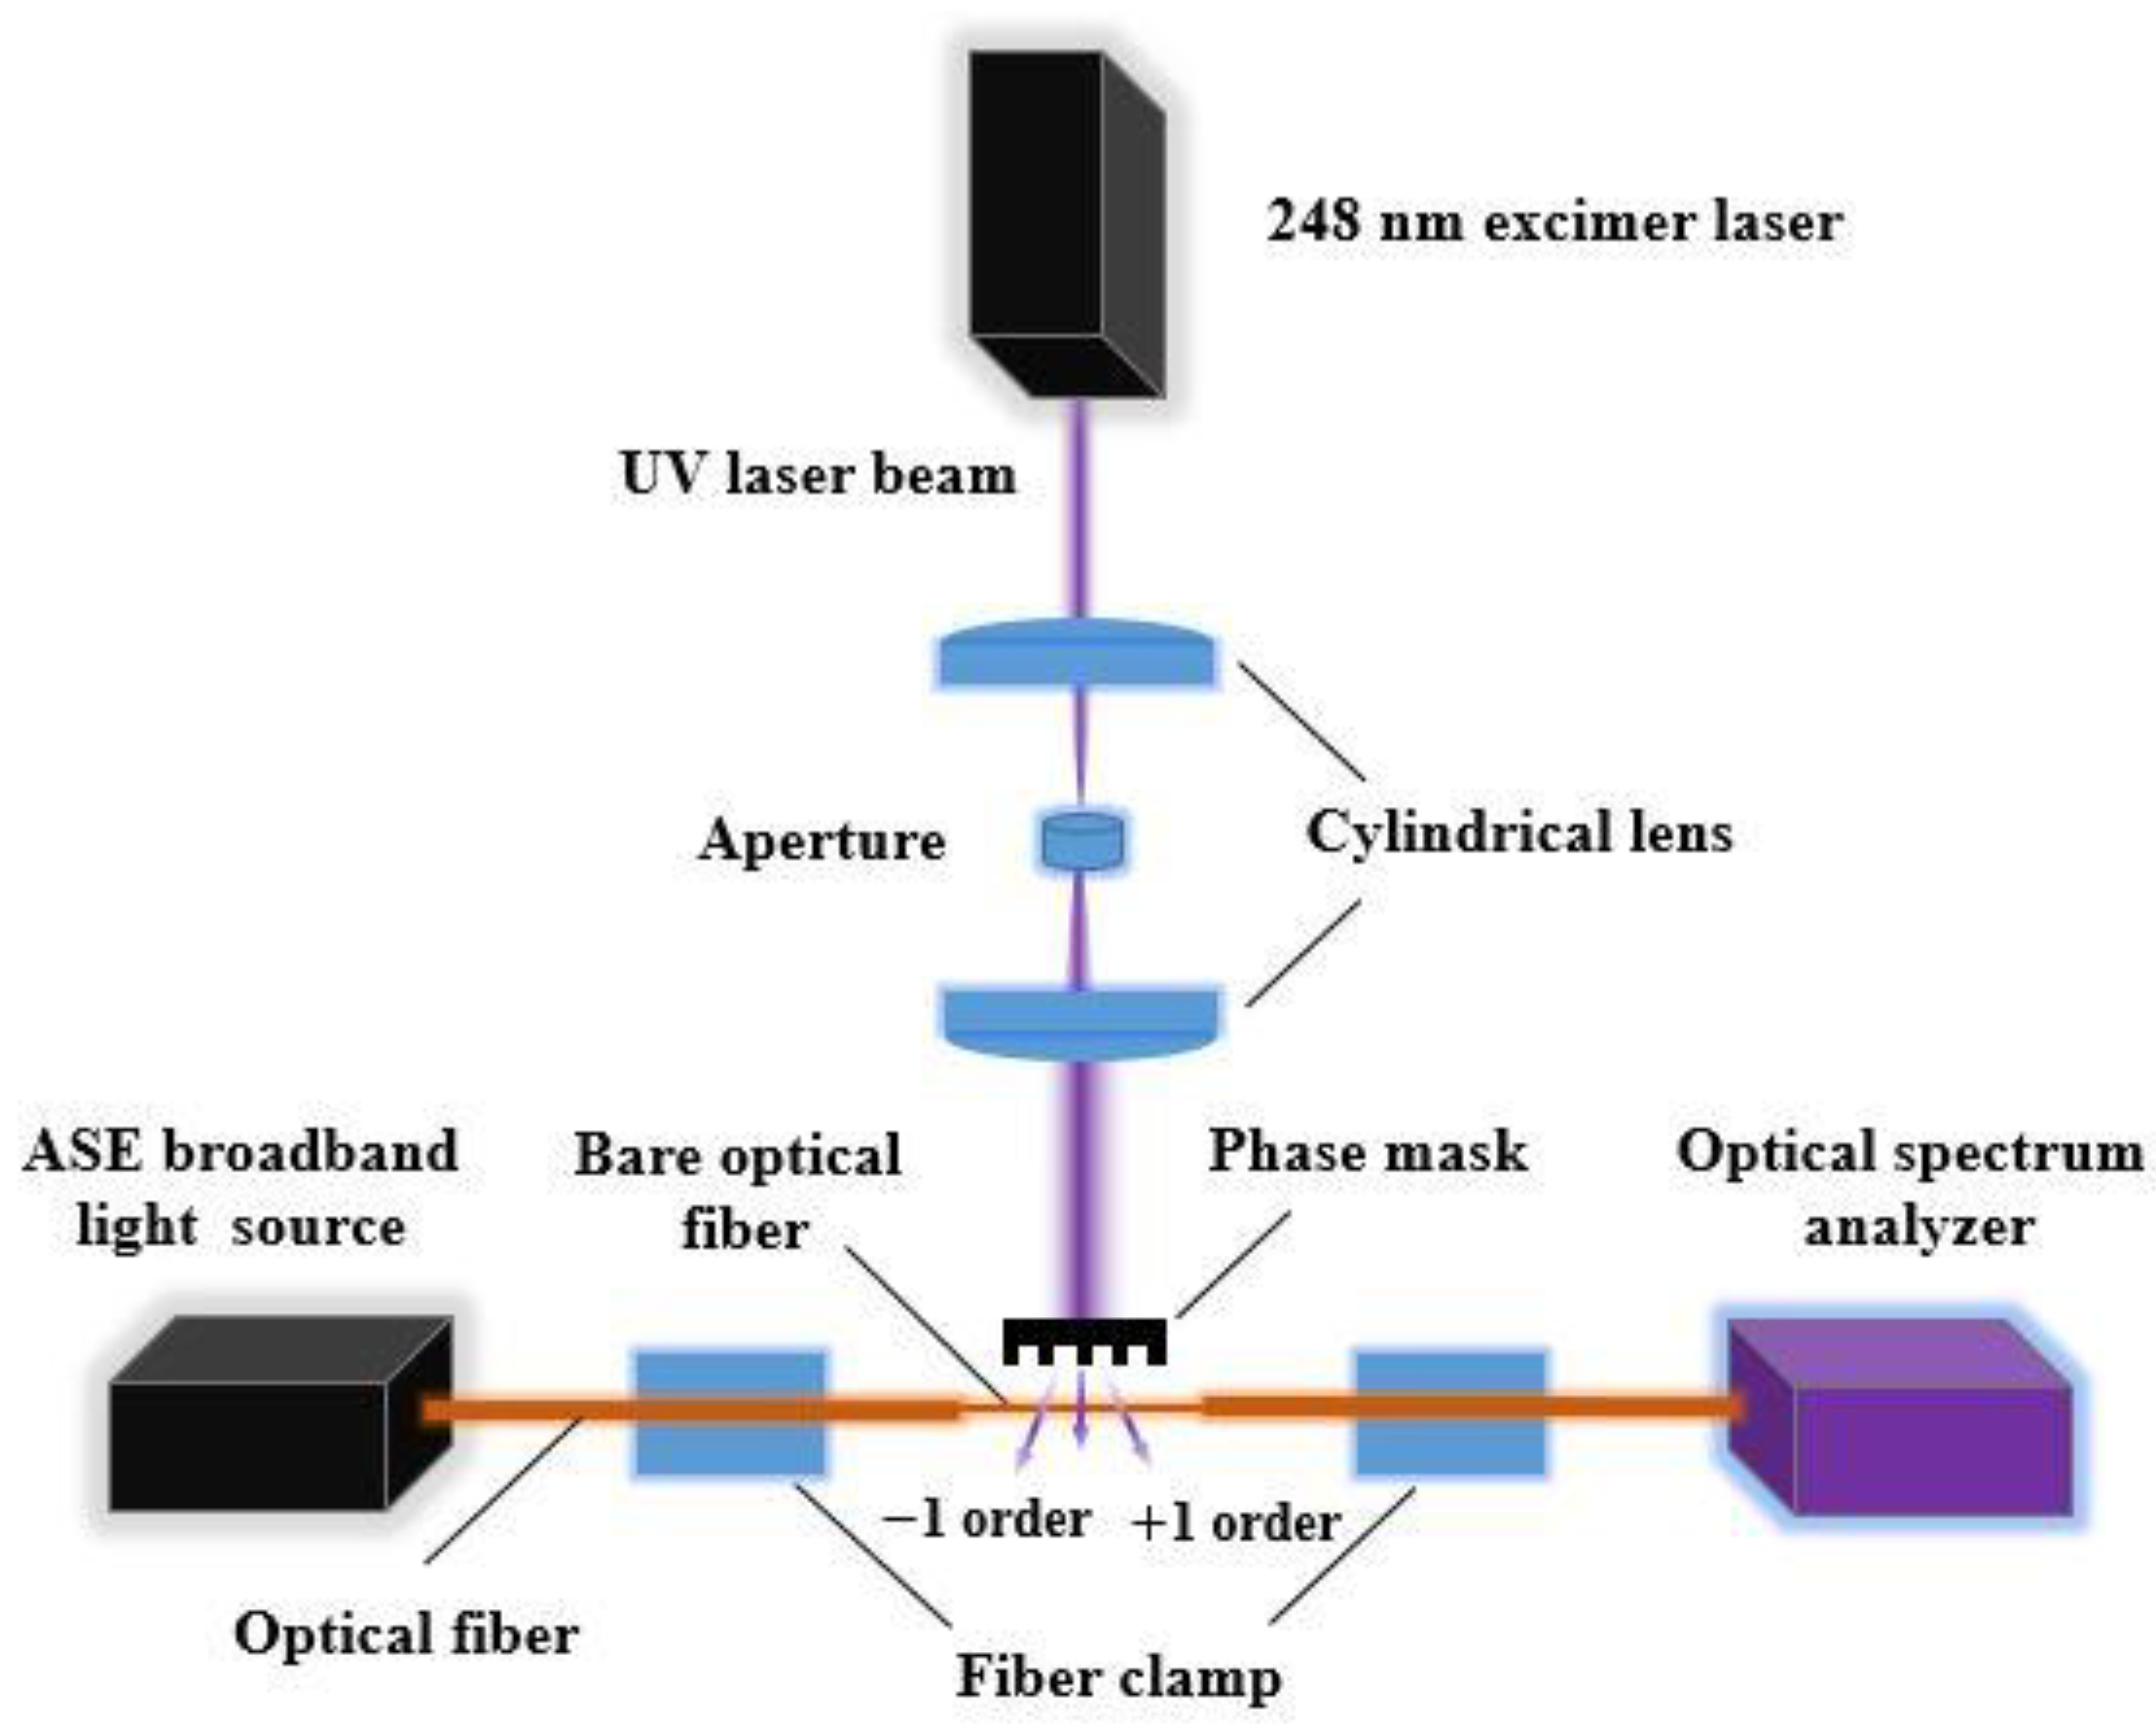
2.2. Fabrication of Uncoated FBG Strain Sensors

First, the pristine SMF-28e optical fibers (coated with acrylate) were obtained from Corning. Then, the high-pressure hydrogen loading process (to improve the photosensitivity of optical fibers) was carried out. After, the mechanical stripping (to remove the original acrylate coating) was needed. The stripping length was approximately 5 mm (and the grating length was 3 mm) as shown in Figure 1a. The fabrication of the uncoated FBG strain sensors is shown in Figure 2. Initially, a UV laser beam, emitted from the 248 nm excimer laser, passed through the beam shaping assembly (constituted by a cylindrical lens and aperture) and vertically entered the phase mask. After entering the phase mask, it was divided into three main parts (i.e., +1 order, −1 order and 0 order diffraction). The interference fringes (to write the FBG) formed by both +1 order and −1 order diffraction occurred in the vicinity of the stripped optical fiber. The FBG was written after the interference fringes acted on the optical fiber core. Moreover, an amplified spontaneous emission (ASE) broadband light source emitted the broadband light and it was injected into the abovementioned FBG. An optical spectrum analyzer was used to monitor the FBG spectrum in real-time. The optical fiber was fixed by two fiber clamps. Finally, the annealing process was needed to remove the excessive hydrogen and enhance the stability of the FBG. After finishing the above steps, high-quality (i.e., possessing an undistorted Bragg peak shape, −3 dB bandwidth ≤ 0.65 nm and absolute value of side mode suppression ratio (SMSR) ≥ 15 dB) FBG optical fibers were produced and selected as the uncoated (or initial) FBG strain sensors.

2.3. Fabrication of the FBG Strain Sensors

After preparing the uncoated FBG strain sensors, the fabrication process of the FBG strain sensors equipped with planar UV-curable resin was carried out as shown in Figure 3a,b where the schematic diagrams and the real photos are shown, respectively. First, a stainless steel substrate with a size of 7(x) × 19(y) × 0.06(z) mm3 was prepared and then two limited blocks with a size of 2(x) × 19(y) × 0.60(z) mm3 were attached to the substrate by Kapton tape. Subsequently, the uncoated FBG sensor was fixed onto the substrate by the Kapton tape. Third, the UV-curable resin (Isitic-3410) with a viscosity ≥14,200 mPa·s was injected into the groove formed by the two blocks and the substrate. After the injection, to remain on the same plane as the surfaces of the two limited blocks, the excess UV-curable resin was removed and its surface was smoothed by using a blade. Fourth, the injected UV-curable resin was exposed to UV irradiation at 395 nm (light intensity ≥ 100 mW/cm2) for 10 s and then heated at 90 °C for one hour. Finally, the Kapton tape was removed and the fabrication process of the FBG strain sensors was finished. Here, four FBG strain sensors (i.e., FBG-S1, FBG-S2, FBG-S3 and FBG-S4) with different thicknesses of UV-curable resin were successfully fabricated. Notably, the fabrication of the FBG strain sensors was very simple, without any complex structures.

3. Results and Discussion

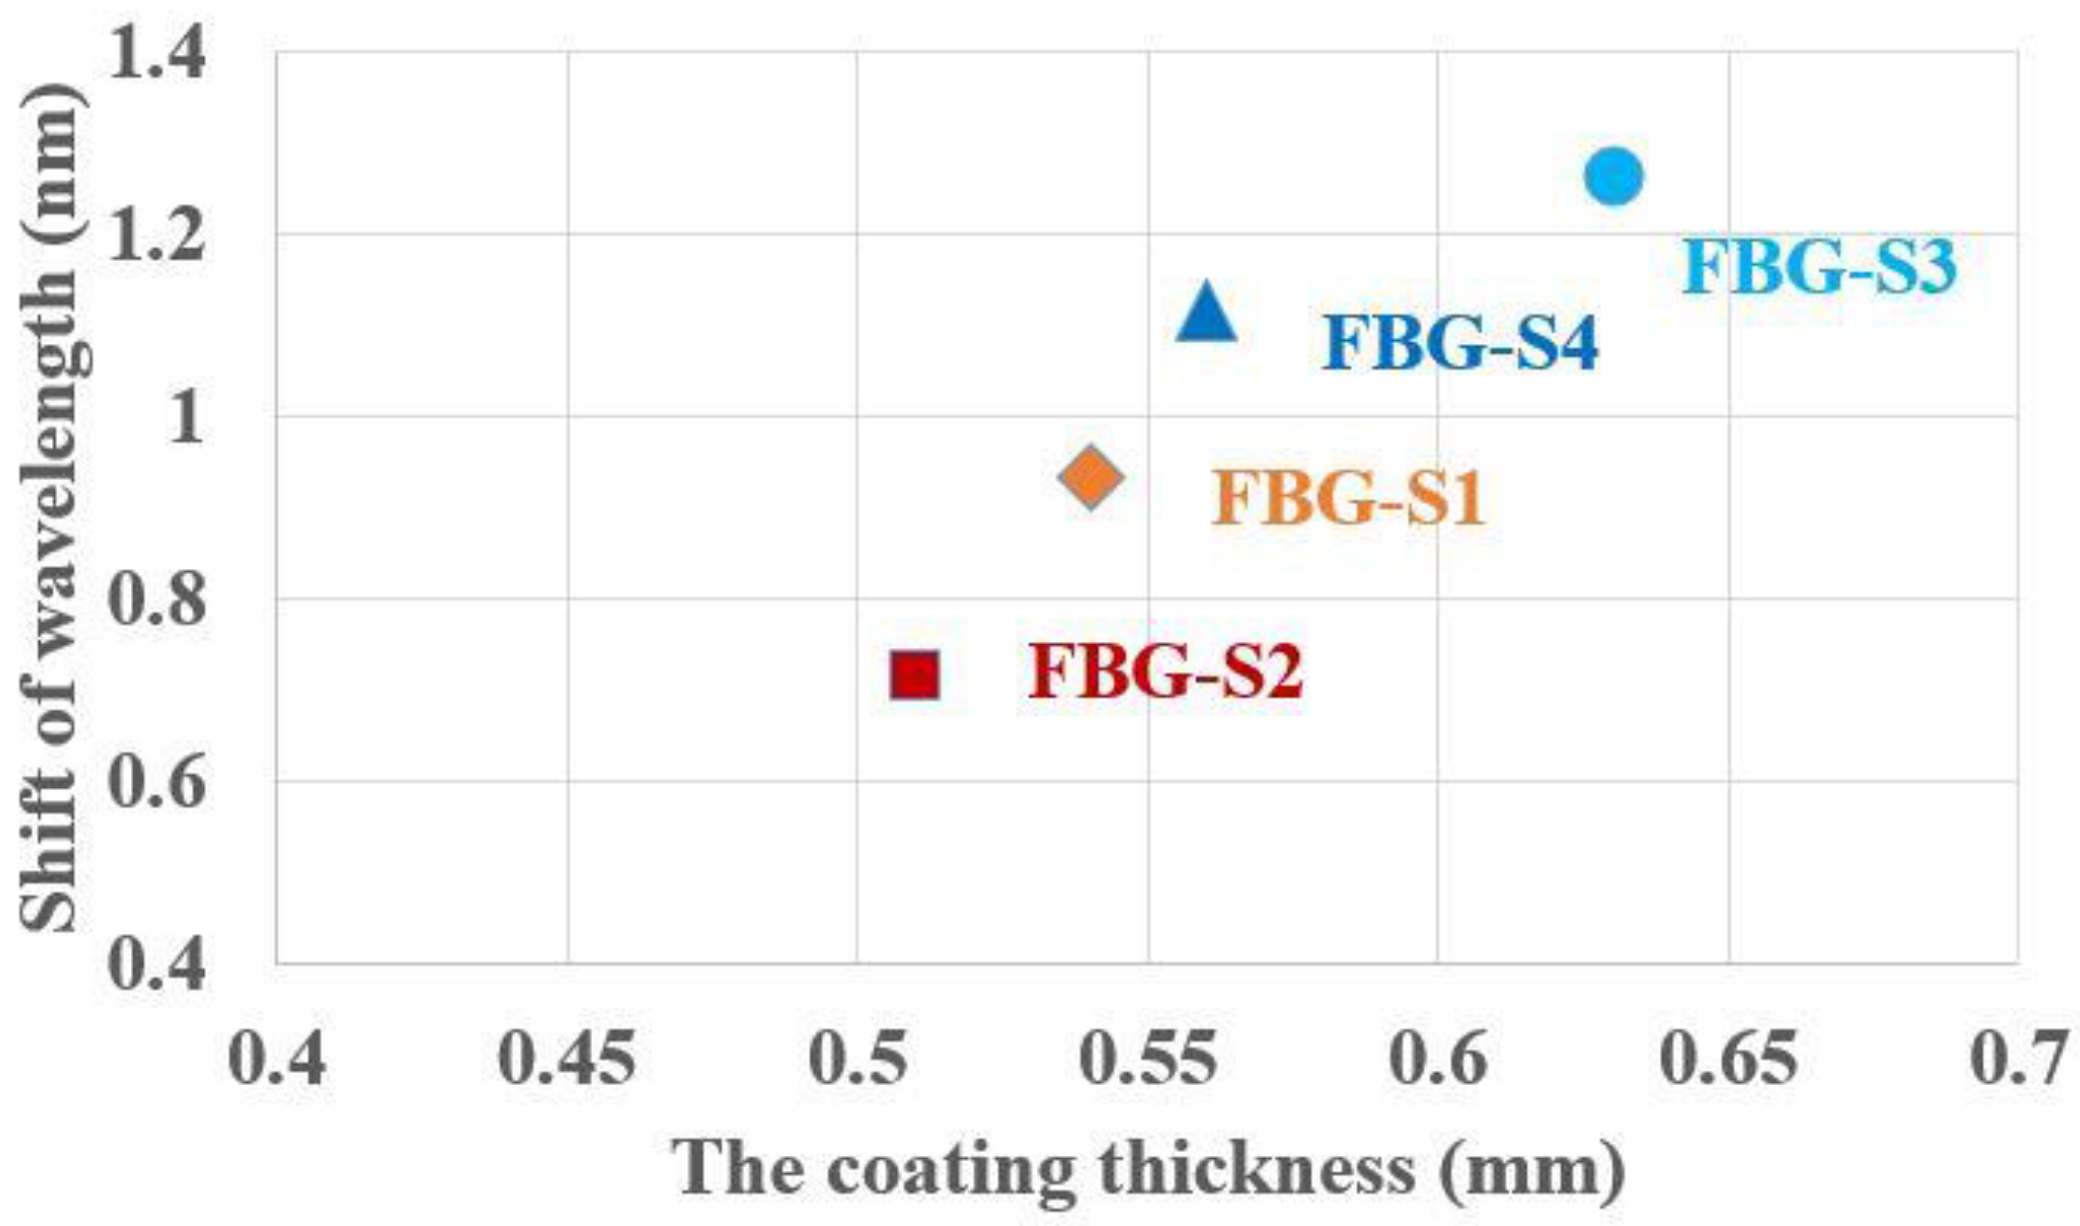
3.1. Optical Properties of the FBG Strain Sensors

To understand the influence of the planar UV-curable resin on the uncoated FBG strain sensors, a comparison of the optical parameters of the FBG strain sensors before coating (uncoated or initial state) and after coating (i.e., after UV irradiation and heating) have been carried out, as listed in Table 1. After coating, the central wavelengths of the four FBG strain sensors (i.e., FBG-S1, FBG-S2, FBG-S3 and FBG-S4) decreased. This decrease is attributed to the compression of the grating period induced by the thermal expansion and contraction of the planar UV-curable resin. Since the planar UV-curable resin (with a high coefficient of thermal expansion) is completely cured at 90 °C and is then dropped to 25 °C, it tends to shrink and causes a compression of the grating due to the tight bonding force between the planar UV-curable resin and the grating. However, the changes in the −3 dB bandwidth and SMSR do not show any regularity. Additionally, they meet the requirement of high-quality FBG strain sensors (i.e., −3 dB bandwidth ≤ 0.65 nm and the absolute value of SMSR ≥ 15 dB). The SMSR of the FBG-S1 decreased (−20.50 dB → −15.25 dB) after coating due to the non-uniform strain distribution along the grating; when the grating is subjected to the non-uniform strain [29,30], the intensity of the side lobe (i.e., at 1538.919 nm in Figure 4a) increases asymmetrically with an increasing strain gradient. As the non-uniform strain gradient increases, the spectrum is gradually broadened. The increase (0.512 nm → 0.517 nm) in the −3 dB bandwidth is proven. According to the previous work [23], the non-uniform strain is caused by the asymmetric axial force induced by the asymmetric coating. In addition, the reflection intensity of the FBG-S1 is reduced after coating. According to the reflection intensity expression [31], a larger full width at half maximum leads to a smaller reflection intensity. Thus, the increase in the −3 dB bandwidth is the reason for the reduction in intensity.
In addition, spectral comparisons of the FBG strain sensors before and after coating have been also carried out as shown in Figure 4. After UV irradiation and heating treatment, the Bragg peaks of the four FBG strain sensors (i.e., FBG-S1, FBG-S2, FBG-S3 and FBG-S4) are not distorted when compared with the initial state. Specifically, the four FBG strain sensors have good optical properties with an undistorted Bragg peak shape, a narrow bandwidth and a high SMSR. Note that FBG-S3 shown in Figure 4c possesses the largest change in wavelength (i.e., 1.264 nm).
Based on previous experience in our laboratory, the difference in wavelength change is associated with the coating thickness; the thicker coating possesses a stronger bonding force and makes it easier to pull the grating, resulting in a more apparent change in wavelength. To better illustrate this, the relationship between the shift of the Bragg wavelength and the coating thickness is obtained as shown in Figure 5. A thicker UV-curable resin coating leads to a larger shift in the wavelength; the major difference among the four FBG strain sensors is that they have different coating thicknesses.

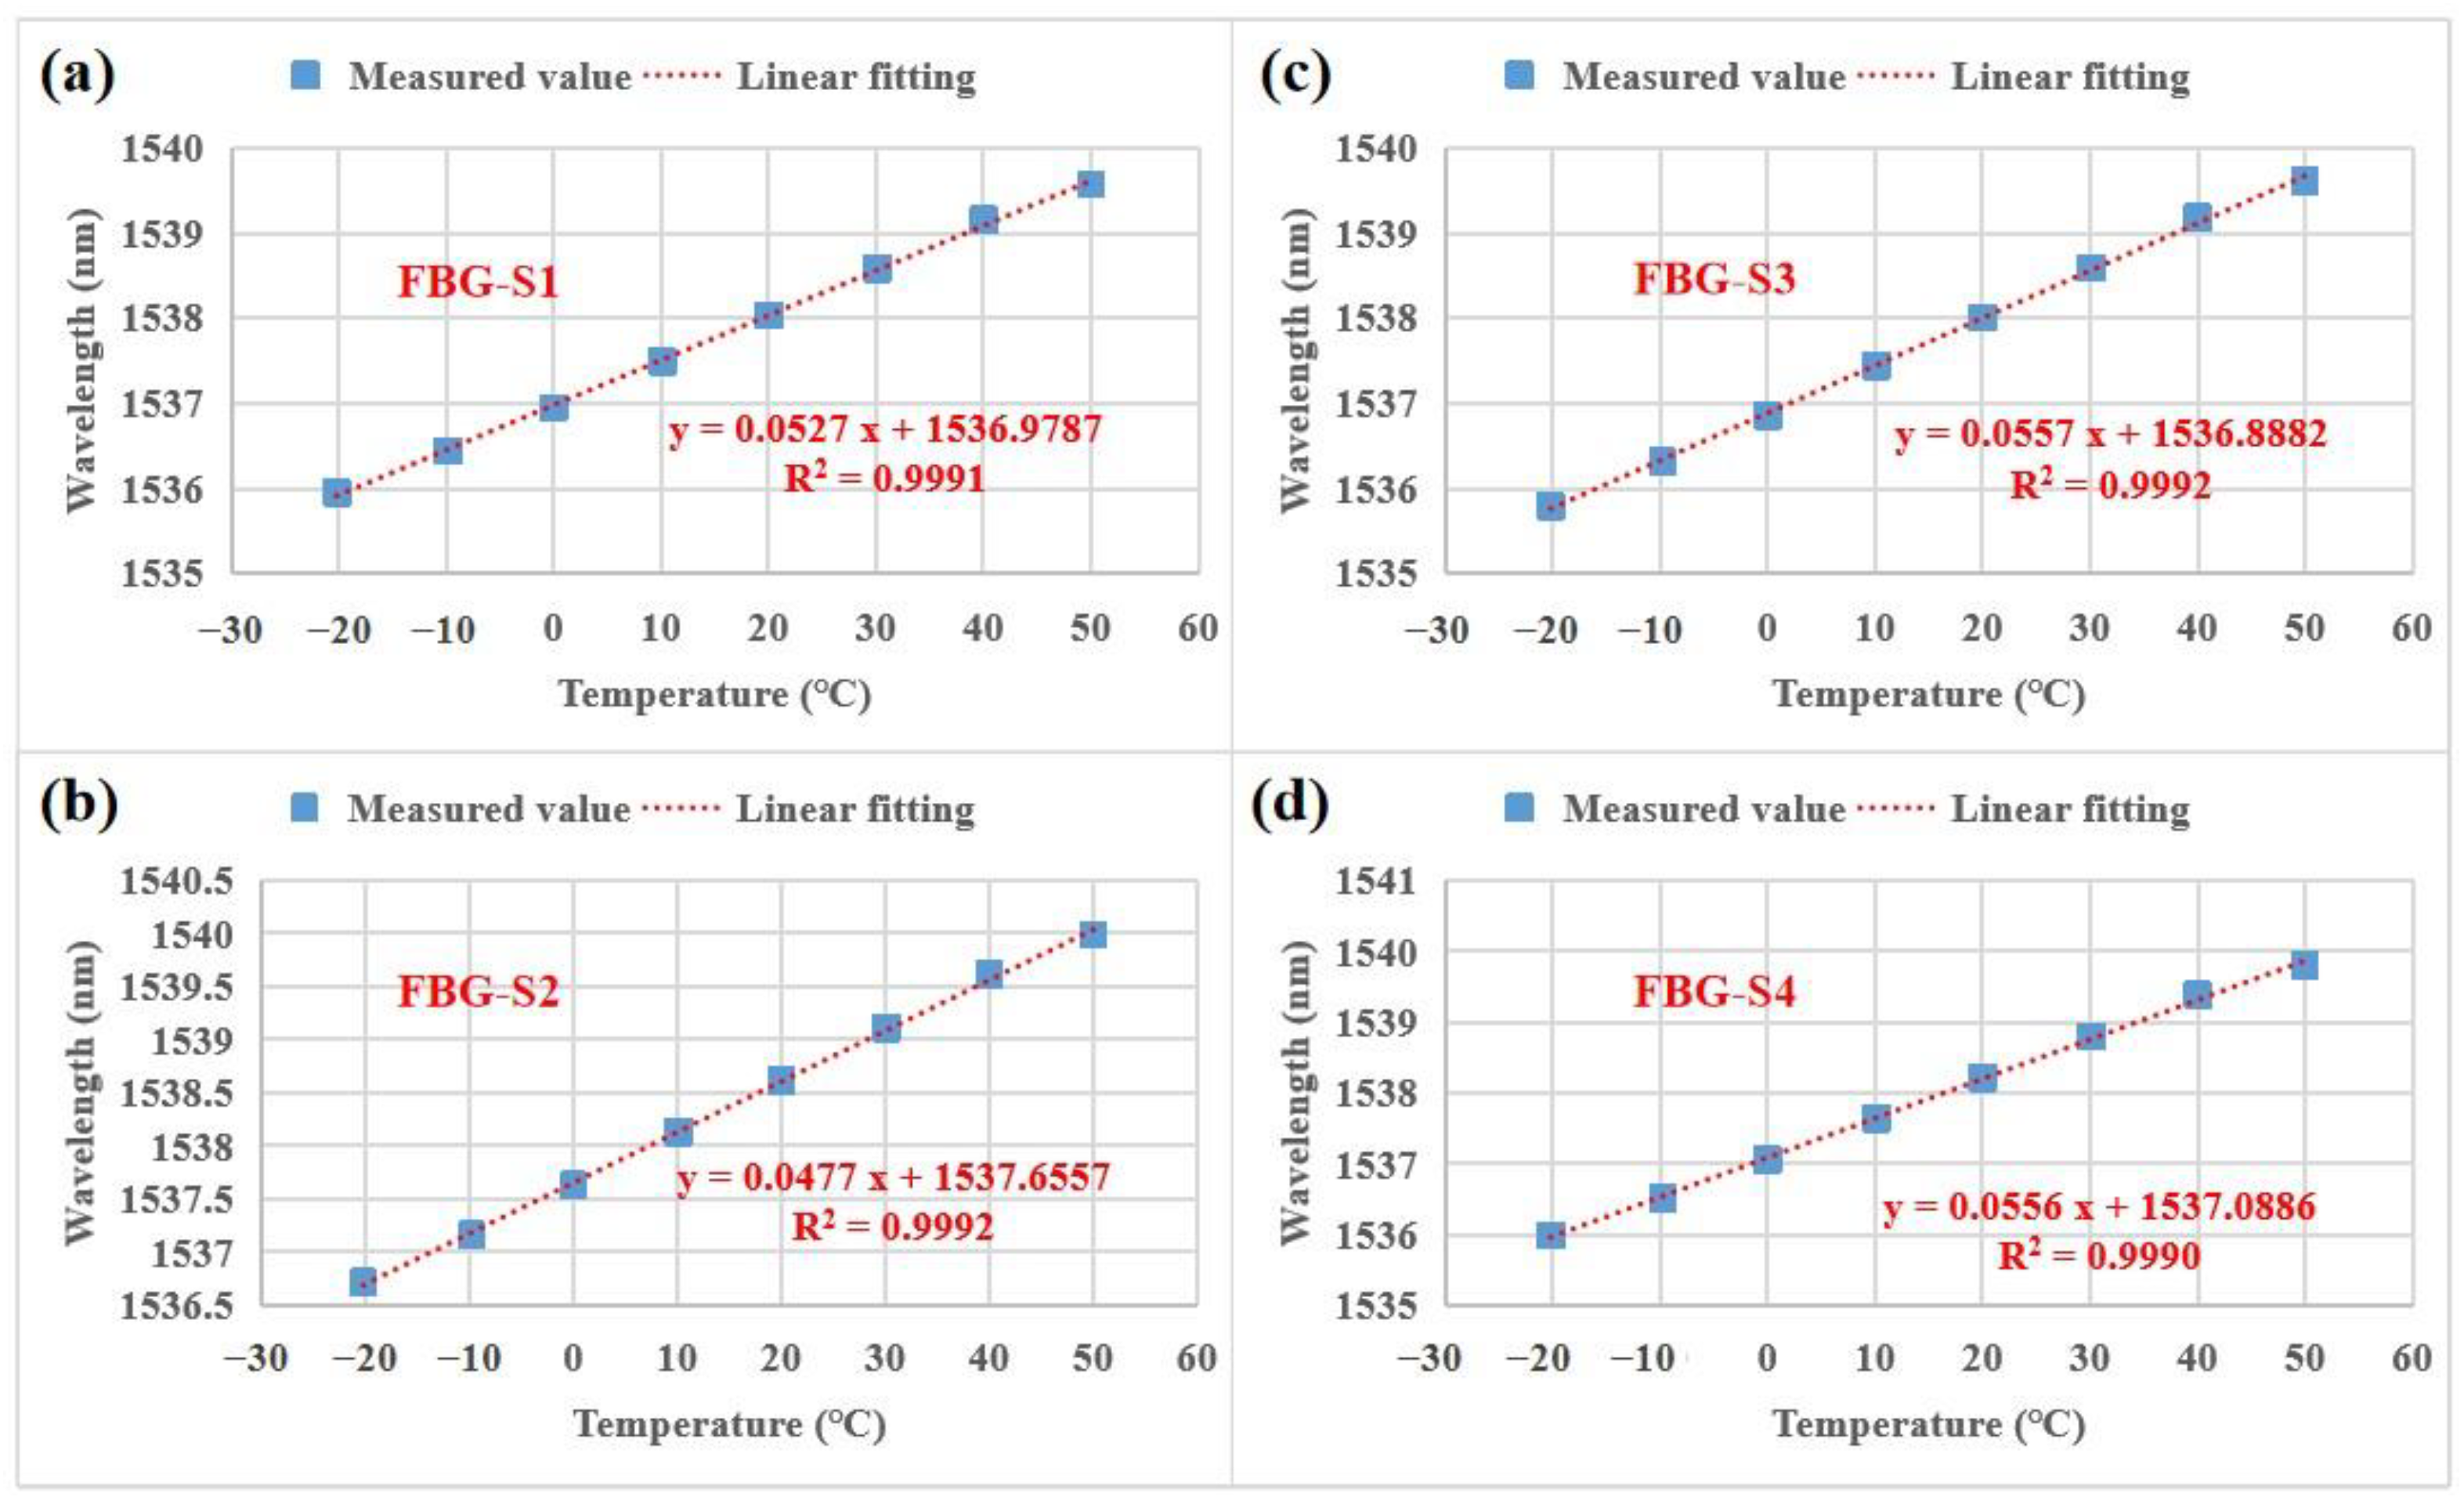
3.2. Temperature Sensing Properties of the FBG Strain Sensors

In addition to studying the optical properties, the temperature sensing properties of the FBG strain sensors were investigated as shown in Figure 6. Good linear relationships between the wavelength (y) and temperature (t) are exhibited in the whole measured temperature range. The linear relationships for FBG-S1, FBG-S2, FBG-S3 and FBG-S4 are y = 0.0527t + 1536.9787 (the temperature sensitivity is 52.7 pm/°C), y = 0.0477t + 1537.6557 (the temperature sensitivity is 47.7 pm/°C), y = 0.0557t + 1536.8882 (the temperature sensitivity is 55.7 pm/°C) and y = 0.0556t + 1537.0886 (the temperature sensitivity is 55.6 pm/°C), respectively. All four FBG strain sensors have high temperature sensitivity, i.e., ~5 times larger than the temperature sensitivities of the uncoated FBG strain sensors. Notably, due to possessing the thickest UV-curable resin, FBG-S3 has the highest temperature sensitivity of 55.7 pm/°C. Moreover, the coefficients of determination (i.e., R-squared value) for FBG-S1, FBG-S2, FBG-S3 and FBG-S4 are 0.9991, 0.9992, 0.9992 and 0.9990, respectively; the four FBG strain sensors have good linearity (R-squared value ≥ 0.9990). According to our engineering experience, the R-squared value ≥0.9990 further indicates that the four FBG strain sensors have good package properties. In summary, the four proposed FBG strain sensors have excellent temperature sensing properties with high temperature sensitivity and good linearity.
In addition, according to the previous work [32], the temperature sensitivity of the FBG embedded in the coating material is expressed as follows:
Δ λ / Δ T = λ B ξ + ( 1 P e ) α m C m E m C m E m + C f E f
where α m is the thermal expansion coefficient of the coating material. C m and C f are the cross-section areas of the coating material and the silica fiber. E m and E f are the Young’s modulus values of the coating material and the silica fiber. In our experiments, the coating material is the planar UV-curable resin. α m = 8 . 5 × 10 5 / ° C and E m = 500   MPa are obtained from the product specification of the UV-curable resin. C m is equal to the product of the width and the thickness of the coating because the shape of the UV-curable resin is planar. Thus, one can see that the thicker coating leads to a larger C m , resulting in a larger temperature sensitivity. For the silica fiber, ξ = 8.6 × 10 6 / ° C and E f = 72   GPa [32,33]. C f = π r 2 , r is the radius (i.e., 62.5 μm) of the silica fiber. Thus, according to Equation (4), the temperature sensitivities of the four FBG strain sensors can be calculated; the calculated temperature sensitivities are 55.6 pm/°C, 53.9 pm/°C, 60.1 pm/°C and 56.7 pm/°C for FBG-S1, FBG-S2, FBG-S3 and FBG-S4, respectively. However, the temperature sensitivities obtained from the experiments (as shown in Figure 6) are 52.7 pm/°C, 47.7 pm/°C, 55.7 pm/°C and 55.6 pm/°C for FBG-S1, FBG-S2, FBG-S3 and FBG-S4, respectively. Specifically, there are some differences between the calculated sensitivities and the experimentally measured sensitivities probably because the experimentally measured sensitivities are influenced and limited by the stainless steel substrate. The temperature sensitivities of the various FBG sensors reported in the last 20 years [34,35,36,37,38,39,40,41,42,43,44,45,46,47] are listed in Table 2. To better compare with the other FBG sensors, the maximum measured sensitivity (i.e., 55.7 pm/°C) is used in Table 2. The second highest temperature sensitivity was achieved by our sensor from our study; this result produces a competitive advantage for our proposed FBG strain sensors when they are considered as FBG temperature sensors before installation. However, after installation, the strain sensing properties of the proposed FBG strain sensors further improved.

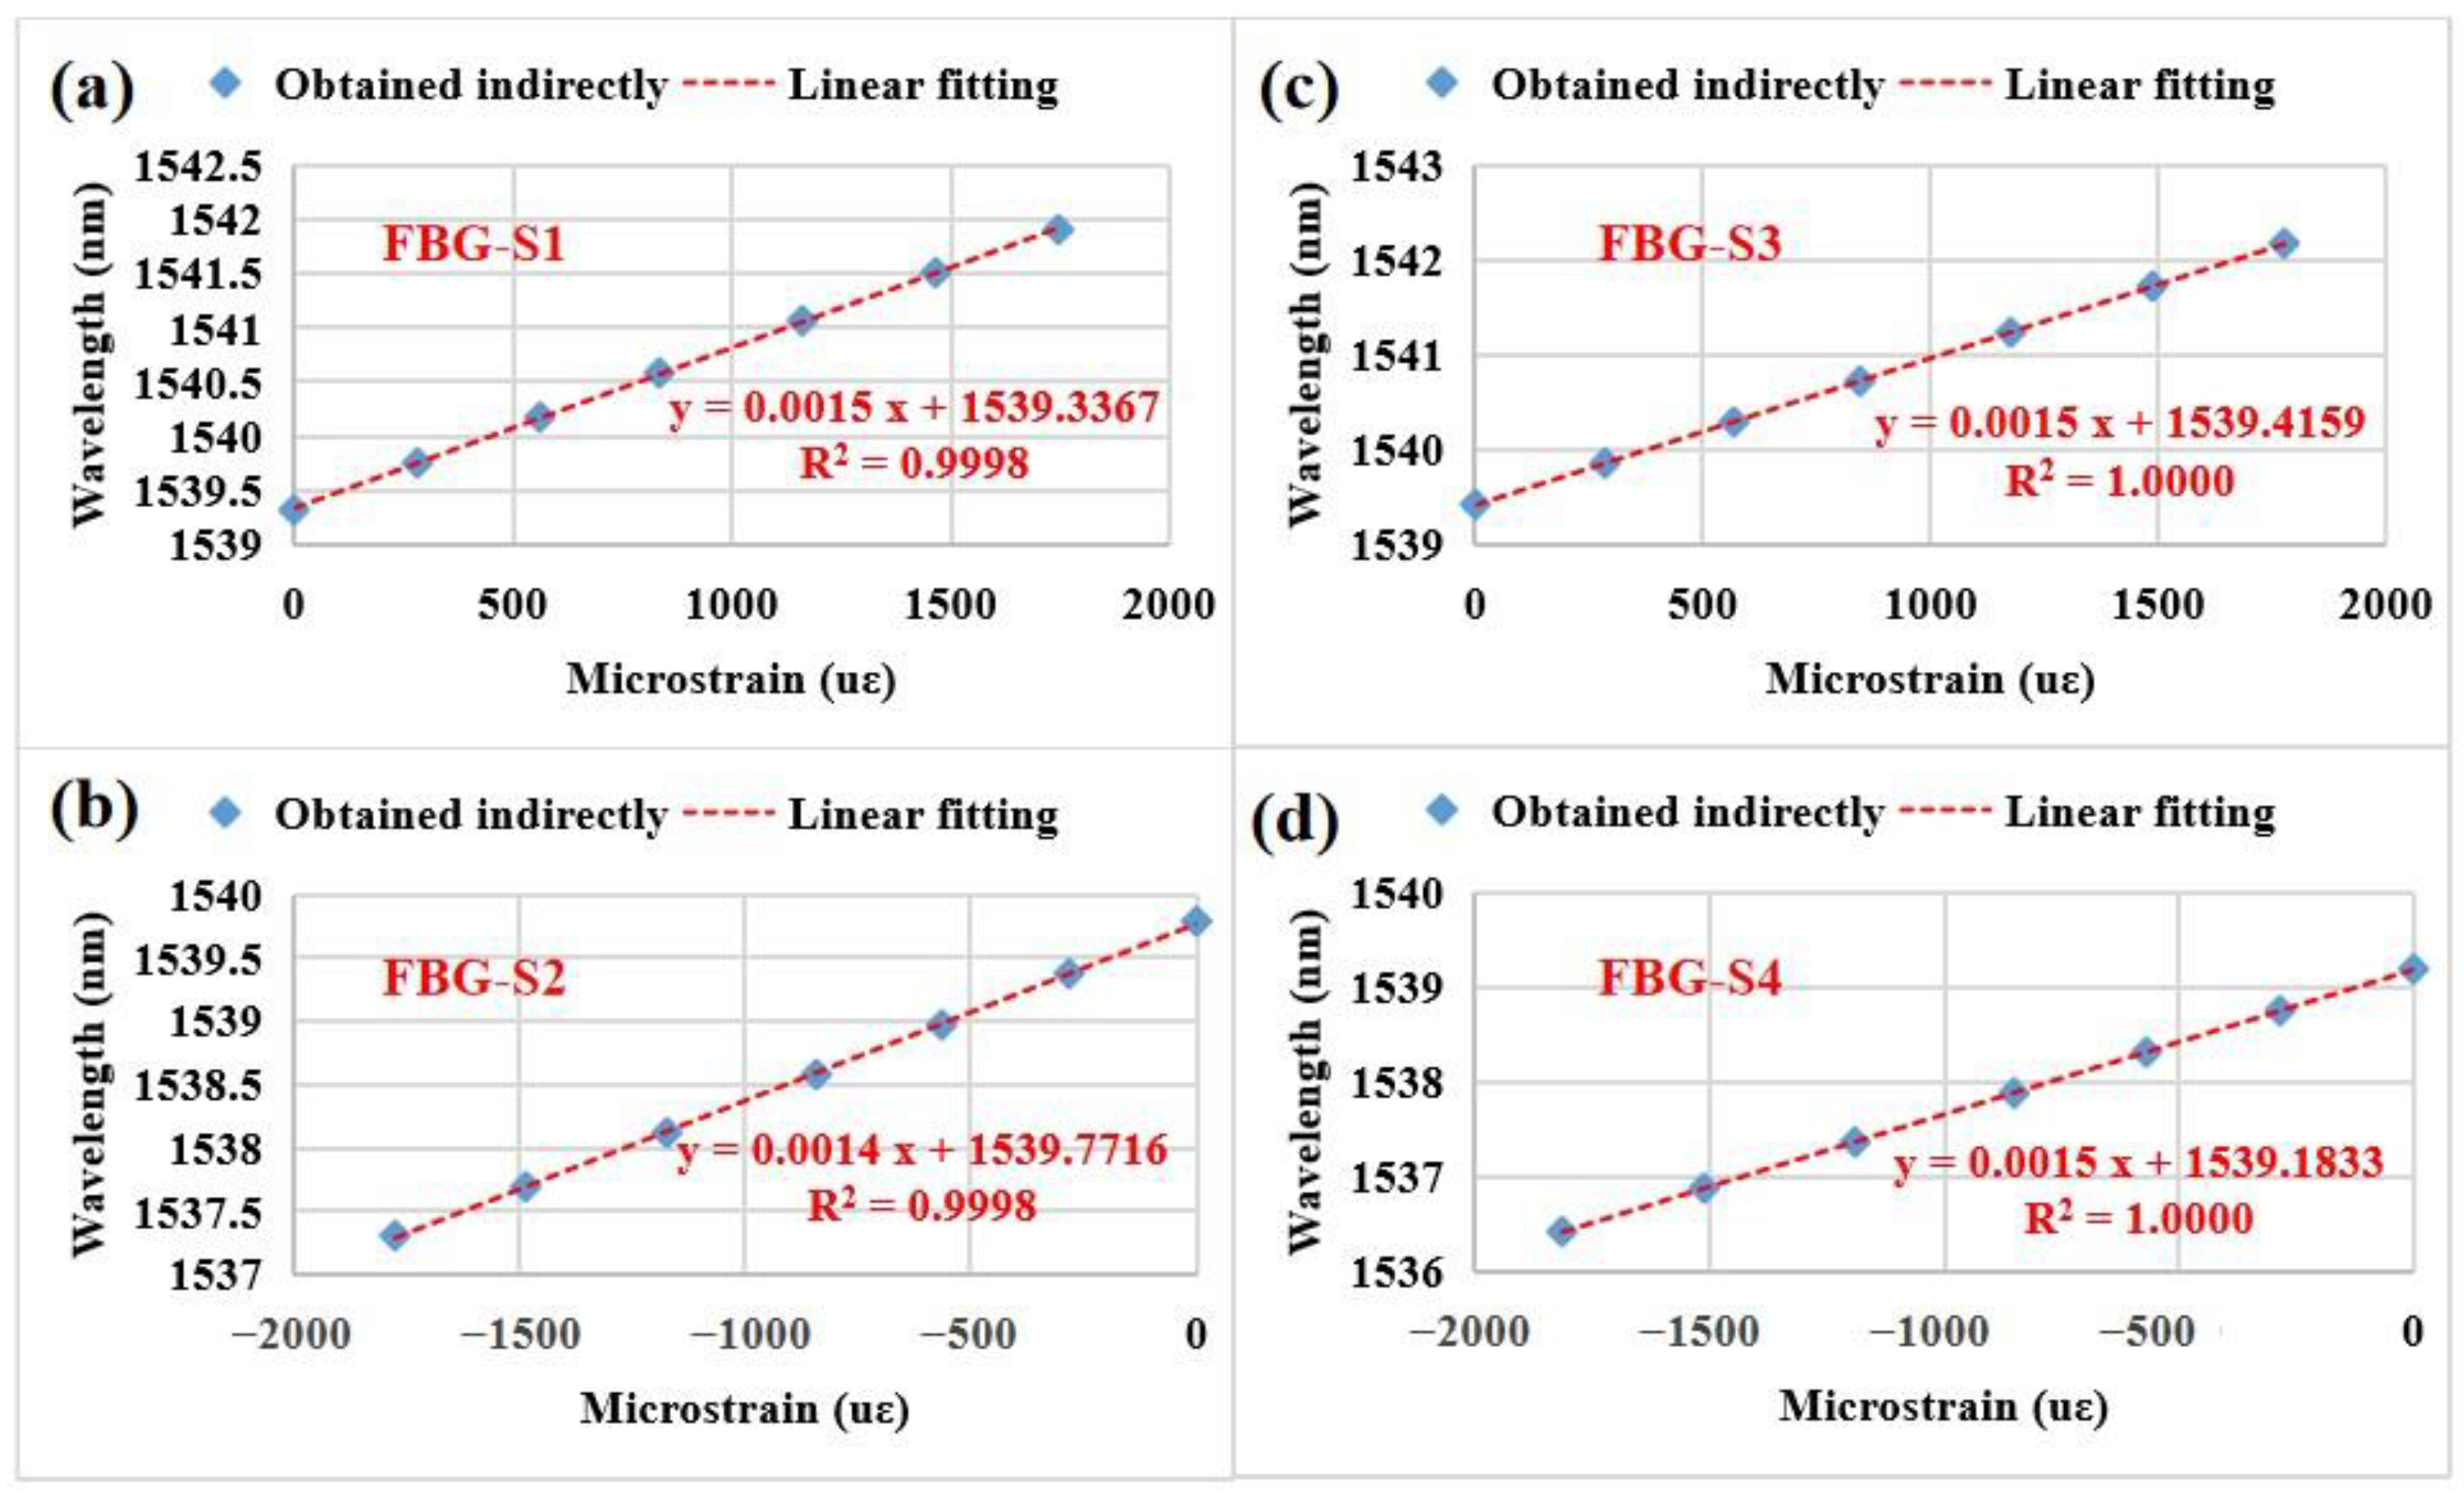
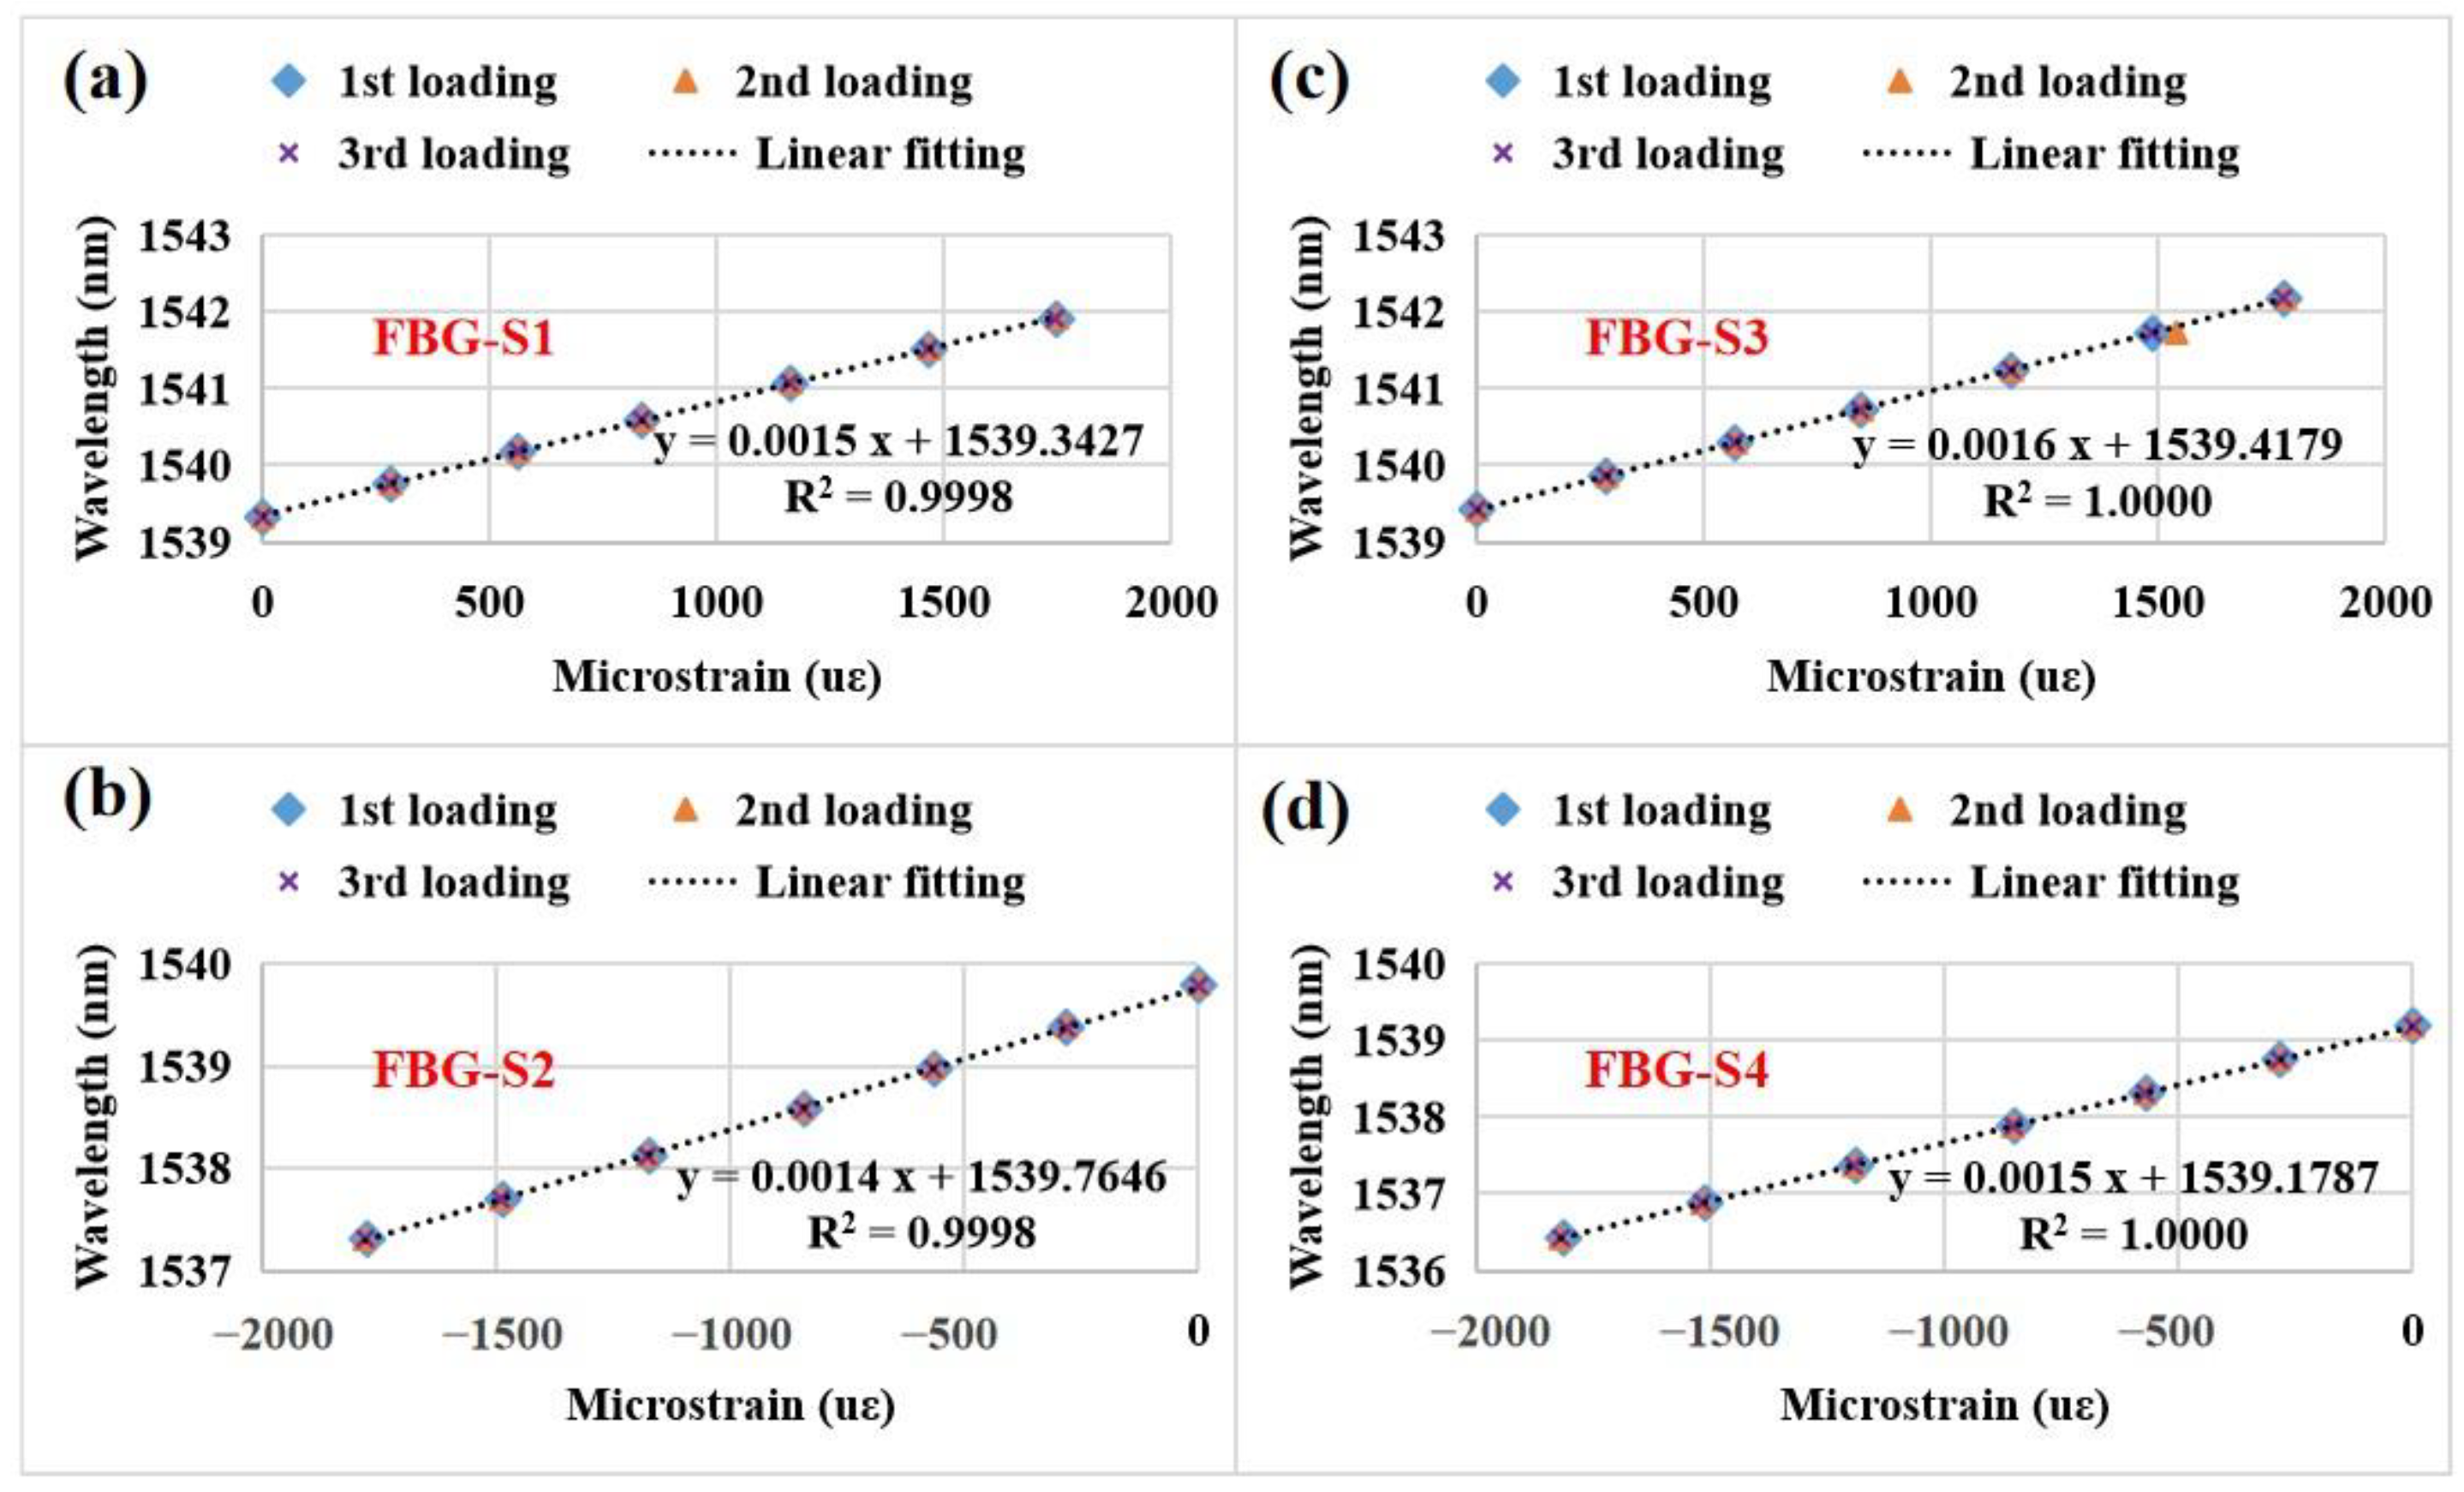
3.3. Strain Sensing Properties of the FBG Strain Sensors

To study the strain sensing properties of the FBG strain sensors, an experimental setup based on the equal strength cantilever beam was designed as shown in Figure 7; it includes four parts, i.e., the equal strength cantilever beam device, strain gauge, laptop and FBG wavelength demodulator (T&S Communication Co, Ltd., Shenzhen, China, TS-WI) with a wavelength resolution of 1 pm). Four ESG sensors (i.e., ESG-S1, ESG-S2, ESG-S3 and ESG-S4) and four FBG strain sensors (i.e., FBG-S1, FBG-S2, FBG-S3 and FBG-S4) are mounted on the upper and lower sides of the equal strength cantilever beam (the material is high manganese steel). The sensors attached to the upper side of the cantilever beam are used to measure the tensile strains and the sensors attached to the lower side of the cantilever beam are used to measure the compressive strains. Six weights are prepared to add an applied force from 0 N to 27 N. As shown in Figure 7 the temperature sensor based on the FBG is used on the cantilever beam device to record the ambient temperature change. The linear relationship for the temperature sensor is y = 0.0100 (t − 25.0) + 1532.9240 (the temperature sensitivity is 10.0 pm/°C). The strain gauge is used to demodulate the strain signals of the four ESG sensors and the FBG wavelength demodulator is used to demodulate the wavelength signals of the four FBG strain sensors. The experimental data and spectra are recorded by the laptop. To eliminate the influence of temperature, the experimental temperature is maintained at 21.0 °C and monitored by the abovementioned FBG temperature sensor during the whole process of the strain measurement.
According to material mechanics, for the strain sensors pasted on the equal strength cantilever beam, the absolute value of the strain ( ε ) can be expressed as follows [3,48]:
ε = 6 F L W h 2 E
where F is the applied force exerted on the cantilever beam. L is the distance from the sensor to the point with the added weight. W is the width of the point where the sensor pasted. E and h are the elasticity modulus and thickness of the cantilever beam, respectively. For our experiments, E = 210   GPa and h = 2   mm .
Initially, the relationship curves between the strain and the applied force for the four ESG sensors were obtained as shown in Figure 8. According to Equation (5) and Table 3, the theoretical values can be calculated and the measured values can be directly obtained from the strain gauge; the measured strains are in good agreement with the theoretical strains in the measured force range. Specifically, the measured values are nearly equal to the theoretical values in the range of 0–22 N. Notably, ESG-S1 and ESG-S3 have a positive strain value due to their pasting on the upper side of the cantilever beam. ESG-S2 and ESG-S4 have a negative strain value because of their attachment on the opposite side of the cantilever beam.
However, for FBG strain sensors, the measured strains cannot be directly obtained from the FBG wavelength demodulator because it is only used to demodulate wavelength signals. According to the results shown in Figure 8, the measured values are approximately equal to the theoretical values in the measured force range. Based on this result, the measured strains for the FBG strain sensors can be indirectly obtained from the practical values measured by the ESG sensors according to Equation (4) and the installation information listed in Table 3 as shown in Figure 9. The indirectly obtained strains are in good agreement with the theoretical strains in the measured force range. In the range of 0–22 N, the indirectly obtained values are nearly equal to the theoretical values. FBG-S1 and FBG-S3 have a positive strain value because of their pasting on the upper side of the cantilever beam. FBG-S2 and FBG-S4 have a negative strain value due to their attachment on the opposite side of the cantilever beam.
Although the relationship curves between the strain and the applied force for the FBG strain sensors were obtained, they could not directly reflect the relationship between the wavelength shift and the strain. To determine this, the relationship curves between the wavelength and the strain are obtained as shown in Figure 10. The four FBG strain sensors exhibit good linear relationships between the wavelength (y) and the strain (x) in the whole measured strain range. The strain sensitivities (i.e., ~1.5 pm/με) of the four FBG strain sensors are approximately equal to those values of the uncoated FBG sensors (i.e., ~1.2 pm/με). The coating thickness appears to have a slight influence on the strain sensitivity. Additionally, the R-squared values for FBG-S1, FBG-S2, FBG-S3 and FBG-S4 are 0.9998, 0.9998, 1.0000 and 1.0000, respectively. This means that the four FBG strain sensors have an excellent linearity performance (R-squared value ≥ 0.9998).
We also have studied the hysteresis behavior of the four FBG strain sensors during the loading and unloading processes obtained by adding and removing weights. The measured results are shown in Figure 11. The four FBG strain sensors exhibit an excellent linear fitting and an excellent linearity performance (R-squared value ≥ 0.9998). The hysteresis behavior cannot be observed in the whole measured strain range. Notably, FBG-S2 has a maximum difference (0.023 nm) at ~566 με. Thus, the hysteresis error (~0.058%), i.e., the ratio of the maximum difference to the full scale of the sensor (i.e., 40 nm for our FBG sensors), can be obtained according to the previous work [49] and this error is accepted for most practical applications.
Finally, we studied the repeatability of the four FBG strain sensors during three repeated loading processes and the measured results are shown in Figure 12. The four FBG strain sensors exhibit excellent linear fitting and repeatability. The FBG-S1 has a maximum difference (0.018 nm) at ~1747 με. According to the previous work [49], a repeatability error (~0.045%) can be obtained and this error is also acceptable.

4. Conclusions

In summary, we have investigated the optical properties, temperature sensing properties and strain sensing properties of four FBG strain sensors equipped with a planar UV-curable resin. The experimental results show that the proposed FBG strain sensors provided the following: (1) good optical properties, including an undistorted Bragg peak shape, narrow bandwidth and high SMSR; (2) good temperature sensing properties, including high temperature sensitivities (≥47.7 pm/°C) and good linearity (R-squared value ≥ 0.9990); and (3) excellent strain sensing properties, including excellent linearity performance (R-squared value ≥ 0.9998), no hysteresis behavior (hysteresis error ≤ 0.058%) and excellent repeatability (repeatability error ≤ 0.045%). In addition, when compared with the uncoated FBG sensors, the coating thickness of the UV-curable resin has an influence on the wavelength shifts and temperature sensitivities of the FBG strain sensors after coating. The proposed FBG strain sensors are expected to be applied as high-performance strain sensing devices due to their abovementioned good performances.

Author Contributions

Investigation, methodology, visualization, writing-original draft preparation, X.L.; Formal analysis, validation, M.Z.; Conceptualization, data curation, project administration, resource, supervision, D.H.; Writing-review and editing, funding acquisition, supervision, Q.W. All authors have read and agreed to the published version of the manuscript.

Funding

This work was supported by the Science and Technology Planning Project of Shenzhen Municipality (JSGG20191129110033736); National Natural Science Foundation of China (6217030813); Basic and Applied Basic Research Foundation of Guangdong Province (2021A1515010964); and Science, Technology and Innovation Commission of Shenzhen Municipality (JCYJ20200109105810074, SGDX20190919094803949).

Institutional Review Board Statement

Not applicable.

Informed Consent Statement

Not applicable.

Data Availability Statement

Data underlying the results presented in this paper are not publicly available at this time but may be obtained from the authors upon reasonable request.

Acknowledgments

We would like to acknowledge that T&S Communications Co., Ltd. provided the experimental instruments, laboratory space and the operation staff who helped with the examination and tests in our study. In addition, we would also like to acknowledge Xiangjie Xiao and Yiming Zhang for providing helpful and useful formal analysis in our study.

Conflicts of Interest

The authors declare no conflict of interest.

References

  1. Farrar, C.R.; Worden, K. An introduction to structural health monitoring. Philos. Trans. R. Soc. A 2007, 365, 303–315. [Google Scholar] [CrossRef] [PubMed]
  2. Li, R.; Tan, Y.; Chen, Y.; Hong, Y.; Zhou, Z. Investigation of sensitivity enhancing and temperature compensation for fiber Bragg grating (FBG)-based strain sensor. Opt. Fiber Technol. 2019, 48, 199–206. [Google Scholar] [CrossRef]
  3. Chen, Q.; Zhang, X.; Chen, Y.; Zhang, X. A method of strain measurement based on fiber Bragg grating sensors. Vibroeng. Procedia 2015, 5, 140–144. [Google Scholar]
  4. Hsu, C.Y.; Chiang, C.C.; Hsieh, T.S.; Chen, T.H.; Chen, Y.H. A study of strain measurement in cylindrical shells subjected to underwater shock loading using FBG sensors. Optik 2020, 217, 164701. [Google Scholar] [CrossRef]
  5. Mihailov, S.J. Fiber Bragg grating sensors for harsh environments. Sensors 2012, 12, 1898–1918. [Google Scholar] [CrossRef] [PubMed]
  6. Gao, L.; Zhang, Q.; Li, E.; Sun, Y.; Zhang, Z.; Pu, S.; Cheng, X.; Rong, F. Strain monitoring of combustible gas implosion test based on fiber Bragg grating. Shock Vib. 2019, 2019, 9858125. [Google Scholar] [CrossRef]
  7. Li, H.N.; Li, D.S.; Song, G.B. Recent applications of fiber optic sensors to health monitoring in civil engineering. Eng. Struct. 2004, 26, 1647–1657. [Google Scholar] [CrossRef]
  8. Martinez-Luengo, M.; Kolios, A.; Wang, L. Structural health monitoring of offshore wind turbines: A review through the Statistical Pattern Recognition Paradigm. Renew. Sustain. Energy Rev. 2016, 64, 91–105. [Google Scholar] [CrossRef] [Green Version]
  9. Hirayama, N.; Sano, Y. Fiber Bragg grating temperature sensor for practical use. ISA Trans. 2000, 39, 169–173. [Google Scholar] [CrossRef]
  10. Raju, S.J.; Haque, S.M.; Goud, B.K.; De, R.; Misal, J.S.; Rao, K.D. Fiber Bragg grating sensor for in situ substrate temperature measurement in a magnetron sputtering system. Phys. Scr. 2022, 97, 095505. [Google Scholar] [CrossRef]
  11. Al Handawi, K.; Vahdati, N.; Rostron, P.; Lawand, L.; Shiryayev, O. Strain based FBG sensor for real-time corrosion rate monitoring in pre-stressed structures. Sens. Actuators 2016, 236, 276–285. [Google Scholar] [CrossRef]
  12. Jin, L.; Zhang, W.; Zhang, H.; Liu, B.; Zhao, J.; Tu, Q.; Kai, G.; Dong, X. An embedded FBG sensor for simultaneous measurement of stress and temperature. IEEE Photonics Technol. Lett. 2005, 18, 154–156. [Google Scholar] [CrossRef]
  13. James, S.W.; Dockney, M.L.; Tatam, R.P. Simultaneous independent temperature and strain measurement using in-fibre Bragg grating sensors. Electron. Lett. 1996, 32, 1133–1134. [Google Scholar] [CrossRef]
  14. Nascimento, M.; Ferreira, M.S.; Pinto, J.L. Simultaneous sensing of temperature and Bi-directional strain in a prismatic Li-ion battery. Batteries 2018, 4, 23. [Google Scholar] [CrossRef] [Green Version]
  15. Mokhtar, M.R.; Sun, T.; Grattan, K.T.V. Bragg grating packages with nonuniform dimensions for strain and temperature sensing. IEEE Sens. J. 2011, 12, 139–144. [Google Scholar] [CrossRef]
  16. Nascimento, M.; Novais, S.; Ding, M.S.; Ferreira, M.S.; Koch, S.; Passerini, S.; Pinto, J.L. Internal strain and temperature discrimination with optical fiber hybrid sensors in Li-ion batteries. J. Power Sources 2019, 410, 1–9. [Google Scholar] [CrossRef]
  17. Huang, J.; Albero Blanquer, L.; Bonefacino, J.; Logan, E.R.; Alves Dalla Corte, D.; Delacourt, C.; Gallant, B.M.; Boles, S.T.; Dahn, J.R.; Tam, H.; et al. Operando decoding of chemical and thermal events in commercial Na (Li)-ion cells via optical sensors. Nat. Energy 2020, 5, 674–683. [Google Scholar] [CrossRef]
  18. Campanella, C.E.; Cuccovillo, A.; Campanella, C.; Yurt, A.; Passaro, V.M. Fibre Bragg grating based strain sensors: Review of technology and applications. Sensors 2018, 18, 3115. [Google Scholar] [CrossRef] [Green Version]
  19. Moyo, P.; Brownjohn, J.M.W.; Suresh, R.; Tjin, S.C. Development of fiber Bragg grating sensors for monitoring civil infrastructure. Eng. Struct. 2005, 27, 1828–1834. [Google Scholar] [CrossRef]
  20. Li, R.; Chen, Y.; Tan, Y.; Zhou, Z.; Li, T.; Mao, J. Sensitivity enhancement of FBG-based strain sensor. Sensors 2018, 18, 1607. [Google Scholar] [CrossRef] [Green Version]
  21. Liu, M.; Wang, W.; Song, H.; Zhou, S.; Zhou, W. A high sensitivity FBG strain sensor based on flexible hinge. Sensors 2019, 19, 1931. [Google Scholar] [CrossRef] [Green Version]
  22. Kim, S.W.; Jeong, M.S.; Lee, I.; Kwon, I.B. Static mechanical characteristics of tin-coated fiber Bragg grating sensors. Sens. Actuators A 2014, 214, 156–162. [Google Scholar] [CrossRef]
  23. Li, X.; Shen, Z.; Zheng, M.; Hou, D.; Wen, Q. Great increase of the tensile strength in the lamellar PI-coated FBG sensors. Opt. Contin. 2023, 2, 110–118. [Google Scholar] [CrossRef]
  24. Oliveira, R.; Bilro, L.; Nogueira, R. Fabry-Pérot cavities based on photopolymerizable resins for sensing applications. Opt. Mater. Express 2018, 8, 2208–2221. [Google Scholar] [CrossRef]
  25. Leal-Junior, A.G.; Diaz, C.R.; Marques, C.; Frizera, A.; Pontes, M.J. Analysis of viscoelastic properties influence on strain and temperature responses of Fabry-Perot cavities based on UV-curable resins. Opt. Laser Technol. 2019, 120, 105743. [Google Scholar] [CrossRef]
  26. Leal-Junior, A.; Frizera, A.; Marques, C. Development and characterization of UV-resin coated fiber bragg gratings. Sensors 2020, 20, 3026. [Google Scholar] [CrossRef]
  27. Ramakrishnan, M.; Rajan, G.; Semenova, Y.; Lesiak, P.; Domanski, A.; Wolinski, T.; Boczkowska, A.; Farrell, G. The influence of thermal expansion of a composite material on embedded polarimetric sensors. Smart Mater. Struct. 2011, 20, 125002. [Google Scholar] [CrossRef] [Green Version]
  28. Lesiak, P.; Szeląg, M.; Budaszewski, D.; Plaga, R.; Mileńko, K.; Rajan, G.; Semenova, Y.; Farrell, G.; Boczkowska, A.; Domański, A.; et al. Influence of lamination process on optical fiber sensors embedded in composite material. Measurement 2012, 45, 2275–2280. [Google Scholar] [CrossRef]
  29. Zhang, W.; Zhang, M.; Wang, X.; Zhao, Y.; Jin, B.; Dai, W. The analysis of FBG central wavelength variation with crack propagation based on a self-adaptive multi-peak detection algorithm. Sensors 2019, 19, 1056. [Google Scholar] [CrossRef] [Green Version]
  30. Jin, X.; Yuan, S.; Chen, J. On crack propagation monitoring by using reflection spectra of AFBG and UFBG sensors. Sens. Actuators A 2019, 285, 491–500. [Google Scholar] [CrossRef]
  31. Mansoursamaei, M.; Malakzadeh, A. Simultaneous measurement of temperature and strain using a single fiber bragg grating on a tilted cantilever beam. Opt. Rev. 2021, 28, 289–294. [Google Scholar] [CrossRef]
  32. Park, C.S.; Joo, K.I.; Kang, S.W.; Kim, H.R. A PDMS-coated optical fiber Bragg grating sensor for enhancing temperature sensitivity. J. Opt. Soc. Korea 2011, 15, 329–334. [Google Scholar] [CrossRef] [Green Version]
  33. Bhaskar, C.V.N.; Pal, S.; Pattnaik, P.K. Recent advancements in fiber Bragg gratings based temperature and strain measurement. Results Opt. 2021, 5, 100130. [Google Scholar] [CrossRef]
  34. Mizunami, T.; Tatehata, H.; Kawashima, H. High-sensitivity cryogenic fibre-Bragg-grating temperature sensors using Teflon substrates. Meas. Sci. Technol. 2001, 12, 914. [Google Scholar]
  35. Shen, Y.; He, J.; Sun, T.; Grattan, K.T. High-temperature sustainability of strong fiber Bragg gratings written into Sb-Ge-codoped photosensitive fiber: Decay mechanisms involved during annealing. Opt. Lett. 2004, 29, 554–556. [Google Scholar] [CrossRef]
  36. Rajini-Kumar, R.; Suesser, M.; Narayankhedkar, K.G.; Krieg, G.; Atrey, M.D. Performance evaluation of metal-coated fiber Bragg grating sensors for sensing cryogenic temperature. Cryogenics 2008, 48, 142–147. [Google Scholar] [CrossRef]
  37. Parne, S.; Sai Prasad, R.L.N.; Dipankar, S.G.; Sai Shankar, M.; Kamineni, S. Polymer-coated fiber Bragg grating sensor for cryogenic temperature measurements. Microw. Opt. Technol. Let. 2011, 53, 1154–1157. [Google Scholar] [CrossRef]
  38. Mahakud, R.; Kumar, J.; Prakash, O.; Dixit, S.K. Study of the nonuniform behavior of temperature sensitivity in bare and embedded fiber Bragg gratings: Experimental results and analysis. Appl. Opt. 2013, 52, 7570–7579. [Google Scholar] [CrossRef] [PubMed]
  39. Hsiao, T.C.; Hsieh, T.S.; Chen, Y.C.; Huang, S.C.; Chiang, C.C. Metal-coated fiber Bragg grating for dynamic temperature sensor. Optik 2016, 127, 10740–10745. [Google Scholar] [CrossRef]
  40. Sampath, U.; Kim, D.; Kim, H.; Song, M. Polymer-coated FBG sensor for simultaneous temperature and strain monitoring in composite materials under cryogenic conditions. Appl. Opt. 2018, 57, 492–497. [Google Scholar] [CrossRef]
  41. Huang, F.; Chen, T.; Si, J.; Pham, X.; Hou, X. Fiber laser based on a fiber Bragg grating and its application in high-temperature sensing. Opt. Commun. 2019, 452, 233–237. [Google Scholar] [CrossRef]
  42. Fu, H.; Wang, S.; Chang, H.; You, Y. A high resolution and large range fiber Bragg grating temperature sensor with vortex beams. Opt. Fiber Technol. 2020, 60, 102369. [Google Scholar] [CrossRef]
  43. Leal-Junior, A.G.; Frizera, A.; Marques, C. Thermal and mechanical analyses of fiber Bragg gratings-embedded polymer diaphragms. IEEE Photonics Technol. Lett. 2020, 32, 623–626. [Google Scholar] [CrossRef]
  44. Hsu, C.Y.; Chiang, C.C.; Hsieh, T.S.; Hsu, H.C.; Tsai, L.; Hou, C.H. Study of fiber Bragg gratings with TiN-coated for cryogenic temperature measurement. Opt. Laser Technol. 2021, 136, 106768. [Google Scholar] [CrossRef]
  45. dos Santos, R.A.; Leal-Junior, A.G.; Ribeiro, M.R.; Benincá, E.A.; Marques, C.A.; Pereira, L.; Antunes, P.; Corrêa, J.H.; Pontes, M.J.; Neto, A.F.; et al. Datacenter thermal monitoring without blind spots: FBG-based quasi-distributed sensing. IEEE Sens. J. 2021, 21, 9869–9876. [Google Scholar] [CrossRef]
  46. Esposito, F.; Campopiano, S.; Iadicicco, A. Miniaturized strain-free fiber Bragg grating temperature sensors. IEEE Sens. J. 2022, 22, 16898–16903. [Google Scholar] [CrossRef]
  47. Dey, K.; Vangety, N.; Roy, S. Machine learning approach for simultaneous measurement of strain and temperature using FBG sensor. Sens. Actuators A 2022, 333, 113254. [Google Scholar] [CrossRef]
  48. Zhang, Z.; Shen, C.; Li, L. Temperature-independent fiber-Bragg-grating-based atmospheric pressure sensor. Opt. Commun. 2018, 411, 108–113. [Google Scholar] [CrossRef]
  49. Zhang, M.; Xing, Y.; Zhang, Z.; Chen, Q. Design and experiment of FBG-based icing monitoring on overhead transmission lines with an improvement trial for windy weather. Sensors 2014, 14, 23954–23969. [Google Scholar] [CrossRef] [Green Version]
Figure 1. (a) Structure and principle of the uncoated FBG and (b) structure and left view of the FBG coated with a planar UV-curable resin. The substrate material is 304 stainless steel.
Sensors 23 02811 g001
Figure 2. Schematic diagram of the experimental setup for fabricating the uncoated FBG sensors using UV laser based phase mask technology.
Sensors 23 02811 g002
Figure 3. The process for fabricating the FBG strain sensors. (a) Schematic diagrams and (b) real photos, same as schematic diagrams.
Sensors 23 02811 g003
Figure 4. Spectral comparisons of the FBG strain sensors before coating and after UV irradiation and heating: (a) FBG-S1, (b) FBG-S2, (c) FBG-S3, (d) FBG-S4. The optical spectra were measured by an optical spectrum analyzer (Yokogawa AQ6370C) and the test temperature was 25.0 °C.
Sensors 23 02811 g004
Figure 5. The relationship between the shift of the Bragg wavelength and the coating thickness (the coating thicknesses of the UV-curable resin for FBG-S1, FBG-S2, FBG-S3 and FBG-S4 are 0.54 mm, 0.51 mm, 0.63 mm and 0.56 mm, respectively).
Sensors 23 02811 g005
Figure 6. Central wavelengths of the FBG strain sensors as a function of temperature from −20 °C to 50 °C: (a) FBG-S1, (b) FBG-S2, (c) FBG-S3, (d) FBG-S4. The temperatures were program-controlled with a high and low temperature/humidity test chamber.
Sensors 23 02811 g006
Figure 7. Schematic of the experimental setup for strain measurements.
Sensors 23 02811 g007
Figure 8. Comparisons of the theoretical and practical microstrains of the four ESG sensors mounted on the cantilever beam as a function of the applied forces from 0 N to 27 N: (a) ESG-S1, (b) ESG-S2, (c) ESG-S3, (d) ESG-S4.
Sensors 23 02811 g008
Figure 9. Comparisons of the theoretical and practical microstrains of the four FBG strain sensors mounted on the cantilever beam as a function of the applied forces from 0 N to 27 N: (a) FBG-S1, (b) FBG-S2, (c) FBG-S3, (d) FBG-S4.
Sensors 23 02811 g009
Figure 10. Central wavelengths of the four FBG strain sensors as a function of microstrains: (a) FBG-S1, (b) FBG-S2, (c) FBG-S3, (d) FBG-S4.
Sensors 23 02811 g010
Figure 11. Central wavelengths of the four FBG strain sensors as a function of microstrains during the loading and unloading processes: (a) FBG-S1, (b) FBG-S2, (c) FBG-S3, (d) FBG-S4.
Sensors 23 02811 g011
Figure 12. Central wavelengths of the four FBG strain sensors as a function of microstrains during three repeated loading processes: (a) FBG-S1, (b) FBG-S2, (c) FBG-S3, (d) FBG-S4.
Sensors 23 02811 g012
Table 1. Optical parameter comparison of the FBG strain sensors in the initial state and after UV irradiation and heating. The test temperature was 25.0 °C.
FBG-S1FBG-S2FBG-S3FBG-S4
StateInitial StateCoated StateInitial StateCoated StateInitial StateCoated StateInitial StateCoated State
Wavelength/nm1539.299 1538.367 1539.636 1538.920 1539.623 1538.359 1539.675 1538.559
−3 dB bandwidth/nm0.512 0.517 0.632 0.630 0.634 0.632 0.618 0.612
SMSR/dB−20.50 −15.25 −19.50 −23.75 −18.87 −20.75 −17.12 −17.25
Table 2. Performance comparisons of various FBG sensors reported in the last 20 years (in chronological order).
YearMaterials/Design Measuring   Temperature   ( ° C ) Maximum   Sensitivity   ( pm / ° C ) Reference
MinimumMaximum
2001FBG fixed on Teflon substrate−19627150[34]
2004Strong FBG2595015.14[35]
2008Metal coated FBG−2692733.5[36]
2011Teflon coated FBG−1962512.85[37]
2013An embedded FBG309030.9[38]
2016Chromium nitride coated FBG10065014[39]
2018Polymer coated FBG−1802548[40]
2019Fs-FBG300100015.9[41]
2020FBG based on vortex light2742714.42[42]
2020FBG embedded diaphragm203549.8[43]
2021Titanium nitride coated FBG−1952010.71[44]
2021Normal FBG26508.75[45]
2022Metallic packaged FBG55028.9[46]
2022Integrated FBG025040[47]
2023Planar UV-curable resin coated FBG−205055.7Present work
Table 3. Comparisons of the installation information for four ESG sensors and four FBG strain sensors that were mounted on the cantilever beam.
ESG-S1/ESG-S2FBG-S3/FBG-S4ESG-S3/ESG-S4FBG-S1/FBG-S2
L (mm)307.0257.0228.0164.0
W (mm)31.025.922.916.6
Ratio ( L / W )9.9039.9239.9569.879
Disclaimer/Publisher’s Note: The statements, opinions and data contained in all publications are solely those of the individual author(s) and contributor(s) and not of MDPI and/or the editor(s). MDPI and/or the editor(s) disclaim responsibility for any injury to people or property resulting from any ideas, methods, instructions or products referred to in the content.

