

Assessment of a New Change of Direction Detection Algorithm Based on Inertial Data


Abstract
:1. Introduction
2. Materials and Methods
2.1. Participants
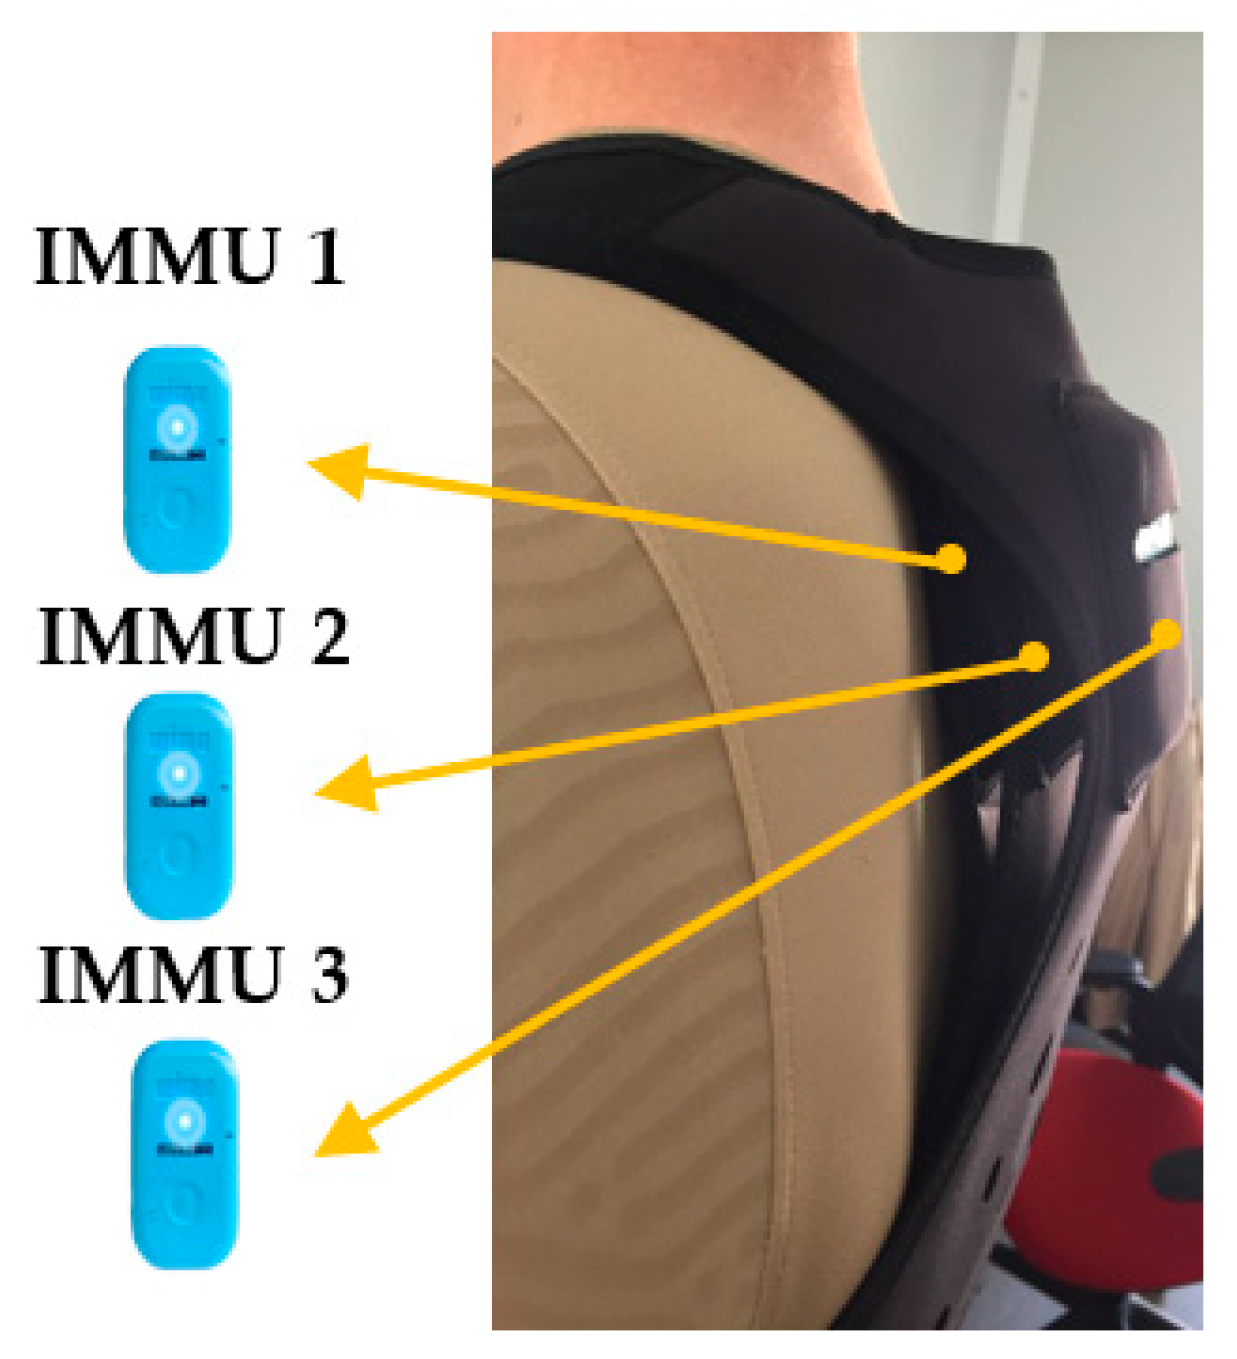
2.2. Instrument
2.2.1. Algorithm Used and Configuration of Parameters
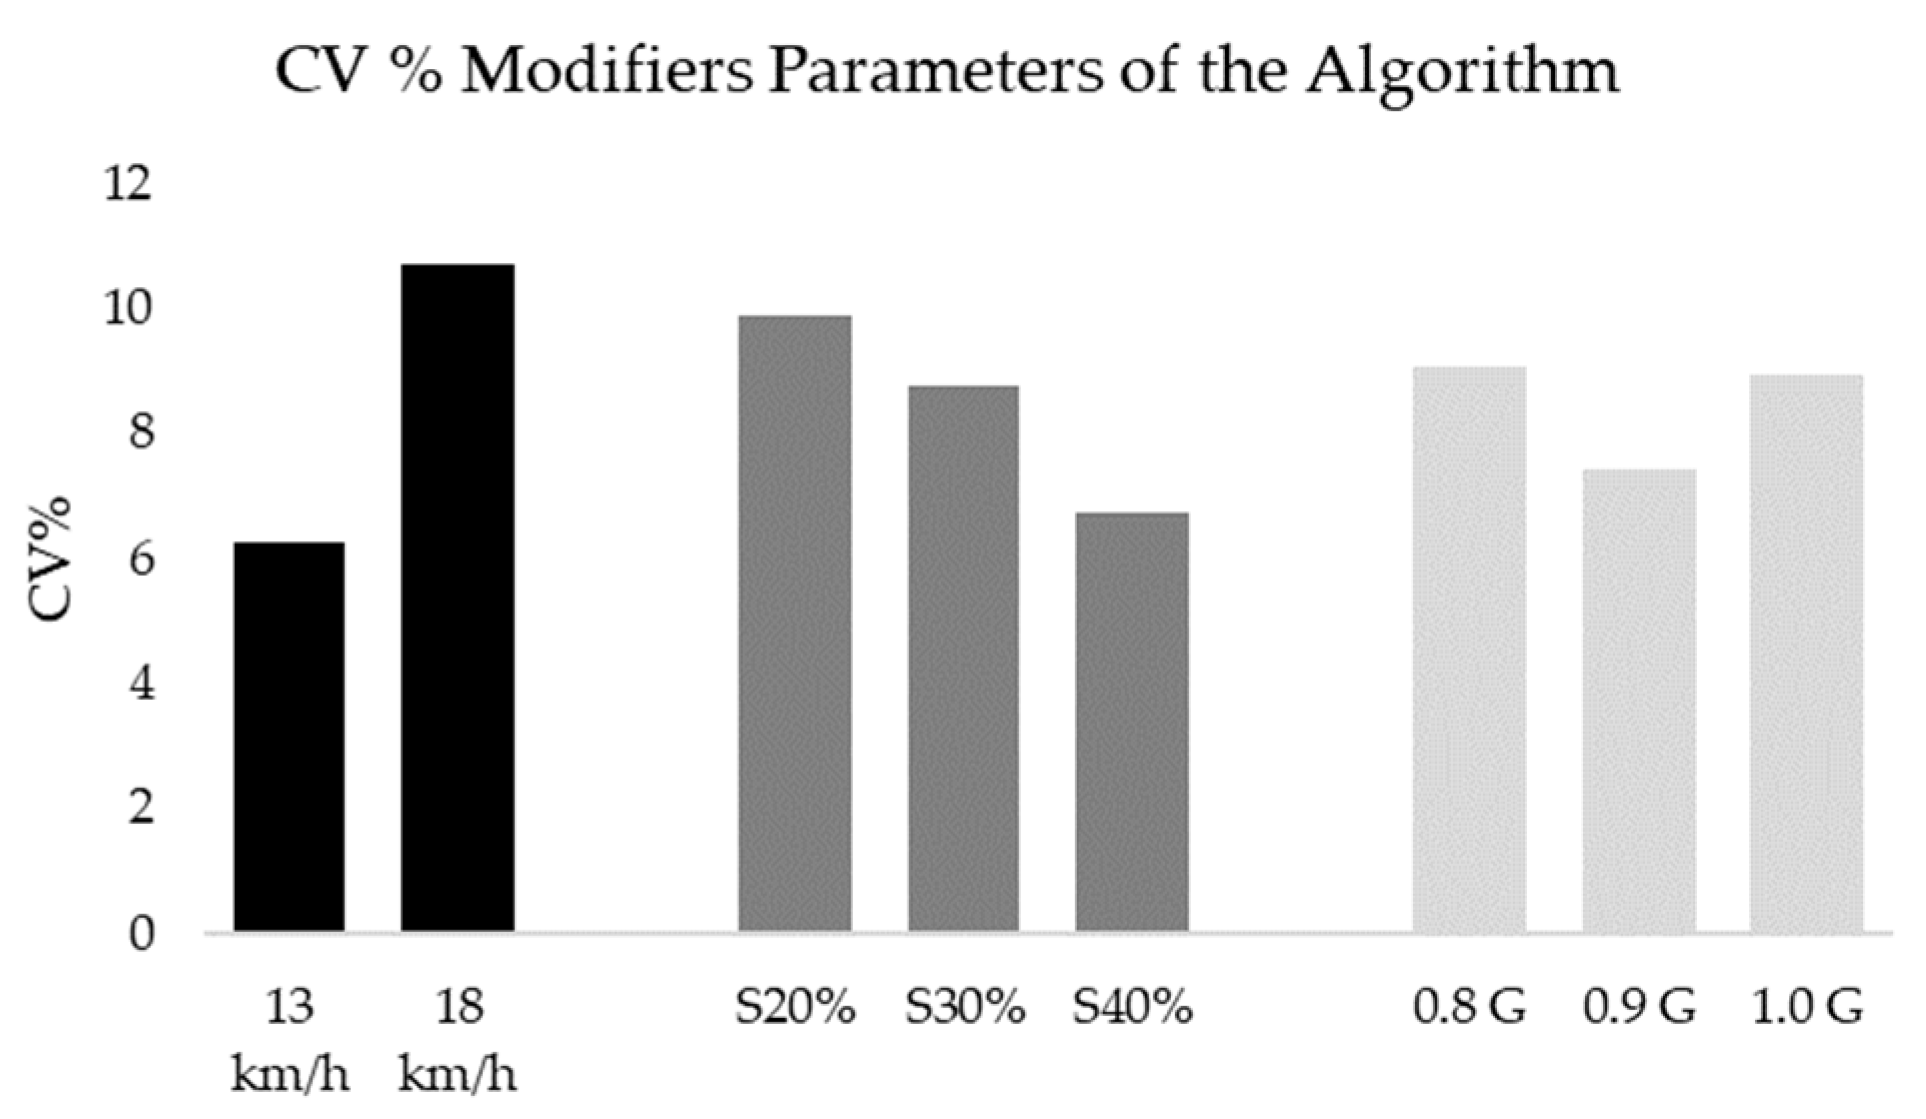
- Minimum intensity peak (PmI): minimum gravitational acceleration (G) that the movement must reach in order to be recorded.
- % Smoothing: smoothing percentage of the circular mean filter that is applied to the signal before processing it with the algorithm.
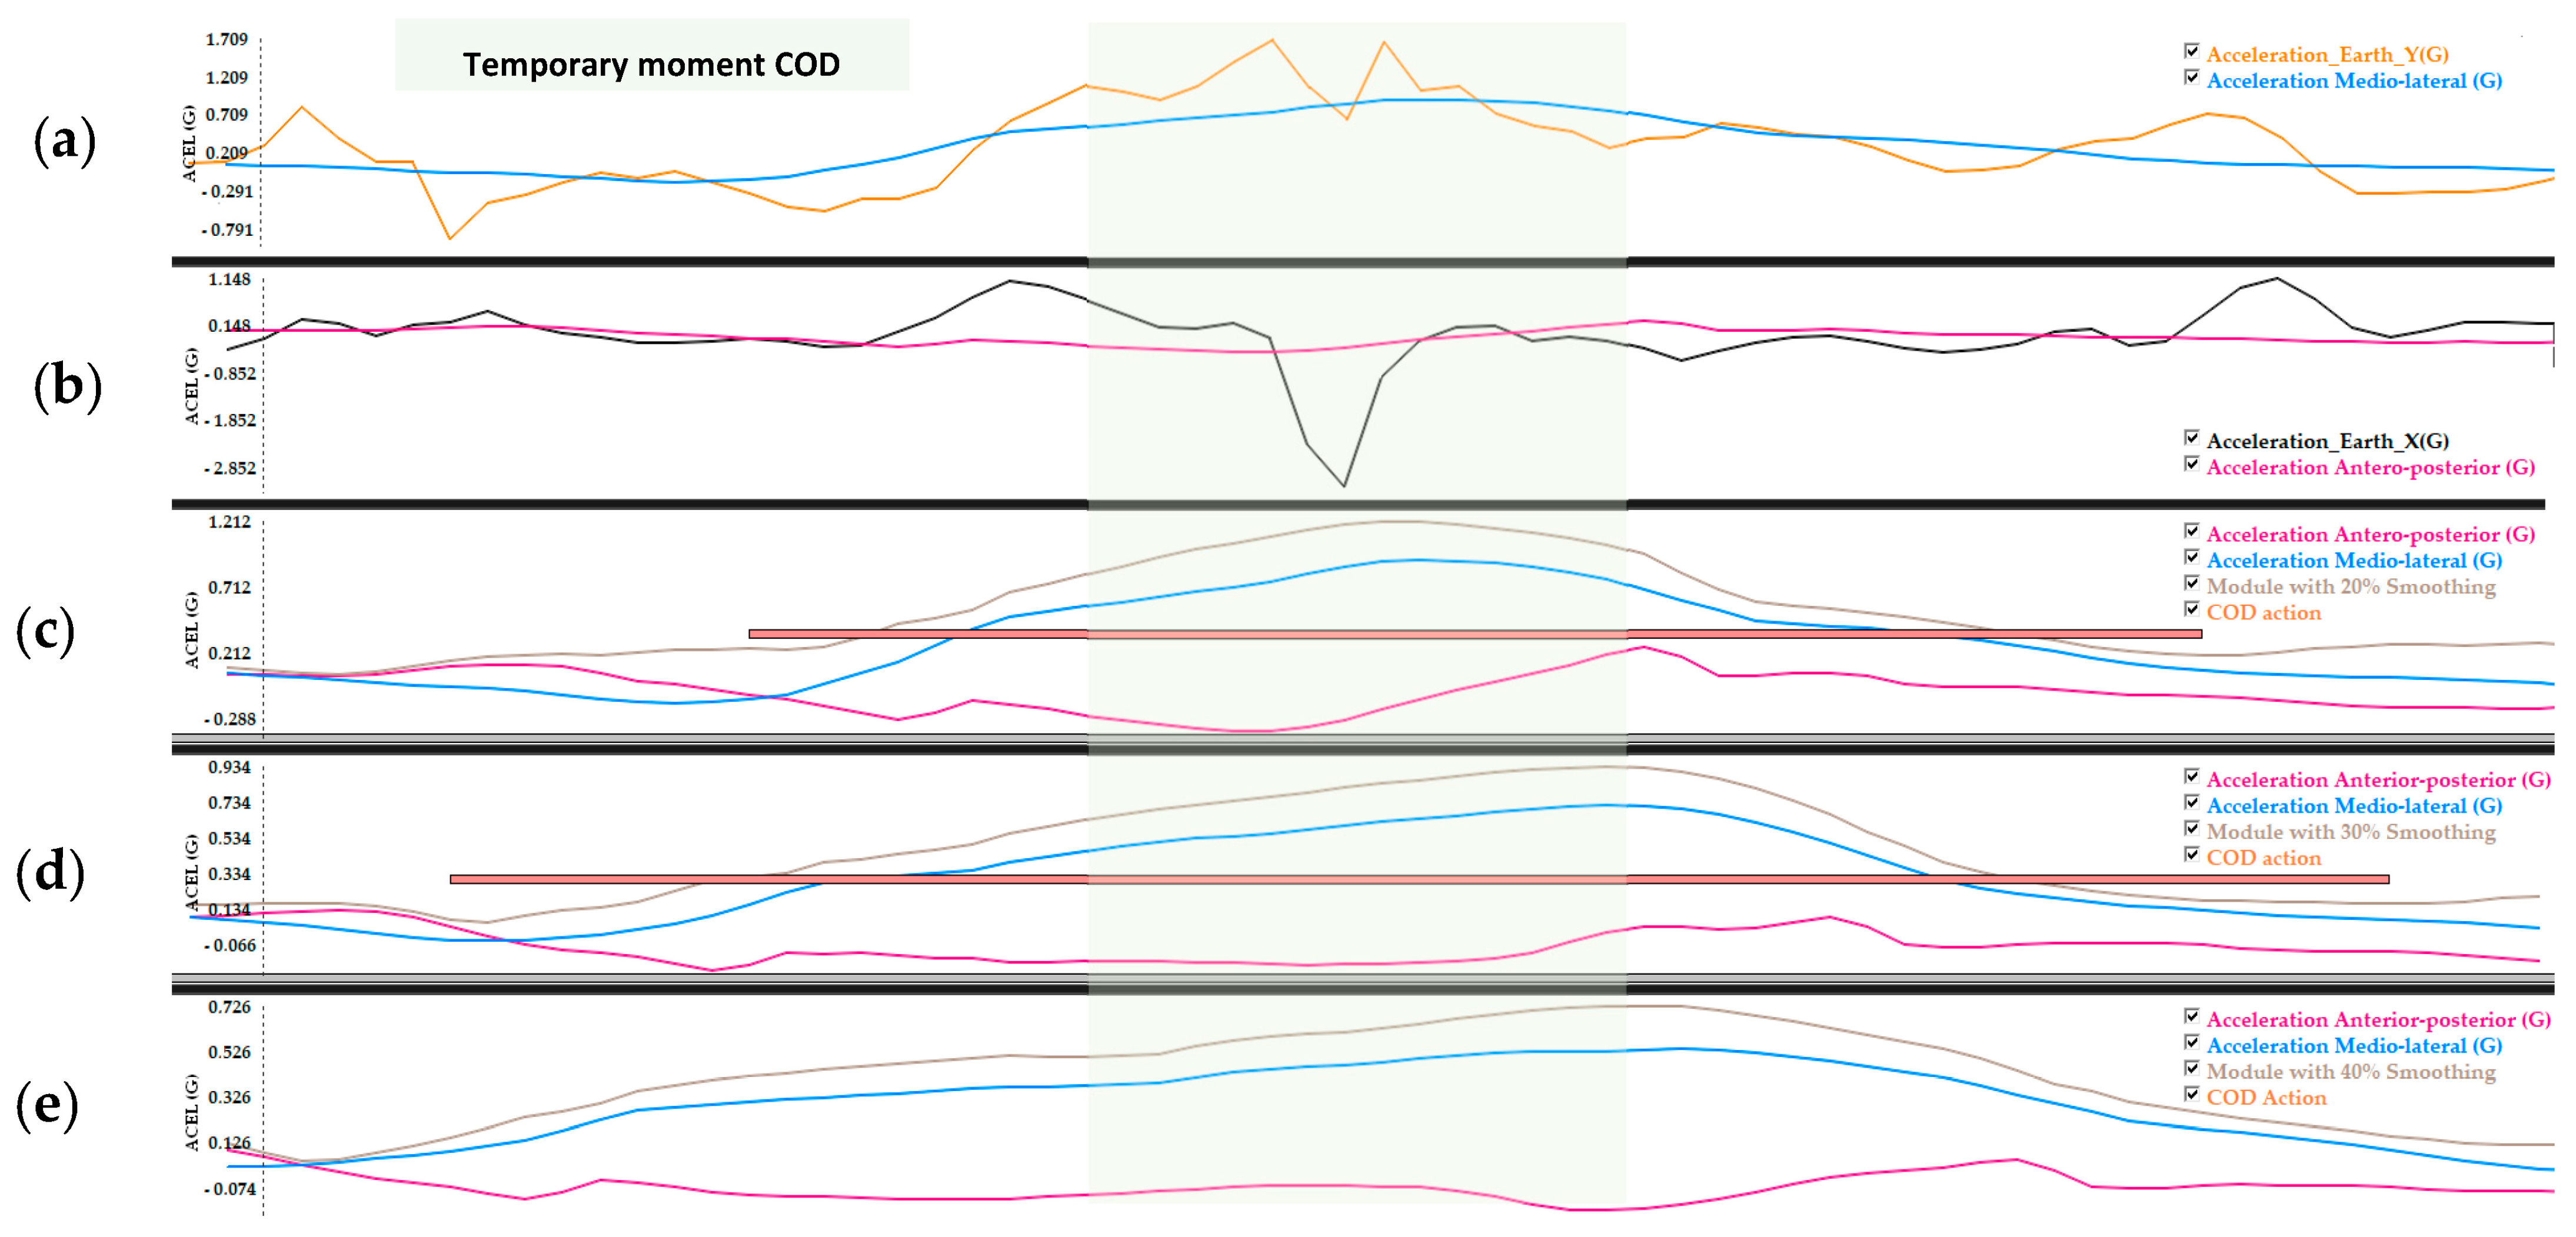
2.2.2. Detection of Mediolateral and Anteroposterior Acceleration Orientation
2.2.3. % Signal Smoothing and COIs Unification
2.2.4. Parameter Settings
2.3. Procedures
2.4. Statistical Analysis
3. Results
4. Discussion
5. Conclusions
Author Contributions
Funding
Informed Consent Statement
Data Availability Statement
Conflicts of Interest
References
- Sheppard, J.; Young, W.; Doyle, T.; Sheppard, T.; Newton, R. An evaluation of a new test of reactive agility and its relationship to sprint speed and change of direction speed. J. Sci. Med. Sport 2006, 9, 342–349. [Google Scholar] [CrossRef] [Green Version]
- Bloomfield, J.; Polman, R.; O’Donoghue, P. Physical Demands of Different Positions in FA Premier League Soccer. J. Sports Sci. Med. 2007, 6, 63–70. [Google Scholar]
- Martínez Hernández, D.; Quinn, M.; Jones, P. Linear Advancing Actions Followed by Deceleration and Turn Are the Most Common Movements Preceding Goals in Male Professional Soccer. Sci. Med. Footb. 2023, 7, 25–33. [Google Scholar] [CrossRef] [PubMed]
- Dos’Santos, T.; Thomas, C.; Comfort, P.; Jones, P. The effect of angle and velocity on change of direction biomechanics: An angle-velocity trade-off. Sport. Med. 2018, 48, 2235–2253. [Google Scholar] [CrossRef] [PubMed] [Green Version]
- Dos’Santos, T.; Thomas, C.; Comfort, P.; Jones, P.A. The Effect of Training Interventions on Change of Direction Biomechanics Associated with Increased Anterior Cruciate Ligament Loading: A Scoping Review. Sports Med. 2019, 49, 1837–1859. [Google Scholar] [CrossRef] [PubMed] [Green Version]
- Dos’Santos, T.; Mcburnie, A.; Thoma, C. Biomechanical Comparison of Cutting Techniques: A Review and Practical Applications. Strength Cond. J. 2019, 41, 45–54. [Google Scholar]
- McBurnie, A.; Harper, D.; Jones, P.; Dos’Santos, T. Deceleration Training in Team Sports: Another Potential ‘Vaccine’for Sports-Related Injury? Sport. Med. 2021, 52, 1–12. [Google Scholar] [CrossRef]
- De Hoyo, M.; Cohen, D.; Sañudo, B.; Carrasco, L.; Álvarez-Mesa, A.; Del Ojo, J.; Domínguez-Cobo, S.; Mañas, V.; Otero-Esquina, C. Influence of football match time–motion parameters on recovery time course of muscle damage and jump ability. J. Sport. Sci. 2016, 34, 1363–1370. [Google Scholar] [CrossRef]
- Harper, D.J.; Carling, C.; Kiely, J. High-Intensity Acceleration and Deceleration Demands in Elite Team Sports Competitive Match Play: A Systematic Review and Meta-Analysis of Observational Studies. Sports Med. 2019, 49, 1923–1947. [Google Scholar] [CrossRef] [Green Version]
- Veale, J.P.; Pearce, A.J.; Carlson, J.S. Reliability and Validity of a Reactive Agility Test for Australian Football. Int. J. Sports Physiol. Perform. 2010, 5, 239–248. [Google Scholar] [CrossRef] [Green Version]
- Benson, L.; Räisänen, A.; Volkova, V.; Pasanen, K.; Emery, C. Workload a wearness: Monitoring workload in team sports with wearable technology. A scoping review. J. Orthop. Sport. Phys. Ther. 2020, 50, 549–563. [Google Scholar] [CrossRef]
- Cummins, C.; Orr, R.; O’Connor, H.; West, C. Global Positioning Systems (GPS) and Microtechnology Sensors in Team Sports: A Systematic Review. Sports Med. 2013, 43, 1025–1042. [Google Scholar] [CrossRef]
- Chambers, R.; Gabbett, T.J.; Cole, M.H.; Beard, A. The Use of Wearable Microsensors to Quantify Sport-Specific Movements. Sports Med. 2015, 45, 1065–1081. [Google Scholar] [CrossRef] [PubMed]
- Camomilla, V.; Bergamini, E.; Fantozzi, S.; Vannozzi, G. Trends Supporting the In-Field Use of Wearable Inertial Sensors for Sport Performance Evaluation: A Systematic Review. Sensors 2018, 18, 873. [Google Scholar] [CrossRef] [PubMed] [Green Version]
- Alanen, A.; Räisänen, A.; Benson, L.; Pasanen, K. The use of inertial measurement units for analyzing change of direction movement in sports: A scoping review. Int. J. Sports Sci. Coach. 2021, 16, 1332–1353. [Google Scholar] [CrossRef]
- Hernández-Belmonte, A.; Bastida-Castillo, A.; Gómez-Carmona, C.; Pino-Ortega, J. Validity and reliability of an inertial device (WIMU PRO TM) to quantify physical activity level through steps measurement. J. Sport. Med. Phys. Fit. 2019, 59, 587–592. [Google Scholar]
- García-Pinillos, F.; Latorre-Román, P.; Valdivieso-Ruano, F.; Balsalobre-Fernández, C.; Párraga-Montilla, J. Validity and reliability of the WIMU® system to measure barbell velocity during the half-squat exercise. J. Sport. Eng. Tech.-Nology 2019, 233, 408–415. [Google Scholar]
- Muyor, J.; Atkinson, G.; Nevill, A.M.; Ayala, F.; de Baranda, P.S.; Croix, M.D.S.; Santonja, F.; Bohannon, R.; Gajdosik, R.; LeVeau, B.F.; et al. Validity and Reliability of a New Device (WIMU®) for Measuring Hamstring Muscle Extensibility. Int. J. Sports Med. 1998, 38, 691–695. [Google Scholar] [CrossRef]
- Ferro, A.; Floría, P.; Villacieros, J.; Muñoz-López, A. Maximum velocity during loaded countermovement jumps obtained with an accelerometer, linear encoder and force platform: A comparison of technologies. J. Biomech. 2019, 95, 109281. [Google Scholar] [CrossRef]
- Waegli, A.; Skaloud, J. Optimization of two GPS/MEMS-IMU integration strategies with application to sports. GPS Solut. 2009, 13, 315–326. [Google Scholar] [CrossRef] [Green Version]
- Sabatini, A.M. Estimating Three-Dimensional Orientation of Human Body Parts by Inertial/Magnetic Sensing. Sensors 2011, 11, 1489–1525. [Google Scholar] [CrossRef] [Green Version]
- Luinge, H.J.; Veltink, P.H. Measuring orientation of human body segments using miniature gyroscopes and accelerometers. Med. Biol. Eng. Comput. 2005, 43, 273–282. [Google Scholar] [CrossRef] [PubMed]
- Sabatini, A.M. Quaternion-based strap-down integration method for applications of inertial sensing to gait analysis. Med. Biol. Eng. Comput. 2005, 43, 94–101. [Google Scholar] [CrossRef] [PubMed]
- Kalman, R.E. A New Approach to Linear Filtering and Prediction Problems. J. Basic Eng. 1960, 82, 35–45. [Google Scholar] [CrossRef] [Green Version]
- Woodman, O. An Introduction to Inertial Navigation. UCAM-CL-TR; University of Cambridge: Cambridge, UK, 2007; Available online: https://www.cl.cam.ac.uk//techreports/UCAM-CL-TR-696.pdf (accessed on 4 January 2023).
- Camomilla, V.; Dumas, R.; Cappozzo, A. Human movement analysis: The soft tissue artefact issue. J. Biomech. 2017, 62, 1–4. [Google Scholar] [CrossRef] [PubMed] [Green Version]
- Bachmann, E.; Yun, X.; Peterson, C. An investigation of the effects of magnetic variations on inertial/magnetic orientation sensors. In Proceedings of the IEEE International Conference on Robotics and Automation, New Orleans, LA, USA, 26 April–1 May 2004; pp. 1115–1122. Available online: https://ieeexplore.ieee.org/document/1307974 (accessed on 4 January 2023).
- Balloch, A.S.; Meghji, M.; Newton, R.U.; Hart, N.H.; Weber, J.A.; Ahmad, I.; Habibi, D. Assessment of a Novel Algorithm to Determine Change-of-Direction Angles While Running Using Inertial Sensors. J. Strength Cond. Res. 2020, 34, 134–144. [Google Scholar] [CrossRef] [PubMed]
- Koo, T.K.; Li, M.Y. A Guideline of Selecting and Reporting Intraclass Correlation Coefficients for Reliability Research. J. Chiropr. Med. 2016, 15, 155–163. [Google Scholar] [CrossRef] [PubMed] [Green Version]
- Batterham, A.M.; Hopkins, W.G. Making Meaningful Inferences about Magnitudes. Int. J. Sports Physiol. Perform. 2006, 1, 50–57. [Google Scholar] [CrossRef] [PubMed] [Green Version]
- Liu, T.; Inoue, Y.; Shibata, K. Measurement of soft tissue deformation to improve the accuracy of a body-mounted motion sen-sor. J. Med. Devices 2009, 3, 035001. Available online: http://www.mech.kochi-tech.ac.jp/liutao/ASME-1.pdf (accessed on 4 January 2023). [CrossRef]
- McNamara, D.J.; Gabbett, T.J.; Chapman, P.; Naughton, G.; Farhart, P. The Validity of Microsensors to Automatically Detect Bowling Events and Counts in Cricket Fast Bowlers. Int. J. Sports Physiol. Perform. 2015, 10, 71–75. [Google Scholar] [CrossRef]
- Gabbett, T.; Jenkins, D.; Abernethy, B. Physical collisions and injury during professional rugby league skills training. J. Sci. Med. Sport 2010, 13, 578–583. [Google Scholar] [CrossRef] [PubMed]
- Roell, M.; Mahler, H.; Lienhard, J.; Gehring, D.; Gollhofer, A.; Roecker, K. Validation of Wearable Sensors during Team Sport-Specific Movements in Indoor Environments. Sensors 2019, 19, 3458. [Google Scholar] [CrossRef] [Green Version]
- Duffield, R.; Reid, M.; Baker, J.; Spratford, W. Accuracy and reliability of GPS devices for measurement of movement patterns in confined spaces for court-based sports. J. Sci. Med. Sport 2010, 13, 523–525. [Google Scholar] [CrossRef] [PubMed]
- Johnston, R.; Watsford, M.; Kelly, S.; Pine, M.; Spurrs, R. Validity and interunit reliability of 10 Hz and 15 Hz GPS units for as-sessing athlete movement demands. J. Strength Cond. Res. 2014, 28, 1649–1655. [Google Scholar] [CrossRef] [PubMed]


| Start Velocity (km/h) | % Smoothing | Minimum Intensity Peak (PmI) |
|---|---|---|
| 13 km/h | 20% | 0.8 G |
| 18 km/h | 30% | 0.9 G |
| 40% | 1.0 G |
| Velocity | %S | G | VIDEO | IMMU1 | IMMU2 | IMMU3 | ||||||||||||
|---|---|---|---|---|---|---|---|---|---|---|---|---|---|---|---|---|---|---|
| Mean ± SD | Mean ± SD | % Diff | Effect Size (Cohen’s d) | CI 95% (Lower/Upper) | CV (%) | Mean ± SD | % Diff | Effect Size (Cohen’s d) | CI 95% (Lower/Upper) | CV (%) | Mean ± SD | % Diff | Effect Size (Cohen’s d) | CI 95% (Lower/Upper) | CV (%) | |||
| at 13 km/h | 20 | 0.8 | 38.4 ± 3.6 | 78.0 ± 9.3 | 103 | 5.62 | 3.3/7.9 | 12 | 83.0 ± 18.6 | 116 | 3.33 | 1.7/4.9 | 22 | 91.8 ± 11.7 | 139 | 6.16 | 3.6/8.6 | 13 |
| 0.9 | 63.2 ± 6.2 | 64.5 | 4.90 | 2.8/6.9 | 10 | 65.5 ± 10.1 | 71 | 3.57 | 1.9/5.2 | 15 | 72.3 ± 9.5 | 88 | 4.71 | 2.7/6.7 | 13 | |||
| 1.0 | 54.6 ± 7.1 | 42 | 2.88 | 1.4/4.3 | 13 | 56.0 ± 5.2 | 46 | 3.90 | 2.1/5.7 | 9 | 59.7 ± 7.3 | 56 | 3.71 | 2.0/5.4 | 12 | |||
| 30 | 0.8 | 47.2 ± 6.4 | 23 | 1.69 | 0.4/2.9 | 14 | 45.0 ± 4.4 | 17 | 1.60 | 0.4/2.8 | 10 | 52.0 ± 7.0 | 35 | 2.44 | 1.0/3.8 | 13 | ||
| 0.9 | 36.8 ± 4.4 | −4 | −0.39 | −1.4/0.6 | 12 | 38.5 ± 3.7 | 0 | 0.02 | −1.0/1.0 | 10 | 43.5 ± 7.5 | 13 | 0.86 | −0.2/1.9 | 17 | |||
| 1.0 | 33.8 ± 6.1 | −12 | −0.84 | −1.9/0.2 | 20 | 32.8 ± 3.4 | −15 | −1.61 | −2.8/−0.4 | 10 | 36.0 ± 5.6 | −6 | −0.51 | −1.5/0.5 | 16 | |||
| 40 | 0.8 | 36.6 ± 4.4 | −5 | −0.44 | −1.5/0.6 | 12 | 35.8 ± 2.2 | −7 | −0.89 | −1.9/0.2 | 6 | 37.2 ± 4.4 | −3 | −0.29 | −1.3/0.7 | 23 | ||
| 0.9 | 34.4 ± 7.6 | −10 | −0.67 | −1.7/0.3 | 22 | 31.2 ± 1.3 | −19 | −2.65 | −4/−1.2 | 4 | 35.0 ± 8.1 | −9 | −1.69 | −2.9/−0.4 | 23 | |||
| 1.0 | 30.4 ± 6.4 | −21 | −1.54 | −2.7/−0.3 | 21 | 26.0 ± 3.7 | −32 | −3.40 | −5/−1.7 | 14 | 29.5 ± 7.8 | −23 | −1.40 | −2.6/−0.3 | 26 | |||
| at 18 km/h | 20 | 0.8 | 31.2 ± 3.7 | 86.6 ± 26.6 | 178 | 2.90 | 1.4/4.4 | 31 | 90.2 ± 35.3 | 189 | 2.35 | 1.0/3.7 | 39 | 112 ± 40.8 | 259 | 3.00 | 1.4/4.5 | 36 |
| 0.9 | 73.8 ± 26.1 | 137 | 2.28 | 0.9/3.6 | 35 | 77.4 ± 28.2 | 148 | 2.29 | 0.9/3.6 | 36 | 93.6 ± 34.9 | 200 | 2.51 | 1.1/3.9 | 37 | |||
| 1.0 | 63.6 ± 22.6 | 104 | 2.00 | 0.7/3.2 | 36 | 65.6 ± 22.8 | 110 | 2.10 | 0.8/3.4 | 35 | 79.2 ± 29.7 | 154 | 2.26 | 0.9/3.6 | 38 | |||
| 30 | 0.8 | 50.6 ± 13.9 | 62 | 1.90 | 0.6/3.1 | 27 | 46.5 ± 11.4 | 49 | 1.80 | 0.5/3.0 | 24 | 58.25 ± 16.5 | 87 | 2.26 | 0.9/3.5 | 28 | ||
| 0.9 | 42.6 ± 11.9 | 37 | 1.20 | 0.1/2.4 | 28 | 42 ± 10.1 | 35 | 1.42 | 0.2/2.5 | 24 | 49.2 ± 10.4 | 58 | 2.30 | 0.9/3.6 | 21 | |||
| 1.0 | 30.6 ± 3.4 | −1 | −0.16 | −1.2/0.8 | 11 | 35.6 ± 9.7 | 14 | 0.59 | −0.4/1.6 | 27 | 38.2 ± 1.6 | 22 | 2.45 | 1.0/3.8 | 4 | |||
| 40 | 0.8 | 41.6 ± 10 | 33 | 1.37 | 0.2/2.5 | 24 | 40.8 ± 8.3 | 31 | 1.49 | 0.3/2.6 | 20 | 49.4 ± 12.2 | 58 | 2.00 | 0.7/3.2 | 25 | ||
| 0.9 | 29.8 ± 4.0 | −4 | −0.36 | −1.4/0.6 | 13 | 30.8 ± 4.1 | −1 | −0.10 | −1.1/0.9 | 13 | 30.6 ± 3.0 | −2 | −0.17 | −1.2/0.8 | 10 | |||
| 1.0 | 23.4 ± 7.4 | −25 | −1.33 | −2.4/−0.1 | 32 | 29.4 ± 8.9 | −6 | −0.26 | −1.3/0.7 | 30 | 29.4 ± 4.9 | −6 | −0.40 | −1.4/0.6 | 17 | |||
Disclaimer/Publisher’s Note: The statements, opinions and data contained in all publications are solely those of the individual author(s) and contributor(s) and not of MDPI and/or the editor(s). MDPI and/or the editor(s) disclaim responsibility for any injury to people or property resulting from any ideas, methods, instructions or products referred to in the content. |
© 2023 by the authors. Licensee MDPI, Basel, Switzerland. This article is an open access article distributed under the terms and conditions of the Creative Commons Attribution (CC BY) license (https://creativecommons.org/licenses/by/4.0/).
Share and Cite
Avilés, R.; Souza, D.B.; Pino-Ortega, J.; Castellano, J. Assessment of a New Change of Direction Detection Algorithm Based on Inertial Data. Sensors 2023, 23, 3095. https://doi.org/10.3390/s23063095
Avilés R, Souza DB, Pino-Ortega J, Castellano J. Assessment of a New Change of Direction Detection Algorithm Based on Inertial Data. Sensors. 2023; 23(6):3095. https://doi.org/10.3390/s23063095
Chicago/Turabian StyleAvilés, Roberto, Diego Brito Souza, José Pino-Ortega, and Julen Castellano. 2023. "Assessment of a New Change of Direction Detection Algorithm Based on Inertial Data" Sensors 23, no. 6: 3095. https://doi.org/10.3390/s23063095