
The Gamma and Neutron Sensor System for Rapid Dose Rate Mapping in the CLEANDEM Project
 ,
,  , , , , and
Abstract
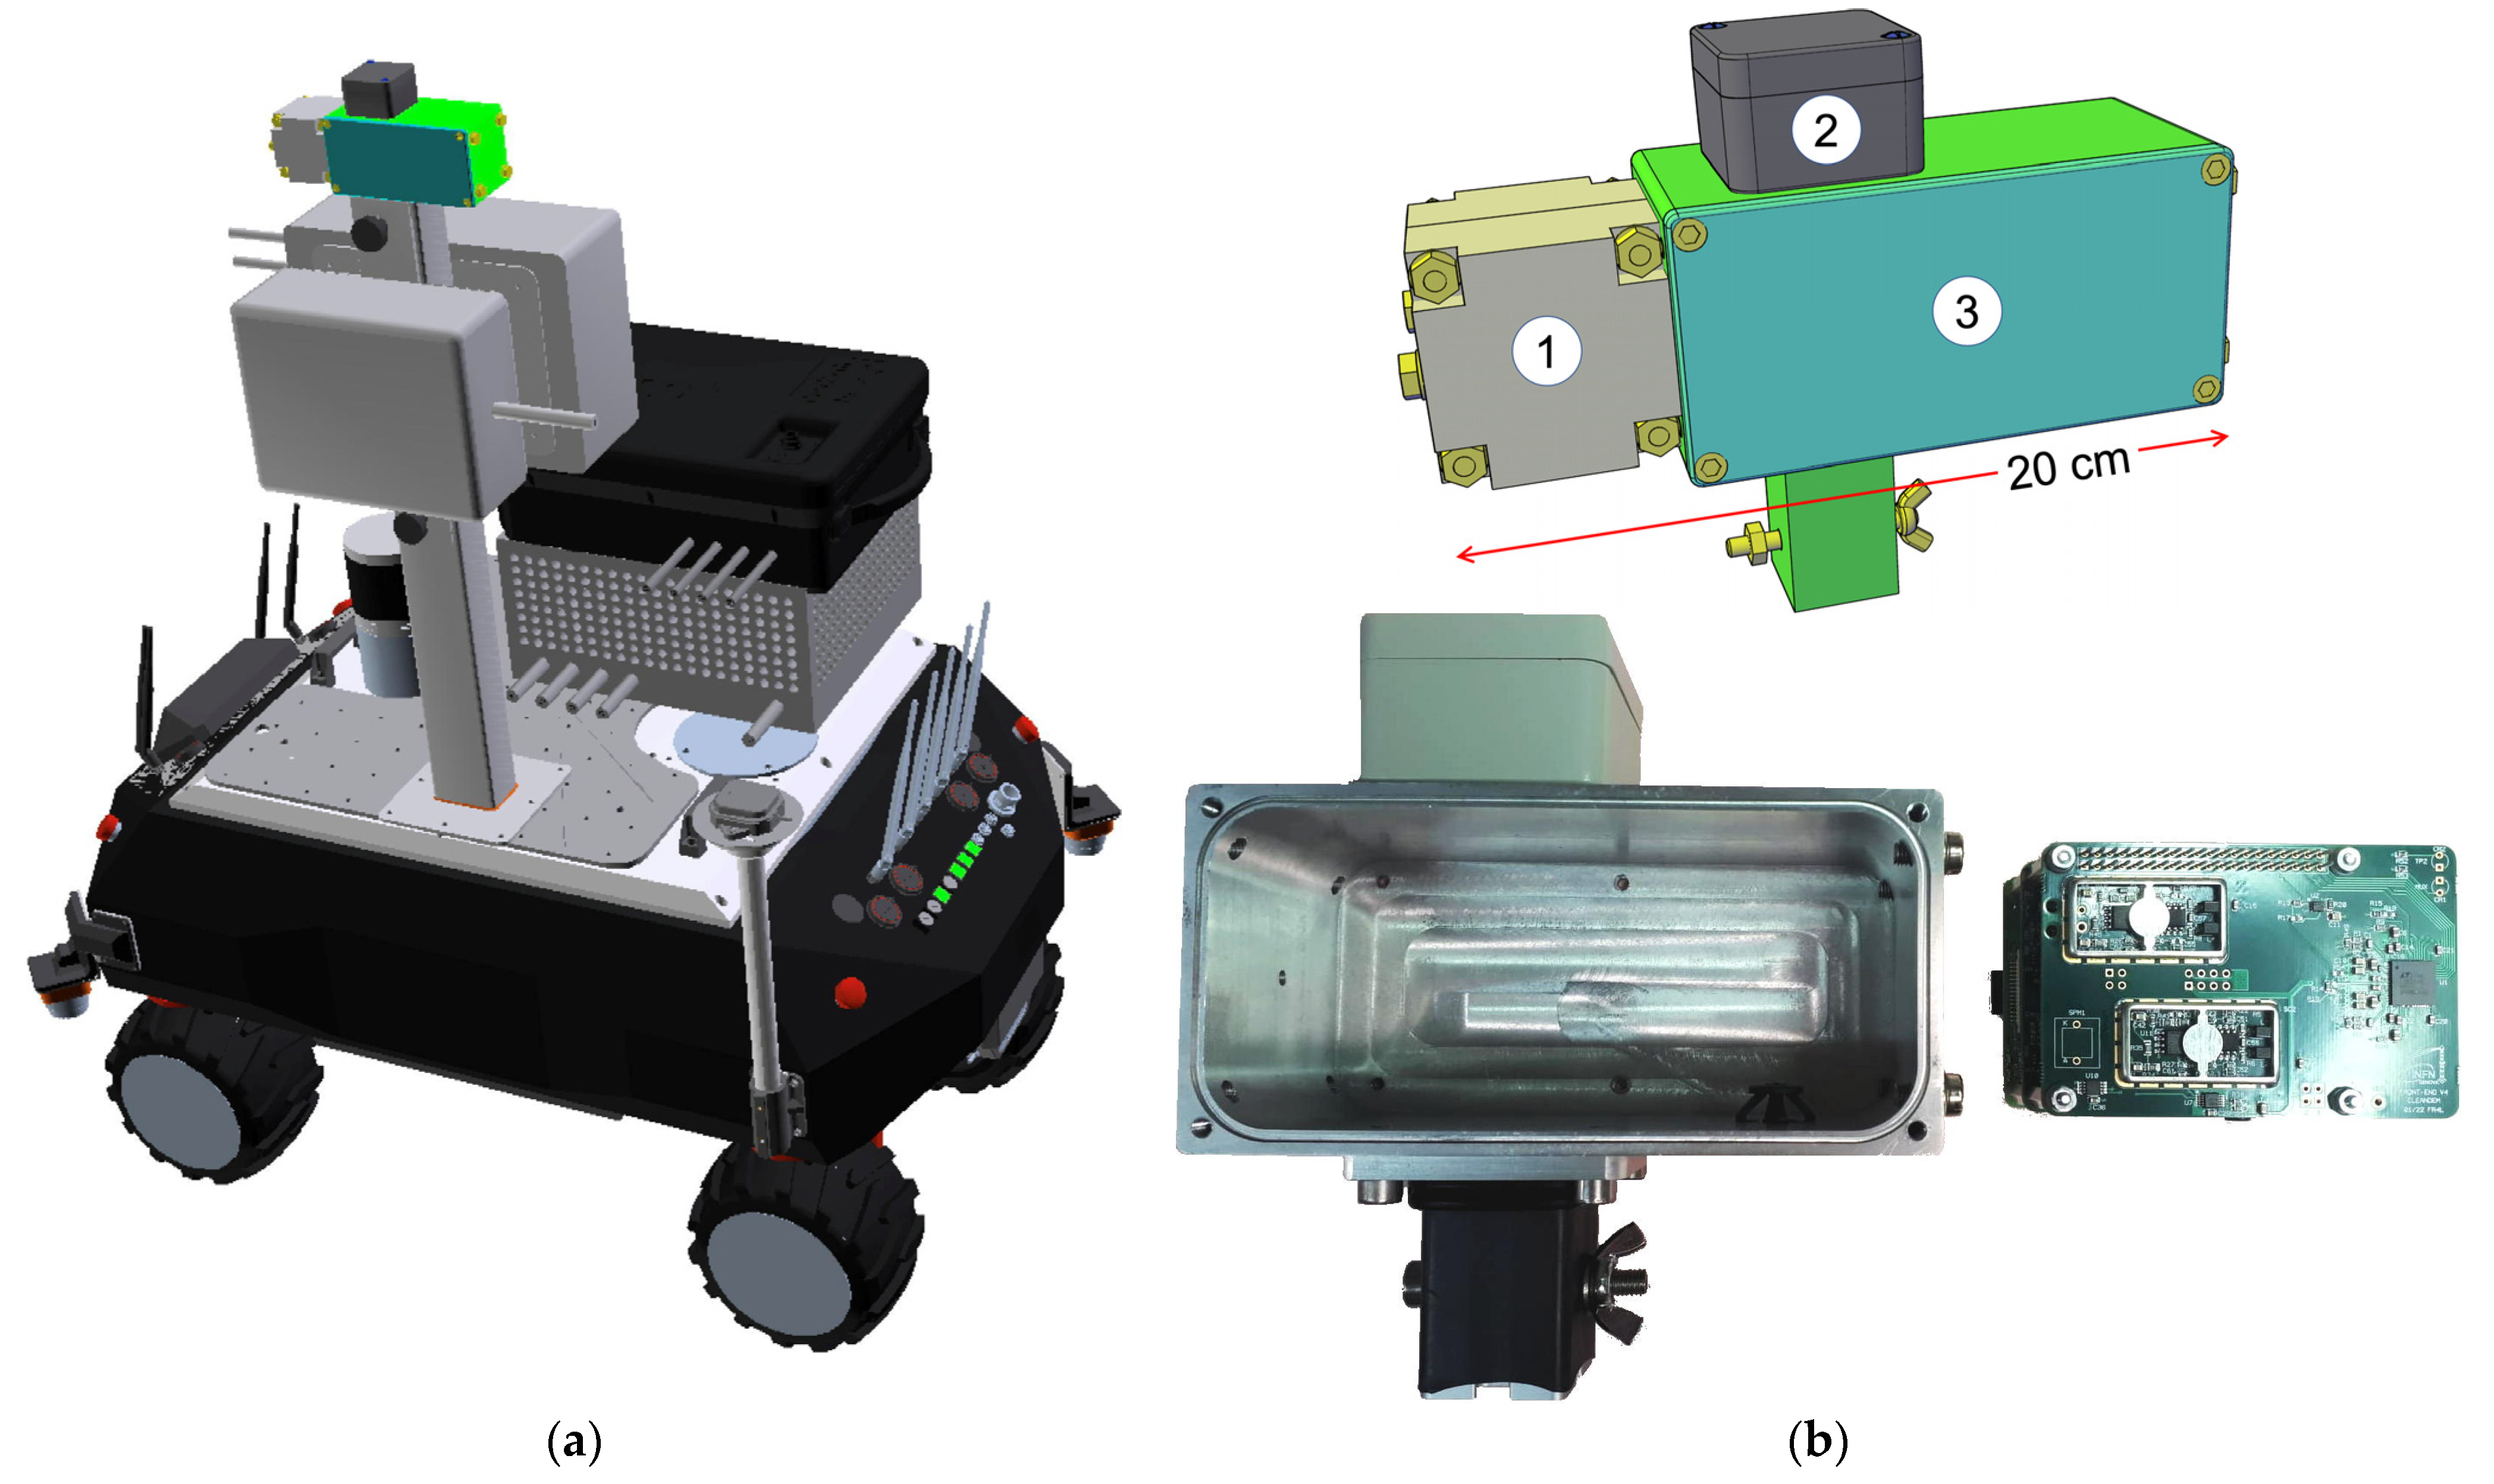
:1. Introduction
2. Materials and Methods
2.1. Gamma Ray Detection
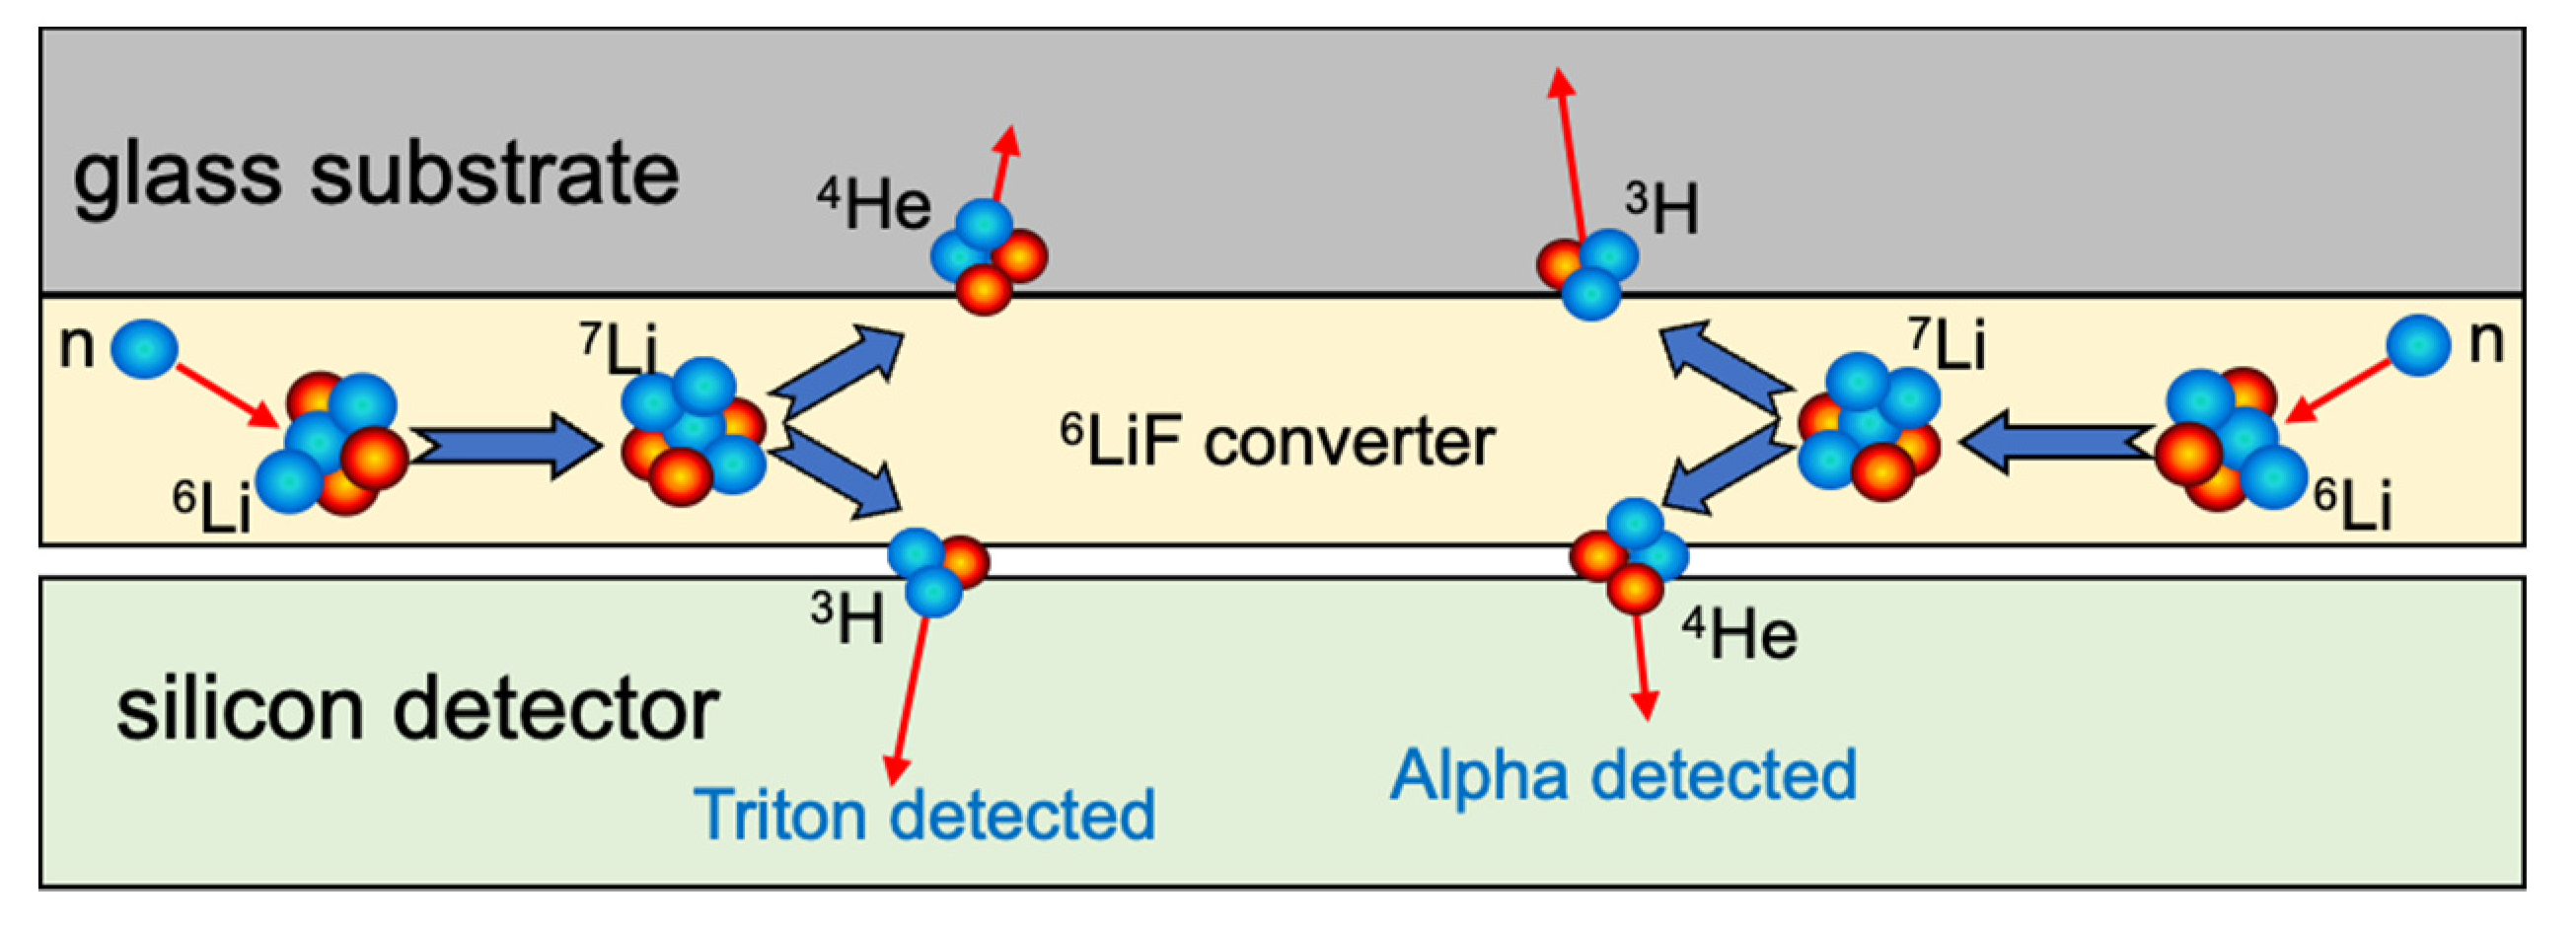
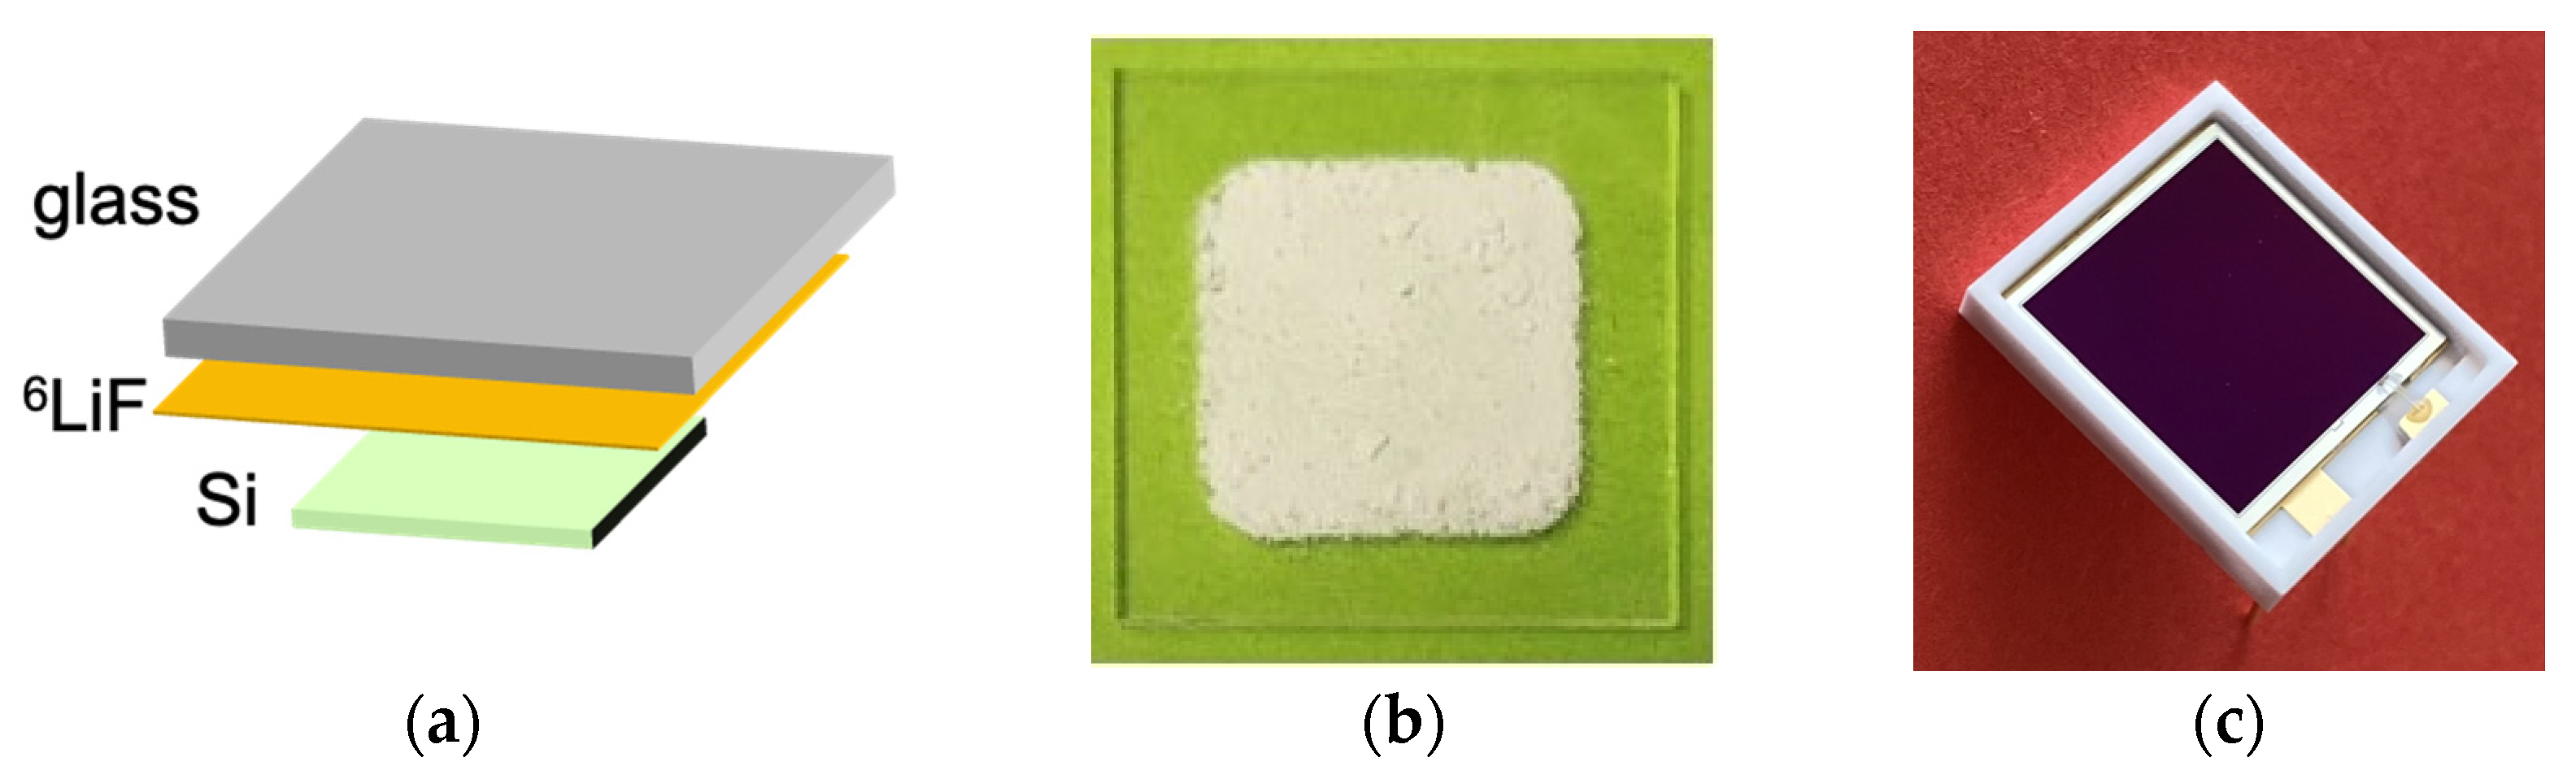
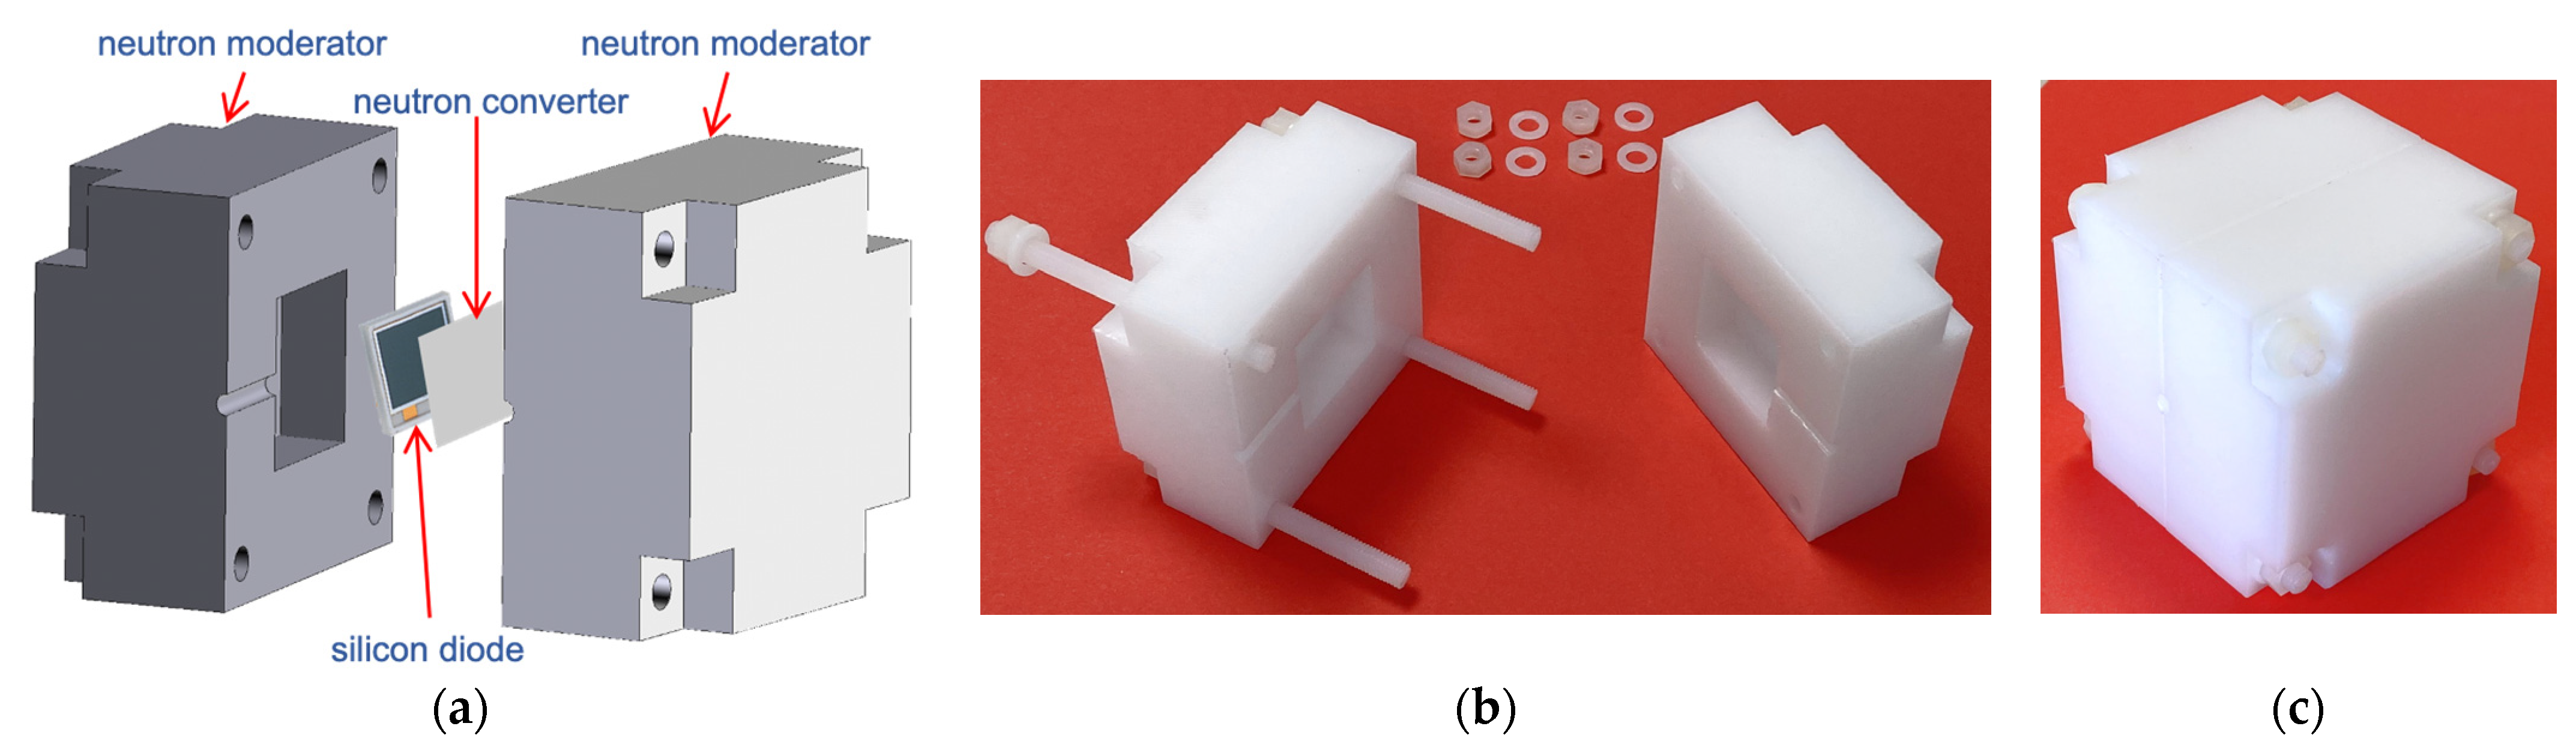
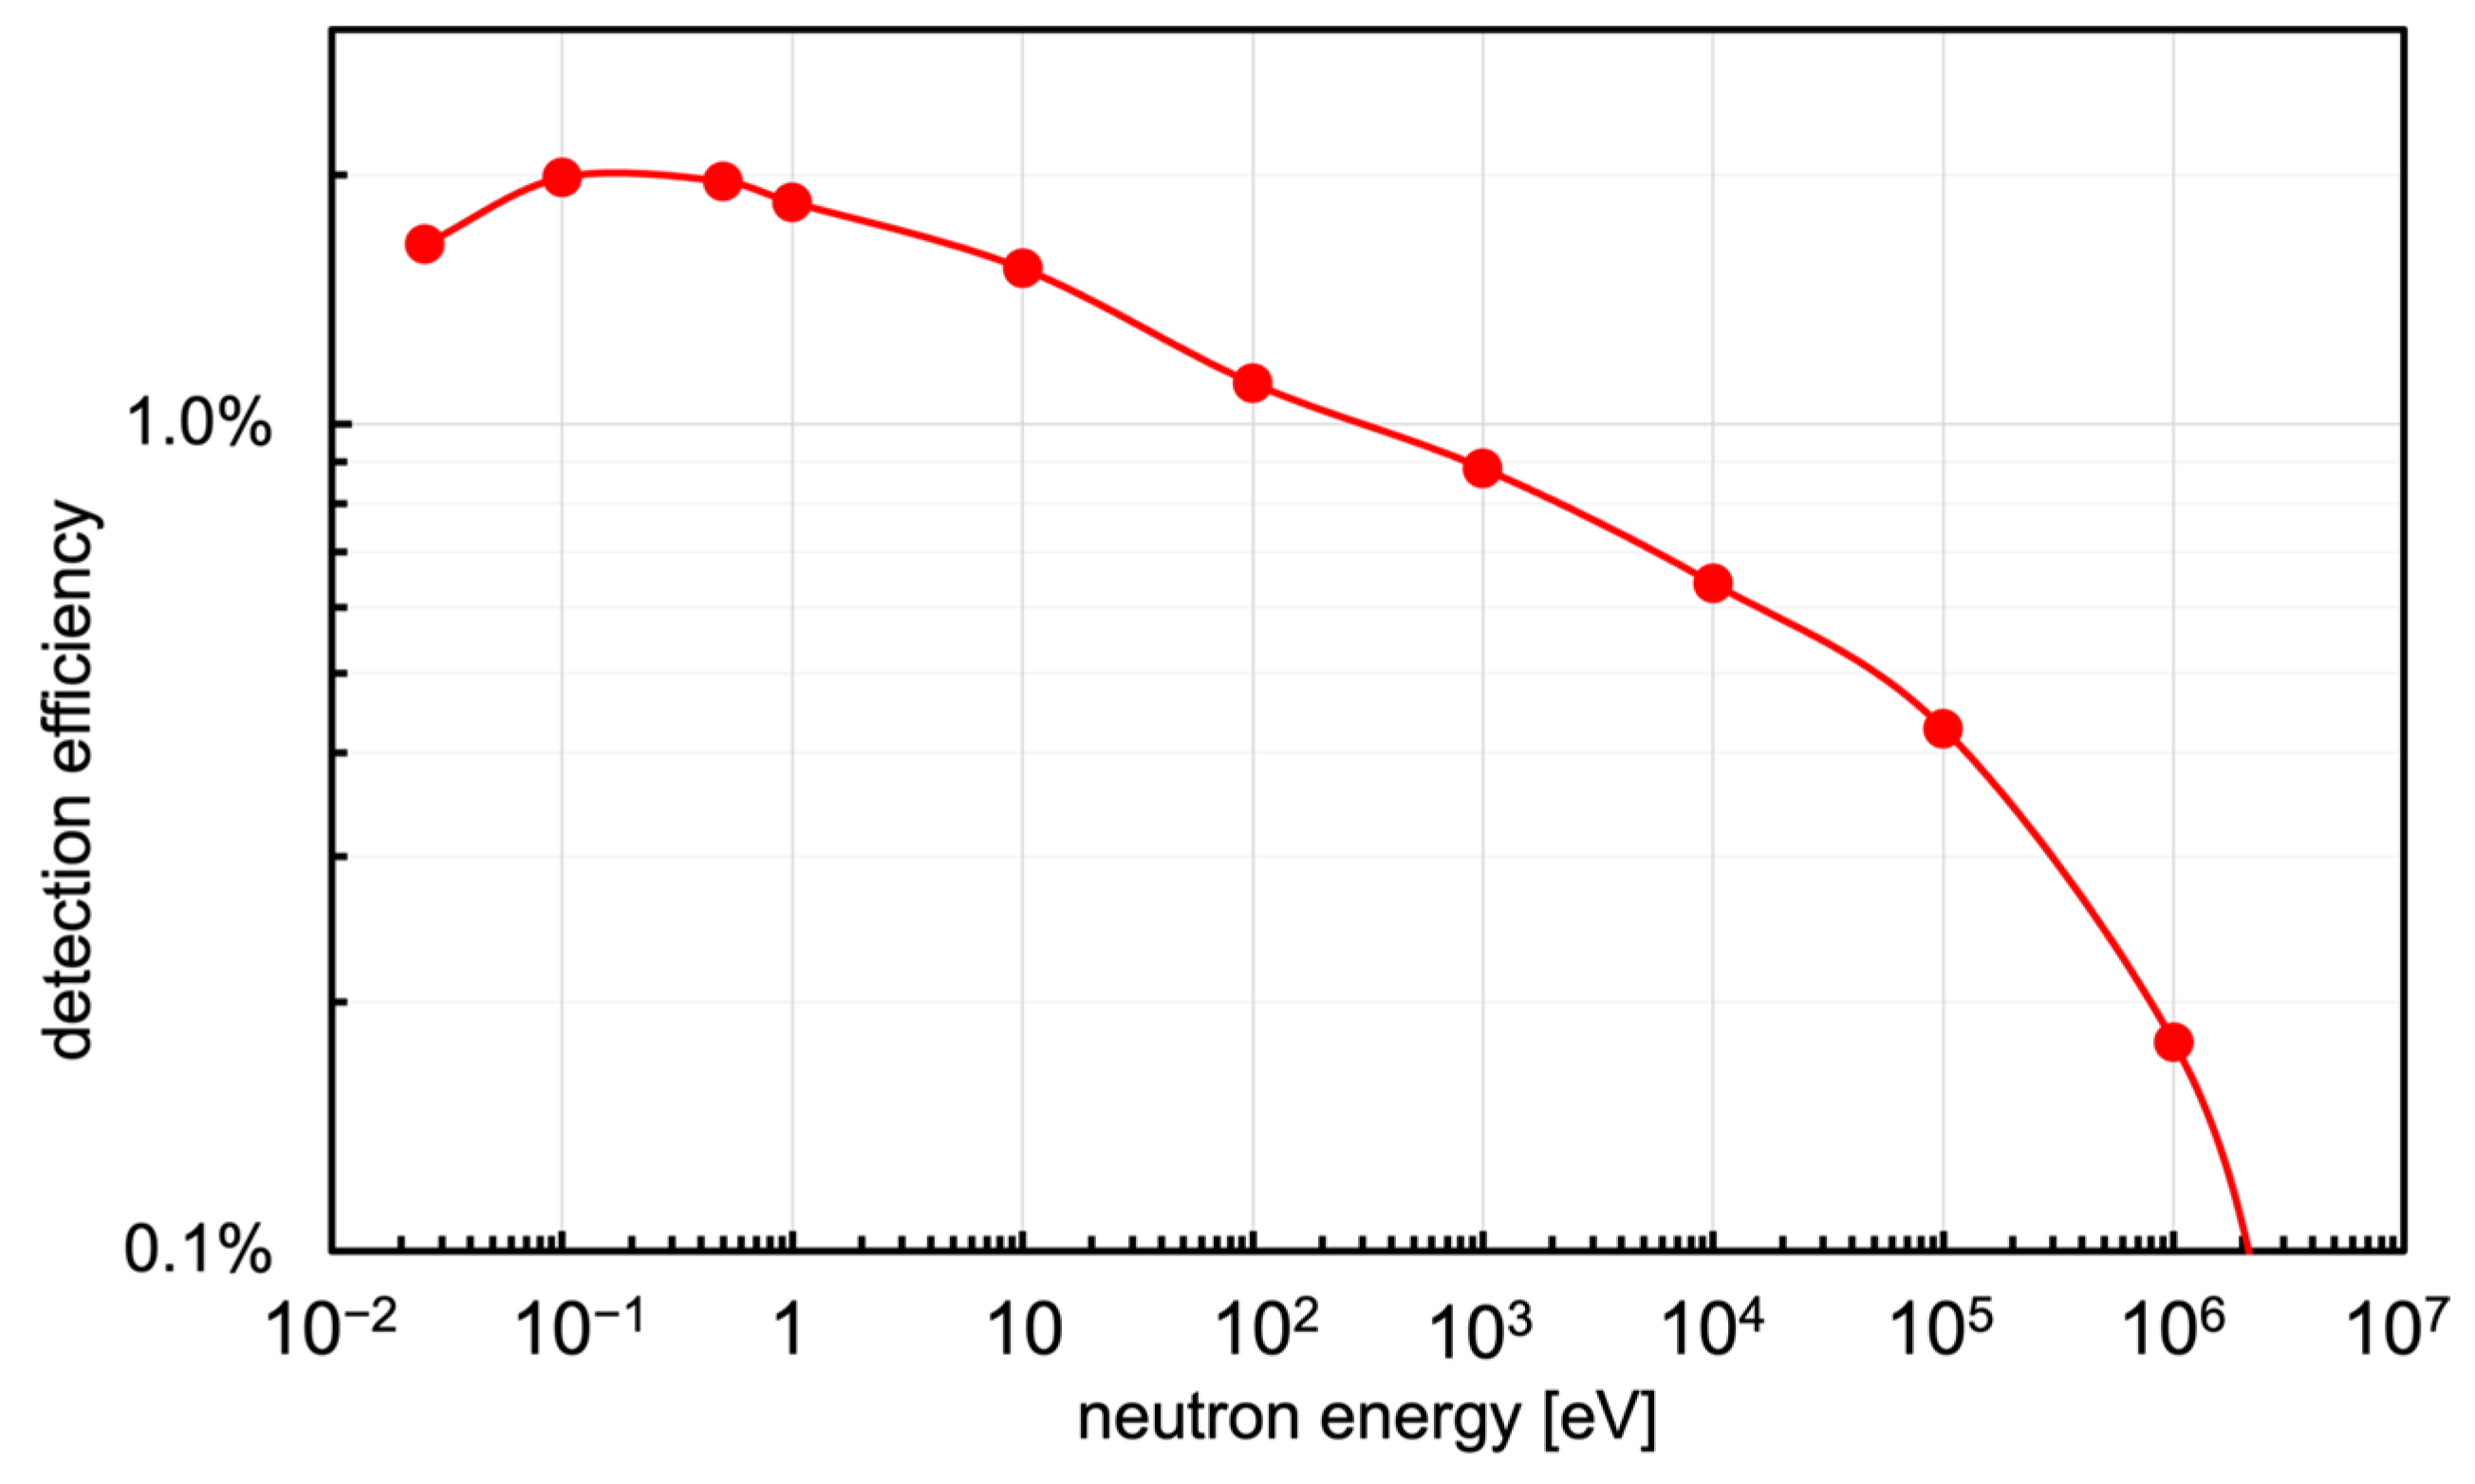
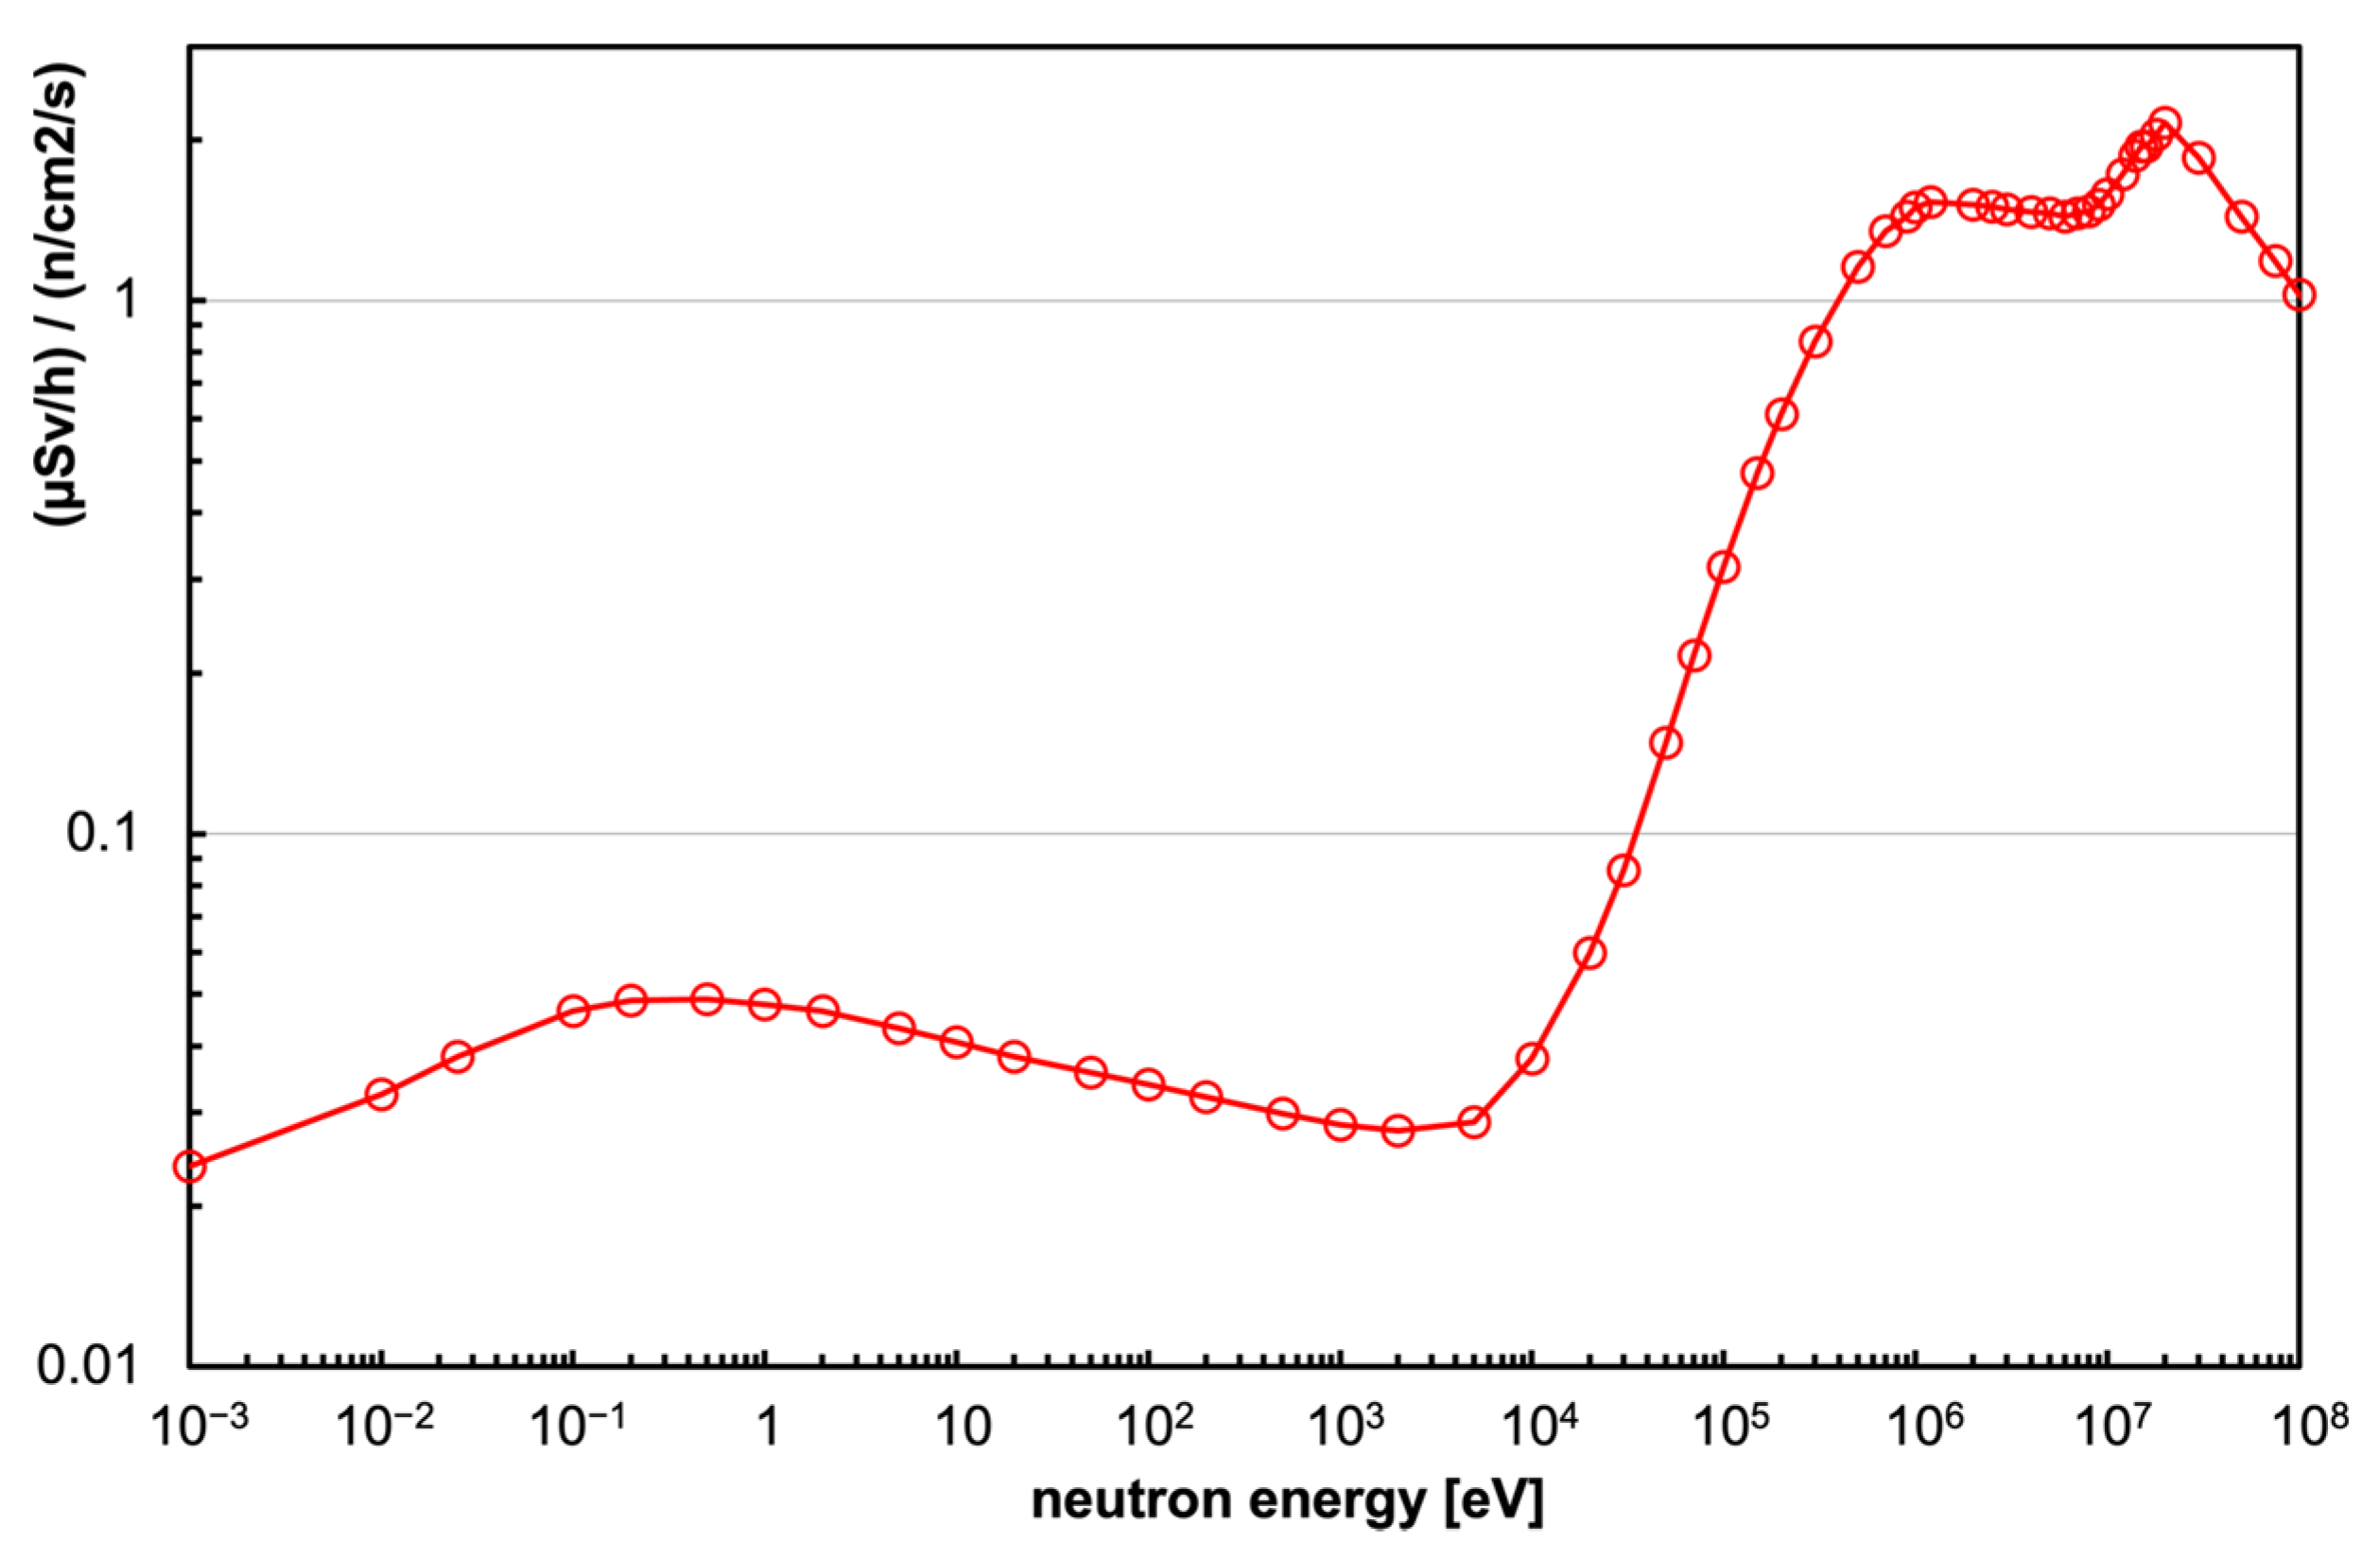
2.2. Neutron Detection
3. Electronics and Data Acquisition
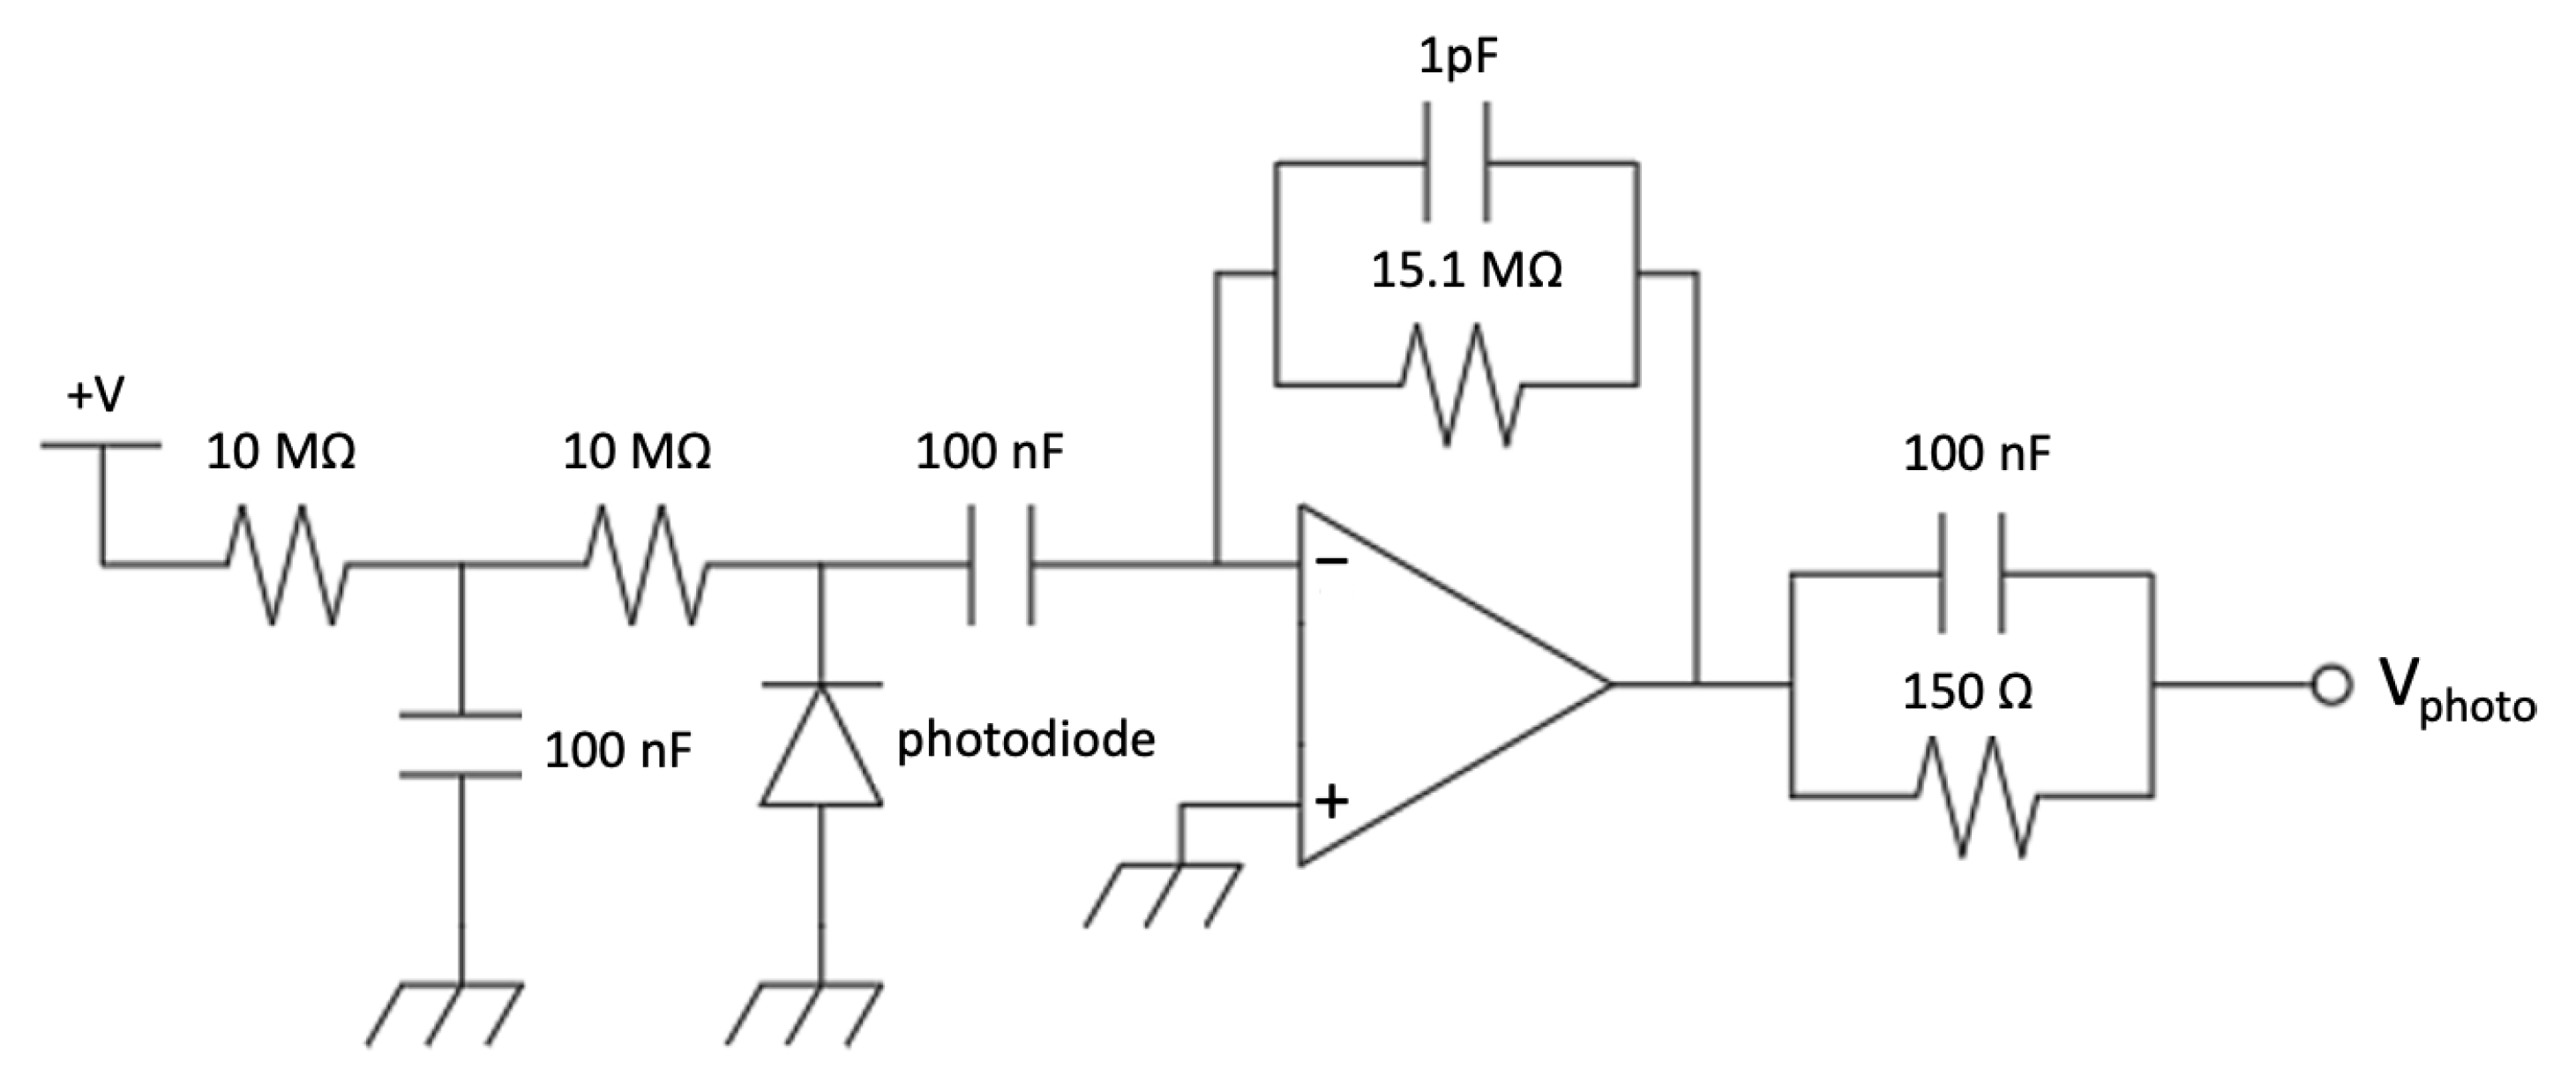
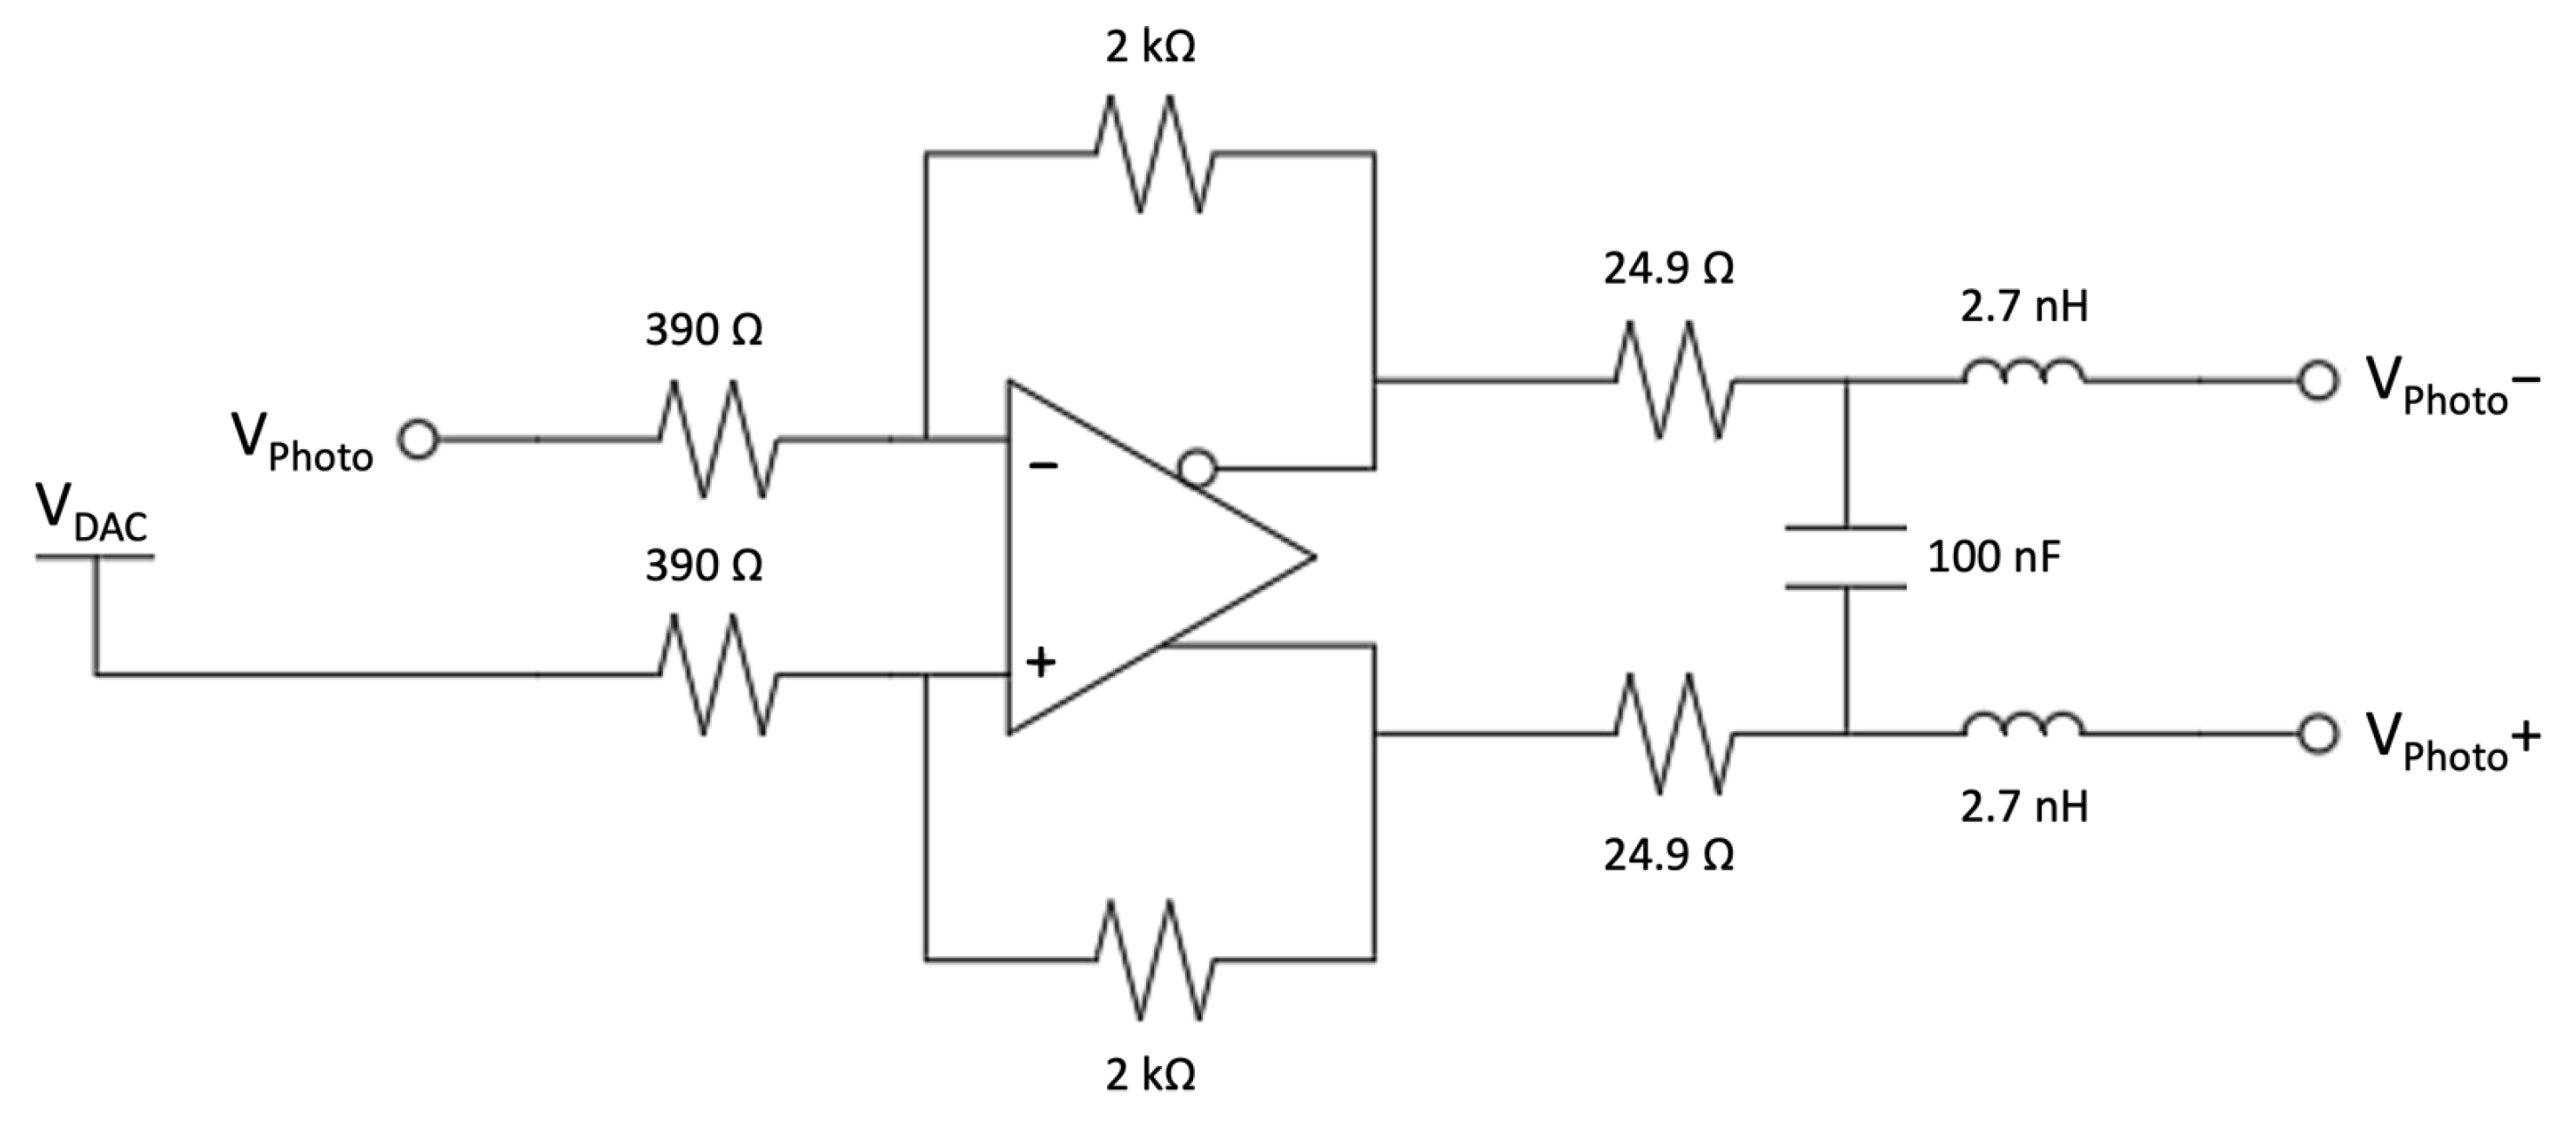
3.1. Analog Front-End
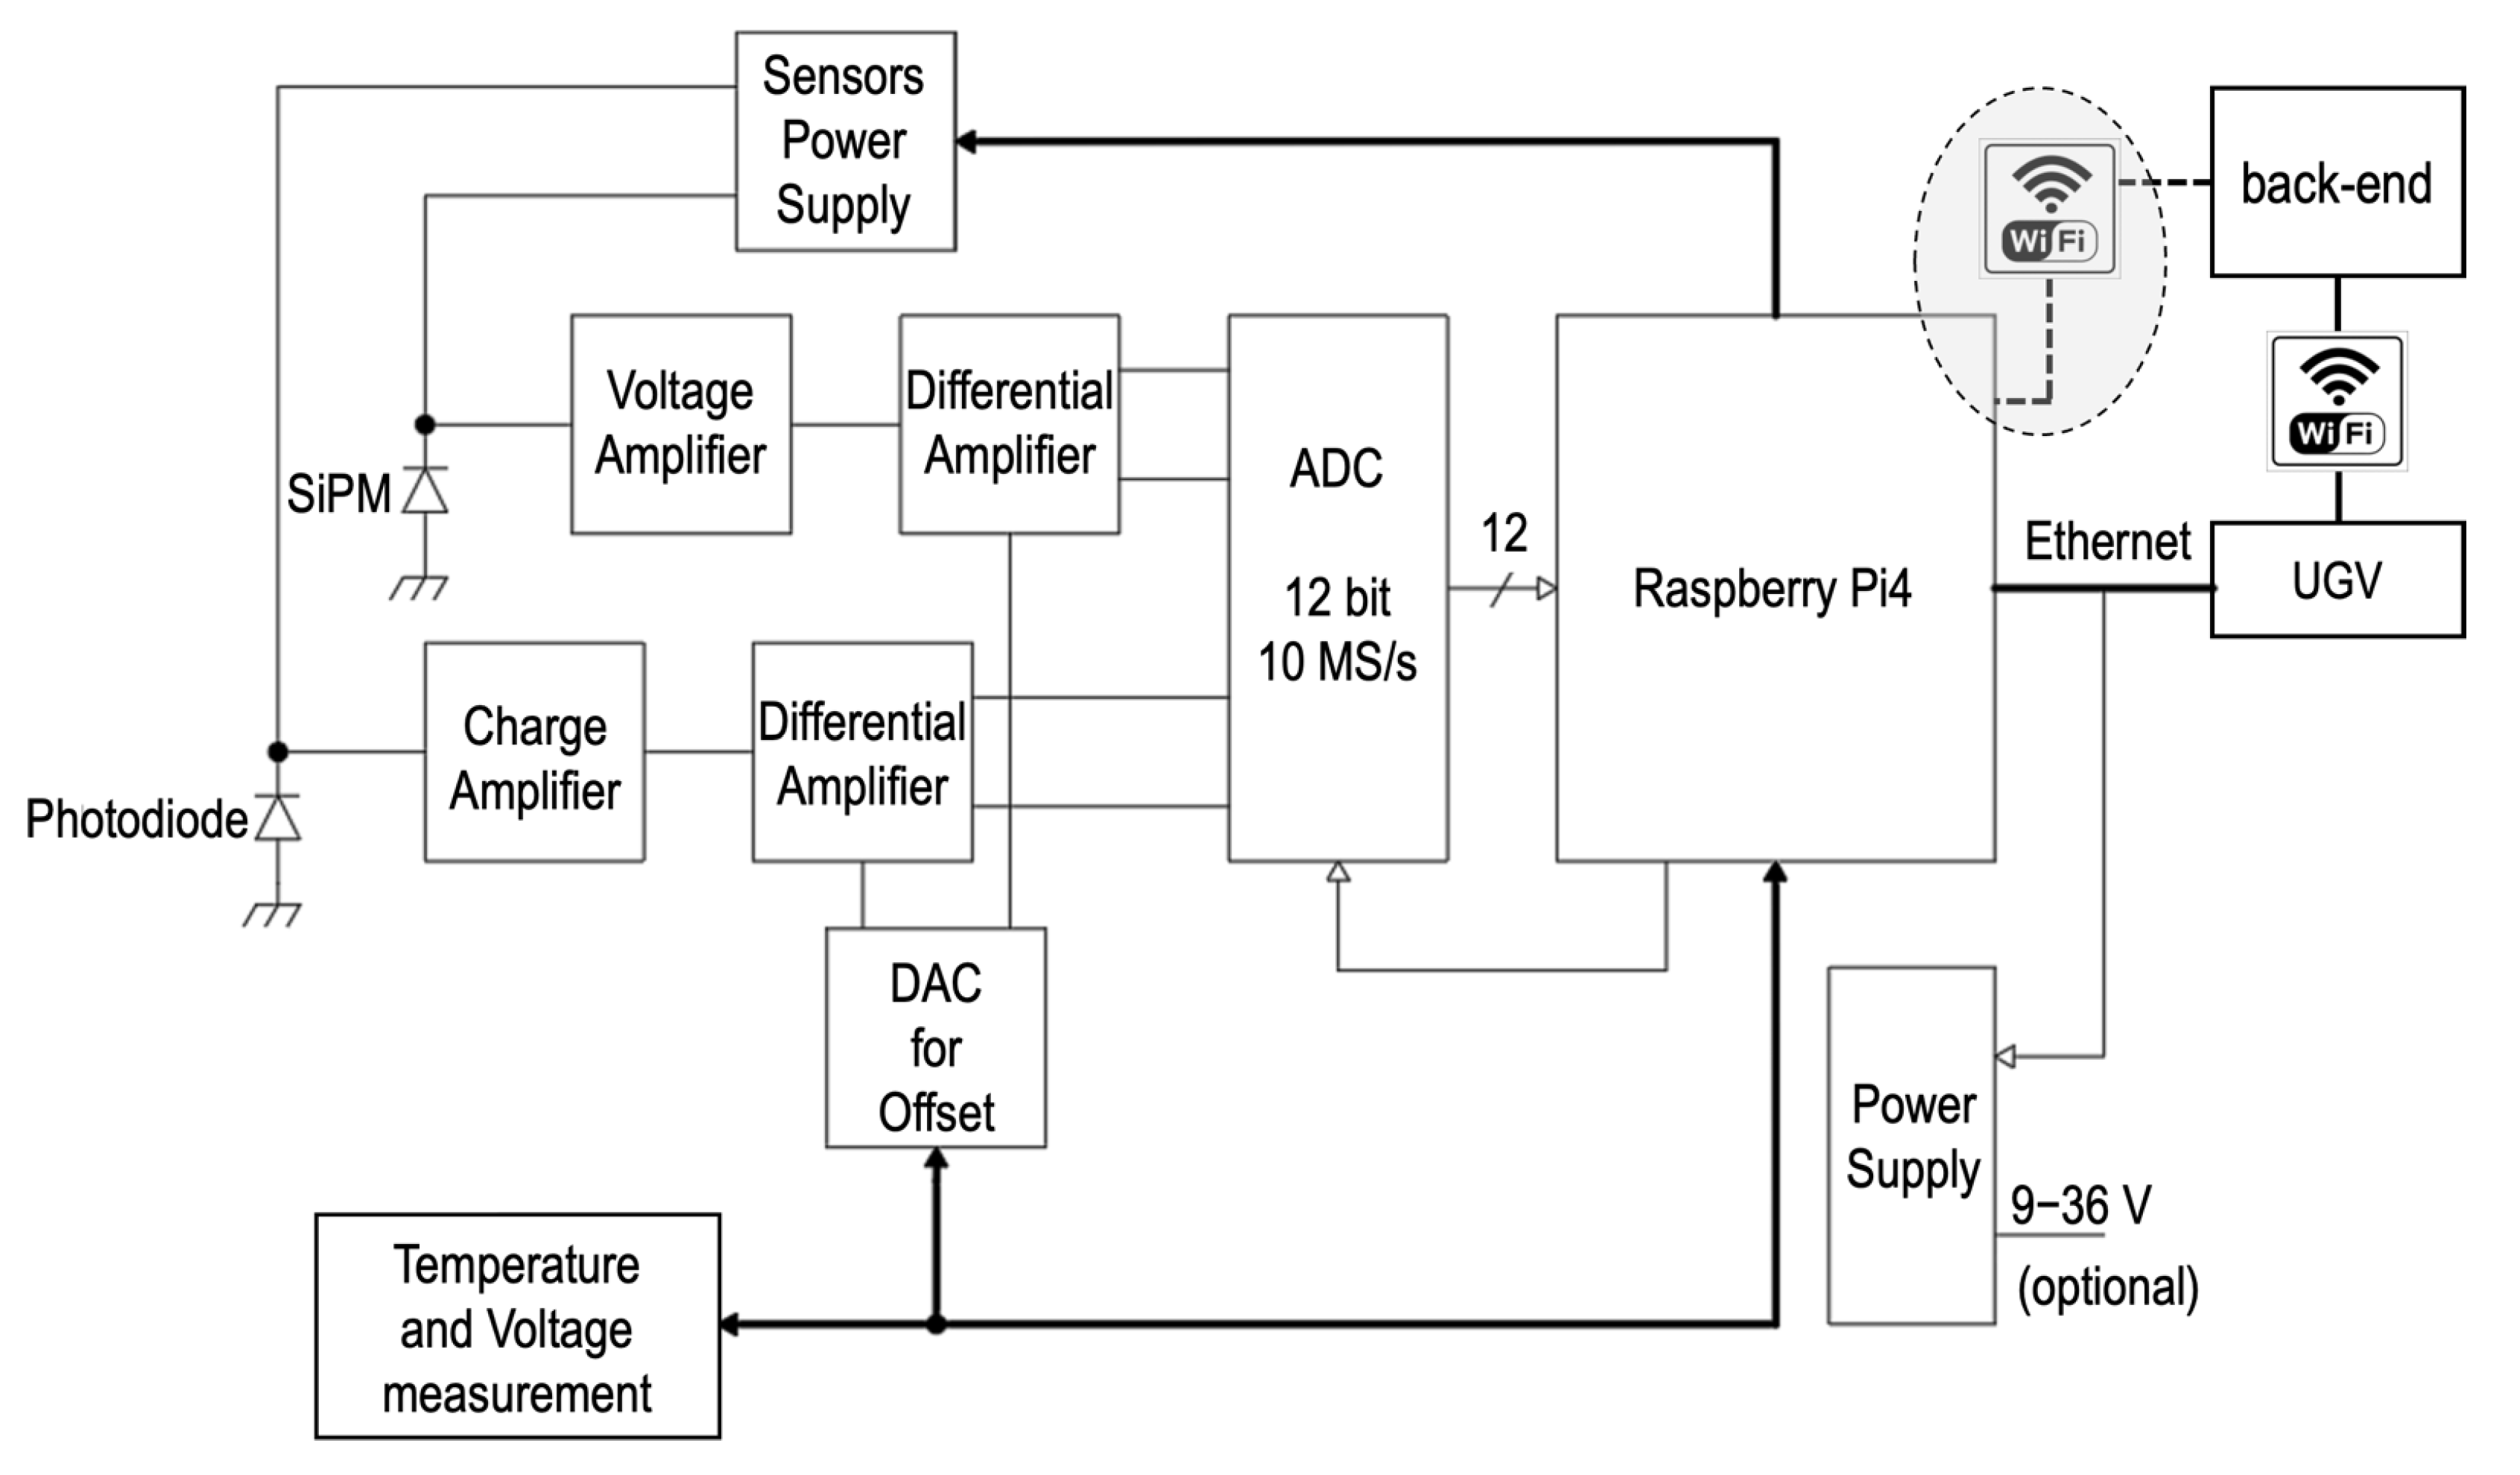
3.2. Data Acquisition
4. Results
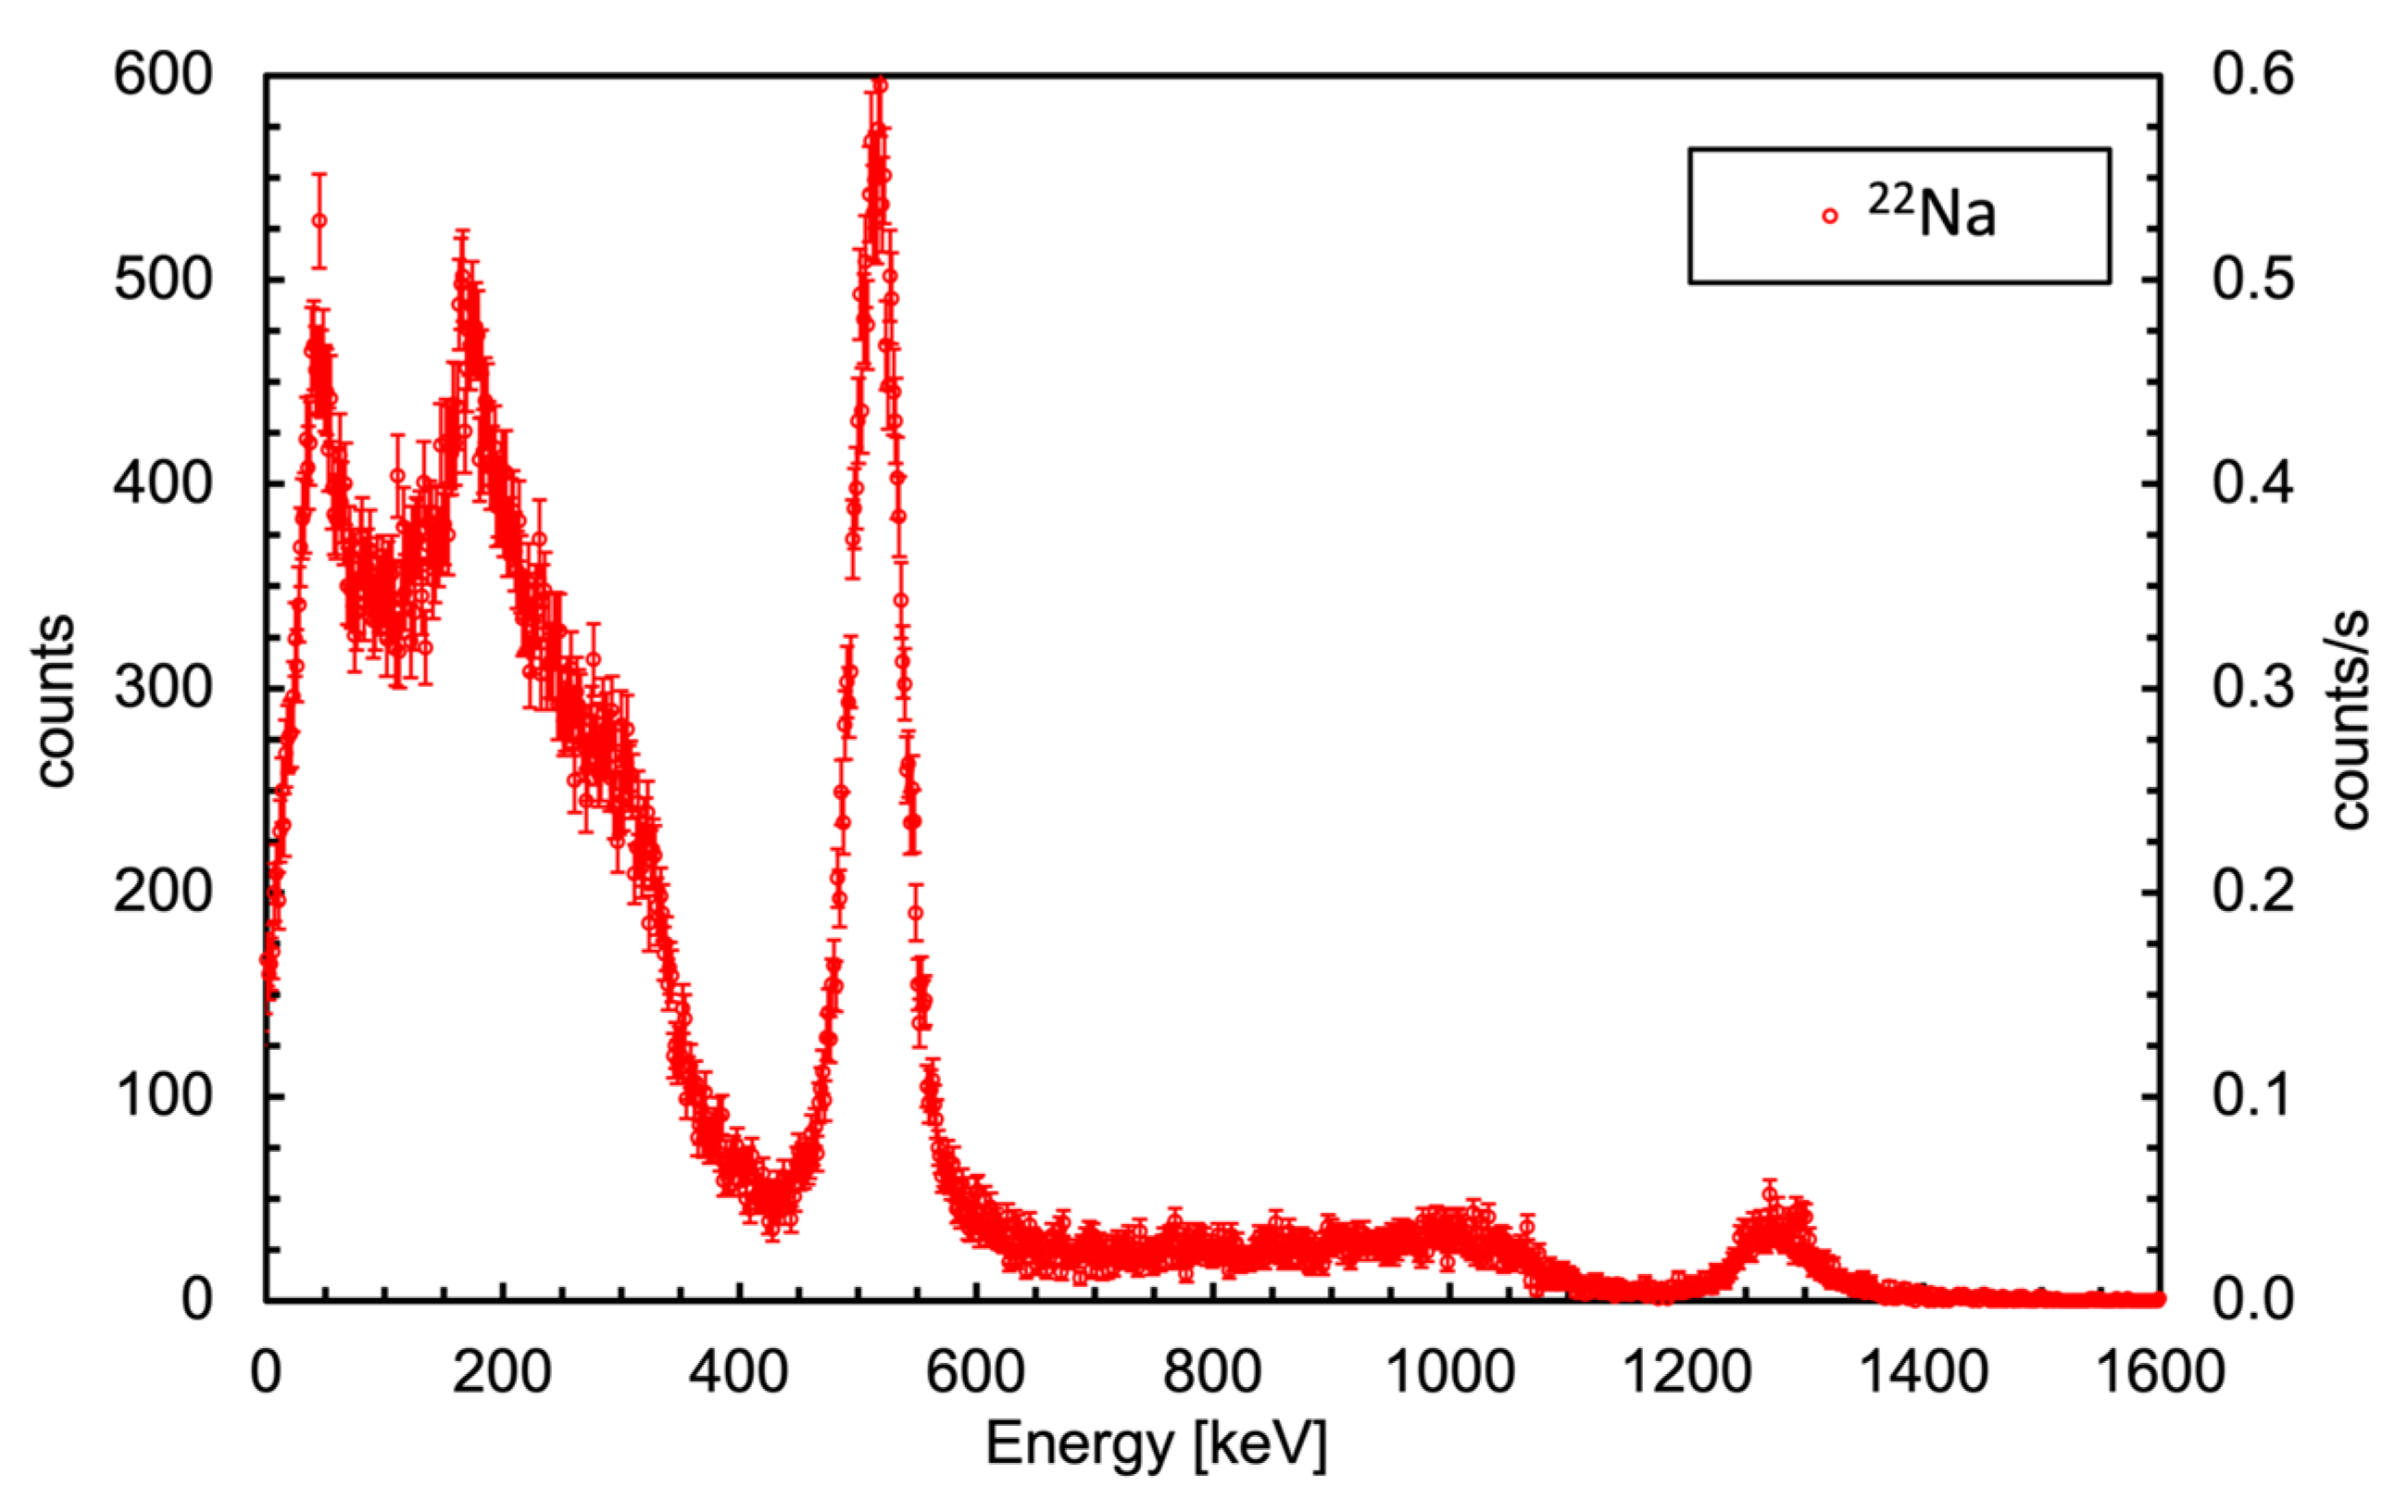
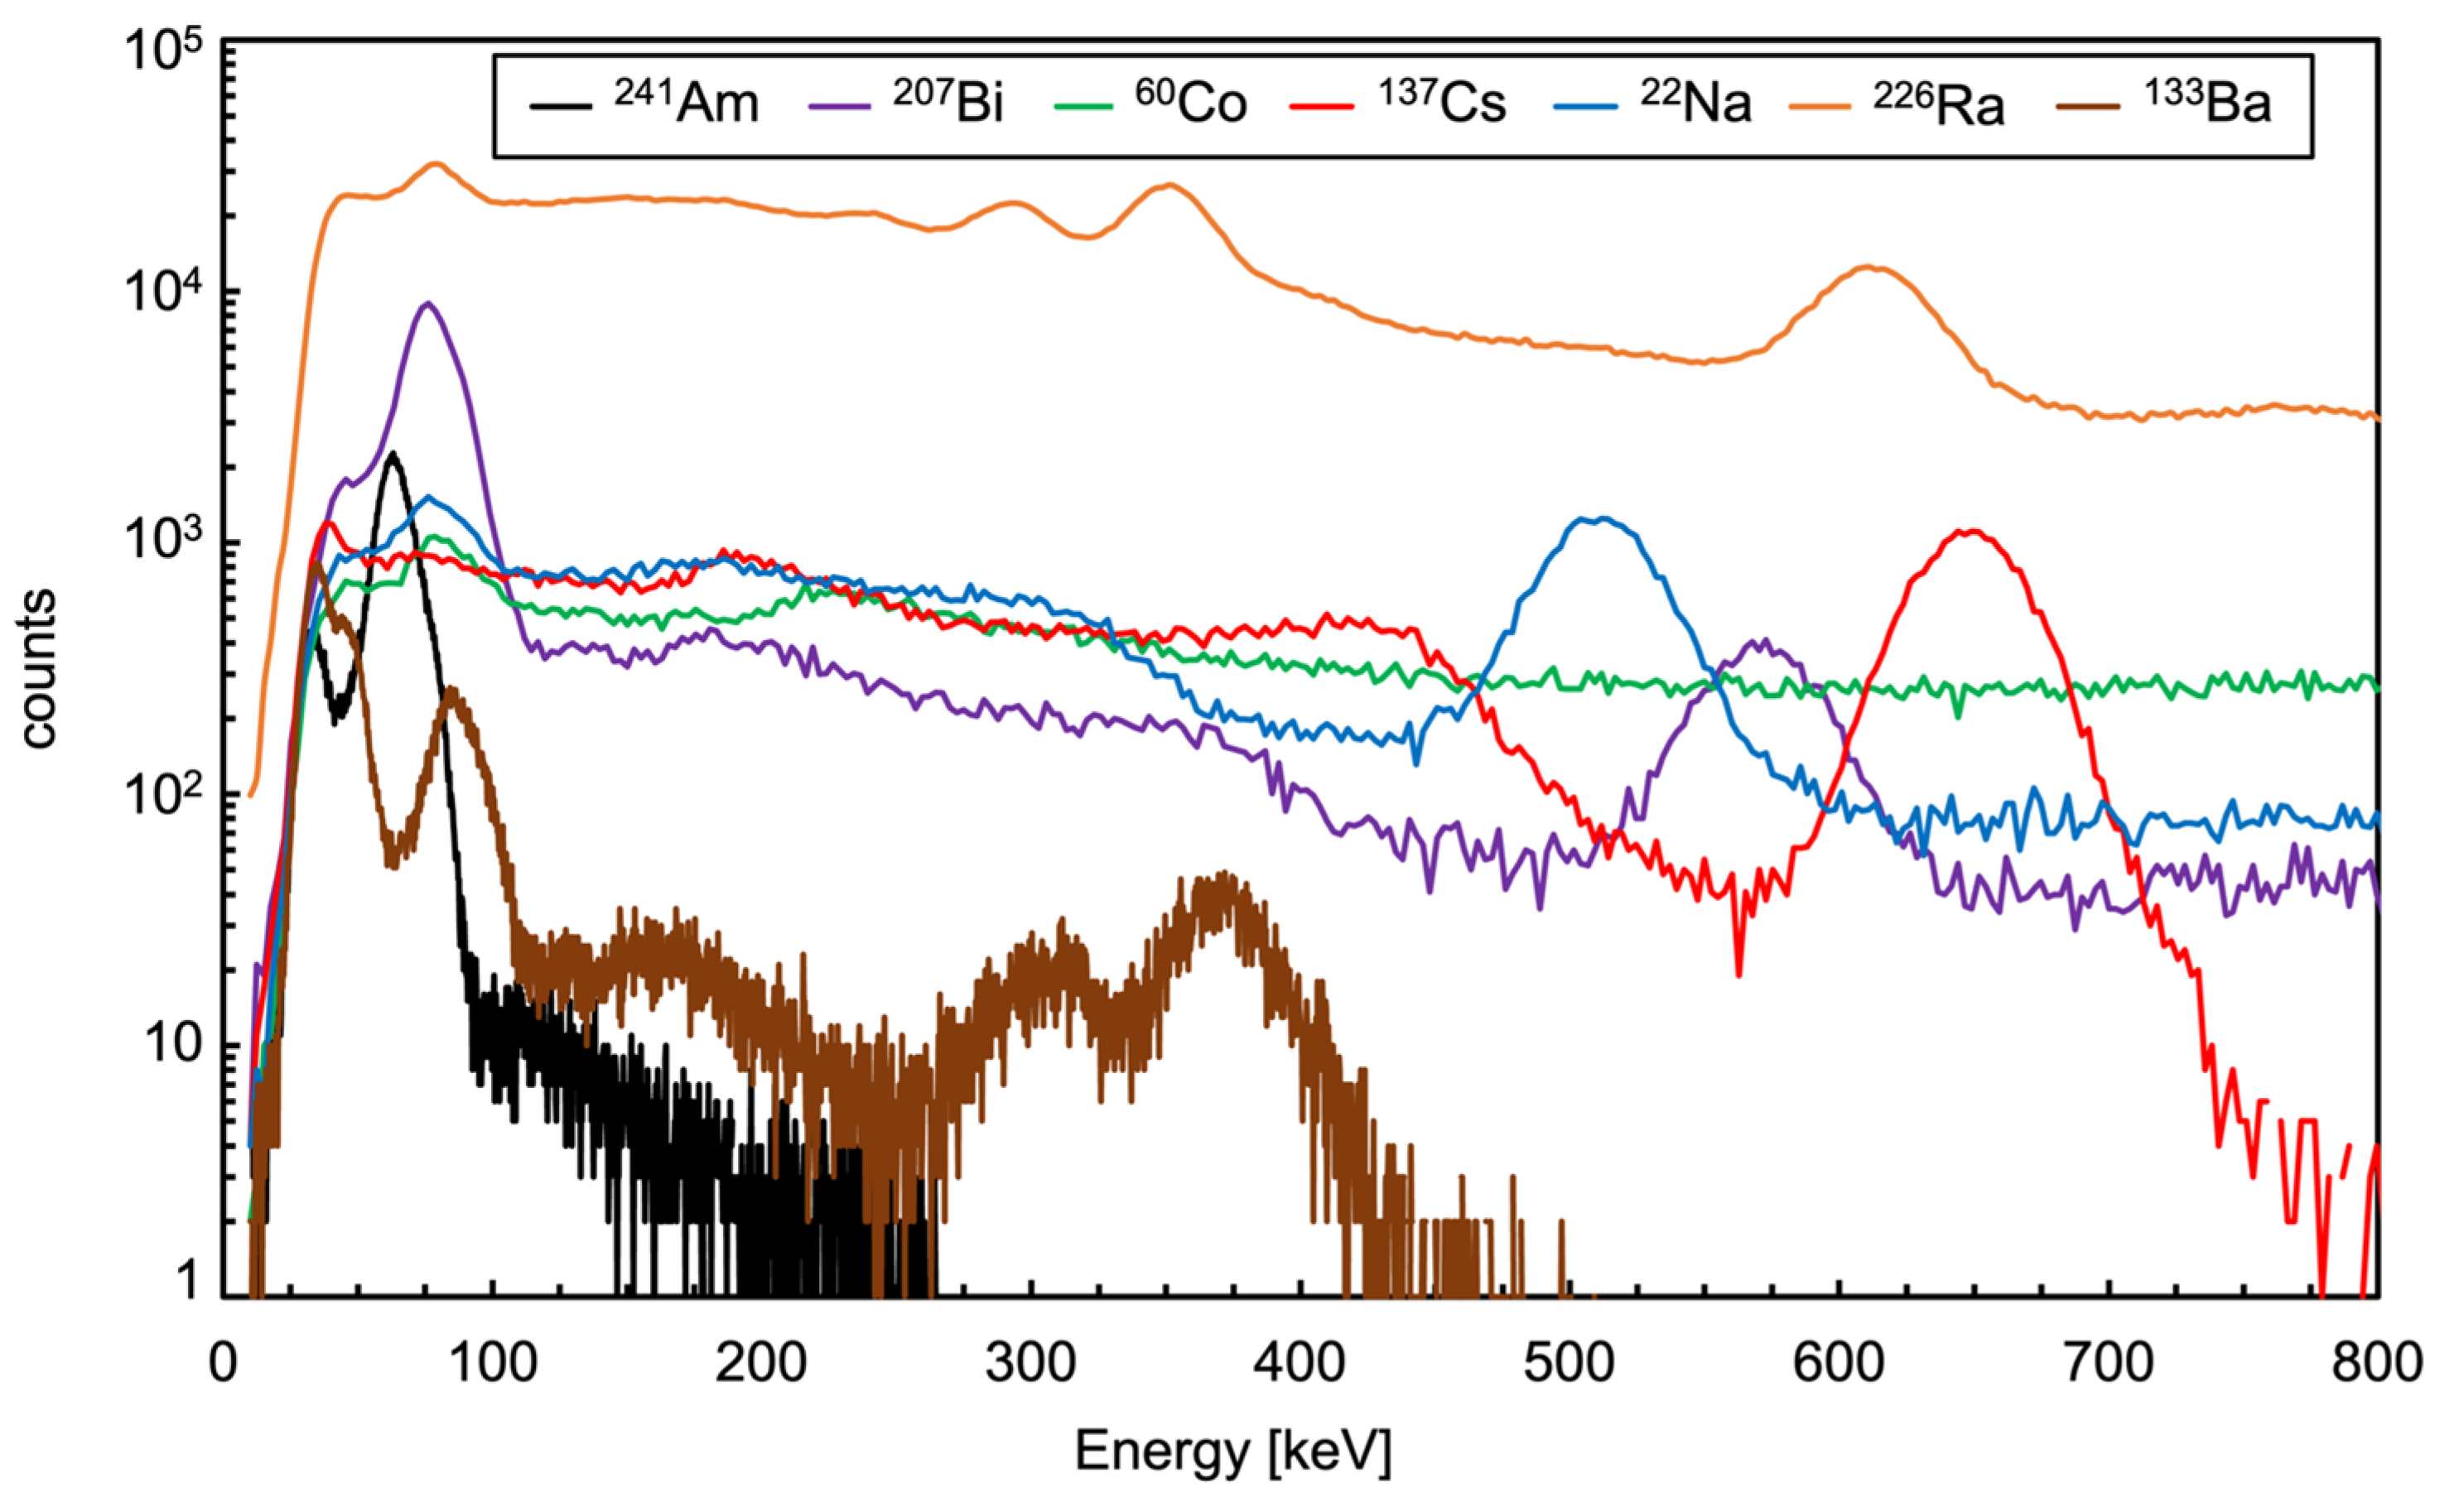
4.1. Test of Gamma Ray Detection
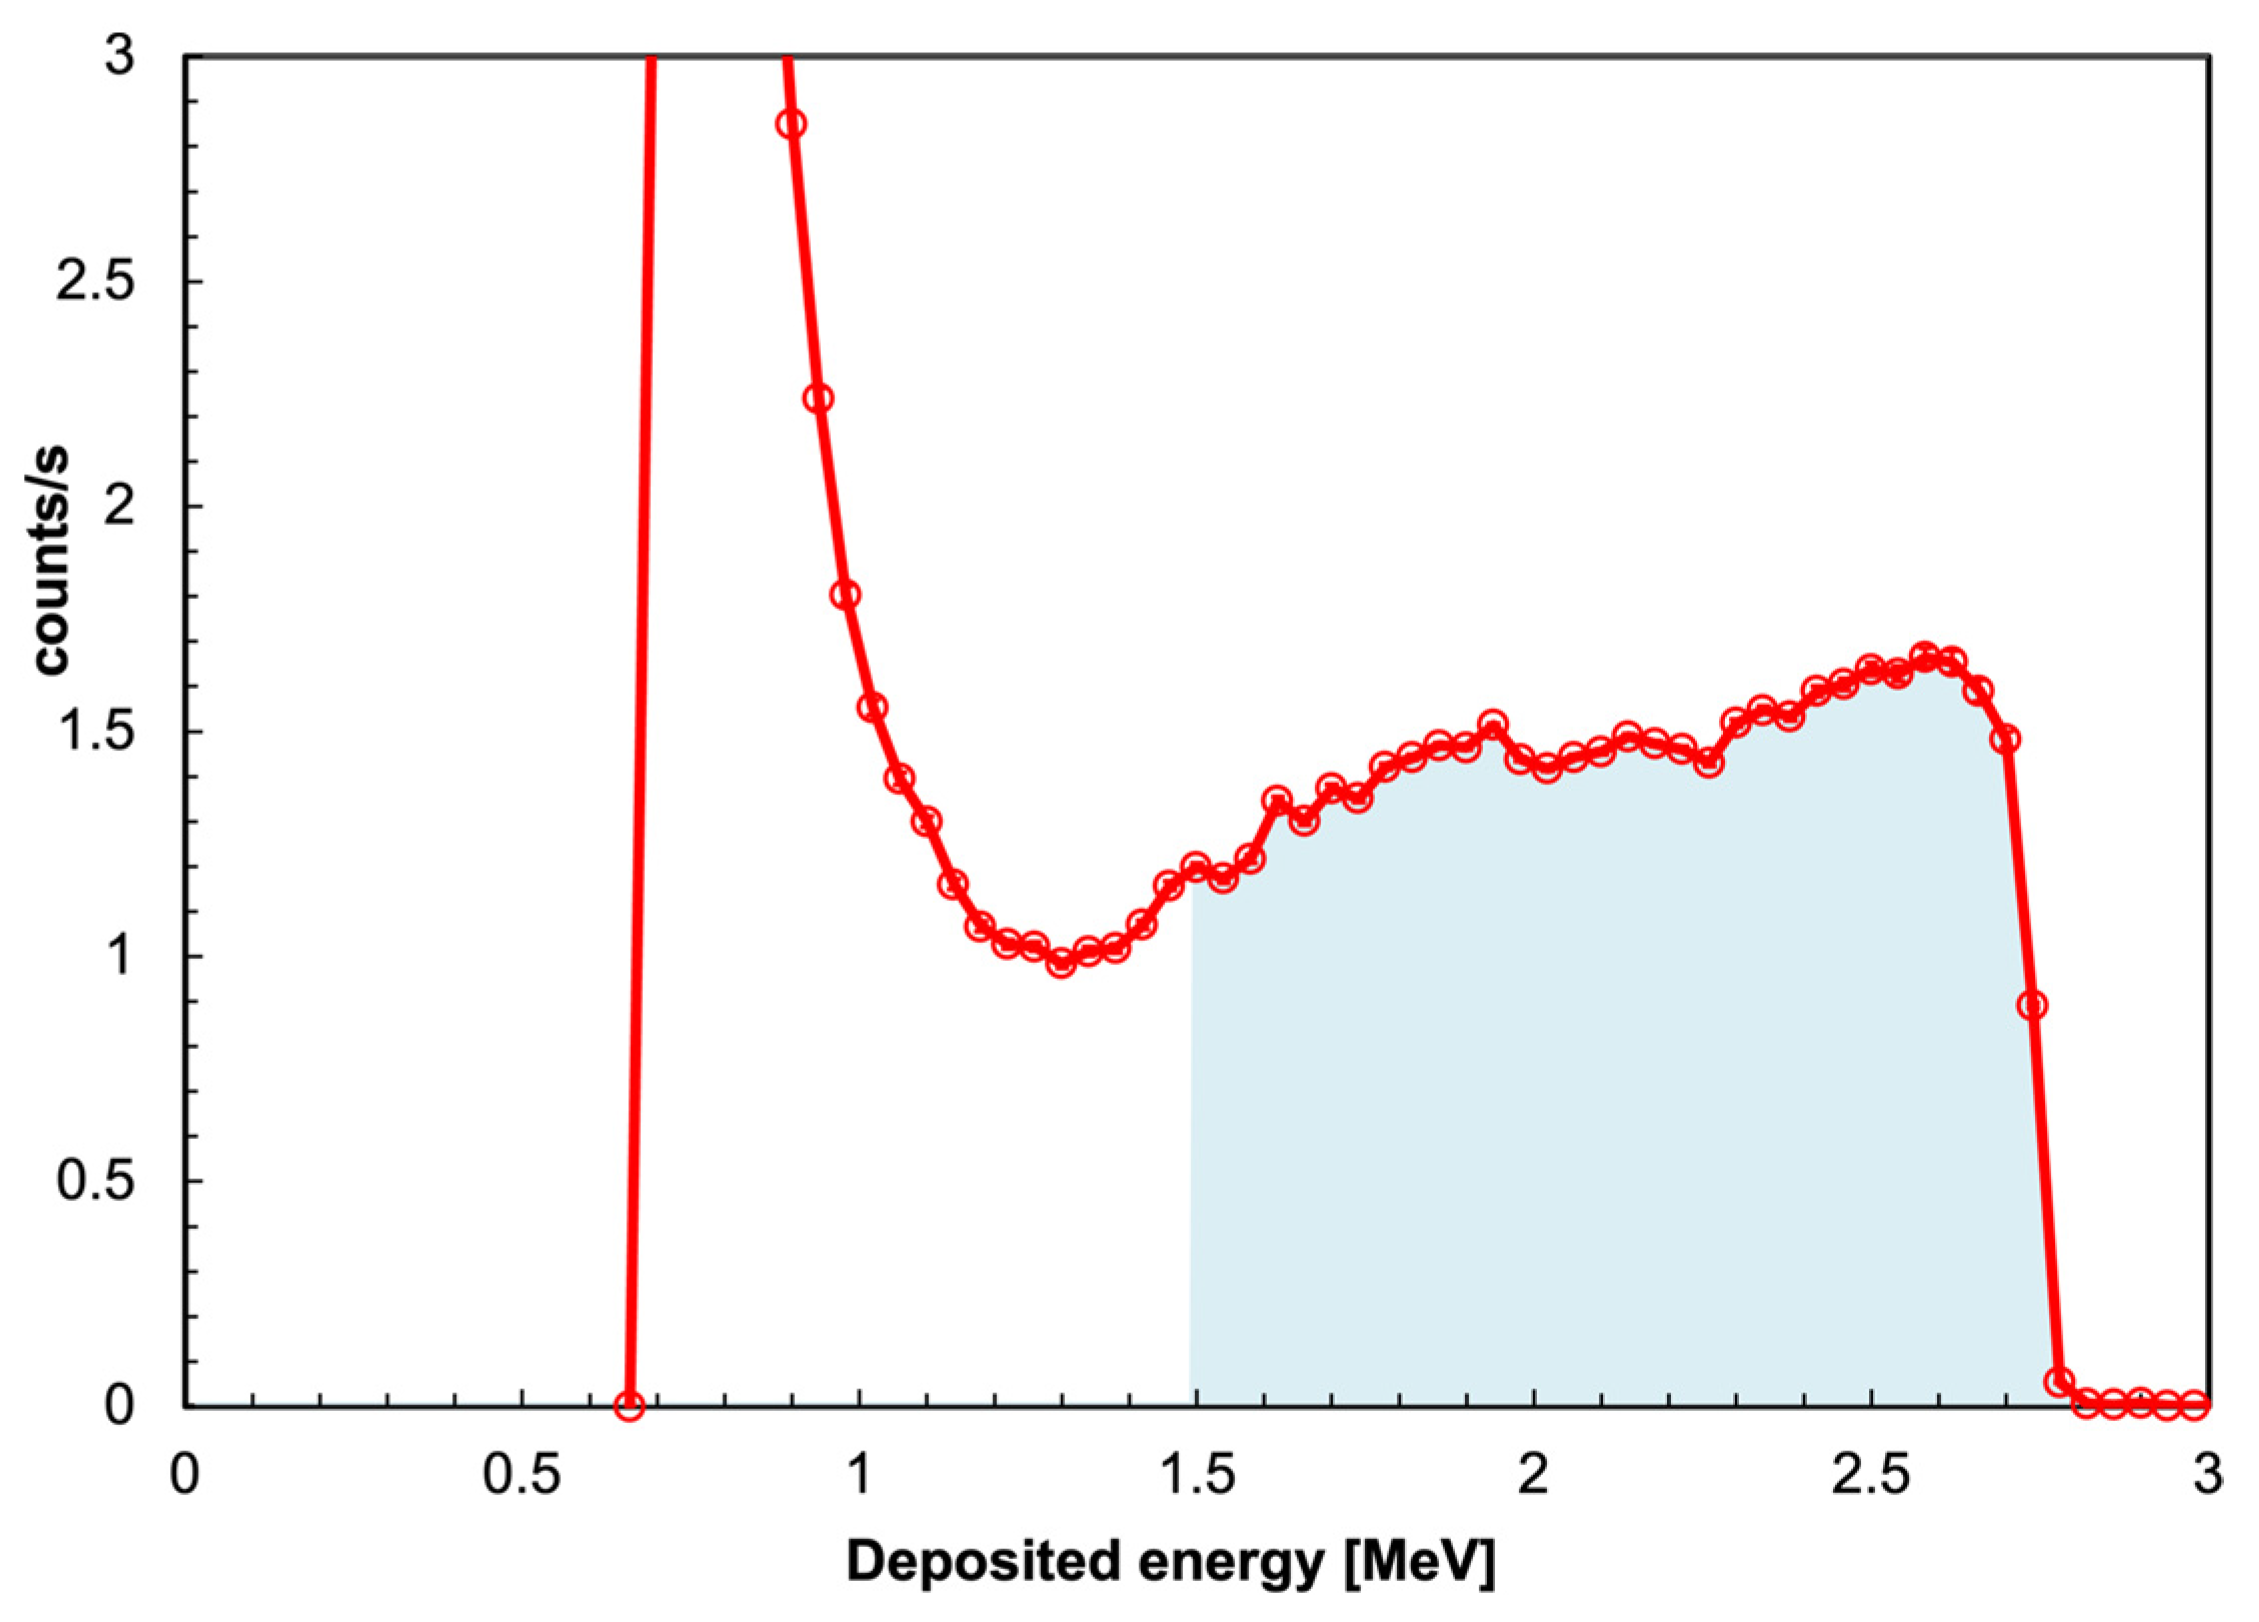
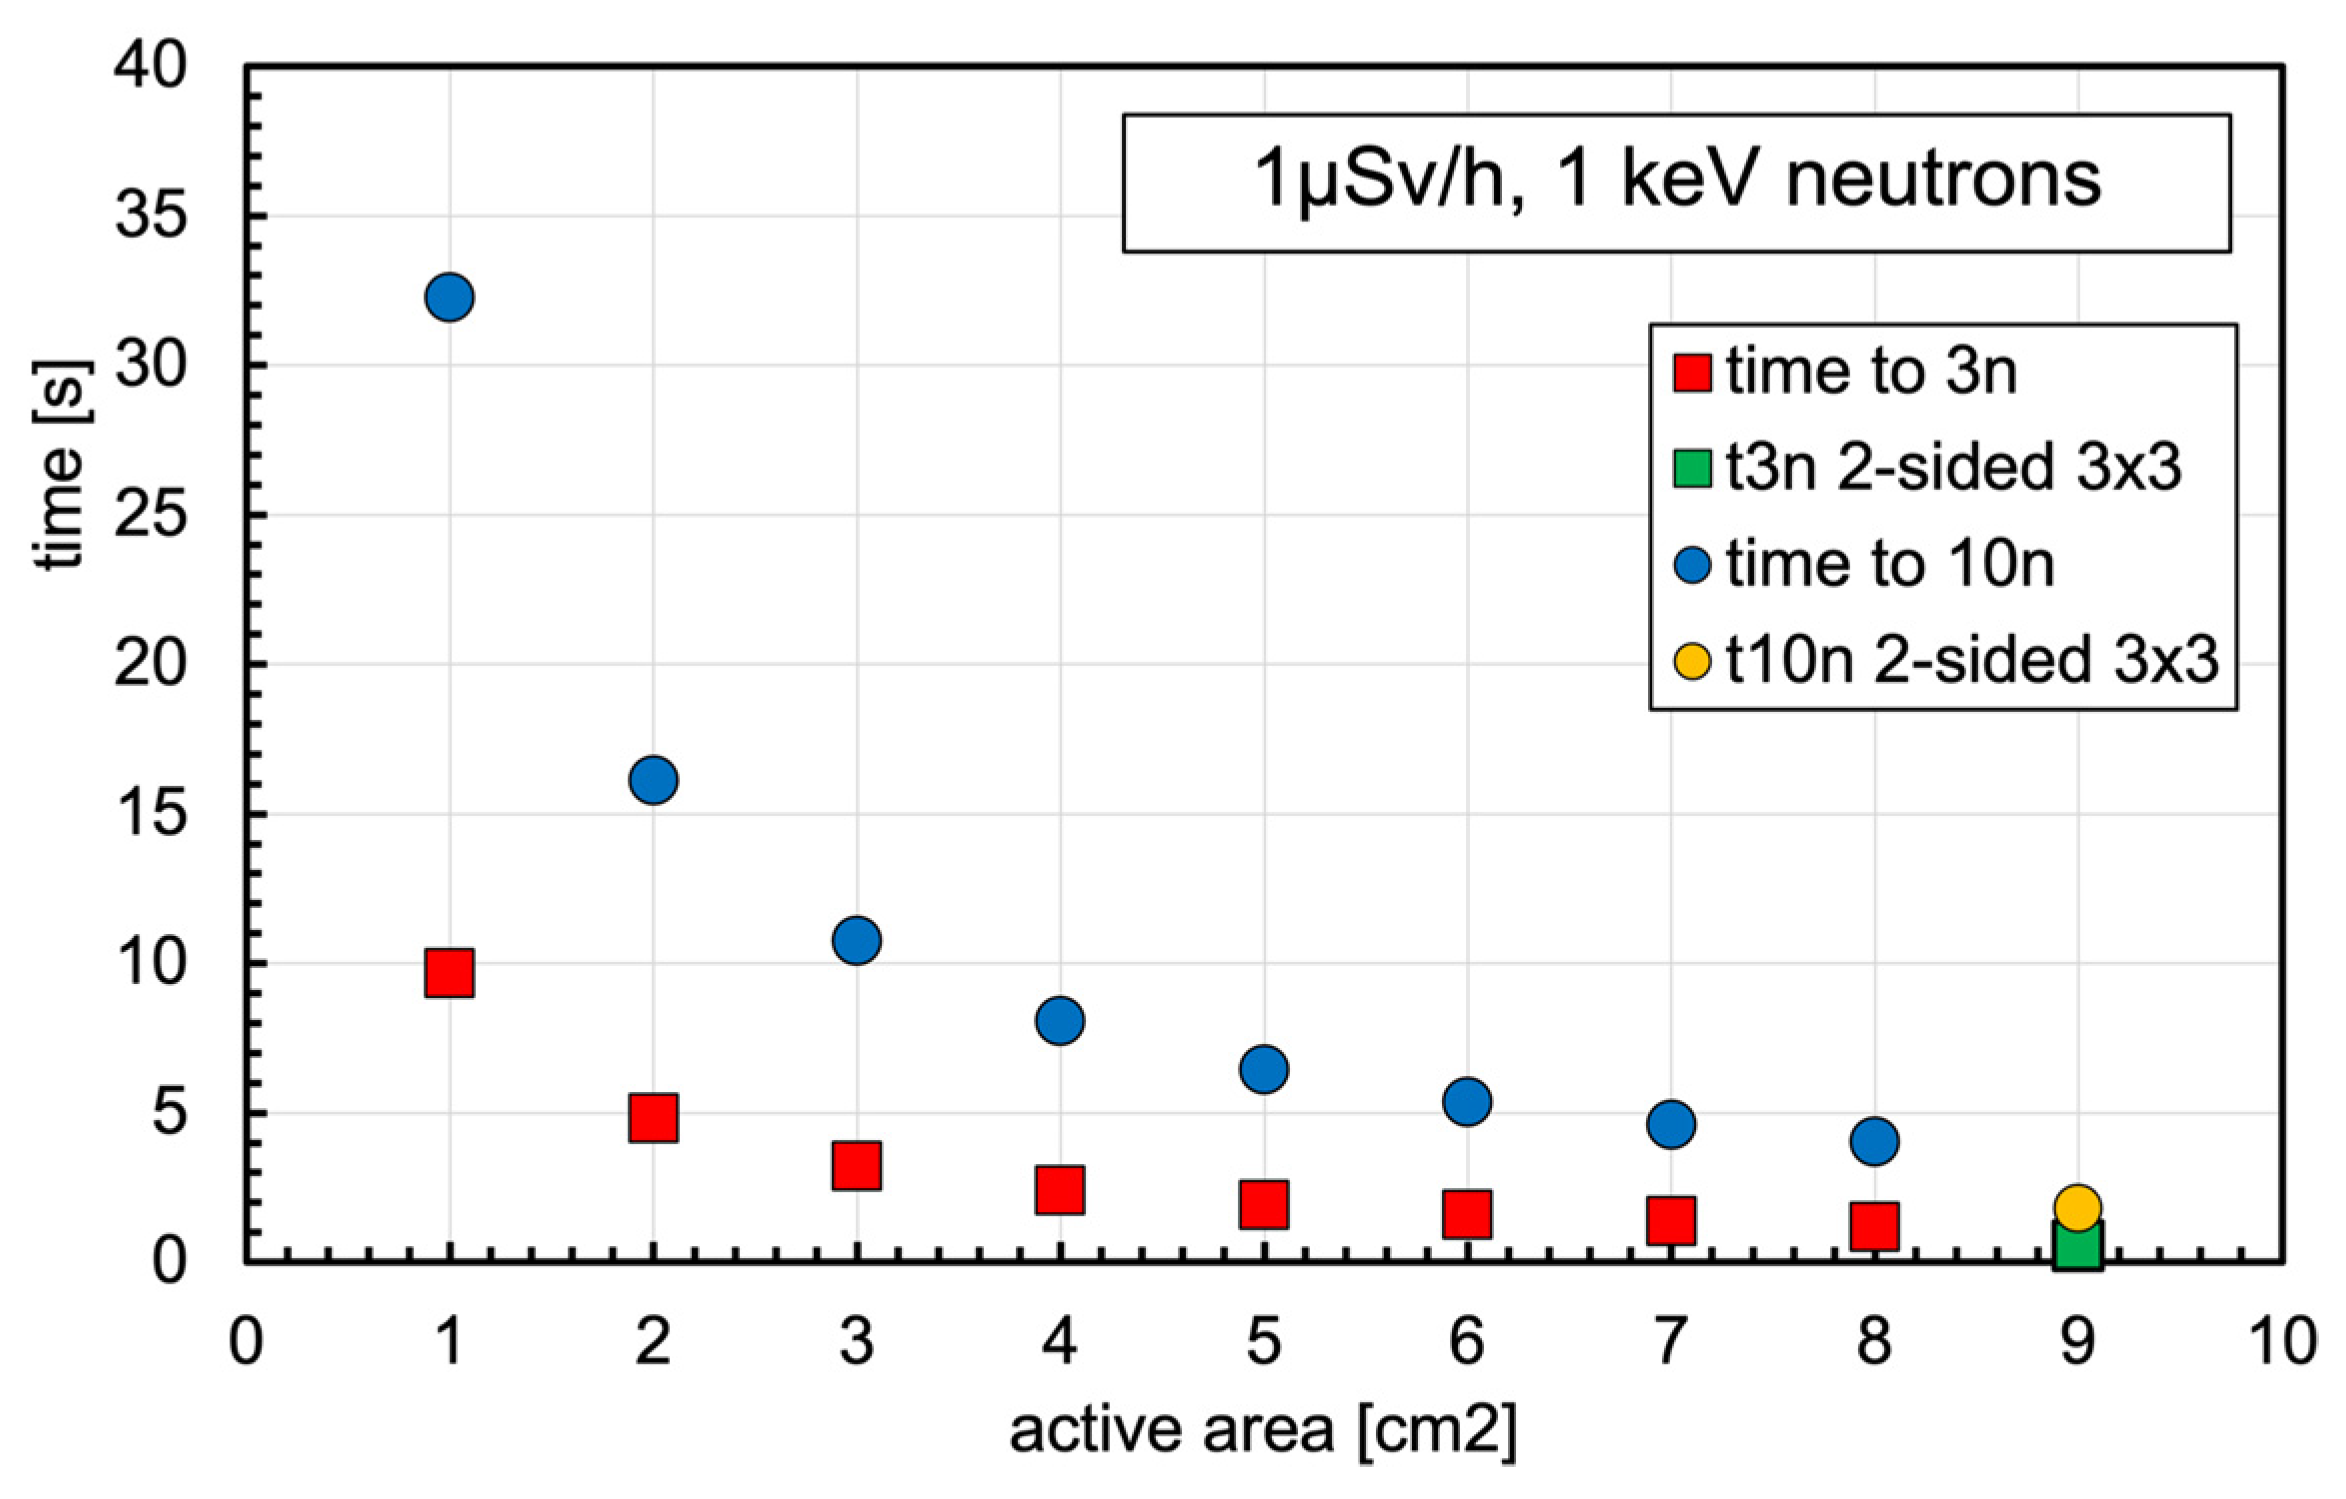
4.2. Test of Neutron Detection
5. Conclusions
Author Contributions
Funding
Data Availability Statement
Acknowledgments
Conflicts of Interest
References
- CLEANDEM EU Project Horizon 2020, GA 945335. Available online: https://cordis.europa.eu/project/id/945335/ (accessed on 10 March 2023).
- Vanhavere, F.; Marlein, B.; Nascimento, L.F.; Lövestam, G. Testing three types of active personal neutron dosemeters for application in a nuclear research centre. Radiat. Meas. 2010, 45, 1593–1596. [Google Scholar] [CrossRef]
- Fourches, N.; Zielińska, M.; Charles, G. High Purity Germanium: From Gamma-Ray Detection to Dark Matter Subterranean Detectors. In Use of Gamma Radiation Techniques in Peaceful Applications; IntechOpen: London, UK, 2019; pp. 1–17. [Google Scholar] [CrossRef]
- Lacoste, V.; Reginatto, M.; Asselineau, B.; Muller, H. Bonner sphere neutron spectrometry at nuclear workplaces in the framework of the EVIDOS project. Radiat. Prot. Dosim. 2007, 125, 304–308. [Google Scholar] [CrossRef]
- McGregor, D.S. Materials for Gamma-Ray Spectrometers: Inorganic Scintillators. Annu. Rev. Mater. Res. 2018, 48, 245. [Google Scholar]
- Derenzo, S.E.; Weber, M.J.; Bourret-Courchesne, E.; Klintenberg, M.K. The quest for the ideal inorganic scintillator. Nucl. Instrum. Methods Phys. Res. Sect. A 2003, 505, 111–117. [Google Scholar] [CrossRef]
- MicroFC-60035-SMT. Available online: https://www.onsemi.com/pdf/datasheet/microc-series-d.pdf (accessed on 14 March 2023).
- Hyunju, Y.; Segyeong, J.; Shiyoung, Y.; Gyuseong, C. Optimal design of a CsI(Tl) crystal in a SiPM based compact radiation sensor. Radiat. Meas. 2015, 82, 102–107. [Google Scholar]
- Sabet, H.; Prekas, G.; Breen, M.; Bhandari, H.B.; Nickerson, P.; Derderian, G.; Robertson, F.; Kudrolli, H.; Cool, S.; Nagarkar, V.V. High-Performance and Cost-Effective Detector Using Microcolumnar CsI:Tl and SiPM. IEEE Trans. Nucl. Sci. 2012, 59, 1841–1849. [Google Scholar] [CrossRef]
- Swiderski, L.; Moszyński, M.; Czarnacki, W.; Brylew, K.; Grodzicka-Kobylka, M.; Mianowska, Z.; Sworobowicz, T.; Syntfeld-Każuch, A.; Szczesniak, T.; Klamra, W.; et al. Scintillation response to gamma-rays measured at wide temperature range for Tl doped CsI with SiPM readout. Nucl. Instrum. Methods Phys. Res. Sect. A 2019, 916, 32–36. [Google Scholar] [CrossRef]
- Grodzicka, M.; Moszynski, M.; Szczesniak, T.; Kapusta, M.; Szawłowski, M.; Wolski, D. Energy resolution of small scintillation detectors with SiPM light readout. JINST 2013, 8, P02017. [Google Scholar] [CrossRef]
- Finocchiaro, P.; Pappalardo, A.; Cosentino, L.; Belluso, M.; Billotta, S.; Bonanno, G.; Carbone, B.; Condorelli, G.; Di Mauro, S.; Fallica, G.; et al. Characterization of a Novel 100-Channel Silicon Photomultiplier—Part I: Noise. IEEE Trans. Electron Devices 2008, 55, 2757–2764. [Google Scholar]
- Finocchiaro, P.; Pappalardo, A.; Cosentino, L.; Belluso, M.; Billotta, S.; Bonanno, G.; Carbone, B.; Condorelli, G.; Di Mauro, S.; Fallica, G.; et al. Characterization of a Novel 100-Channel Silicon Photomultiplier—Part II: Charge and Time. IEEE Trans. Electron Devices 2008, 55, 2765–2773. [Google Scholar] [CrossRef]
- Finocchiaro, P.; Pappalardo, A.; Cosentino, L.; Belluso, M.; Billotta, S.; Bonanno, G.; Di Mauro, S. Features of Silicon Photo Multipliers: Precision Measurements of Noise, Cross-Talk, Afterpulsing, Detection Efficiency. IEEE Trans. Nucl. Sci. 2009, 56, 1033. [Google Scholar] [CrossRef]
- Bonanno, G.; Finocchiaro, P.; Pappalardo, A.; Billotta, S.; Cosentino, L.; Belluso, M.; Di Mauro, S.; Occhipinti, G. Precision measurements of Photon Detection Efficiency for SiPM detectors. Nucl. Instrum. Methods Phys. Res. Sect. A 2009, 610, 93–97. [Google Scholar] [CrossRef]
- Grodzicka-Kobylka, M.; Szczesniak, T.; Moszyński, M. Comparison of SensL and Hamamatsu 4×4 channel SiPM arrays in gamma spectrometry with scintillators. Nucl. Instrum. Methods Phys. Res. Sect. A 2017, 856, 53–64. [Google Scholar] [CrossRef]
- Longhitano, F.; Poma, G.E.; Cosentino, L.; Finocchiaro, P. A Scintillator Array Table with Spectroscopic Features. Sensors 2022, 22, 4754. [Google Scholar] [CrossRef] [PubMed]
- CAEN DT5740 Manual. Available online: https://www.caen.it/products/dt5740/ (accessed on 14 March 2023).
- NIST. Available online: https://physics.nist.gov/PhysRefData/XrayMassCoef/ComTab/cesium.html (accessed on 15 March 2023).
- Pappalardo, A.; Barbagallo, M.; Cosentino, L.; Marchetta, C.; Musumarra, A.; Scirè, C.; Scirè, S.; Vecchio, G.; Finocchiaro, P. Characterization of the silicon+6LiF thermal neutron detection technique. Nucl. Instrum. Methods Phys. Res. Sect. A 2016, 810, 6–13. [Google Scholar] [CrossRef]
- Finocchiaro, P.; Cosentino, L.; Lo Meo, S.; Nolte, R.; Radeck, D. Absolute efficiency calibration of 6LiF-based solid state thermal neutron detectors. Nucl. Instrum. Methods Phys. Res. Sect. A 2018, 885, 86–90. [Google Scholar] [CrossRef]
- Cosentino, L.; Musumarra, A.; Barbagallo, M.; Colonna, N.; Damone, L.; Pappalardo, A.; Piscopo, M.; Finocchiaro, P. Silicon detectors for monitoring neutron beams in n-TOF beamlines. Rev. Sci. Instrum. 2015, 86, 073509. [Google Scholar]
- Pappalardo, A.; Vasi, C.; Finocchiaro, P. Direct comparison between solid state Silicon + 6LiF and 3He gas tube neutron detectors. Results Phys. 2016, 6, 12–13. [Google Scholar] [CrossRef]
- McGregor, D.S.; Hammig, M.D.; Yang, Y.H.; Gersch, H.K.; Klann, R.T. Design consideration for thin film coated semiconductor thermal neutron detectors –I: Basics regarding alpha particle emitting neutron reactive films. Nucl. Instrum. Methods Phys. Res. Sect. A 2003, 500, 272–308. [Google Scholar] [CrossRef]
- Phlips, B.F.; Kub, F.J.; Novikova, E.I.; Wulf, E.A.; Fitzgerald, C. Neutron detection using large area silicon detectors. Nucl. Instrum. Methods Phys. Res. Sect. A 2007, 579, 173–176. [Google Scholar] [CrossRef]
- Davies, J.; Siebenhandl-Wolff, P.; Tranquart, F.; Jones, P.; Evans, P. Gadolinium: Pharmacokinetics and toxicity in humans and laboratory animals following contrast agent administration. Arch. Toxicol. 2022, 96, 403. [Google Scholar] [CrossRef] [PubMed]
- Mastromarco, M.; Castelluccio, D.M.; Clai, G.; Manna, A.; Massimi, C.; Rocchi, F. 155,157Gd neutron capture cross sections measured at n TOF (CERN). Il Nuovo Cim. C 2019, 42, 136. [Google Scholar]
- Danijela Đukić-Ćosić, D.; Baralić, K.; Javorac, D.; Djordjevic, A.B.; Bulat, Z. An overview of molecular mechanisms in cadmium toxicity. Curr. Opin. Toxicol. 2020, 19, 56–62. [Google Scholar] [CrossRef]
- Sears, V.F. Neutron scattering lengths and cross sections. Neutron News 1992, 3, 26–37. [Google Scholar] [CrossRef]
- Colonna, N.; Pietropaolo, A.; Sacchetti, F. 3He replacement in neutron detection: Current status and perspectives. Eur. Phys. J. Plus 2015, 130, 219, ISSN: 2190-5444 (Online). [Google Scholar] [CrossRef]
- Cesaria, M.; Lorusso, A.; Caricato, A.P.; Finocchiaro, P.; Amaducci, S.; Martino, M.; Aziz, M.R.; Calcagnile, L.; Perrone, A.; Quarta, G. 10B-based films grown by pulsed laser deposition for neutron conversion applications. Appl. Phys. A 2020, 126, 404. [Google Scholar] [CrossRef]
- Caricato, A.P.; Cesaria, M.; Finocchiaro, P.; Amaducci, S.; Longhitano, F.; Provenzano, C.; Marra, M.; Martino, M.; Aziz, M.R.; Serra, A.; et al. Thermal neutron conversion by high purity 10B-enriched layers: PLD-growth, thickness-dependence and neutron-detection performances. Eur. Phys. J. Plus 2022, 137, 431. [Google Scholar] [CrossRef]
- Amaducci, S.; Cosentino, L.; Barbagallo, M.; Colonna, N.; Mengoni, A.; Massimi, C.; Lo Meo, S.; Finocchiaro, P.; Aberle, O.; Andrzejewski, J.; et al. Measurement of the 235U(n,f) cross section relative to the 6Li(n,t) and 10B(n,α) standards from thermal to 170keV neutron energy range at n TOF. Eur. Phys. J. A 2019, 55, 120. [Google Scholar] [CrossRef]
- Massara, A.; Amaducci, S.; Cosentino, L.; Longhitano, F.; Marchetta, C.; Poma, G.E.; Ursino, M.; Finocchiaro, P. 6LiF Converters for Neutron Detection: Production Procedures and Detector Tests. Instruments 2023, 7, 1. [Google Scholar] [CrossRef]
- Hamamatsu. Available online: https://www.hamamatsu.com/content/dam/hamamatsu-photonics/sites/documents/99_SALES_LIBRARY/ssd/s3590-08_etc_kpin1052e.pdf (accessed on 15 March 2023).
- Cosentino, L.; Ducasse, Q.; Giuffrida, M.; Lo Meo, S.; Longhitano, F.; Marchetta, C.; Massara, A.; Pappalardo, P.; Passaro, G.; Russo, S.; et al. SiLiF Neutron Counters to Monitor Nuclear Materials in the MICADO Project. Sensors 2021, 21, 2630. [Google Scholar] [CrossRef] [PubMed]
- Agostinelli, S.; Allison, J.; Amako, K.; Apostolakis, J.; Araujo, H.; Arce, P.; Asai, M.; Axen, D.; Banerjee, S.; Barrand, G.; et al. Geant4—A simulation toolkit. Nucl. Instrum. Methods Phys. Res. Sect. A 2003, 506, 250–303. [Google Scholar] [CrossRef]
- ICPR. Conversion Coefficients for Use in Radiological Protection against External Radiation; ICRP Publication 74, Annals of the ICR; Pergamon; ICPR: Ottawa, ON, Canada, 1996; Volume 26, No. 3/4. [Google Scholar]
- Raspberry Pi4. Available online: https://www.raspberrypi.com/products/raspberry-pi-4-model-b/ (accessed on 16 March 2023).
- Jordanov, V.T.; Knoll, G.F. Digital synthesis of pulse shapes in real time for high resolution radiation spectroscopy. Nucl. Instrum. Methods Phys. Res. Sect. A 1994, 345, 337–345. [Google Scholar] [CrossRef]
- Mianowska, Z.; Moszynski, Z.M.; Brylew, K.; Chabera, M.; Dziedzic, A.; Gektin, A.V.; Krakowski, T.; Mianowski, S.; Syntfeld-Każuch, A.; Szczesniak, T.; et al. The light response of CsI:Tl crystal after interaction with gamma radiation study using analysis of single scintillation pulses and digital oscilloscope readout. Nucl. Instrum. Methods Phys. Res. Sect. A 2022, 1031, 166600. [Google Scholar] [CrossRef]
- Finocchiaro, P.; Cosentino, L.; Longhitano, F.; Poma, G.E.; Amaducci, S.; Dumercq, B.; Helbert, C.; Tondut, L. Field test of the MICADO monitoring detectors in a real radwaste storage. In Proceedings of the Talk to Be Given at ANIMMA 2023, Lucca, Italy, 12–16 June 2023. [Google Scholar]


| Property | Value |
|---|---|
| density | 4.51 g/cm3 |
| <Z> | 54 |
| attenuation coefficient at 662 keV | 0.36 cm−1 |
| light yield | 60,000 photons/MeV |
| energy resolution @ 662 keV | 5–10% FWHM |
| primary decay constant | 960 ns |
| λ max emission | 550 nm |
| refractive index @ emission max | 1.79 |
| cost of 1 × 1 × 1 cm3 crystal | ≈EUR 30 |
| Species | Cross Section [b] | Comment |
|---|---|---|
| 157Gd | ≈254,000 | too many gammas (and toxic) [26,27] |
| 113Cd | ≈20,000 | too many gammas (and toxic) [28,29] |
| 3He | 5333 | expensive, being replaced in neutron detection applications, non-natural, produced in military reactors [30] |
| 10B | 3837 | expensive, produces low energy alpha and 7Li particles but also gamma rays [31,32,33] |
| 6Li | 940 | cheaper, easily deposited (6LiF), produces high-energy triton and alpha particles and no gamma rays [33,34] |
| 235U | ≈583 | dangerous strategic material, radioactive, subject to radiation protection restrictions [33] |
| Source | Peak Energy [keV] Used for Calibration | Peak Energy [keV] Not Used for the Calibration Fit |
|---|---|---|
| 60Co | 1173, 1330 | |
| 22Na | 511, 1274 | 170 * |
| 207Bi | 75, 570, 1064 | |
| 137Cs | 662 | 184 * |
| 241Am | 59, 26 | |
| 226Ra | 295, 352, 609, 768, 1120, 1238, 1377, 1764 | 2204, 2248 |
| 133Ba | 31, 35, 81, 356 |
Disclaimer/Publisher’s Note: The statements, opinions and data contained in all publications are solely those of the individual author(s) and contributor(s) and not of MDPI and/or the editor(s). MDPI and/or the editor(s) disclaim responsibility for any injury to people or property resulting from any ideas, methods, instructions or products referred to in the content. |
© 2023 by the authors. Licensee MDPI, Basel, Switzerland. This article is an open access article distributed under the terms and conditions of the Creative Commons Attribution (CC BY) license (https://creativecommons.org/licenses/by/4.0/).
Share and Cite
Rossi, F.; Cosentino, L.; Longhitano, F.; Minutoli, S.; Musico, P.; Osipenko, M.; Poma, G.E.; Ripani, M.; Finocchiaro, P. The Gamma and Neutron Sensor System for Rapid Dose Rate Mapping in the CLEANDEM Project. Sensors 2023, 23, 4210. https://doi.org/10.3390/s23094210
Rossi F, Cosentino L, Longhitano F, Minutoli S, Musico P, Osipenko M, Poma GE, Ripani M, Finocchiaro P. The Gamma and Neutron Sensor System for Rapid Dose Rate Mapping in the CLEANDEM Project. Sensors. 2023; 23(9):4210. https://doi.org/10.3390/s23094210
Chicago/Turabian StyleRossi, Fabio, Luigi Cosentino, Fabio Longhitano, Saverio Minutoli, Paolo Musico, Mikhail Osipenko, Gaetano Elio Poma, Marco Ripani, and Paolo Finocchiaro. 2023. "The Gamma and Neutron Sensor System for Rapid Dose Rate Mapping in the CLEANDEM Project" Sensors 23, no. 9: 4210. https://doi.org/10.3390/s23094210