Article

Reliability of Obstacle-Crossing Parameters during Overground Walking in Young Adults

by
Matthias Chardon
1,2,
Fabio Augusto Barbieri
2,*,
Pascal Petit
1 and
Nicolas Vuillerme
1,3,*
1
AGEIS (Autonomie, Gérontologie, E-Santé, Imagerie et Société), Université Grenoble Alpes, 38000 Grenoble, France
2
Human Movement Research Laboratory (MOVI-LAB), Department of Physical Education, Sao Paulo State University (UNESP), Bauru 17033-360, SP, Brazil
3
Institut Universitaire de France, 75005 Paris, France
*
Authors to whom correspondence should be addressed.
Sensors 2024, 24(11), 3387; https://doi.org/10.3390/s24113387
Submission received: 4 April 2024 / Revised: 22 May 2024 / Accepted: 22 May 2024 / Published: 24 May 2024
(This article belongs to the Special Issue Robust Motion Recognition Based on Sensor Technology)

Abstract

:
We aimed to evaluate the intra-session relative and absolute reliability of obstacle-crossing parameters during overground walking in young adults, and to determine the number of trials required to ensure reliable assessment. We analysed data from 43 young male adults who were instructed to walk at a self-selected velocity on a pathway and to step over an obstacle (height = 15 cm; width = 80 cm, thickness = 2 cm) three times. Spatial–temporal gait parameters of the approaching and crossing phases (i.e., before and after the obstacle) and obstacle clearance parameters (i.e., vertical and horizontal distance between the foot and the obstacle during crossing) were computed using a three-dimensional motion analysis system. Intraclass correlation coefficients were used to compute the relative reliability, while standard error of measurement and minimal detectable change were used to assess the absolute reliability for all possible combinations between trials. Results showed that most spatial–temporal gait parameters and obstacle clearance parameters are reliable using the average of three trials. However, the mean of the second and third trials ensures the best relative and absolute reliabilities of most obstacle-crossing parameters. Further works are needed to generalize these results in more realistic conditions and in other populations.

1. Introduction

Reliability does represent a crucial consideration as a methodology for application in gait analysis. Indeed, if gait analysis is intended to serve as an outcome measure for diagnostic, monitoring, or therapeutic purposes, the level of reliability for each computed gait parameter has to be established.
This is certainly one of the reasons that has prompted scientists and researchers to focus on the reliability assessment of gait measurements in both healthy [1,2,3,4,5] and pathological [3,6,7,8,9,10,11] populations. In previous studies conducted on overground/flat conditions in healthy patients [2] and stroke individuals [6,7], speed and stride length [2,6,7], as well as cadence and gait cycle time [7], showed good reliability. In addition, knee, hip, and ankle angles showed good to excellent reliability in healthy individuals [1] and adults with spinal cord injury [6].
However, few studies have investigated the number of trials needed to ensure reliable intra-session gait assessment [2,9,12]. For instance, Soulard et al. (2021) [2] showed that three trials were enough to ensure reliable gait assessment during the 10 m walk test in both single and dual-task conditions in healthy adults [2]. Interestingly, the common feature of the above-mentioned gait reliability studies is the assessment of unobstructed level walking tasks. However, not much is known about the reliability of gait parameters under more challenging conditions, such as crossing physical obstacles while overground walking (obstructed walking task). This observation is somewhat surprising since obstacle-crossing performance during walking has been widely studied using vision/camera-based systems in various populations, including children [13,14], older healthy adults [15,16], individuals with obesity [17], and people with Parkinson’s disease [18,19,20,21], multiple sclerosis [22], traumatic brain injuries [23], or stroke [24,25]. This observation is also of great concern since obstacles are likely encountered during community ambulation in an everyday environment (e.g., obstacles on sidewalks or in corridors of railway or subway stations [26]). In addition, it is widely agreed that measuring clearance parameters during the performance of the obstacle-crossing task is of significant clinical importance, assuming that lower toe clearances [27] and horizontal distances [28] could result in a high probability of foot contact and hence an increased risk of stumbles, trips, and falls.
To our knowledge, no study has yet investigated the reliability of these widely used gait and clearance parameters during obstacle-crossing in young healthy adults, whereas the reliability of gait parameters computed using vision/camera-based systems has previously been assessed during unobstructed walking in healthy adults (e.g., [29,30,31,32]). To address some of the aforementioned limitations, the purpose of the present work was to evaluate the reliability, relative and absolute, of obstacle-crossing parameters during overground walking in young adults. We further aimed to determine the number of trials required to ensure reliable obstacle-crossing measurements. Indeed, determining the number of trials required to ensure reliable measurement is a prerequisite to allow comparisons between groups at a single time point [33]. Note that this question has been the subjects of a number of studies in a variety of applications fields, including human movement, sport, and health, to name a few (e.g., [2,34,35,36,37,38,39,40,41,42,43,44,45,46,47]). In particular, intra-session reliability can favourably be used to assess the number of trials to ensure reliable measurements [2,9,38,48] to optimize gait assessments in clinical practice.

2. Materials and Methods

This study is a secondary analysis of previously published obstacle-crossing studies [22,49,50].

2.1. Participants

Data from 43 Brazilian males (age = 29.1 ± 5.91 years old, body mass = 76.3 ± 9.97 kg, body height = 1.77 ± 0.06 cm, BMI = 24.4 ± 2.72 kg/m2, mean ± SD) were analysed. Participants had no diagnosis of muscular or neurodegenerative disease. Participants were informed about the experimental procedures and signed informed consent. The study was approved by the University Institution Review Board (authorization number: CAAE#99191318.0.0000.5398). This study and all methods were performed in accordance with the Declaration of Helsinki.

2.2. Experimental Protocol

Participants were instructed to walk barefoot at a self-selected velocity on an 8.5 m long pathway and to step over a physical obstacle (height = 15 cm; width = 80 cm, thickness = 2 cm) placed in the middle of the pathway. To ensure that participants crossed the obstacle with the right leg as the leading limb, the starting point of each trial was adjusted, and at least two strides were completed before crossing the obstacle. Participants completed three trials.

2.3. Gait Assessment

Kinematic data were recorded using ten infrared cameras (Vicon Motion System®, Oxford, UK, 200 Hz). Two markers were positioned at the top of the obstacle. Also, four markers were placed on the lateral aspect of the calcaneus and head of the second metatarsus of the right limb and the medial aspect of the calcaneus and head of the second metatarsus of the left limb. Conventional labelling of the limbs was used: the leading foot crossed the obstacle first, and the trailing foot crossed second. Signals were filtered with a low-pass (6 Hz) Butterworth filter of fifth-order (zero-lag). These pre-processed signals were used to compute the following parameters:
Spatial–temporal gait parameters (length, width, duration, velocity, and double-support time) of the approaching phase (stride before the obstacle) and of the crossing phase (step over the obstacle);
Leading and trailing foot placement prior to the obstacle (horizontal distance from the second metatarsal marker to the obstacle);
Leading and trailing vertical toe foot clearance during obstacle-crossing (vertical distance at the moment that the second metatarsal marker was above the obstacle);
Leading and trailing foot placement after the obstacle (horizontal distance from the heel marker to the obstacle).

2.4. Statistical Analysis

To examine the potential difference between trials for each obstacle-crossing parameter, a repeated measures analysis of variance (RM-ANOVA) was first carried out. In cases where a difference was observed (type I error rate set at α = 0.05), a pairwise comparison post hoc test was performed to compare differences between pairs of trials, using the Benjamini–Hochberg approach to account for multiple testing.
To assess relative reliability across the three trials, the intraclass correlation coefficient (ICC) based on a two-way random effects model (absolute agreement, ICC(2.1)) was calculated. ICC(2.1) values inferior to 0 were considered ‘poor’, between 0.01 and 0.20 as ‘slight’, between 0.21–0.40 as ‘fair’, between 0.41–0.60 as ‘moderate’, between 0.61–0.80 as ‘substantial’, and 0.80–1.00 as ‘almost perfect’ relative reliability [51].
To assess absolute reliability across the three trials, the standard error of measurement (SEM) and the minimum detectable change (MDC) were computed. SEM, with the same unit as obstacle-crossing parameters, corresponds to the absolute measure of the variability of the errors of measurements and informs on the precision of obstacle-crossing parameters of individual participants [52]. SEM was calculated using the following formula [53]: SEM = SD√(1-ICC(2.1)), where SD is the standard deviation of the obstacle-crossing parameters from all participants and ICC(2.1) is the relative reliability. MDC is the minimum value for which a difference can be considered “real”. MDC was calculated using the following formula [54]: MDC = SEM × 1.96 × √2. The SEM% and MDC% were also expressed as a percentage of the mean for each obstacle-crossing parameter. Lower values for SEM% and MDC% indicate higher absolute reliability. Precisely, SEM% values were considered ‘low’ (SEM% ≤ 10%) or ‘high’ (SEM% > 10%) [55], while MDC% values were considered ‘low’ (MDC% ≤ 20%), ‘acceptable’ (20% < MDC% < 40%), or ‘high’ (MDC% ≥ 40%) [56].
To quantify the agreement between pairs of trials for each of the 16 obstacle-crossing parameters, Lin’s concordance correlation coefficient (CCC) and associated 95% confidence intervals [57,58], as well as the Shieh exact test for agreement [59], were used. The CCC indicates how close the measurement pairs fall to the 45-degree line (perfect agreement). Hence, the CCC is a measure of the reproducibility of measurements. The CCC ranges from −1 to 1, with perfect agreement at 1 and perfect discordance at −1. Agreement was considered ‘poor’ for CCC values < 0.40, ‘moderate’ for CCC values ranging from 0.40 to 0.70, and ‘good’ for CCC values > 0.70 [60].
Limits of agreement (LOA) and Bland–Altman plots of the differences between trials and their arithmetic mean were used to assess the magnitude of disagreement between trials for each obstacle-crossing parameter. LOA allows the quantification of bias and the determination of a range of agreement, within which 95% of the differences between one measurement and the other are included. The bias is significant when the line of equality is not within the 95% CI of the mean difference. The smallest worthwhile change (SWC) was used to determine the maximum allowed difference between trials presented in Bland–Altman plots [61]. The SWC provides a method to evaluate a real change in performance between trials. If the SWC is low and included in the LOA or Shieh 95% CI, it indicates a low variation between trials. Two trials are considered in agreement if the LOA or Shieh exact test does not exceed the maximum allowed difference between trials (SWC).
All statistical analyses were performed using R software 4.3.1® (R Core Team, Vienna, Austria) for Windows 10©. The list of all R packages used is provided in the Supplementary Materials.

3. Results

3.1. Difference between Trials

Most obstacle-crossing parameters exhibited no significant differences between trials. The only three exceptions were observed for the stride width and the double support time (p = 0.04, eta-squared = 0.01) during the approaching phase, and for the trailing foot horizontal distance after the obstacle (p = 0.02, eta-squared = 0.02). For these three parameters, pairwise t-tests showed that trial 1 (T1) differed from trials 2 and 3. Stride width was lower in T1 compared to T2 and T3 (p = 0.02 for T1–T2, p = 0.04 for T1–T3), double support time was greater for T1 compared to T2 and T3 (p = 0.05 for T1–T2, p = 0.03 for T1–T3), while for the trailing foot horizontal distance after obstacle, T3 was higher compared to T1 and T2 (p = 0.03).
Table 1 provides the arithmetic mean and standard deviation of obstacle-crossing parameters for each trial and the mean of the three trials.

3.2. Absolute and Relative Reliabilities

Figure 1 and Table 2 present the ICC(2.1) values for each obstacle-crossing parameter for all comparisons of trials. Table 2 also provides the SEM, SEM%, MDC, and MDC%.
Overall, when pooling the values of the three trials, the relative reliability ranged from moderate to practically perfect, whereas the absolute reliability was good for nine out of the sixteen parameters. Furthermore, the highest relative and absolute reliabilities were found when pooling values from T2–T3, followed by T1–T2–T3, T1–T3, and T1–T2.

3.2.1. Spatial–Temporal Gait Parameters during the Approaching Phase

Relative reliability: Regardless of the comparison of trials considered, spatial–temporal gait parameters during the approaching phase showed either substantial or almost perfect reliability. Indeed, ICC(2.1) ranged from 0.61 to 0.80 for stride width for all trial comparisons, for stride length, and double support time for T1–T2, T1–T3, and T1–T2–T3, while ICC(2.1) ranged from 0.81 to 1.00 for stride duration and stride velocity for all trial comparisons, and for stride length and double support time for T2–T3.
Absolute reliability: Regardless of the comparison of trials considered, SEM% and MDC% values were low for most of the spatial–temporal gait parameters during the approaching phase (SEM% < 10 and MDC% < 20%), with the exception of the stride width (SEM% > 10% and 20% < MDC% < 40%, for all trial comparisons), and MDC% of the double support time (MDC% = 20.4%, for T1–T2).
Number of trials to ensure reliable measurements: The comparisons of means of ICC(2.1) between trials showed that, for all spatial–temporal gait parameters during the approaching phase, slightly higher ICC(2.1) and lower SEM% and MDC% were obtained when pooling the second and third trials, compared to the first and second trials, the first and third trials, or the three trials.

3.2.2. Spatial–Temporal Gait Parameters during the Crossing Phase

Relative reliability: Regardless of the comparison of trials considered, step length, step duration, and step velocity showed either substantial or almost perfect relative reliability. Indeed, ICC(2.1) ranged from 0.61 to 0.80, for step duration for all trial comparisons and for step velocity for T1–T2, T1–T3, and T1–T2–T3, while ICC(2.1) ranged from 0.81 to 1.00, for step length for all trial comparisons and for step velocity for T2–T3. Furthermore, step width and double support time showed slight relative reliability (ICC(2.1) = 0.19 for double support time for T1–T2), fair relative reliability (ICC(2.1) ranged from 0.21 to 0.40, for step width for T1–T2 and T1–T3), moderate relative reliability (ICC(2.1) ranged from 0.41 to 0.60 for step width for T1–T2–T3, and for double support time for T1–T3 and T1–T2–T3), or substantial relative reliability (ICC(2.1) ranged from 0.61 to 0.80 for step width and double support time for T2–T3 only).
Absolute reliability: Regardless of the comparison of trials considered, SEM% and MDC% were low or acceptable (SEM% < 10% and MDC% < 40%) for step length, duration, and velocity. Step width and double support time showed high SEM% and MDC% values (SEM% > 10% and MDC% > 40%), except for double support time when pooling the second and third trials with an acceptable MDC% (MDC% = 34.4%).
Number of trials to ensure reliable measurements: The comparisons of means of ICC(2.1) between trials showed that, for almost all spatial–temporal gait parameters during the crossing phase, slightly higher ICC(2.1) (except for step duration, the best relative reliability was found for T1–T3, ICC(2.1) = 0.78) and lower SEM% (all parameters) and MDC% (all parameters) were obtained when pooling the second and third trials, compared to the first and second trials, the first and third trials, or the three trials.

3.2.3. Obstacle Clearance Parameters

Relative reliability: Regardless of the comparison of trials considered, obstacle clearance parameters showed either moderate, substantial, or almost perfect mean relative reliability. The highest ICC(2.1) values were found for leading toe clearance with substantial to almost perfect reliability (0.78 ≤ ICC(2.1) ≤ 0.89 for all trial comparisons), followed by trailing foot horizontal distance prior to the obstacle, and leading and trailing foot horizontal distance after the obstacle with substantial reliability (0.61 ≤ ICC(2.1) ≤ 0.80 for all trial comparisons). The lowest ICC values were found for the trailing foot toe clearance (moderate reliability, ICC(2.1) = 0.58, for T1–T3) and for the leading foot horizontal distance prior to an obstacle (moderate reliability, 0.51 ≤ ICC(2.1) ≤ 0.56, for T1–T2, T1–T3, and T1–T2–T3).
Absolute reliability: Regardless of the comparison of trials considered, SEM% and MDC% were low or acceptable for leading foot horizontal distance prior to the obstacle and trailing foot horizontal distance after the obstacle (SEM% < 10% and MDC% < 40%). Regardless of the comparison of trials considered, high SEM% values were found for leading and trailing foot toe clearance, leading foot horizontal distance after the obstacle, and trailing foot horizontal distance prior to the obstacle (for T1–T2, T1–T3, and T1–T2–T3). High MDC% (MDC% > 40%) values were observed for the leading (all trial comparisons) and trailing (T1–T2, T1–T3) limb toe clearances, as well as for the horizontal distance after the obstacle for the leading limb (T1–T3, T2–T3, T1–T2–T3).
Number of trials to ensure reliable measurements. The comparisons of means of ICC(2.1) between trials showed that, for almost all clearance parameters, slightly higher ICC(2.1) and lower SEM% and MDC% were obtained when pooling the second and third trials, compared to the first and second trials, the first and the third trials, or the three trials.

3.3. Agreement between Trials

When considering the maximum allowed difference between trials (SWC), regardless of the obstacle-crossing parameter, all pairs of trials were considered in agreement because the SWC was always within the LOA and Shieh ranges.

3.3.1. Spatial–Temporal Gait Parameters during the Approaching Phase

Good agreement (CCC > 0.70) between each pair of trials was found for all spatial–temporal gait parameters during the approaching phase.
The best results were found for T2–T3 for all parameters, followed by T1–T2 and T1–T3 for stride width, stride duration, and stride velocity, or followed by T1–T3 and T1–T2 for stride length and double support time.

3.3.2. Spatial–Temporal Gait Parameters during the Crossing Phase

Moderate (0.40 < CCC < 0.70) and good (CCC > 0.70) agreements between each pair of trials were found for all spatial–temporal gait parameters during the crossing phase, with the exception of the step width for T1–T2 (CCC = 0.34) and T1–T3 (CCC = 0.31), and of the double support time for T1–T2 (CCC = 0.19) with poor agreement between trials.
The best results were found when pooling values from T2–T3 for step length, step width, step velocity, and double support time (except for step duration, agreements between trials were better for T1–T3, CCC = 0.77 vs. CCC = 0.76 for T2–T3), followed by T1–T2 and T1–T3 for step length and step width, or followed by T1–T3 and T1–T2 for step velocity and double support time.

3.3.3. Obstacle Clearance Parameters

Moderate (0.40 < CCC < 0.70) and good (CCC > 0.70) agreements between each pair of trials were found for all obstacle clearance parameters.
The best results were found when pooling values from T2–T3 for leading and trailing foot toe clearance and foot horizontal distance prior to the obstacle. However, for leading and trailing foot horizontal distance after obstacle, agreements between trials were better for T1–T2 (CCC = 0.71 vs. CCC = 0.69 for T2–T3 for leading horizontal distance after obstacle, and CCC = 0.72 vs. CCC = 0.63 for T2–T3 for trailing foot distance after obstacle), followed by T1–T2 and T1–T3.
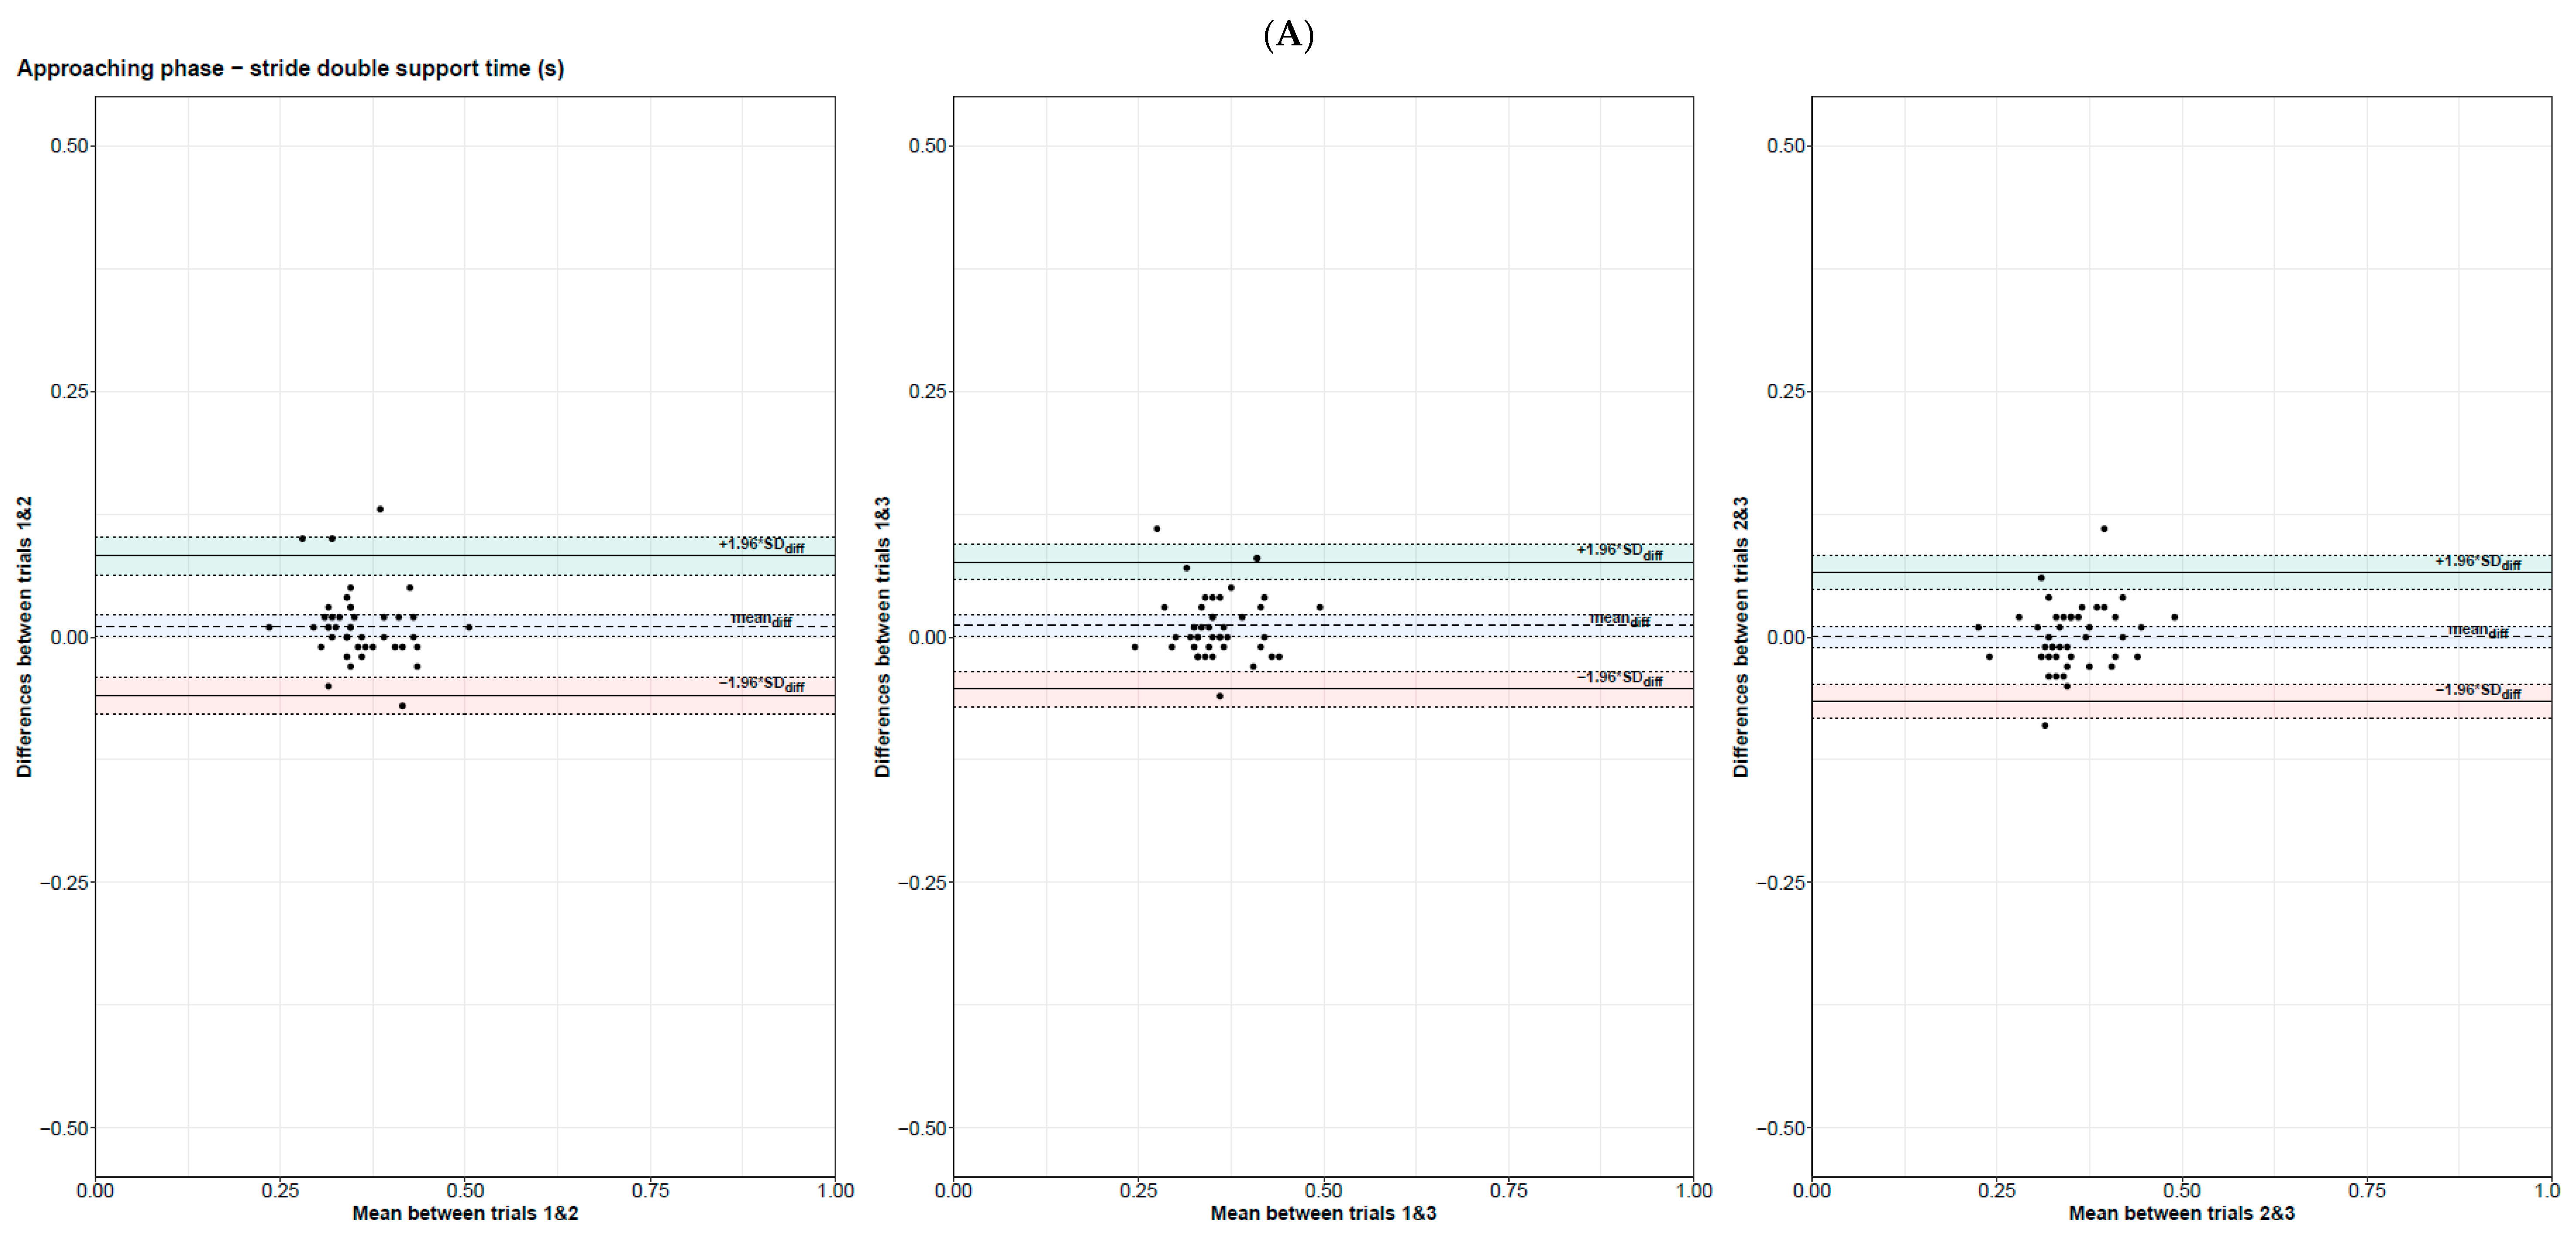
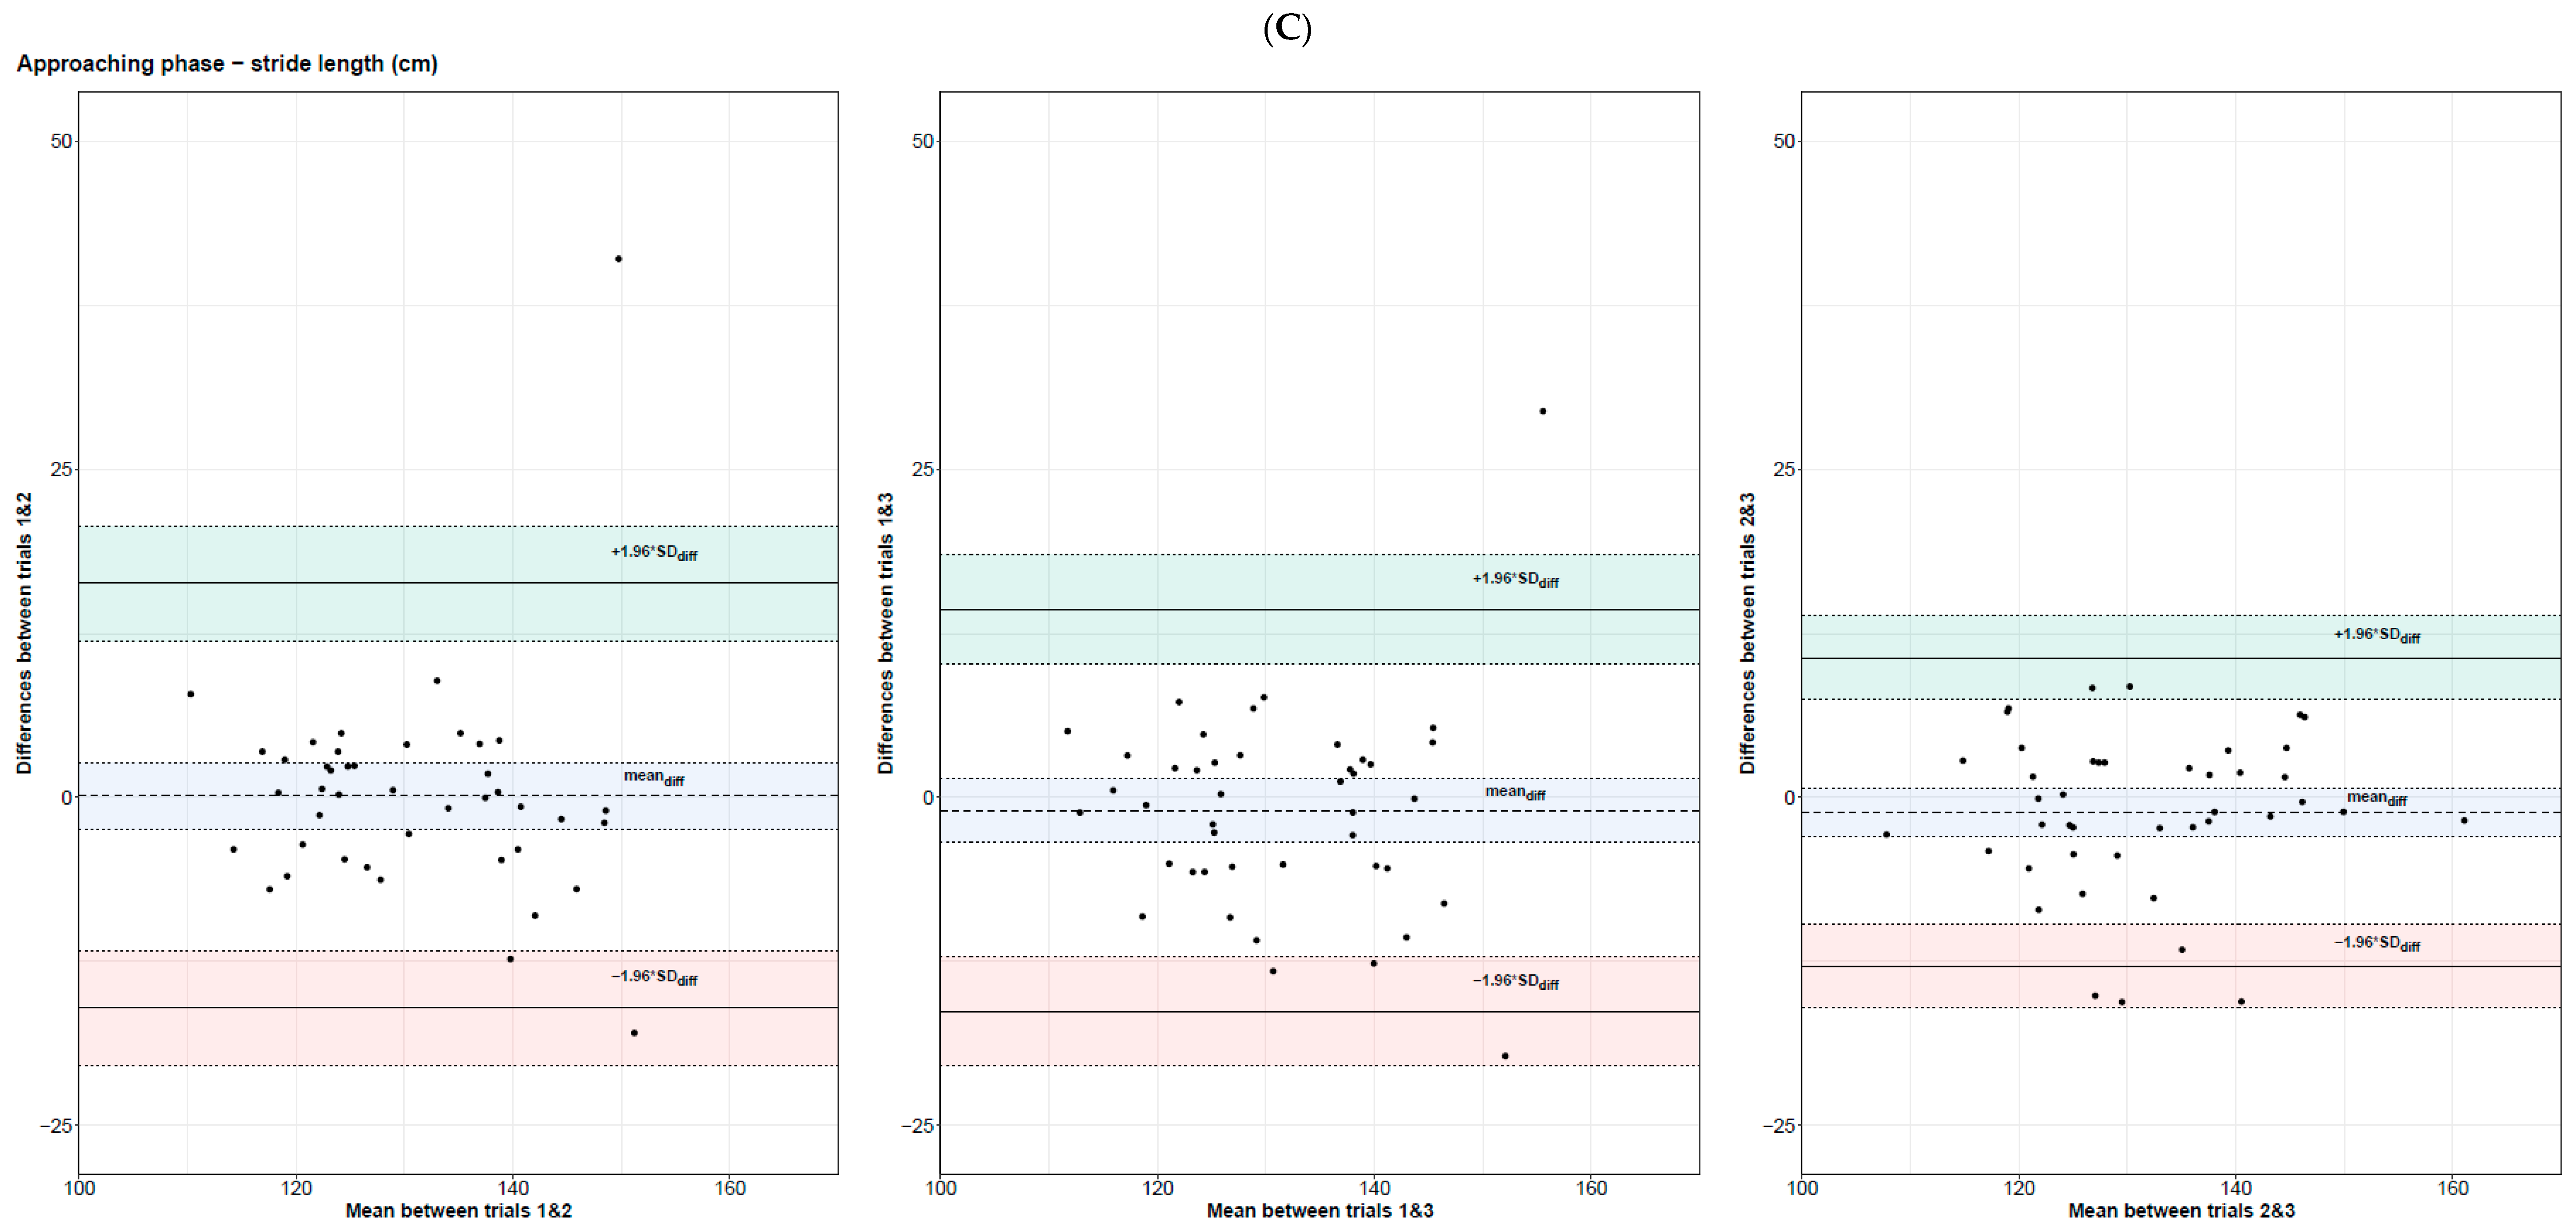
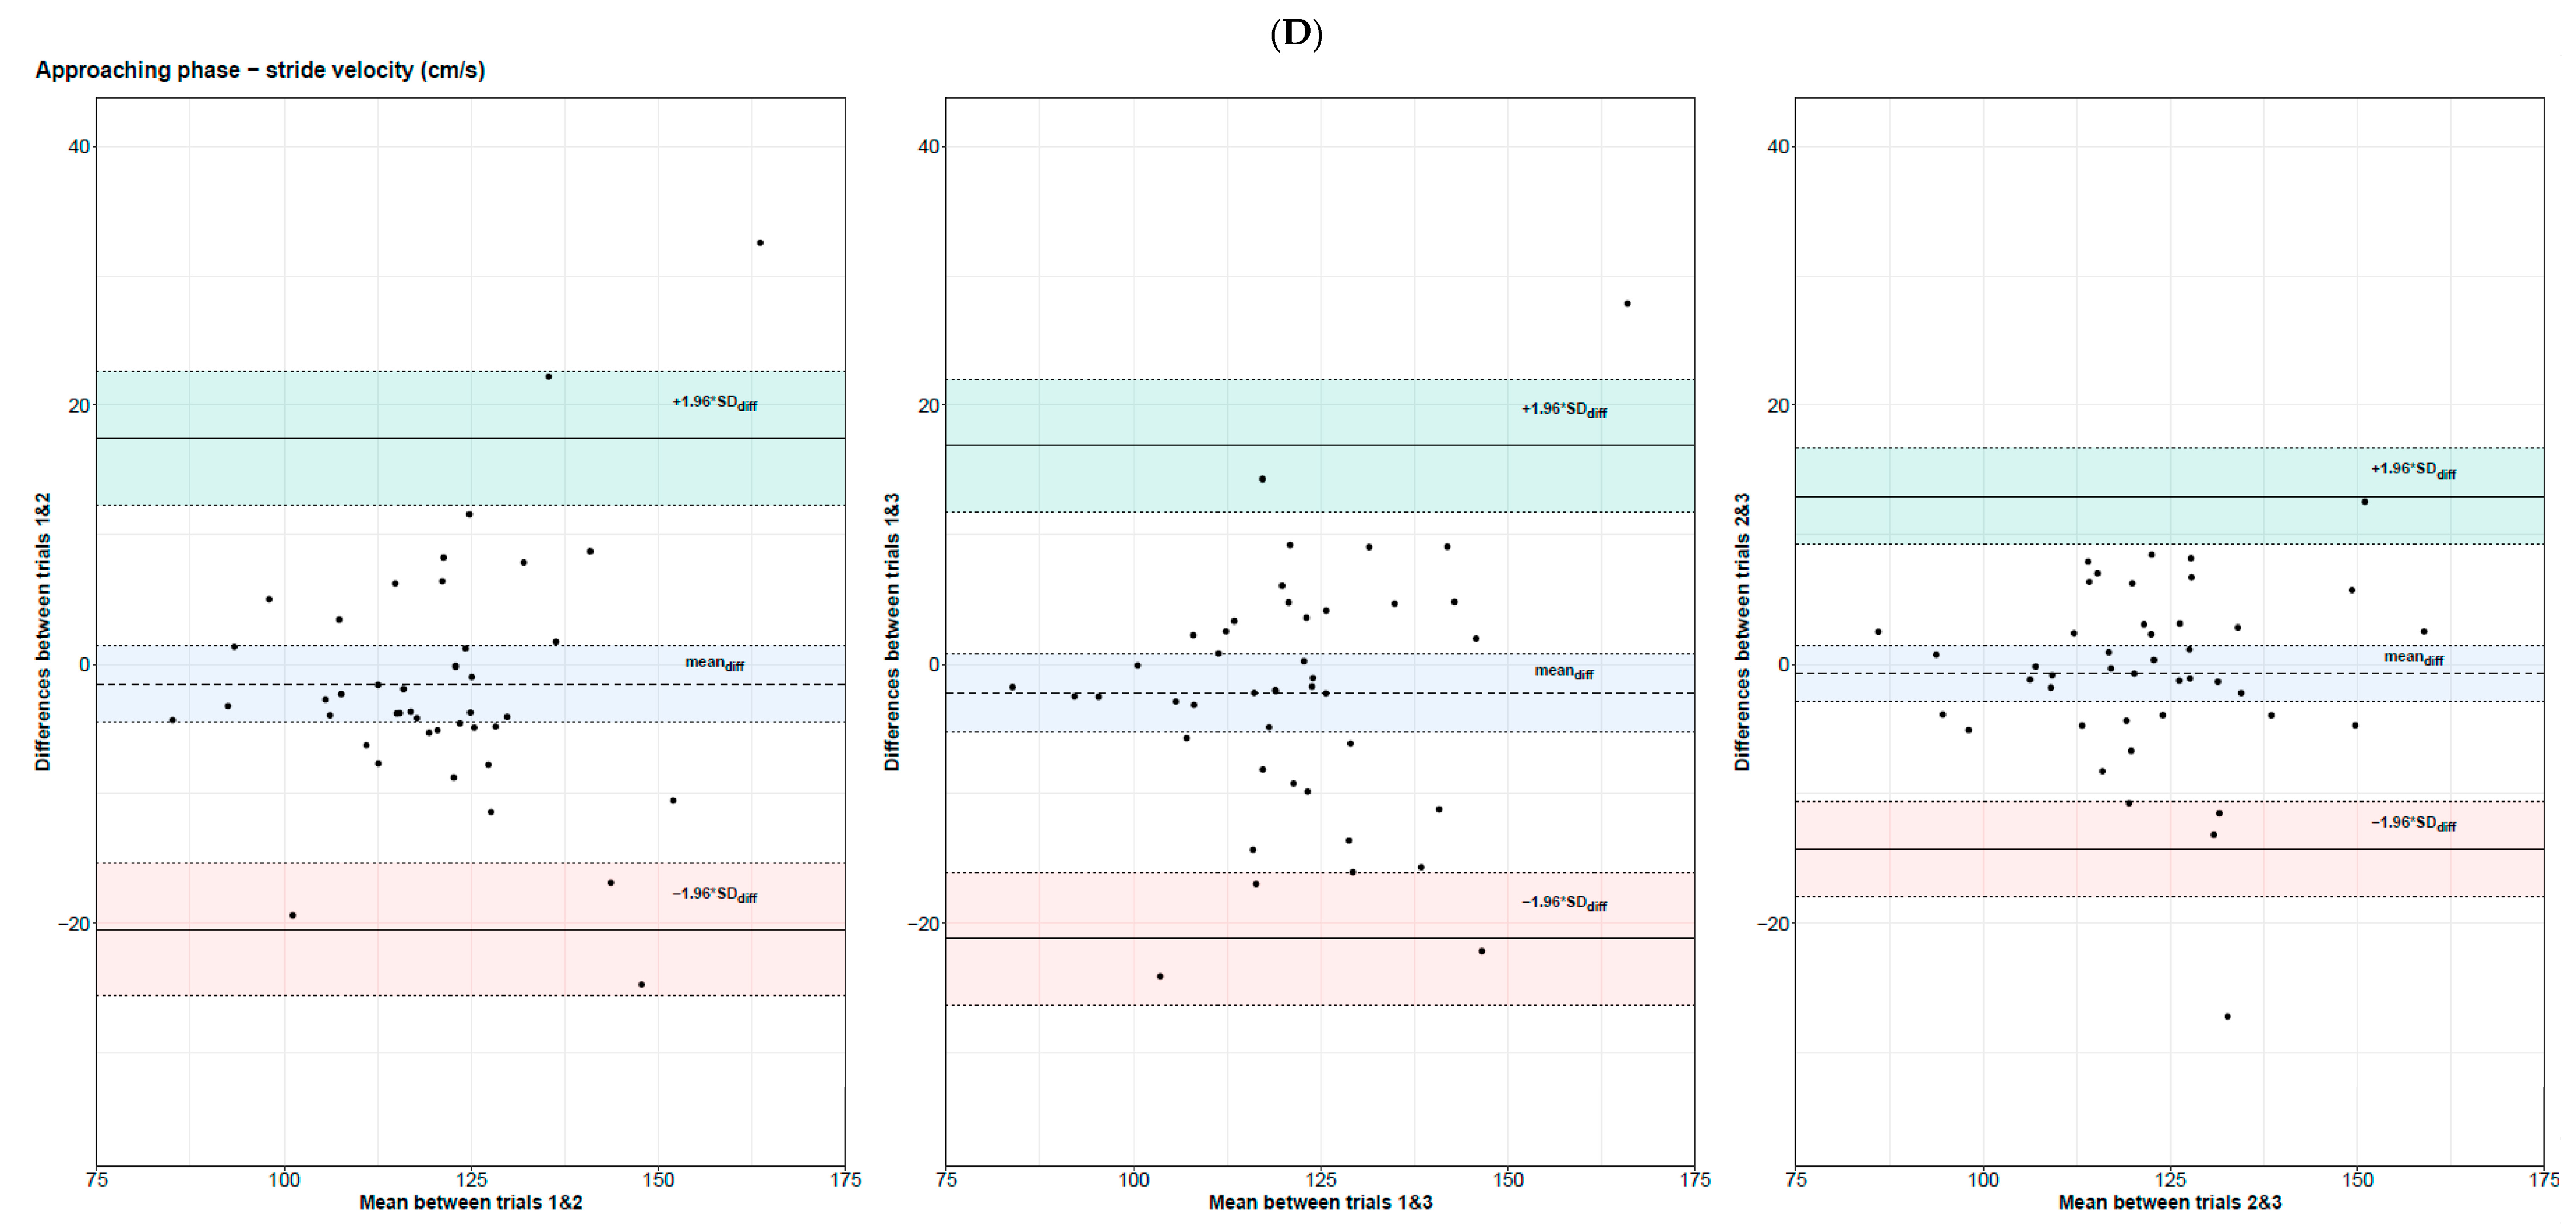
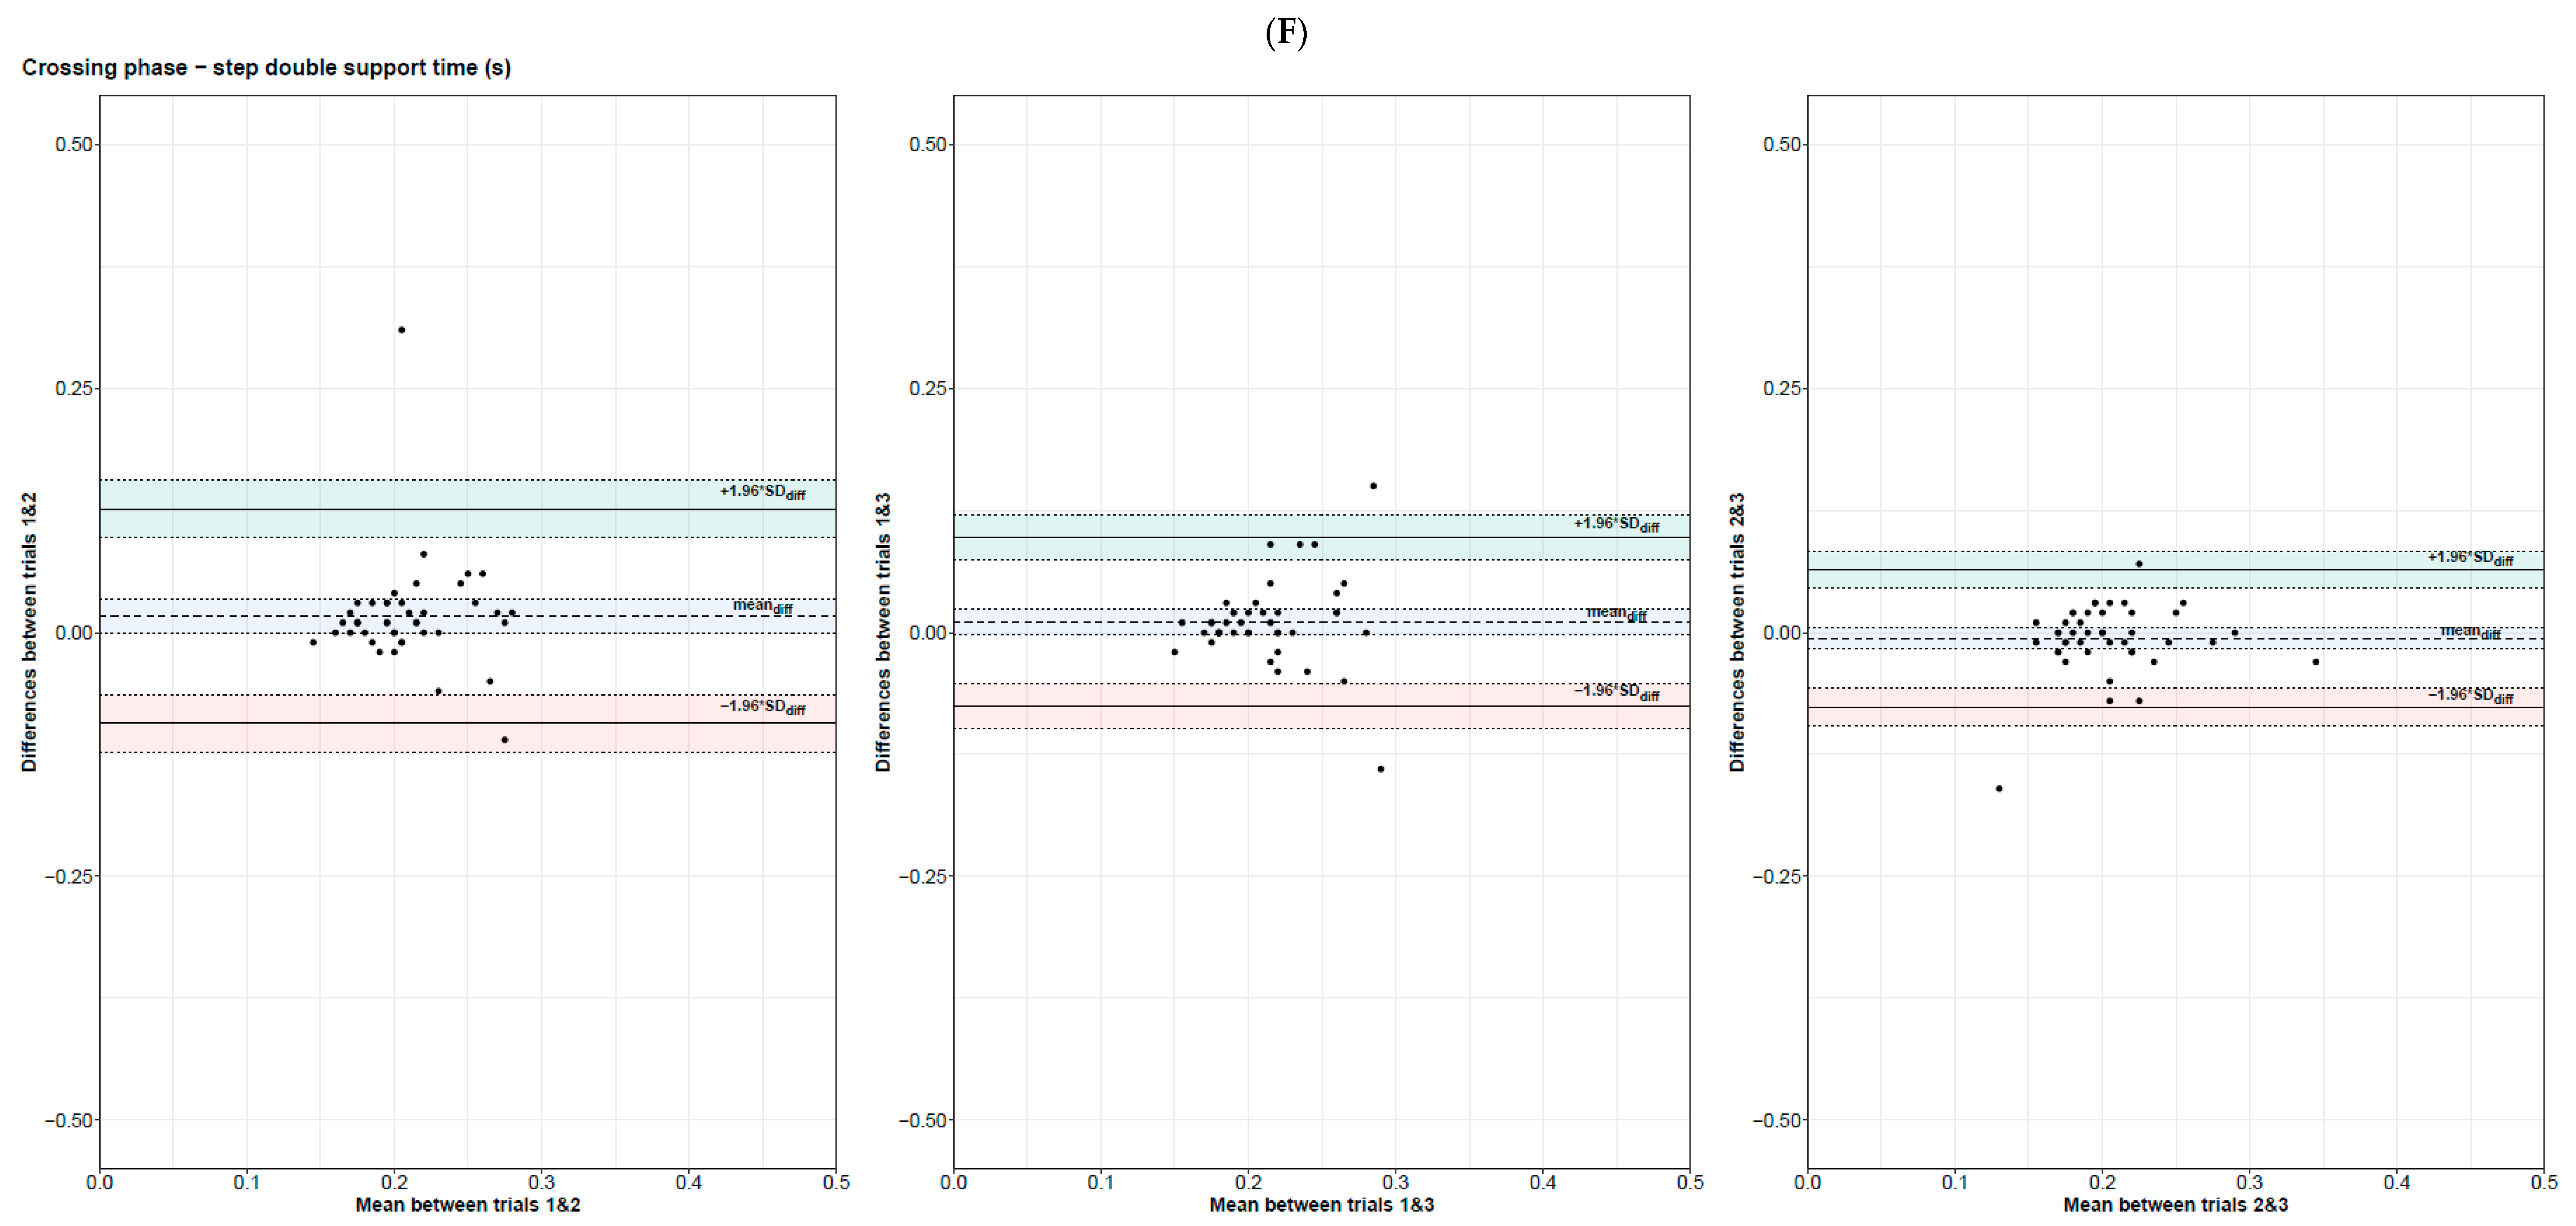
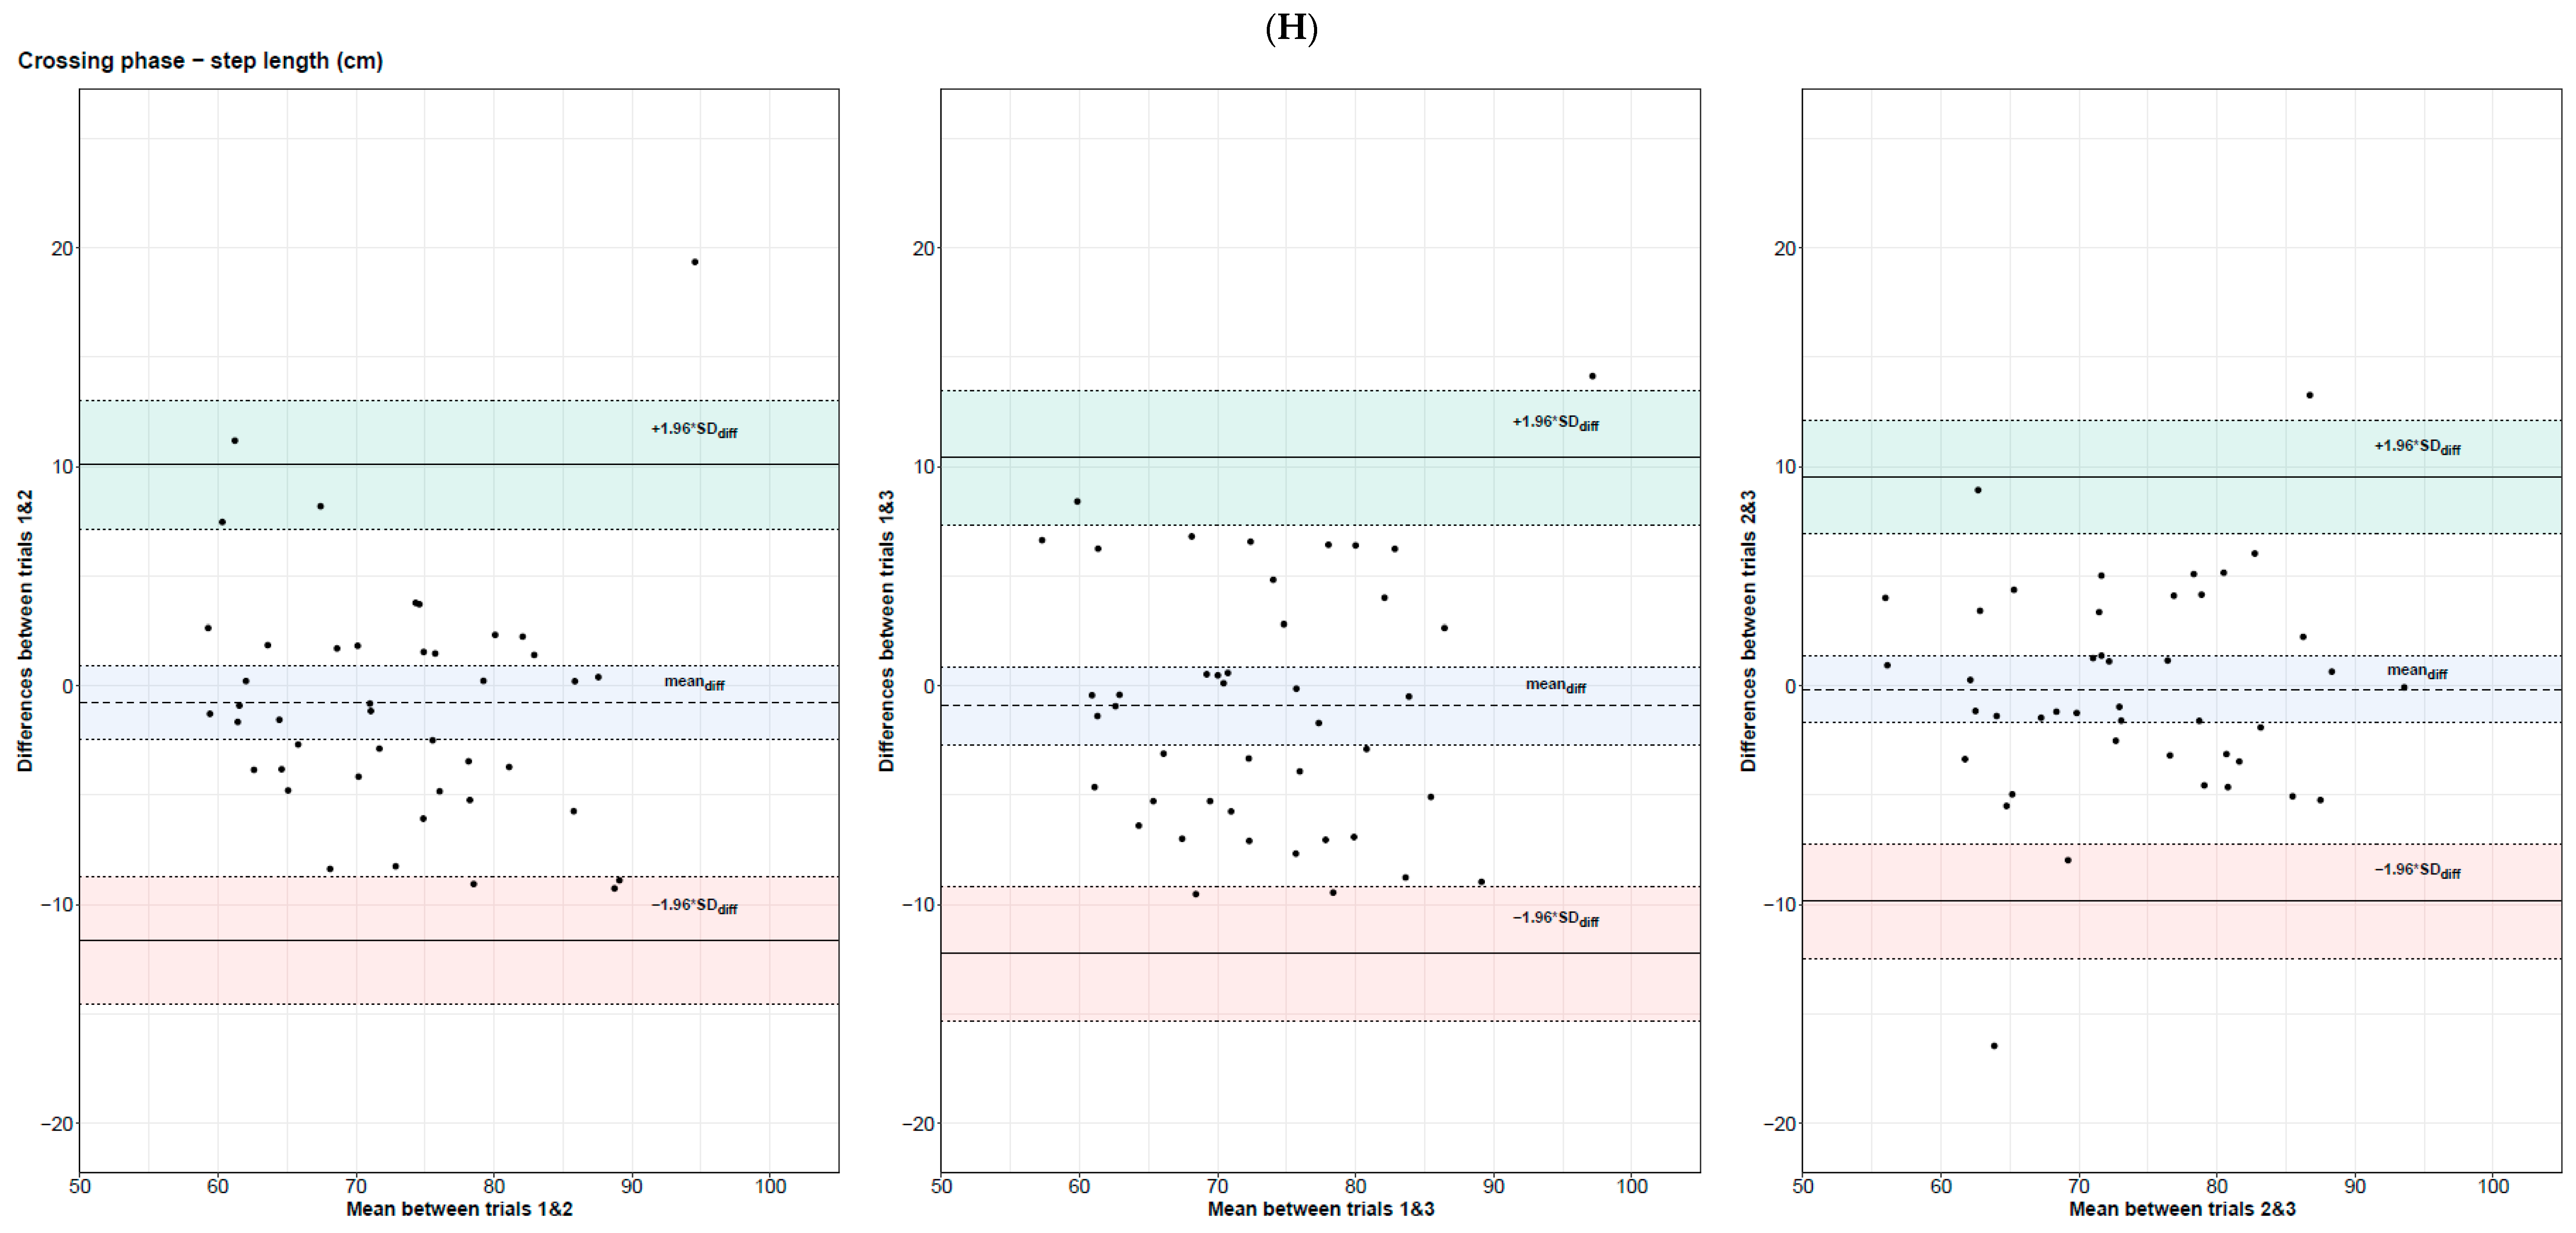
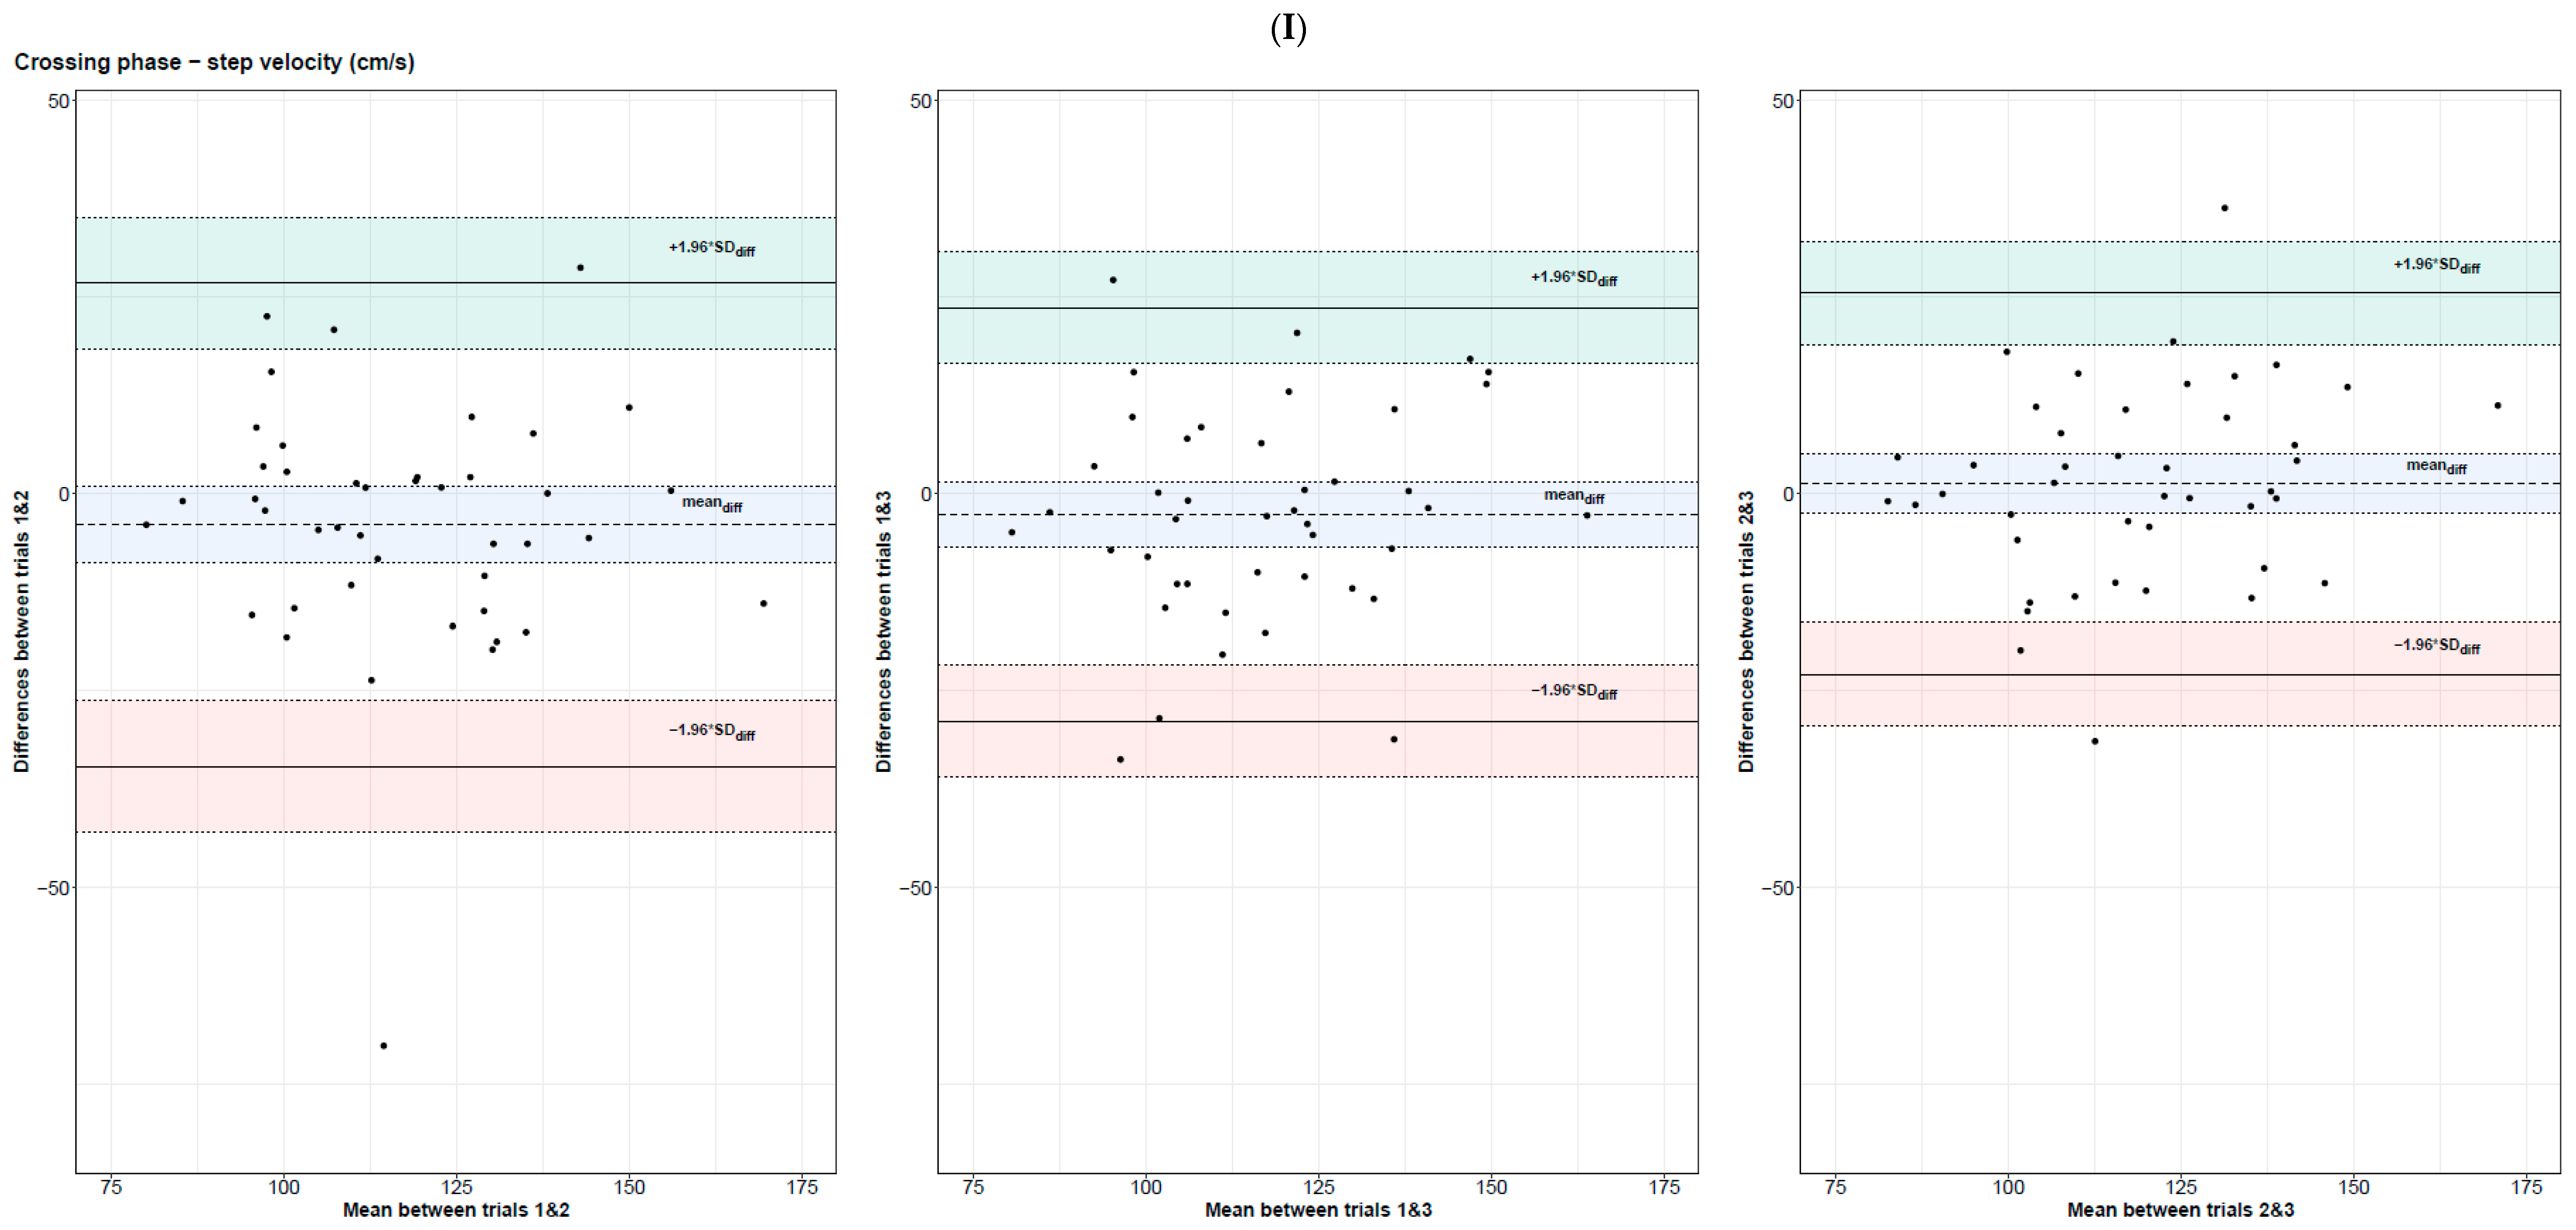
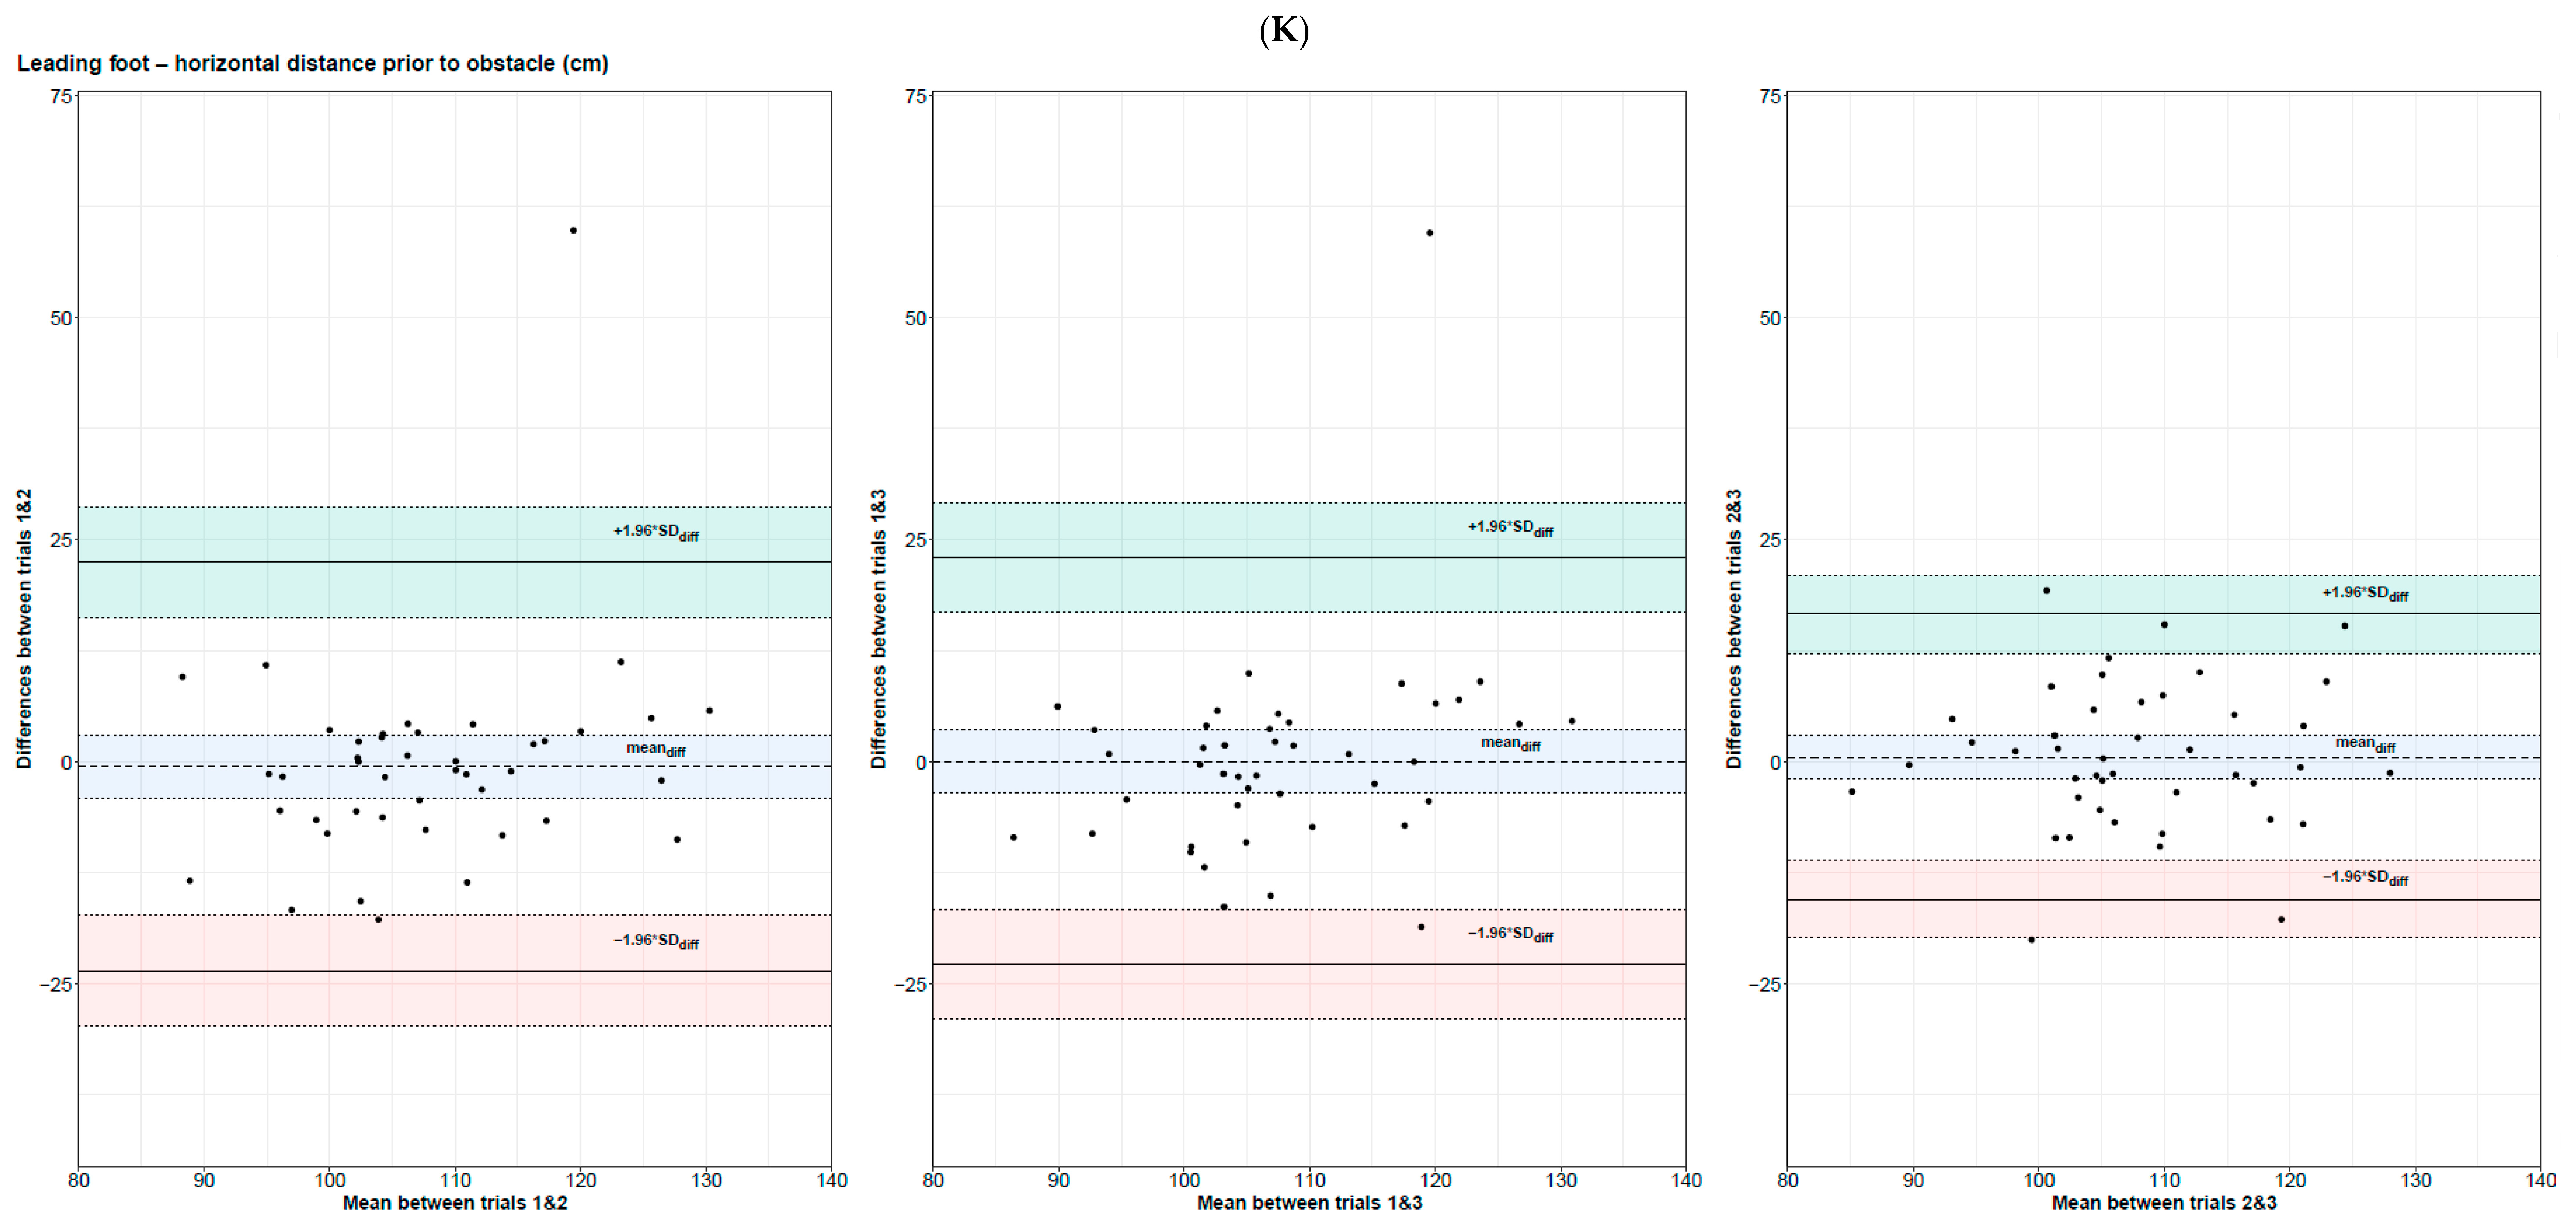
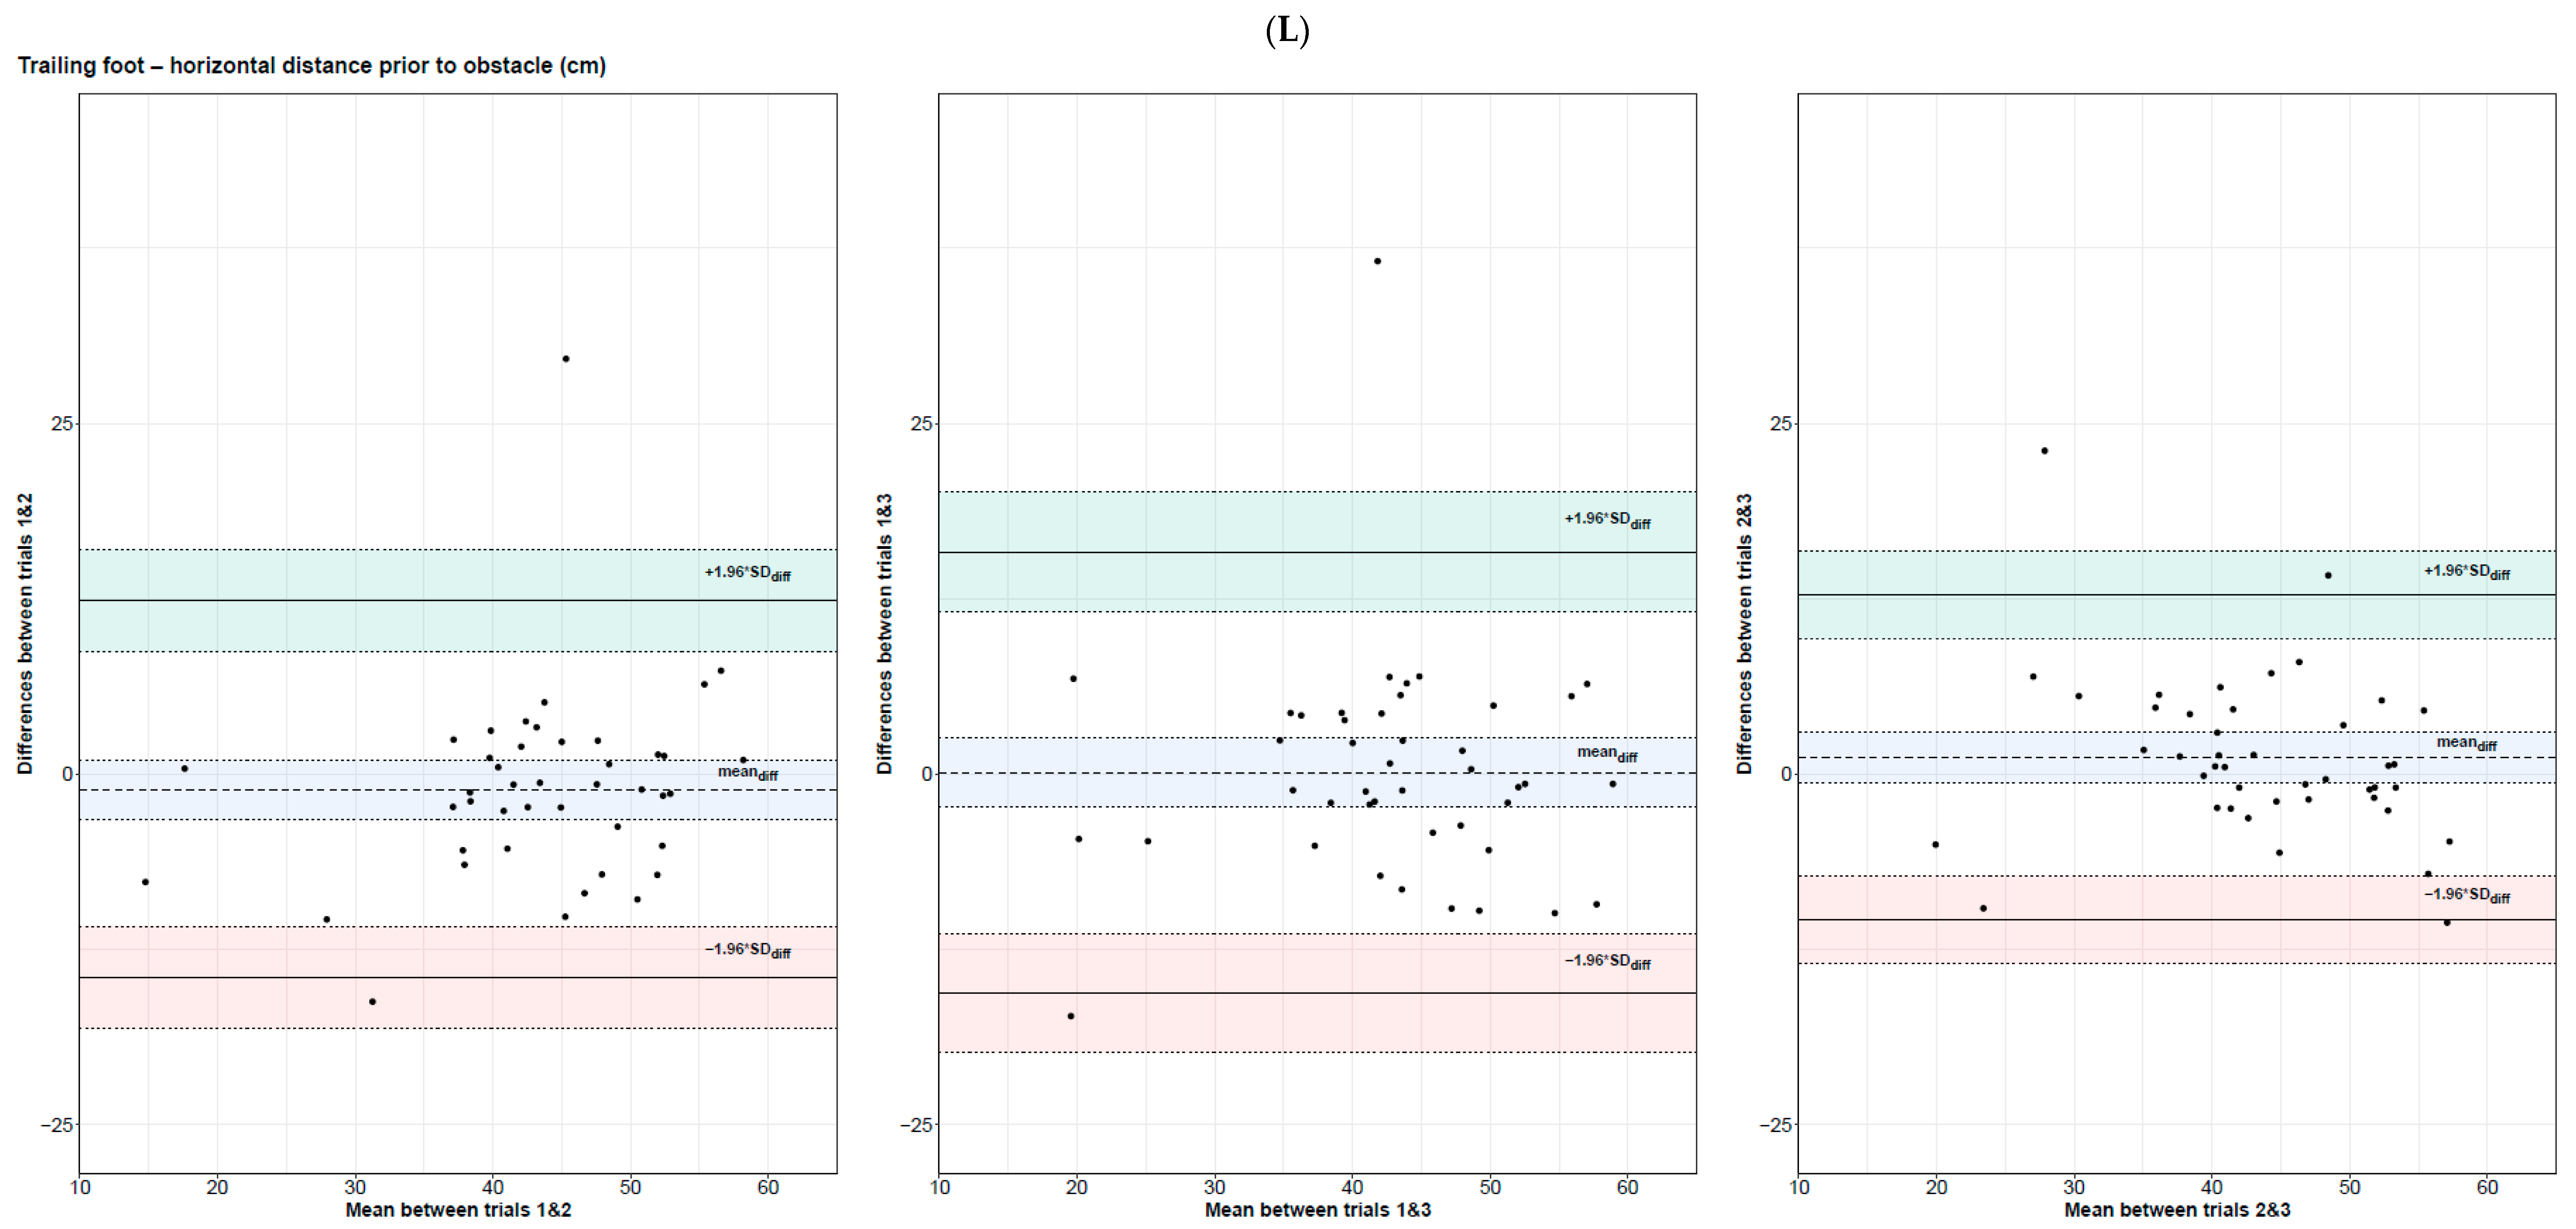
Table 3 presents the CCC, LOA, Shieh exact test agreement, and SWC. Figure 2 presents the Bland–Altman of each gait and obstacle-crossing parameter.

4. Discussion

The aim of this study was to evaluate the intra-session relative and absolute reliability of obstacle-crossing parameters during overground walking in young adults and to determine the number of trials required to ensure reliable assessment.
Overall, our results showed for the first time that spatial–temporal gait parameters and clearance parameters were reliable, except for the step width (between T1–T2 and T1–T3) and double support time (between T1–T2) during the crossing phase. In addition, for most spatial–temporal gait and clearance parameters, the reliability and agreement were better when pooling trials 2 and 3 than when the first trial was used for comparison. This suggests that when conducting an obstacle-crossing task in young adults—under the specific experimental conditions used in the present study, at least—a first practice trial should be performed before the experimental trials to enhance the reliability of the parameters studied, or that the first experimental trial should be discarded from data analysis.

4.1. Intra-Session Reliability during Obstacle-Crossing

4.1.1. Approaching Phase

Relative reliability for all spatial–temporal gait parameters measured in young adults during the approaching phase was always either substantial or almost perfect. Regarding absolute reliability, all parameters except step width (SEM% ≥ 10%) exhibited good absolute reliability in all trial comparisons, and MDC% was low or acceptable for all gait parameters in all trial comparisons. Comparisons between trials showed that participants had a higher step width in the last two trials compared to the first one. Perhaps after the first trial, the strategy chosen was to increase their pre-crossing base of support after the trial to ensure more stability before the crossing phase. Regarding agreements between trials, results were considered good for all spatial–temporal gait parameters in all trial comparisons. Hence, young male adults had almost identical gait patterns during all trials during the approaching phase. In addition, for all spatial–temporal gait parameters, relative and absolute reliabilities and agreement between trials were better when using the mean of the second and third trials, compared to the first and second trials, to the first and third trials, or to the three trials. This could suggest that participants adapted a more stable/consistent gait pattern after the execution of the first trial, which could have been used as a learning/warming-up trial. These results are similar to those recently reported in healthy adults during unobstructed level walking [2]. In that study, 20 healthy participants performed three trials of a 10-m walking test, and spatial–temporal gait parameters were computed using inertial motor units (Physilog® 5, 200Hz GaitUp, Lausanne, Switzerland). Results showed that speed, double support, and stride length had almost perfect relative reliability (0.81 < ICC(2.1)). In addition, absolute reliability was good, with low SEM% (1.74% ≤ SEM% ≤ 6.58% in all trial comparisons) and low MDC% (4.82% ≤ MDC% ≤ 18.25% for all trial comparisons) for these three spatial–temporal gait parameters [2].

4.1.2. Crossing Phase

Contrary to what was observed for the approaching phase, not all spatial–temporal gait parameters were found to have substantial or almost perfect relative reliability, good absolute reliability, or good agreement between trials.
The relative reliability of step length, duration, and velocity was substantial to almost perfect regardless of the trial comparisons considered. Conversely, step width and double support time showed slight to moderate relative reliability (0.19 ≤ ICC(2.1) ≤ 0.47), with the worst results when the first trial was included. Regarding absolute reliability, both step width and double support time showed poor reliability in all trial comparisons, except the MDC% of double support time, which was acceptable for the T2–T3 comparison (MDC% = 34.4). In addition, agreements between trials were poor for step width (T1–T2 and T1–T3) and double support time (T1–T2), compared to the other spatial–temporal parameters (moderate or good) between each pair of trials. Comparison between trials showed no differences in step width or double support time during the crossing phase (p < 0.05). One hypothesis is that the lower reliability found for step width and double support time parameters during the crossing phase compared to the approaching phase could be explained by the more unusual nature of this step compared to the approaching phase (i.e., walking on flat ground) and due to the higher demand of the task in neuromuscular [62] and cognitive resources [63] than flat ground walking. Also, medial lateral dynamic balance during the crossing phase might be harder to maintain, so it is difficult for the participants to maintain a stable behaviour for crossing step width. However, it is worth noting that agreements between trials were better for all spatial–temporal gait parameters, with the exception of step duration (for which the best value was obtained for T1–T3) when pooling values from the second and third trials.

4.1.3. Obstacle Clearance

Relative reliability for all clearance parameters measured in young adults was either moderate to almost perfect (0.51 ≤ ICC(2.1) ≤ 0.89), and the reliability was enhanced from substantial to almost perfect when pooling the second and third trials (0.63 ≤ ICC(2.1) ≤ 0.89).
However, the absolute reliability was low for four clearance parameters (leading and trailing foot horizontal distance after obstacle, trailing foot horizontal distance after obstacle, and leading foot toe clearance) for T1–T2, T1–T3, and T1–T2–T3, and three clearance parameters for T2–T3 (leading and trailing foot toe clearance and leading foot horizontal distance after obstacle). In addition, MDC% was high (i.e., 40% ≤ MDC%) for two clearance parameters for T1–T2 (leading and trailing foot clearance), T2–T3 (leading foot toe clearance and horizontal distance after obstacle), and T1–T2–T3 (leading foot toe clearance and horizontal distance after obstacle), and for three clearance parameters for T1–T3 (leading and trailing foot toe clearance and leading foot horizontal distance after obstacle).
On the one hand, in general, clearance parameters were less reliable than spatial–temporal gait parameters measured during the approaching and crossing phases (with the exception of stride width and double support time during the crossing phase). As mentioned, the more unusual nature of this step compared to flat ground walking might have played a role in individuals’ behaviour and clearance strategy. In addition, it is possible that the higher cognitive load and precise motor control during obstacle-crossing compared to unobstructed walking [63] may contribute to the reduced reliability of clearance parameters. On the other hand, similar to what was observed for spatial–temporal gait parameters computed before and after the obstacle, for most obstacle clearance parameters, both relative and absolute reliabilities were better when using the mean of the second and third trials, compared to the first and second trials, to the first and third trials, or to the three trials. This reinforces the idea of a learning/warming-up effect after the first trial for individuals when they perform an obstacle-crossing task. However, comparisons between trials showed that trailing foot horizontal distance after the obstacle was higher in the third trial compared to the first and second. Together, these results suggest that, contrary to spatial–temporal parameters, individuals might need more than three trials to have reliable behaviour. Regarding agreements between trials, moderate to good agreement was found for all parameters between each pair of trials. Similarly to relative and absolute reliabilities, the best results were found for four out of six clearance parameters (leading and trailing toe clearance and distance prior to obstacle) when pooling the second and third trials. However, agreements between trials were better for T1–T2 for both leading and trailing foot distances after the obstacle.
As shown by measures of agreement (CCC and Bland–Altman, see Figure 2), there should not be any systematic bias in measurements since no obvious relation existed between the difference and the mean of any pair of two trials. In addition, the LOA were relatively small, with few to no outliers depending on the obstacle clearance parameter considered.
Having high absolute reliability (10% < SEM%) indicates that there were intra-individual variabilities between trials.

4.2. Study Limitations, Strengths, and Perspectives

To the authors’ best knowledge, this is the first study that assessed the reliability, both relative and absolute, and agreements between trials of spatial–temporal gait parameters and obstacle clearance parameters in young adults. It should be noted that although previous studies have reported either the absolute or relative reliability of these parameters (e.g., [64,65,66]), none of them addressed our specific research questions. Indeed, we aimed to evaluate the intra-session relative and absolute reliability of obstacle-crossing parameters during overground walking in young healthy adults, and to determine the number of trials required to ensure reliable assessment. Contrary to us, the study from Punt et al. (2017) assessed virtual obstacle-crossing task during treadmill walking in stroke survivors [64], while Grinberg et al. (2021) did not assess obstacle-crossing parameters during overground walking [66], and Said et al. (2009) did not involve young healthy adults [65]. In addition, the sample size of the present study is relatively high (n = 43), compared to previously conducted gait reliability studies [1,2,3,5,8,11,38]. At this point, it is important to mention that, fully in line with the scientific roadmap we have set up to assess the intra-session reliability of the 10 m walk test [2], we focused on young healthy adults as a first step to provide normative reference values for a young healthy population (e.g., see [67,68,69]). Naturally, the reliability must now be further tested in other populations with different socio-demographic, anthropometric, clinical, and lifestyle characteristics, including individuals who are overweight or obese (e.g., see [70] for a review), children, adolescents, middle age, and the elderly (e.g., see [71] for a review), and pathological populations (e.g., see [72,73,74] for reviews) who may also present different levels of fatigue (e.g., see [75] for a review) or physical fitness (e.g., see [76] for a review).
Finally, the present findings highlighted that most spatial–temporal and obstacle clearance parameters were reliable across the three trials and that better relative and absolute reliabilities, as well as agreements between trials, were found when pooling the second and third trials. Nevertheless, several limitations warrant further consideration and caution regarding the interpretation of the results.
The reliability and agreement were assessed during a single experimental session, which prevented us from studying the inter-session reliability. In addition, only young healthy males aged between 20–40 years old were included, and only one experimental condition (15 cm height obstacle; self-selected walking speed; single-task condition) was assessed. In other words, strictly speaking, our conclusion applies only to the population tested and the experimental conditions used in the present study. These experimental conditions could be considered as relatively mild and easy in that the task consisted of crossing a physical obstacle 15 centimetres high at a comfortable speed without any other particular constraint. Further works are thus needed to generalize them in more realistic conditions. For instance, it could be interesting to replicate this reliability study while walking over different and challenging obstacle paradigms that may predispose the participants to an increased risk of foot contact with the obstacle [77,78,79] and/or with individuals with balance and gait disorders for whom the consequences of imbalance and tripping over obstacles could be more dramatic [80,81]. Hence, these specific issues deserve investigations, which are included in our immediate plans. Another potential future investigation would be to perform more than three trials of obstacle-crossing. This would probably enhance the reliability of all parameters, especially the clearances with the obstacle. This might enable us to determine the minimum number of trials to be carried out, and the number of trials from which data analysis should begin in order to obtain reliable and valid data.

5. Conclusions

Most spatial–temporal gait parameters and obstacle clearance parameters computed using a three-dimensional motion analysis system in young adults during an obstacle-crossing task are reliable using the average of three trials. Our findings further suggest using the mean of the second and third trials to ensure the best relative and absolute reliabilities of most obstacle-crossing parameters. However, our findings only apply to the population tested and to the relatively mild and easy experimental conditions used in the present study. Further works are thus needed to generalize them in more realistic conditions and in other populations.

Supplementary Materials

The following supporting information can be downloaded at: https://www.mdpi.com/article/10.3390/s24113387/s1. S1. List of R packages used for statistical analysis [82,83,84,85,86,87].

Author Contributions

Conceptualization: M.C., F.A.B., P.P. and N.V.; formal analysis: M.C., F.A.B., P.P. and N.V.; funding acquisition: F.A.B. and N.V.; methodology: M.C., F.A.B., P.P. and N.V.; project administration: F.A.B. and N.V.; supervision: F.A.B. and N.V.; visualization: P.P.; writing (original draft): M.C.; writing (review and editing): M.C., F.A.B., P.P. and N.V. All authors have read and agreed to the published version of the manuscript.

Funding

This work was supported by the French National Research Agency (ANR) in the framework of the Investissements d’avenir program (ANR-10-AIRT-05 and ANR-15-IDEX-02), the MIAI @ Grenoble Alpes (ANR-19-P3IA-0003), the São Paulo Research Foundation (FAPESP) (grant #18/18078-0), the National Council for Scientific and Technological Development—CNPq, and in part by the Brazil (CAPES)—Finance Code 001.

Institutional Review Board Statement

This study was approved by the University Institution Review Board (authorization number: CAAE#99191318.0.0000.5398). The study and all methods were performed in accordance with the Declaration of Helsinki.

Informed Consent Statement

Informed consent was obtained from all subjects involved in the study.

Data Availability Statement

The datasets used and/or analysed during the current study are available from the corresponding author on reasonable request.

Acknowledgments

This work is part of the Ph.D. thesis of the first author (M.C.) at Université Grenoble Alpes, France, and São Paulo State University, Bauru, Brazil. The sponsors were not involved in the review or approval of the manuscript for publication. This work also forms part of a broader translational and interdisciplinary research program GaitAlps (N.V.).

Conflicts of Interest

The authors declare no conflicts of interest.

References

  1. Wilken, J.M.; Rodriguez, K.M.; Brawner, M.; Darter, B.J. Reliability and Minimal Detectible Change Values for Gait Kinematics and Kinetics in Healthy Adults. Gait Posture 2012, 35, 301–307. [Google Scholar] [CrossRef]
  2. Soulard, J.; Vaillant, J.; Balaguier, R.; Vuillerme, N. Spatio-Temporal Gait Parameters Obtained from Foot-Worn Inertial Sensors Are Reliable in Healthy Adults in Single- and Dual-Task Conditions. Sci. Rep. 2021, 11, 10229. [Google Scholar] [CrossRef] [PubMed]
  3. Couto, A.G.B.; Vaz, M.A.P.; Pinho, L.; Félix, J.; Moreira, J.; Pinho, F.; Mesquita, I.A.; Montes, A.M.; Crasto, C.; Sousa, A.S.P. Repeatability and Temporal Consistency of Lower Limb Biomechanical Variables Expressing Interlimb Coordination during the Double-Support Phase in People with and without Stroke Sequelae. Sensors 2023, 23, 2526. [Google Scholar] [CrossRef] [PubMed]
  4. Giannouli, E.; Kim, E.K.; Fu, C.; Weibel, R.; Sofios, A.; Infanger, D.; Portegijs, E.; Rantanen, T.; Huang, H.; Schmidt-Trucksäss, A.; et al. Psychometric Properties of the MOBITEC-GP Mobile Application for Real-Life Mobility Assessment in Older Adults. Geriatr. Nurs. 2022, 48, 273–279. [Google Scholar] [CrossRef]
  5. Olsen, S.; Rashid, U.; Allerby, C.; Brown, E.; Leyser, M.; McDonnell, G.; Alder, G.; Barbado, D.; Shaikh, N.; Lord, S.; et al. Smartphone-Based Gait and Balance Accelerometry Is Sensitive to Age and Correlates with Clinical and Kinematic Data. Gait Posture 2023, 100, 57–64. [Google Scholar] [CrossRef] [PubMed]
  6. Yavuzer, G.; Öken, Ö.; Elhan, A.; Stam, H.J. Repeatability of Lower Limb Three-Dimensional Kinematics in Patients with Stroke. Gait Posture 2008, 27, 31–35. [Google Scholar] [CrossRef] [PubMed]
  7. Lefeber, N.; Degelaen, M.; Truyers, C.; Safin, I.; Beckwee, D. Validity and Reproducibility of Inertial Physilog Sensors for Spatiotemporal Gait Analysis in Patients with Stroke. IEEE Trans. Neural Syst. Rehabil. Eng. 2019, 27, 1865–1874. [Google Scholar] [CrossRef] [PubMed]
  8. Wedege, P.; Steffen, K.; Strøm, V.; Opheim, A.I. Reliability of Three-Dimensional Kinematic Gait Data in Adults with Spinal Cord Injury. J. Rehabil. Assist. Technol. Eng. 2017, 4, 205566831772999. [Google Scholar] [CrossRef]
  9. Fransen, M.; Crosbie, J.; Edmonds, J. Reliability of Gait Measurements in People with Osteoarthritis of the Knee. Phys. Ther. 1997, 77, 944–953. [Google Scholar] [CrossRef]
  10. Hansen, C.; Ortlieb, C.; Romijnders, R.; Warmerdam, E.; Welzel, J.; Geritz, J.; Maetzler, W. Reliability of IMU-Derived Temporal Gait Parameters in Neurological Diseases. Sensors 2022, 22, 2304. [Google Scholar] [CrossRef]
  11. Allet, L.; Armand, S.; de Bie, R.A.; Golay, A.; Monnin, D.; Aminian, K.; de Bruin, E.D. Reliability of Diabetic Patients’ Gait Parameters in a Challenging Environment. Gait Posture 2008, 28, 680–686. [Google Scholar] [CrossRef] [PubMed]
  12. Brach, J.S.; Perera, S.; Studenski, S.; Newman, A.B. The Reliability and Validity of Measures of Gait Variability in Community-Dwelling Older Adults. Arch. Phys. Med. Rehabil. 2008, 89, 2293–2296. [Google Scholar] [CrossRef]
  13. Berard, J.R.; Vallis, L.A. Characteristics of Single and Double Obstacle Avoidance Strategies: A Comparison between Adults and Children. Exp. Brain Res. 2006, 175, 21–31. [Google Scholar] [CrossRef] [PubMed]
  14. Yoshimoto, K.; Mani, H.; Hirose, N.; Kurogi, T.; Aiko, T.; Shinya, M. Dynamic Stability during Level Walking and Obstacle Crossing in Children Aged 2–5 Years Estimated by Marker-Less Motion Capture. Front. Sports Act. Living 2023, 5, 1109581. [Google Scholar] [CrossRef] [PubMed]
  15. Pavol, M.J.; Owings, T.M.; Foley, K.T.; Grabiner, M.D. Mechanisms Leading to a Fall from an Induced Trip in Healthy Older Adults. J. Gerontol. A Biol. Sci. Med. Sci. 2001, 56, M428–M437. [Google Scholar] [CrossRef]
  16. Chen, H.C.; Ashton-Miller, J.A.; Alexander, N.B.; Schultz, A.B. Stepping over Obstacles: Gait Patterns of Healthy Young and Old Adults. J. Gerontol. 1991, 46, M196–M203. [Google Scholar] [CrossRef]
  17. Gill, S.V.; Hung, Y.C. Effects of Overweight and Obese Body Mass on Motor Planning and Motor Skills during Obstacle Crossing in Children. Res. Dev. Disabil. 2014, 35, 46–53. [Google Scholar] [CrossRef]
  18. Galna, B.; Murphy, A.T.; Morris, M.E. Obstacle Crossing in Parkinson’s Disease: Mediolateral Sway of the Centre of Mass during Level-Ground Walking and Obstacle Crossing. Gait Posture 2013, 38, 790–794. [Google Scholar] [CrossRef]
  19. dos Santos, P.C.R.; Barbieri, F.A.; Orcioli-Silva, D.; Beretta, V.S.; Hortobágyi, T.; Gobbi, L.T.B. Being Physically Active Minimizes the Effects of Leg Muscle Fatigue on Obstacle Negotiation in People with Parkinson’s Disease. J. Biomech. 2021, 124, 110568. [Google Scholar] [CrossRef]
  20. Penedo, T.; Polastri, P.F.; Rodrigues, S.T.; Simieli, L.; Baptista, A.M.; Moretto, G.F.; Imaizumi, L.F.I.; Santinelli, F.B.; Barbieri, F.A. Influence of Obstacle Color on Locomotor and Gaze Behaviors during Obstacle Avoidance in People with Parkinson’s Disease. Exp. Brain Res. 2018, 236, 3319–3325. [Google Scholar] [CrossRef]
  21. Simieli, L.; Gobbi, L.T.B.; Orcioli-Silva, D.; Beretta, V.S.; Santos, P.C.R.; Baptista, A.M.; Barbieri, F.A. The Variability of the Steps Preceding Obstacle Avoidance (Approach Phase) Is Dependent on the Height of the Obstacle in People with Parkinson’s Disease. PLoS ONE 2017, 12, e0184134. [Google Scholar] [CrossRef]
  22. Santinelli, F.B.; Sebastião, E.; Kuroda, M.H.; Moreno, V.C.; Pilon, J.; Vieira, L.H.P.; Barbieri, F.A. Cortical Activity and Gait Parameter Characteristics in People with Multiple Sclerosis during Unobstructed Gait and Obstacle Avoidance. Gait Posture 2021, 86, 226–232. [Google Scholar] [CrossRef]
  23. Chou, L.S.; Kaufman, K.R.; Walker-Rabatin, A.E.; Brey, R.H.; Basford, J.R. Dynamic Instability during Obstacle Crossing Following Traumatic Brain Injury. Gait Posture 2004, 20, 245–254. [Google Scholar] [CrossRef] [PubMed]
  24. Den Otter, A.R.; Geurts, A.C.H.; De Haart, M.; Mulder, T.; Duysens, J. Step Characteristics during Obstacle Avoidance in Hemiplegic Stroke. Exp. Brain Res. 2005, 161, 180–192. [Google Scholar] [CrossRef]
  25. Said, C.M.; Galea, M.; Lythgo, N. Obstacle Crossing Following Stroke Improves over One Month When the Unaffected Limb Leads, but Not When the Affected Limb Leads. Gait Posture 2014, 39, 213–217. [Google Scholar] [CrossRef] [PubMed]
  26. Scalvini, F.; Bordeau, C.; Ambard, M.; Migniot, C.; Vergnaud, M.; Dubois, J. UB-VisioGeoloc: An Image Sequences Dataset of Pedestrian Navigation Including Geolocalised-Inertial Information and Spatial Sound Rendering of the Urban Environment’s Obstacles. Data Brief. 2024, 53, 110088. [Google Scholar] [CrossRef]
  27. Soma, M.; Nakae, H.; Abiko, T.; Shimamura, R.; Uematsu, H.; Kawama, K. Influence of a Dual Task While Stepping Over an Obstacle in the Fall-Experienced Elderly People. J. Phys. Ther. Sci. 2011, 23, 369–372. [Google Scholar] [CrossRef]
  28. Weerdesteyn, V.; Nienhuis, B.; Duysens, J. Advancing Age Progressively Affects Obstacle Avoidance Skills in the Elderly. Hum. Mov. Sci. 2005, 24, 865–880. [Google Scholar] [CrossRef] [PubMed]
  29. Gök, H.; Ergin, S.; Yavuzer, G. Reliability of Gait Measurements in Normal Subjects. J. Rheumatol. Med. Rehabil. 2002, 13, 76–80. [Google Scholar]
  30. Boldo, M.; Di Marco, R.; Martini, E.; Nardon, M.; Bertucco, M.; Bombieri, N. On the Reliability of Single-Camera Markerless Systems for Overground Gait Monitoring. Comput. Biol. Med. 2024, 171, 108101. [Google Scholar] [CrossRef]
  31. van Bloemendaal, M.; Beelen, A.; Kleissen, R.F.M.; Geurts, A.C.H.; Nollet, F.; Bus, S.A. Concurrent Validity and Reliability of a Low-Cost Gait Analysis System for Assessment of Spatiotemporal Gait Parameters. J. Rehabil. Med. 2019, 51, 456–463. [Google Scholar] [CrossRef] [PubMed]
  32. Widhalm, K.; Durstberger, S.; Greisberger, A.; Wolf, B.; Putz, P. Validity of Assessing Level Walking with the 2D Motion Analysis Software TEMPLO and Reliability of 3D Marker Application. Sci. Rep. 2024, 14, 1427. [Google Scholar] [CrossRef]
  33. Girard, O.; Brocherie, F.; Morin, J.B.; Millet, G.P. Intrasession and Intersession Reliability of Running Mechanics During Treadmill Sprints. Int. J. Sports Physiol. Perform. 2016, 11, 432–439. [Google Scholar] [CrossRef] [PubMed]
  34. Pinsault, N.; Vuillerme, N. Test-Retest Reliability of Centre of Foot Pressure Measures to Assess Postural Control during Unperturbed Stance. Med. Eng. Phys. 2009, 31, 276–286. [Google Scholar] [CrossRef]
  35. Pinsault, N.; Fleury, A.; Virone, G.; Bouvier, B.; Vaillant, J.; Vuillerme, N. Test-Retest Reliability of Cervicocephalic Relocation Test to Neutral Head Position. Physiother. Theory Pract. 2008, 24, 380–391. [Google Scholar] [CrossRef]
  36. Balaguier, R.; Madeleine, P.; Vuillerme, N. Is One Trial Sufficient to Obtain Excellent Pressure Pain Threshold Reliability in the Low Back of Asymptomatic Individuals? A Test-Retest Study. PLoS ONE 2016, 11, e0160866. [Google Scholar] [CrossRef] [PubMed]
  37. Balaguier, R.; Madeleine, P.; Vuillerme, N. Intra-Session Absolute and Relative Reliability of Pressure Pain Thresholds in the Low Back Region of Vine-Workers: Effect of the Number of Trials. BMC Musculoskelet. Disord. 2016, 17, 350. [Google Scholar] [CrossRef] [PubMed]
  38. Soulard, J.; Vaillant, J.; Balaguier, R.; Baillet, A.; Gaudin, P.; Vuillerme, N. Foot-Worn Inertial Sensors Are Reliable to Assess Spatiotemporal Gait Parameters in Axial Spondyloarthritis under Single and Dual Task Walking in Axial Spondyloarthritis. Sensors 2020, 20, 6453. [Google Scholar] [CrossRef] [PubMed]
  39. Linek, P.; Sikora, D.; Wolny, T.; Saulicz, E. Reliability and Number of Trials of Y Balance Test in Adolescent Athletes. Musculoskelet. Sci. Pract. 2017, 31, 72–75. [Google Scholar] [CrossRef]
  40. Karatrantou, K.; Xagorari, A.; Vasilopoulou, T.; Gerodimos, V. Does the Number of Trials Affect the Reliability of Handgrip Strength Measurement in Individuals with Intellectual Disabilities? Hand Surg. Rehabil. 2020, 39, 223–228. [Google Scholar] [CrossRef]
  41. Pineda, R.C.; Krampe, R.T.; Vanlandewijck, Y.; Van Biesen, D. Reliability of Center of Pressure Excursion as a Measure of Postural Control in Bipedal Stance of Individuals with Intellectual Disability: A Pilot Study. PLoS ONE 2020, 15, e0240702. [Google Scholar] [CrossRef]
  42. Severin, A.C.; Barnes, S.G.; Tackett, S.A.; Barnes, C.L.; Mannen, E.M. The Required Number of Trials for Biomechanical Analysis of a Golf Swing. Sports Biomech. 2021, 20, 238–246. [Google Scholar] [CrossRef] [PubMed]
  43. Seuthe, J.; D’Cruz, N.; Ginis, P.; Blöbaum, R.; Weisser, B.; Deuschl, G.; Nieuwboer, A.; Schlenstedt, C. How Many Gait Initiation Trials Are Necessary to Reliably Detect Anticipatory Postural Adjustments and First Step Characteristics in Healthy Elderly and People with Parkinson’s Disease? Gait Posture 2021, 88, 126–131. [Google Scholar] [CrossRef]
  44. Silva, A.F.; Nobari, H.; Badicu, G.; Ceylan, H.I.; Lima, R.; Lagoa, M.J.; Luz, C.; Clemente, F.M. Reliability Levels of Motor Competence in Youth Athletes. BMC Pediatr. 2022, 22, 430. [Google Scholar] [CrossRef] [PubMed]
  45. Coleman, J.L.; Huynh, M.; Middleton, K.J. Number of Trials Necessary to Achieve a Representative Performance of Accuracy and Timing during Combat Shooting. Scand. J. Med. Sci. Sports 2023, 33, 2039–2045. [Google Scholar] [CrossRef] [PubMed]
  46. Villarrasa-Sapiña, I.; Ortega-Benavent, N.; Monfort-Torres, G.; Ramon-Llin, J.; García-Massó, X. Test-Retest Reliability of Task Performance for Golf Swings of Medium- to High-Handicap Players. Sensors 2022, 22, 9069. [Google Scholar] [CrossRef] [PubMed]
  47. García-Massó, X.; Villarrasa-Sapiña, I.; Ortega-Benavent, N.; Montalt-García, S.; Toca-Herrera, J.L. Test-Retest Reliability of Putting-Related Variables in Medium-to-High Handicap Golf Players. Sci. Rep. 2024, 14, 11516. [Google Scholar] [CrossRef]
  48. Monaghan, K.; Delahunt, E.; Caulfield, B. Increasing the Number of Gait Trial Recordings Maximises Intra-Rater Reliability of the CODA Motion Analysis System. Gait Posture 2007, 25, 303–315. [Google Scholar] [CrossRef] [PubMed]
  49. Santinelli, F.B.; Sebastião, E.; Simieli, L.; Antunes, B.M.; Vieira, L.H.P.; Kalron, A.; Barbieri, F.A. Is BDNF Related to Spatial-Temporal Gait Parameters in People with Multiple Sclerosis? An Observational Study. Mult. Scler. Relat. Disord. 2022, 66, 104064. [Google Scholar] [CrossRef]
  50. Barbieri, F.A.; dos Santos, P.C.R.; Simieli, L.; Orcioli-Silva, D.; van Dieën, J.H.; Gobbi, L.T.B. Interactions of Age and Leg Muscle Fatigue on Unobstructed Walking and Obstacle Crossing. Gait Posture 2014, 39, 985–990. [Google Scholar] [CrossRef]
  51. Landis, J.; Koch, G. The Measurement of Observer Agreement for Categorical Data. Biometrics 1977, 33, 159–174. [Google Scholar] [CrossRef] [PubMed]
  52. Harvill, L.M. Standard Error of Measurement. Educ. Meas. Issues Pract. 1991, 10, 33–41. [Google Scholar] [CrossRef]
  53. Walton, D.; Macdermid, J.; Nielson, W.; Teasell, R.; Chiasson, M.; Brown, L. Reliability, Standard Error, and Minimum Detectable Change of Clinical Pressure Pain Threshold Testing in People with and without Acute Neck Pain. J. Orthop. Sports Phys. Ther. 2011, 41, 644–650. [Google Scholar] [CrossRef] [PubMed]
  54. Weir, J.P. Quantifying Test-Retest Reliability Using the Intraclass Correlation Coefficient and the SEM. J. Strength. Cond. Res. 2005, 19, 231–240. [Google Scholar] [CrossRef] [PubMed]
  55. Bourke, A.K.; Scotland, A.; Lipsmeier, F.; Gossens, C.; Lindemann, M. Gait Characteristics Harvested During a Smartphone-Based Self-Administered 2-Minute Walk Test in People with Multiple Sclerosis: Test-Retest Reliability and Minimum Detectable Change. Sensors 2020, 20, 5906. [Google Scholar] [CrossRef]
  56. Huang, S.L.; Hsieh, C.L.; Wu, R.M.; Lu, W.S. Test-Retest Reliability and Minimal Detectable Change of the Beck Depression Inventory and the Taiwan Geriatric Depression Scale in Patients with Parkinson’s Disease. PLoS ONE 2017, 12, e0184823. [Google Scholar] [CrossRef]
  57. Feng, D.; Baumgartner, R.; Svetnik, V. A Short Note on Jackknifing the Concordance Correlation Coefficient. Stat. Med. 2014, 33, 514–516. [Google Scholar] [CrossRef] [PubMed]
  58. Gillinov, S.; Etiwy, M.; Wang, R.; Blackburn, G.; Phelan, D.; Gillinov, A.M.; Houghtaling, P.; Javadikasgari, H.; Desai, M.Y. Variable Accuracy of Wearable Heart Rate Monitors during Aerobic Exercise. Med. Sci. Sports Exerc. 2017, 49, 1697–1703. [Google Scholar] [CrossRef]
  59. Shieh, G. Assessing Individual Equivalence in Parallel Group and Crossover Designs: Exact Test and Sample Size Procedures. PLoS ONE 2022, 17, e0269128. [Google Scholar] [CrossRef]
  60. Quinn, C.; Haber, M.J.; Pan, Y. Use of the Concordance Correlation Coefficient When Examining Agreement in Dyadic Research. Nurs. Res. 2009, 58, 368–373. [Google Scholar] [CrossRef]
  61. Buchheit, M. Magnitudes Matter More than Beetroot Juice. Sport Perform. Sci. Rep. 2018, 1, 1–3. [Google Scholar]
  62. MacLellan, M.J.; McFadyen, B.J. Proximal Lower Limb Muscle Energetics and the Adaptation of Segment Elevation Angle Phasing for Obstacle Avoidance. Gait Posture 2013, 37, 274–279. [Google Scholar] [CrossRef] [PubMed]
  63. Billington, J.; Wilkie, R.M.; Wann, J.P. Obstacle Avoidance and Smooth Trajectory Control: Neural Areas Highlighted during Improved Locomotor Performance. Front. Behav. Neurosci. 2013, 7, 9. [Google Scholar] [CrossRef] [PubMed]
  64. Punt, M.; Bruijn, S.M.; Wittink, H.; van de Port, I.G.; Wubbels, G.; van Dieën, J.H. Virtual Obstacle Crossing: Reliability and Differences in Stroke Survivors Who Prospectively Experienced Falls or No Falls. Gait Posture 2017, 58, 533–538. [Google Scholar] [CrossRef]
  65. Said, C.M.; Galea, M.; Lythgo, N. Obstacle Crossing Performance Does Not Differ between the First and Subsequent Attempts in People with Stroke. Gait Posture 2009, 30, 455–458. [Google Scholar] [CrossRef] [PubMed]
  66. Grinberg, A.; Strong, A.; Buck, S.; Selling, J.; Häger, C.K. An Obstacle Clearance Test for Evaluating Sensorimotor Control after Anterior Cruciate Ligament Injury: A Kinematic Analysis. J. Orthop. Res. 2022, 40, 105–116. [Google Scholar] [CrossRef] [PubMed]
  67. Wu, A.R.; Simpson, C.S.; van Asseldonk, E.H.F.; van der Kooij, H.; Ijspeert, A.J. Mechanics of Very Slow Human Walking. Sci. Rep. 2019, 9, 18079. [Google Scholar] [CrossRef] [PubMed]
  68. Lordall, J.; Bruno, P.; Ryan, N. Assessment of Diurnal Variation of Stride Time Variability during Continuous, Overground Walking in Healthy Young Adults. Gait Posture 2020, 79, 108–110. [Google Scholar] [CrossRef] [PubMed]
  69. Ryan, N.S.; Bruno, P.A.; Barden, J.M. Test-Retest Reliability and the Effects of Walking Speed on Stride Time Variability During Continuous, Overground Walking in Healthy Young Adults. J. Appl. Biomech. 2021, 37, 102–108. [Google Scholar] [CrossRef]
  70. Chardon, M.; Barbieri, F.A.; Penedo, T.; Santos, P.C.R.; Vuillerme, N. A Systematic Review of the Influence of Overweight and Obesity across the Lifespan on Obstacle Crossing during Walking. Int. J. Environ. Res. Public. Health 2023, 20, 5931. [Google Scholar] [CrossRef]
  71. Galna, B.; Peters, A.; Murphy, A.T.; Morris, M.E. Obstacle Crossing Deficits in Older Adults: A Systematic Review. Gait Posture 2009, 30, 270–275. [Google Scholar] [CrossRef] [PubMed]
  72. Muroi, D.; Ohtera, S.; Kataoka, Y.; Banno, M.; Tsujimoto, Y.; Tsujimoto, H.; Higuchi, T. Obstacle Avoidance Training for Individuals with Stroke: A Systematic Review and Meta-Analysis. BMJ Open 2019, 9, e028873. [Google Scholar] [CrossRef] [PubMed]
  73. Cloutier, M.; Delucia, P.R. Topical Review: Impact of Central Vision Loss on Navigation and Obstacle Avoidance While Walking. Optom. Vis. Sci. 2022, 99, 890–899. [Google Scholar] [CrossRef] [PubMed]
  74. Caparrós-Manosalva, C.; Espinoza, J.; Caballero, P.M.; da Cunha, M.J.; Yang, F.; Galen, S.; Pagnussat, A.S. Movement Strategies during Obstacle Crossing in People with Parkinson Disease: A Systematic Review with Meta-Analysis. PM R 2024, 1–14. [Google Scholar] [CrossRef] [PubMed]
  75. Chardon, M.; Barbieri, F.A.; Penedo, T.; Santos, P.C.R.; Vuillerme, N. The Effects of Experimentally-Induced Fatigue on Gait Parameters during Obstacle Crossing: A Systematic Review. Neurosci. Biobehav. Rev. 2022, 142, 104854. [Google Scholar] [CrossRef] [PubMed]
  76. Guadagnin, E.C.; da Rocha, E.S.; Duysens, J.; Carpes, F.P. Does Physical Exercise Improve Obstacle Negotiation in the Elderly? A Systematic Review. Arch. Gerontol. Geriatr. 2016, 64, 138–145. [Google Scholar] [CrossRef]
  77. Muir, B.C.; Haddad, J.M.; Heijnen, M.J.H.; Rietdyk, S. Proactive Gait Strategies to Mitigate Risk of Obstacle Contact Are More Prevalent with Advancing Age. Gait Posture 2015, 41, 233–239. [Google Scholar] [CrossRef] [PubMed]
  78. Chen, S.H.; Lo, O.Y.; Kay, T.; Chou, L.S. Concurrent Phone Texting Alters Crossing Behavior and Induces Gait Imbalance during Obstacle Crossing. Gait Posture 2018, 62, 422–425. [Google Scholar] [CrossRef] [PubMed]
  79. Raffegeau, T.E.; Brinkerhoff, S.A.; Kellaher, G.K.; Baudendistel, S.; Terza, M.J.; Roper, J.A.; Hass, C.J. Changes to Margins of Stability from Walking to Obstacle Crossing in Older Adults While Walking Fast and with a Dual-Task. Exp. Gerontol. 2022, 161, 111710. [Google Scholar] [CrossRef]
  80. Fingerhut, L.A.; Cox, C.; Warner, M. International Comparative Analysis of Injury Mortality. Findings from the ICE on Injury Statistics. International Collaborative Effort on Injury Statistics. Adv. Data 1998, 303, 1–20. [Google Scholar]
  81. Voss, T.S.; Elm, J.J.; Wielinski, C.L.; Aminoff, M.J.; Bandyopadhyay, D.; Chou, K.L.; Sudarsky, L.R.; Tilley, B.C. Fall Frequency and Risk Assessment in Early Parkinson’s Disease. Parkinsonism Relat. Disord. 2012, 18, 837–841. [Google Scholar] [CrossRef] [PubMed]
  82. Wickham, H.; Averick, M.; Bryan, J.; Chang, W.; D’, L.; Mcgowan, A.; François, R.; Grolemund, G.; Hayes, A.; Henry, L.; et al. Welcome to the Tidyverse. J. Open Source Softw. 2019, 4, 1686. [Google Scholar] [CrossRef]
  83. Kassambara, A. Pipe-Friendly Framework for Basic Statistical Tests [R Package Rstatix Version 0.7.2]. 2023. [Google Scholar]
  84. Revelle, W. Procedures for Psychological, Psychometric, and Personality Research [R Package Psych Version 2.4.3]. 2024. [Google Scholar]
  85. Huebner, A.; McGinn, T.; Sisk, M. psr: Functions for Analyzing Performance Science Data. 2021. [Google Scholar]
  86. Caldwell, A. SimplyAgree: An R Package and Jamovi Module for Simplifying Agreement and Reliability Analyses. J. Open Source Softw. 2022, 7, 4148. [Google Scholar] [CrossRef]
  87. Datta, D. blandr: A Bland-Altman Method Comparison package for R. Zenodo. 2017. [Google Scholar]
Figure 1. Mean ICC(2.1) for the means of trial 1–2, 1–3, 2–3 and 1–2–3 calculated for each obstacle-crossing parameter.
Sensors 24 03387 g001
Figure 2. Bland–Altman plots for trial 1 and 2, 1 and 3, and 2 and 3 for gait parameters during the approaching phase (AE), the crossing phase (FJ), and obstacle clearance parameters (KP).
Sensors 24 03387 g002aSensors 24 03387 g002bSensors 24 03387 g002cSensors 24 03387 g002dSensors 24 03387 g002eSensors 24 03387 g002fSensors 24 03387 g002gSensors 24 03387 g002hSensors 24 03387 g002iSensors 24 03387 g002jSensors 24 03387 g002kSensors 24 03387 g002lSensors 24 03387 g002mSensors 24 03387 g002nSensors 24 03387 g002oSensors 24 03387 g002p
Table 1. Arithmetic mean and standard deviation of obstacle-crossing parameters for each trial and for their mean.
ConditionParameterT1T2T3T123
Mean (SD)Mean (SD)Mean (SD)Mean (SD)
Approaching phaseStride double support time (s)0.36 (0.05)0.35 (0.06)0.35 (0.05)0.36 (0.05)
Stride duration (s)1.10 (0.13)1.09 (0.11)1.09 (0.10)1.09 (0.11)
Stride length (cm)131 (11.4)131 (11.5)132 (11.2)131 (11.3)
Stride velocity (cm/s)120 (17.2)122 (15.5)122 (15.4)121 (15.9)
Stride width (cm)10.6 (2.49)11.3 (2.74)11.2 (2.86)11.0 (2.70)
Crossing phaseStep double support time (s)0.22 (0.04)0.20 (0.05)0.21 (0.04)0.21 (0.04)
Step duration (s)0.64 (0.08)0.62 (0.07)0.63 (0.07)0.63 (0.07)
Step length (cm)72.7 (9.49)73.4 (9.78)73.6 (9.33)73.2 (9.47)
Step velocity (cm/s)115 (20.8)119 (21.5)118 (19.0)118 (20.4)
Step width (cm)10.2 (3.40)10.4 (3.80)10.1 (3.79)10.2 (3.64)
Obstacle clearanceLeading foot horizontal distance prior to obstacle (cm)108 (13.0)108 (10.4)108 (10.1)108 (11.1)
Trailing foot horizontal distance prior to obstacle (cm)43.0 (10.3)44.1 (8.77)42.9 (10.1)43.3 (9.71)
Leading foot horizontal distance after obstacle (cm)25.7 (6.61)25.0 (6.63)26.8 (7.75)25.8 (7.00)
Trailing foot horizontal distance after obstacle (cm)91.6 (11.5)91.8 (10.4)95.0 (12.1)92.8 (11.4)
Leading foot toe clearance (cm)9.93 (4.21)9.99 (4.37)10.8 (5.19)10.2 (4.59)
Trailing foot toe clearance (cm)31.4 (8.68)32.2 (8.01)32.0 (6.53)31.9 (7.74)
Note: SD: arithmetic standard deviation, T1: trial 1, T2: trial 2, T3: trial 3, T123: arithmetic mean of the three trials.
Table 2. Relative and absolute reliability for each obstacle-crossing parameter between the mean of the first and second trials (T1–T2), the first and third trials (T1–T3), the second and third trials (T2–T3), and the means of the three consecutive trials (T1–T2–T3).
ConditionParameterT1–T2T1–T3T2–T3T1–T2–T3
ICC(2.1) [95%CI]MDCMDC%SEMSEM%ICC [95%CI]MDCMDC%SEMSEM%ICC(2.1) [95%CI]MDCMDC%SEMSEM%ICC(2.1) [95%CI]MDCMDC%SEMSEM%
Approaching phaseStride length (cm)0.75 [0.58; 0.85]15.912.25.754.400.76 [0.60; 0.86]15.211.65.484.180.86 [0.76; 0.92]11.78.944.233.230.79 [0.68; 0.87]14.411.05.193.96
Stride width (cm)0.74 [0.55; 0.85]3.7134.01.3412.30.74 [0.56; 0.85]3.8135.01.3712.60.76 [0.61; 0.87]3.7533.41.3512.10.75 [0.62; 0.84]3.7634.21.3512.3
Stride double support time (s)0.76 [0.60; 0.87]0.0720.40.037.360.77 [0.61; 0.87]0.0718.80.026.780.81 [0.68; 0.89]0.0618.30.026.600.78 [0.67; 0.87]0.0719.20.026.92
Stride duration (s)0.87 [0.77; 0.93]0.1210.90.043.950.84 [0.72; 0.91]0.1311.50.054.150.87 [0.78; 0.93]0.119.730.043.510.86 [0.78; 0.92]0.1210.70.043.88
Stride velocity (cm/s)0.83 [0.70; 0.90]18.915.66.825.640.82 [0.69; 0.90]19.215.86.925.710.90 [0.82; 0.95]13.411.04.853.980.85 [0.76; 0.91]17.314.36.265.16
Crossing phaseStep length (cm)0.84 [0.72; 0.91]10.814.83.895.330.81 [0.68; 0.89]11.315.44.075.570.87 [0.77; 0.93]9.5213.03.444.670.84 [0.75; 0.90]10.514.43.805.19
Step width (cm)0.35 [0.06; 0.59]8.0277.92.8928.10.32 [0.02; 0.56]8.2080.82.9629.20.71 [0.52; 0.83]5.6454.82.0319.80.47 [0.28; 0.64]7.3772.02.6626.0
Step double support time (s)0.19 [−0.10; 0.45]0.1153.50.0419.30.44 [0.18; 0.65]0.0940.90.0314.80.65 [0.44; 0.79]0.0734.40.0312.40.42 [0.23; 0.60]0.0943.90.0315.8
Step duration (s)0.60 [0.37; 0.76]0.1320.30.057.340.78 [0.63; 0.87]0.0914.90.035.380.76 [0.61; 0.86]0.0914.80.035.340.71 [0.58; 0.82]0.1116.90.046.09
Step velocity (cm/s)0.72 [0.54; 0.84]31.026.511.29.540.77 [0.62; 0.87]26.322.59.498.140.82 [0.69; 0.90]24.020.28.657.290.77 [0.65; 0.86]27.323.29.838.36
Obstacle clearanceTrailing foot horizontal distance prior to obstacle (cm)0.74 [0.58; 0.85]13.430.84.8311.10.70 [0.51; 0.82]15.536.05.5813.00.80 [0.67; 0.89]11.626.64.189.600.75 [0.62; 0.84]13.631.34.8911.3
Trailing foot horizontal distance after obstacle (cm)0.72 [0.54; 0.84]15.917.45.746.260.71 [0.51; 0.84]17.618.96.356.810.63 [0.41; 0.79]18.920.36.837.320.69 [0.54; 0.80]17.618.96.336.82
Trailing foot toe clearance (cm)0.67 [0.47; 0.81]13.241.44.7615.00.58 [0.34; 0.75]13.843.54.9815.70.73 [0.55; 0.84]10.532.73.7911.80.66 [0.51; 0.78]12.639.44.5314.2
Leading foot horizontal distance prior to obstacle (cm)0.51 [0.25; 0.70]22.621.08.177.570.51 [0.25; 0.70]22.520.98.127.550.69 [0.49; 0.82]15.814.65.705.280.56 [0.39; 0.71]20.519.17.416.88
Leading foot horizontal distance after obstacle (cm)0.71 [0.53; 0.83]9.8038.63.5413.90.61 [0.38; 0.76]12.547.64.5117.20.70 [0.50; 0.82]11.042.63.9815.40.67 [0.52; 0.79]11.243.24.0315.6
Leading foot toe clearance (cm)0.84 [0.73; 0.91]4.7247.41.7017.10.78 [0.63; 0.88]6.1459.32.2121.40.89 [0.79; 0.94]4.4743.01.6115.50.84 [0.75; 0.90]5.1650.41.8618.2
Note: ICC: intraclass correlation coefficient, MDC: minimal detectable change, SEM: standard error of measurement, T1: trial 1, T2: trial 2, T3: trial 3. Mean relative reliability legend: slight (gray: 0.00 < ICC(2.1) < 0.20), fair (red: 0.21 < ICC(2.1) < 0.40), moderate (orange: 0.41 < ICC(2.1) < 0.60), substantial (yellow: 0.61 < ICC(2.1) < 0.80), and almost perfect (green: 0.81 < ICC(2.1) < 1.00). MDC% legend: low (yellow: MDC % ≤ 20%), acceptable (orange: 20% < MDC% < 40%), and high (red: MDC% ≥ 40%). SEM% legend: low (green: SEM % ≤ 10%), and high (SEM% > 10%).
Table 3. Agreement between the mean of the first and second trials (T1–T2), the first and third trials (T1–T3), and the second and third trials (T2–T3), for each obstacle-crossing parameter.
ConditionParameterT1–T2T1–T3T2–T3
CCC [95%CI]LOA
[95%CI]
Shieh Test
[95%CI]
SWCCCC [95%CI]LOA
[95%CI]
Shieh Test
[95%CI]
SWCCCC [95%CI]LOA
[95%CI]
Shieh Test
[95%CI]
SWC
Approaching phaseStride length (cm)0.74 [0.57; 0.85][−16.1; 16.3][−18.7; 18.9]2.140.76 [0.60; 0.86][−16.3; 14.3][−18.8; 16.8]2.120.86 [0.75; 0.92][−12.8; 10.6][−14.7; 12.5]2.19
Stride width (cm)0.74 [0.57; 0.84][−4.23; 2.85][−4.80; 3.42]0.490.73 [0.57; 0.84][−4.30; 3.09][−4.90; 3.68]0.500.76 [0.60; 0.86][−3.73; 3.89][−4.34; 4.50]0.53
Stride double support time (s)0.76 [0.60; 0.86][−0.06; 0.08][−0.07; 0.09]0.010.77 [0.62; 0.87][−0.05; 0.08][−0.06; 0.09]0.010.81 [0.68; 0.89][−0.07; 0.07][−0.08; 0.08]0.01
Stride duration (s)0.87 [0.77; 0.92][−0.10; 0.13][−0.12; 0.15]0.020.84 [0.73; 0.90][−0.11; 0.14][−0.13; 0.16]0.020.87 [0.78; 0.93][−0.11; 0.11][−0.13; 0.12]0.02
Stride velocity (cm/s)0.82 [0.70; 0.90][−20.5; 17.5][−23.6; 20.5]3.130.82 [0.69; 0.89][−21.2; 16.9][−24.3; 19.9]3.110.90 [0.82; 0.94][−14.3; 13.0][−16.4; 15.2]3.01
Crossing phaseStep length (cm)0.83 [0.71; 0.91][−11.6; 10.1][−13.4; 11.9]1.850.81 [0.67; 0.89][−12.2; 10.4][−14.1; 12.2]1.790.87 [0.77; 0.93][−9.83; 9.53][−11.4; 11.1]1.85
Step width (cm)0.34 [0.05; 0.58][−8.39; 7.85][−9.70; 9.15]0.590.31 [0.01; 0.55][−8.29; 8.34][−9.63; 9.68]0.580.70 [0.52; 0.83][−5.40; 6.00][−6.32; 6.92]0.70
Step double support time (s)0.19 [−0.10; 0.44][−0.09; 0.13][−0.11; 0.14]0.010.44 [0.17; 0.64][−0.07; 0.10][−0.09; 0.11]0.010.64 [0.43; 0.79][−0.08; 0.06][−0.09; 0.08]0.01
Step duration (s)0.59 [0.37; 0.75][−0.11; 0.14][−0.13; 0.16]0.010.77 [0.62; 0.87][−0.09; 0.10][−0.10; 0.12]0.010.76 [0.60; 0.86][−0.10; 0.09][−0.12; 0.10]0.01
Step velocity (cm/s)0.71 [0.53; 0.83][−34.6; 26.7][−39.5; 31.7]3.930.77 [0.61; 0.87][−28.9; 23.7][−33.1; 27.9]3.750.81 [0.68; 0.89][−22.9; 25.6][−26.8; 29.5]3.86
Obstacle clearanceTrailing foot horizontal distance prior to obstacle (cm)0.74 [0.57; 0.85][−14.5; 12.3][−16.7; 14.5]1.790.69 [0.50; 0.82][−15.6; 15.8][−18.2; 18.4]1.880.80 [0.67; 0.88][−10.3; 12.7][−12.2; 14.6]1.80
Trailing foot horizontal distance after obstacle (cm)0.72 [0.54; 0.83][−16.3; 16.1][−18.9; 18.7]2.030.71 [0.53; 0.83][−20.1; 13.4][−22.8; 16.1]2.200.63 [0.42; 0.77][−21.5; 15.1][−24.5; 18.0]2.05
Trailing foot toe clearance (cm)0.67 [0.46; 0.80][−14.1; 12.4][−16.3; 14.6]1.530.57 [0.34; 0.73][−14.6; 13.3][−16.8; 15.6]1.360.72 [0.55; 0.84][−10.4; 10.9][−12.2; 12.6]1.36
Leading foot horizontal distance prior to obstacle (cm)0.50 [0.25; 0.69][−23.4; 22.5][−27.1; 26.2]2.040.50 [0.25; 0.69][−22.7; 23.0][−26.4; 26.7]2.010.68 [0.48; 0.81][−15.4; 16.6][−18.0; 19.2]1.88
Leading foot horizontal distance after obstacle (cm)0.71 [0.52; 0.83][−9.14; 10.6][−10.7; 12.2]1.220.60 [0.38; 0.76][−13.6; 11.5][−15.6; 13.5]1.290.69 [0.51; 0.82][−12.5; 9.02][−14.2; 10.7]1.33
Leading foot toe clearance (cm)0.84 [0.72; 0.91][−4.86; 4.73][−5.63; 5.51]0.820.78 [0.64; 0.87][−6.88; 5.18][−7.85; 6.15]0.890.88 [0.81; 0.93][−5.07; 3.50][−5.76; 4.19]0.93
Note: CCC: Lin’s concordance correlation coefficient, LOA: limits of agreement, SWC: smallest worthwhile change, T1: trial 1, T2: trial 2, T3: trial 3. CCC legend: Poor (red: CCC ≤ 0.40), moderate (yellow: 0.40 < CCC < 0.70), and good (green: CCC ≥ 0.70) agreement.
Disclaimer/Publisher’s Note: The statements, opinions and data contained in all publications are solely those of the individual author(s) and contributor(s) and not of MDPI and/or the editor(s). MDPI and/or the editor(s) disclaim responsibility for any injury to people or property resulting from any ideas, methods, instructions or products referred to in the content.