On Evaluating Black-Box Explainable AI Methods for Enhancing Anomaly Detection in Autonomous Driving Systems
Abstract
1. Introduction
- (1)
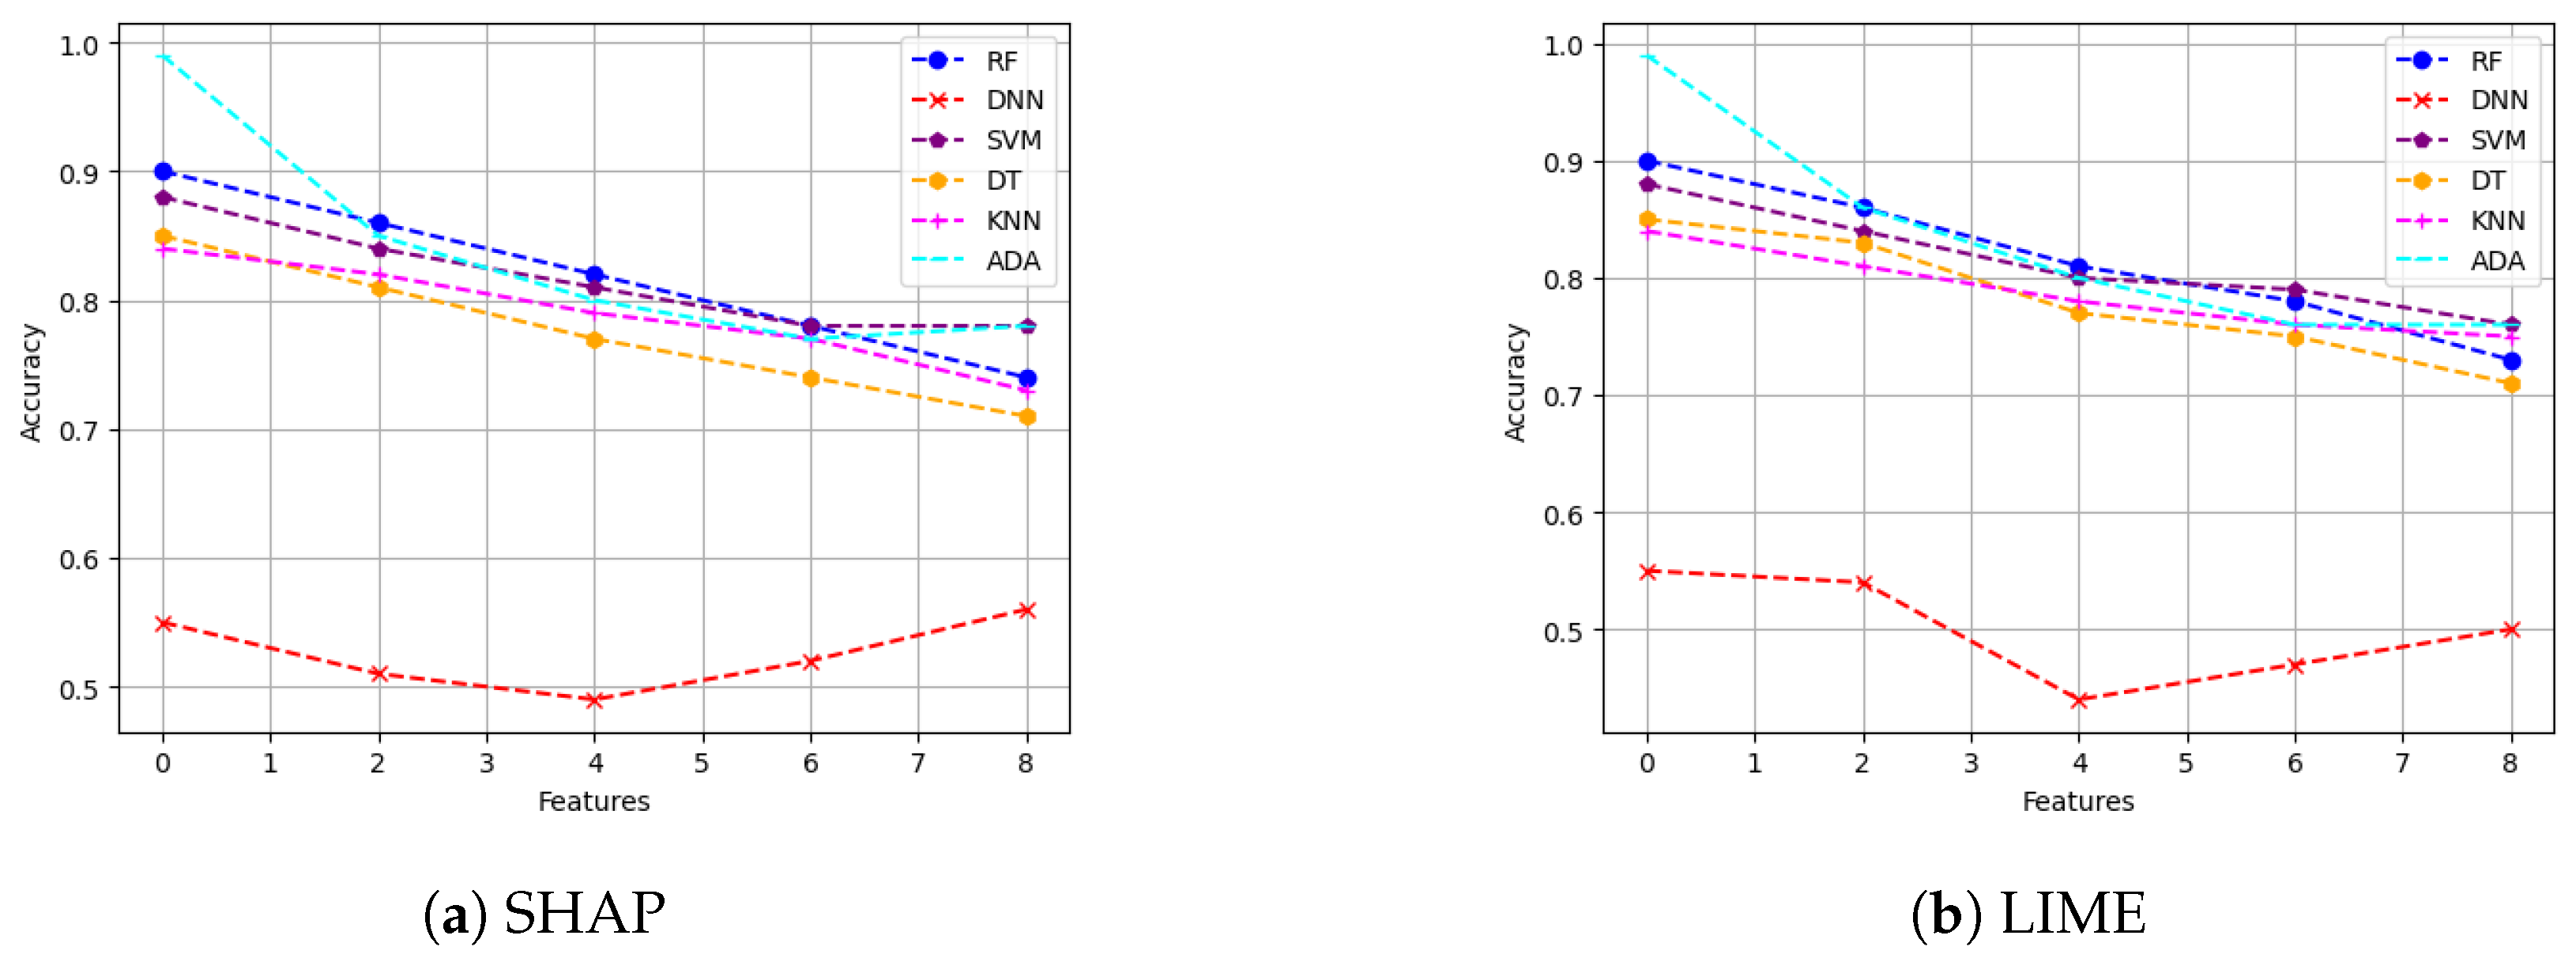
- Descriptive accuracy: This metric quantifies the alignment between feature importance assigned by the XAI technique and the true impacts of features on the AI model’s predictions. It is measured by systematically removing top features and assessing degradation in the predictive performance of the AI model.
- (2)
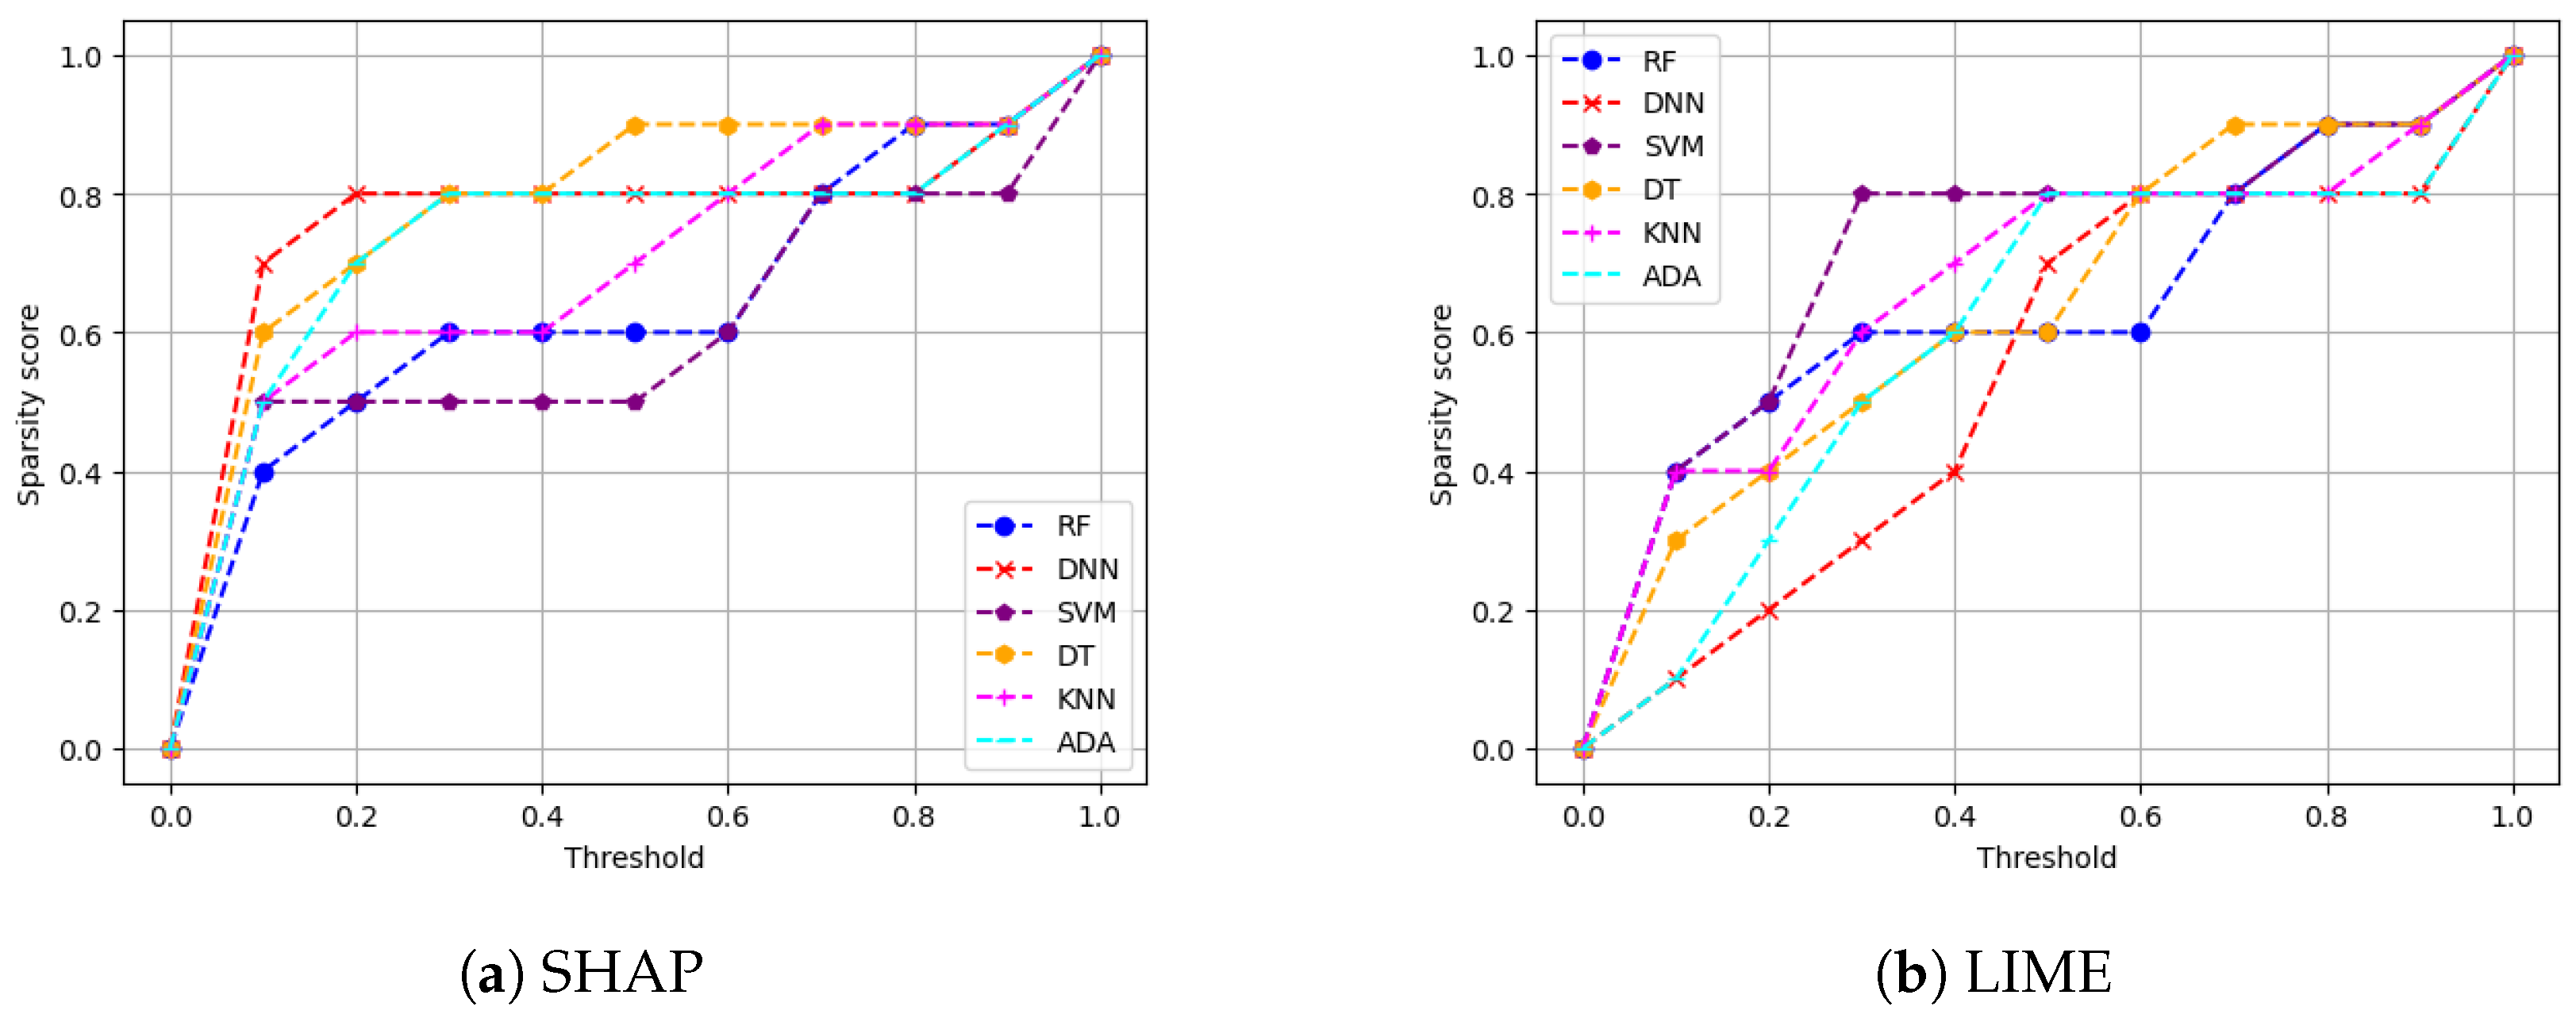
- Sparsity: This metric assesses whether the importance of explaining a model’s logic is spread out or concentrated among its features. If the explanations are sparse, it means only a few features play a crucial role in the model’s decision making. For instance, if 8 out of 10 features related to anomaly detection in an autonomous driving system are below a small threshold (close to zero), it implies that only 2 features hold a significant influence on the model’s decision making. Consequently, the sparsity is high. Utilizing an XAI method with high sparsity in autonomous driving monitoring can assist analysts in monitoring AV networks by focusing on a smaller set of critical features.
- (3)
- Stability: The stability metric measures how consistent the XAI method is in generating its explanations. Higher stability means that explanations are more stable and reliable. This is tested by identifying common features through running trials under similar settings. Based on such a stability test, an XAI method with higher stability can be trusted more by the safety drivers in the anomaly detection process when testing AVs.
- (4)
- Efficiency: The efficiency of an XAI method refers to the time it takes to produce an explanation. This metric is crucial as it gauges the XAI method’s suitability for real-world applications, where quick generation of explanations is preferred for practicality. Given that the primary aim is to assist security analysts, the ideal is to provide accurate XAI explanations in real time for timely intrusion detection, particularly in the safety-critical application of autonomous driving systems.
- (5)
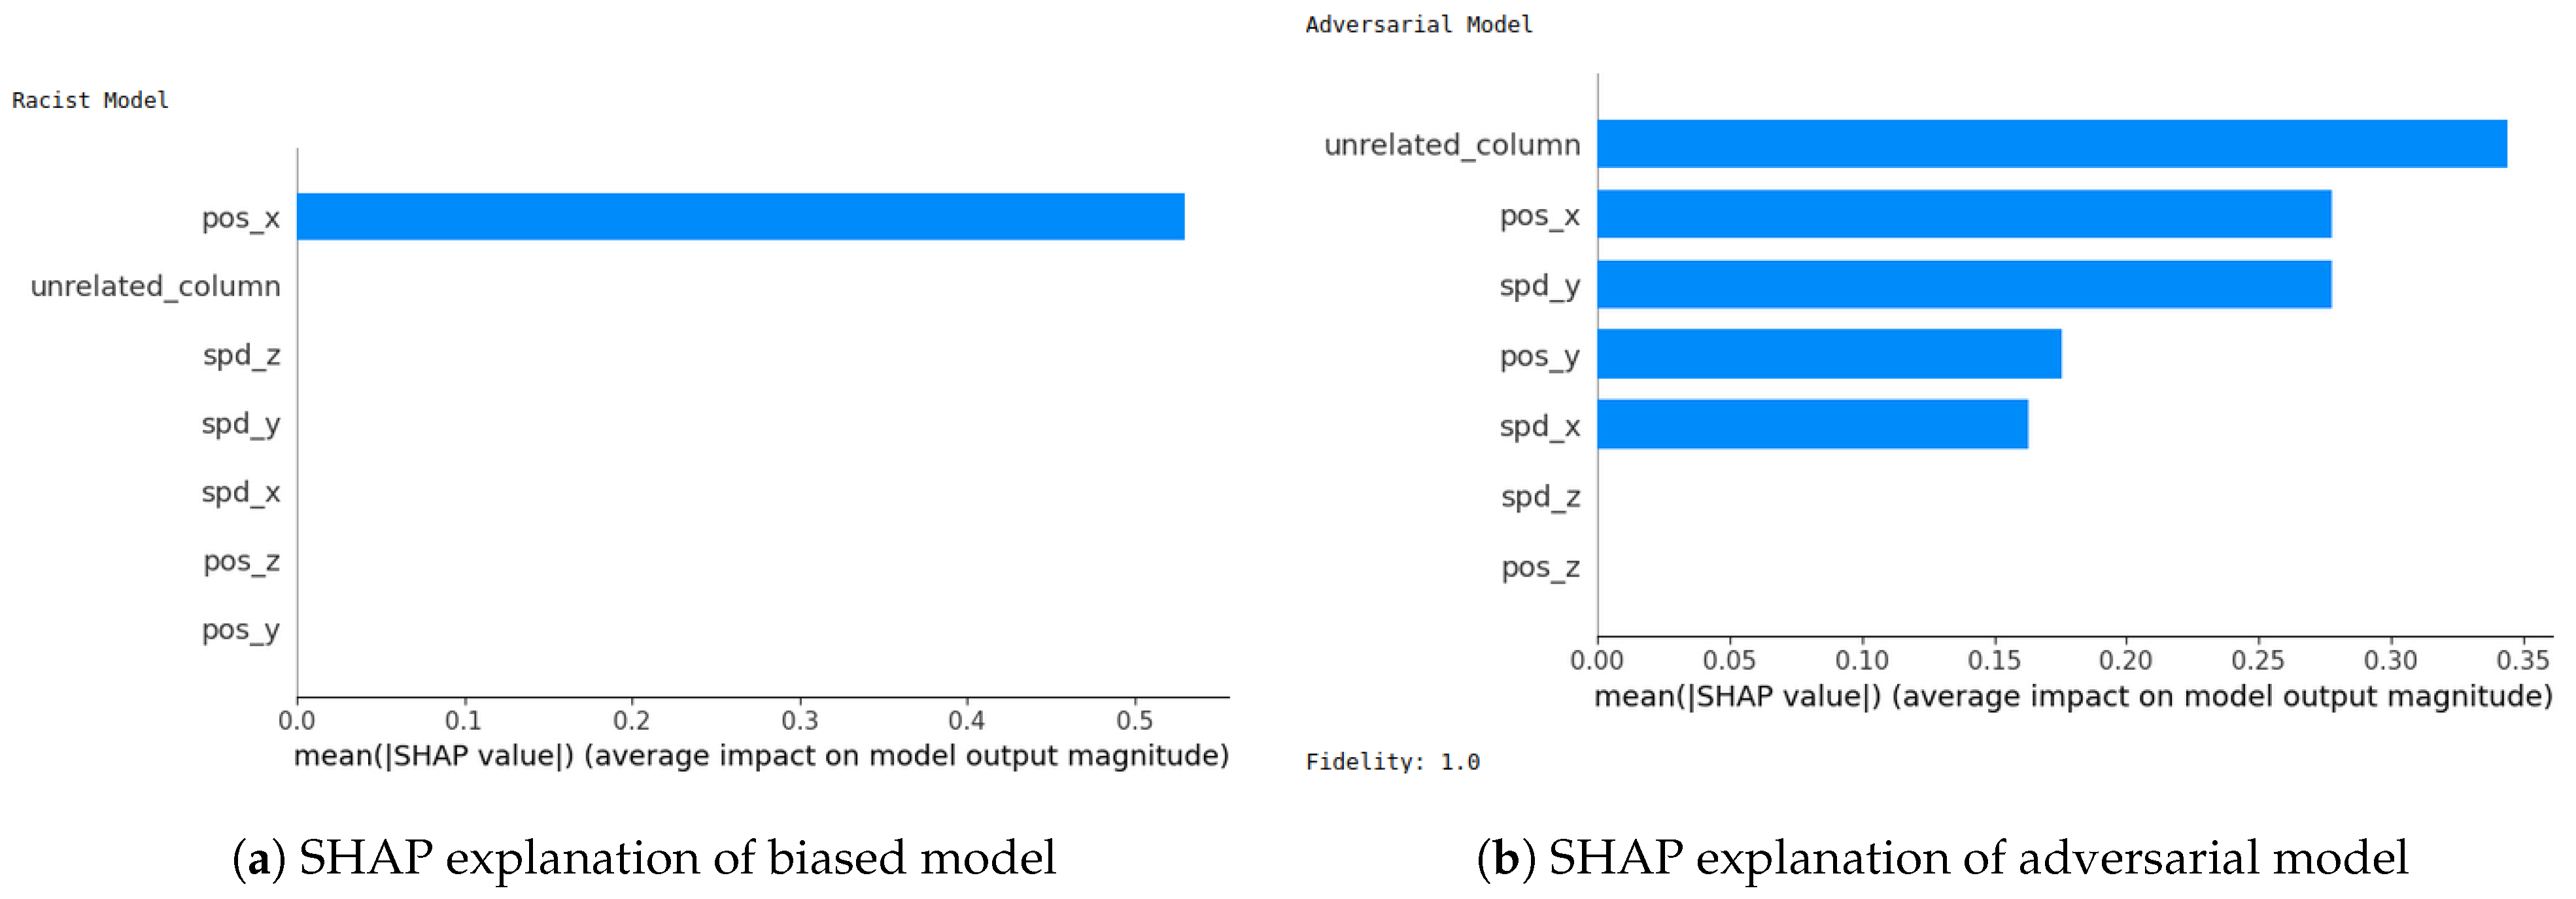
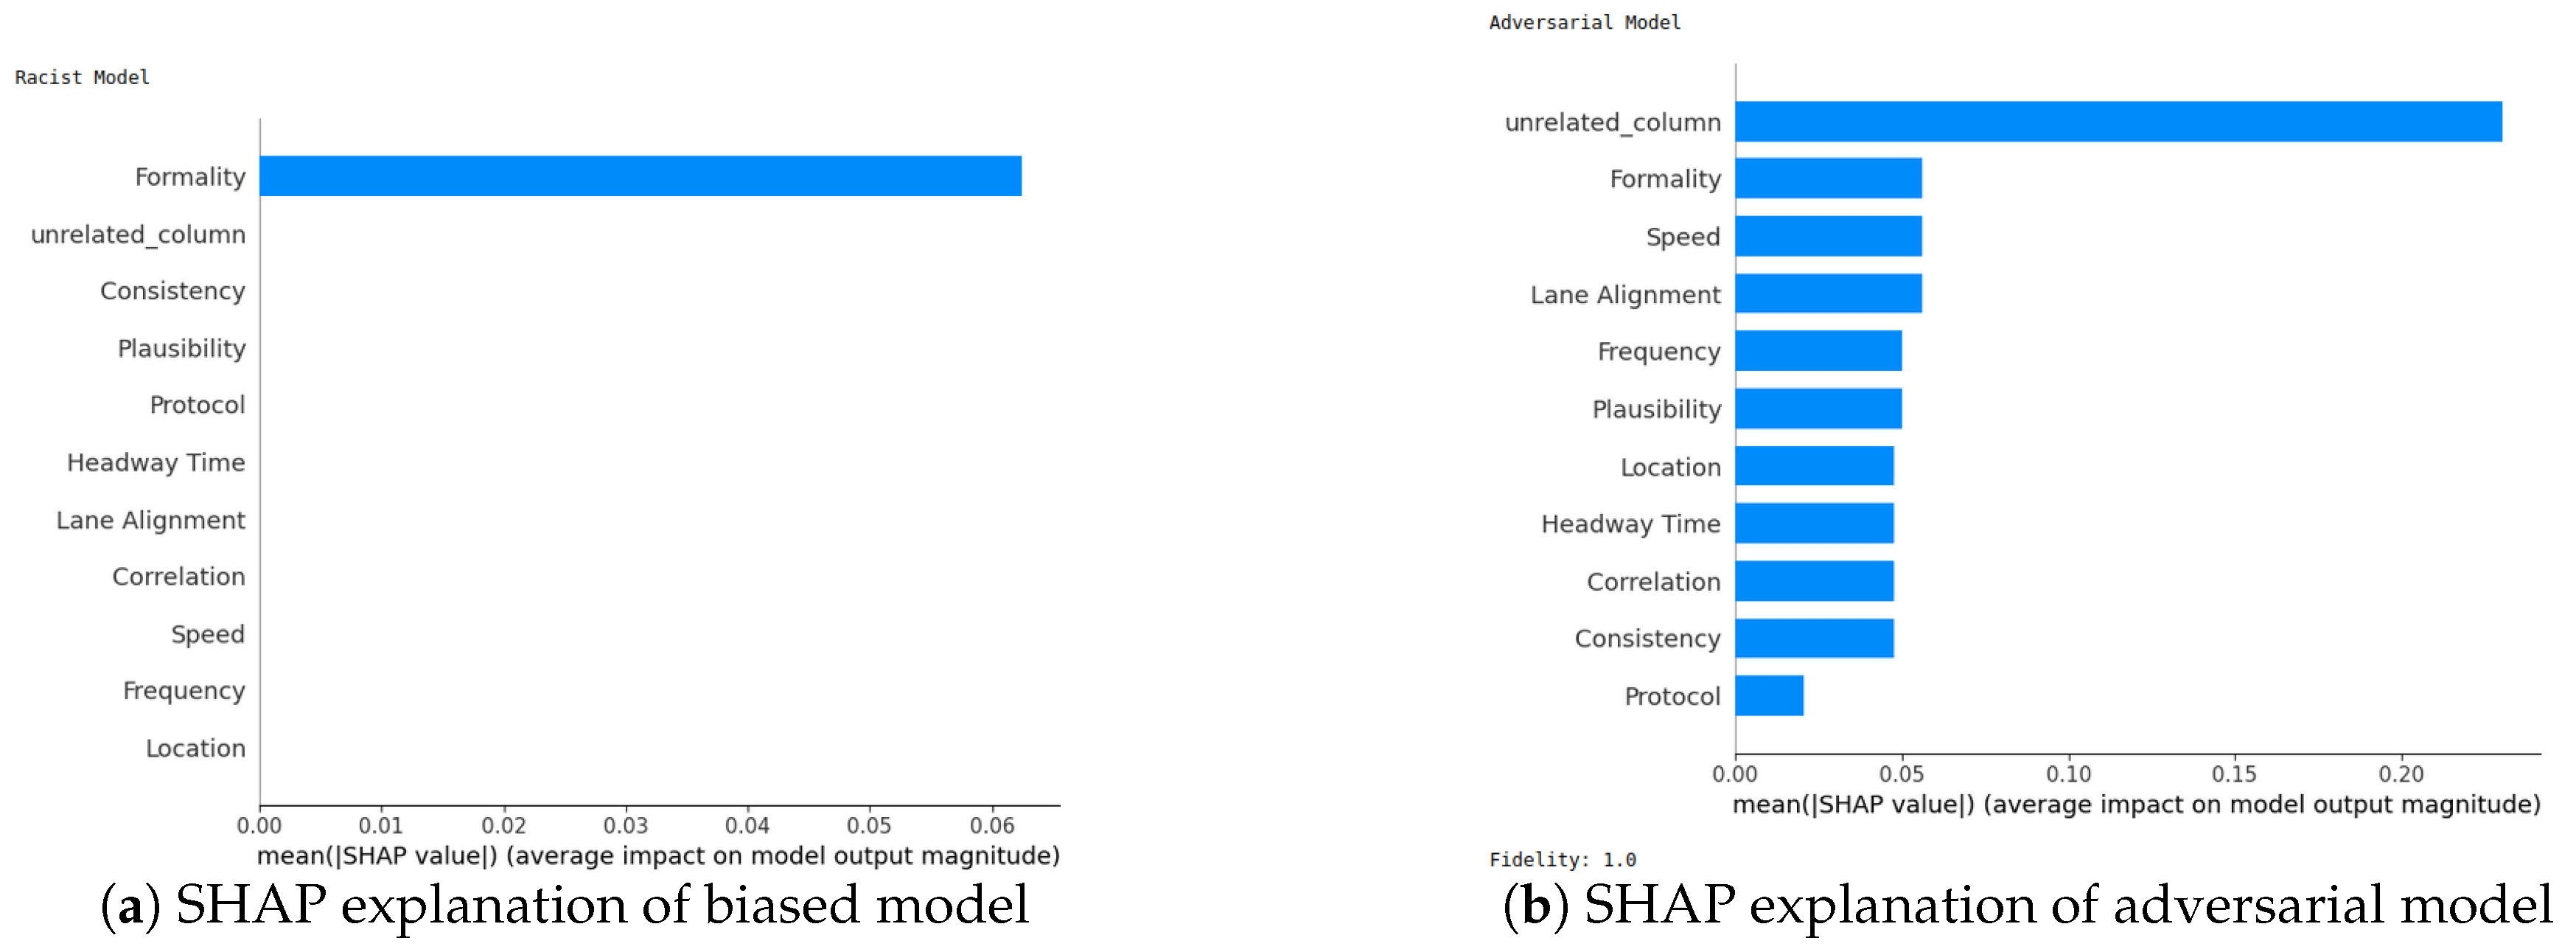
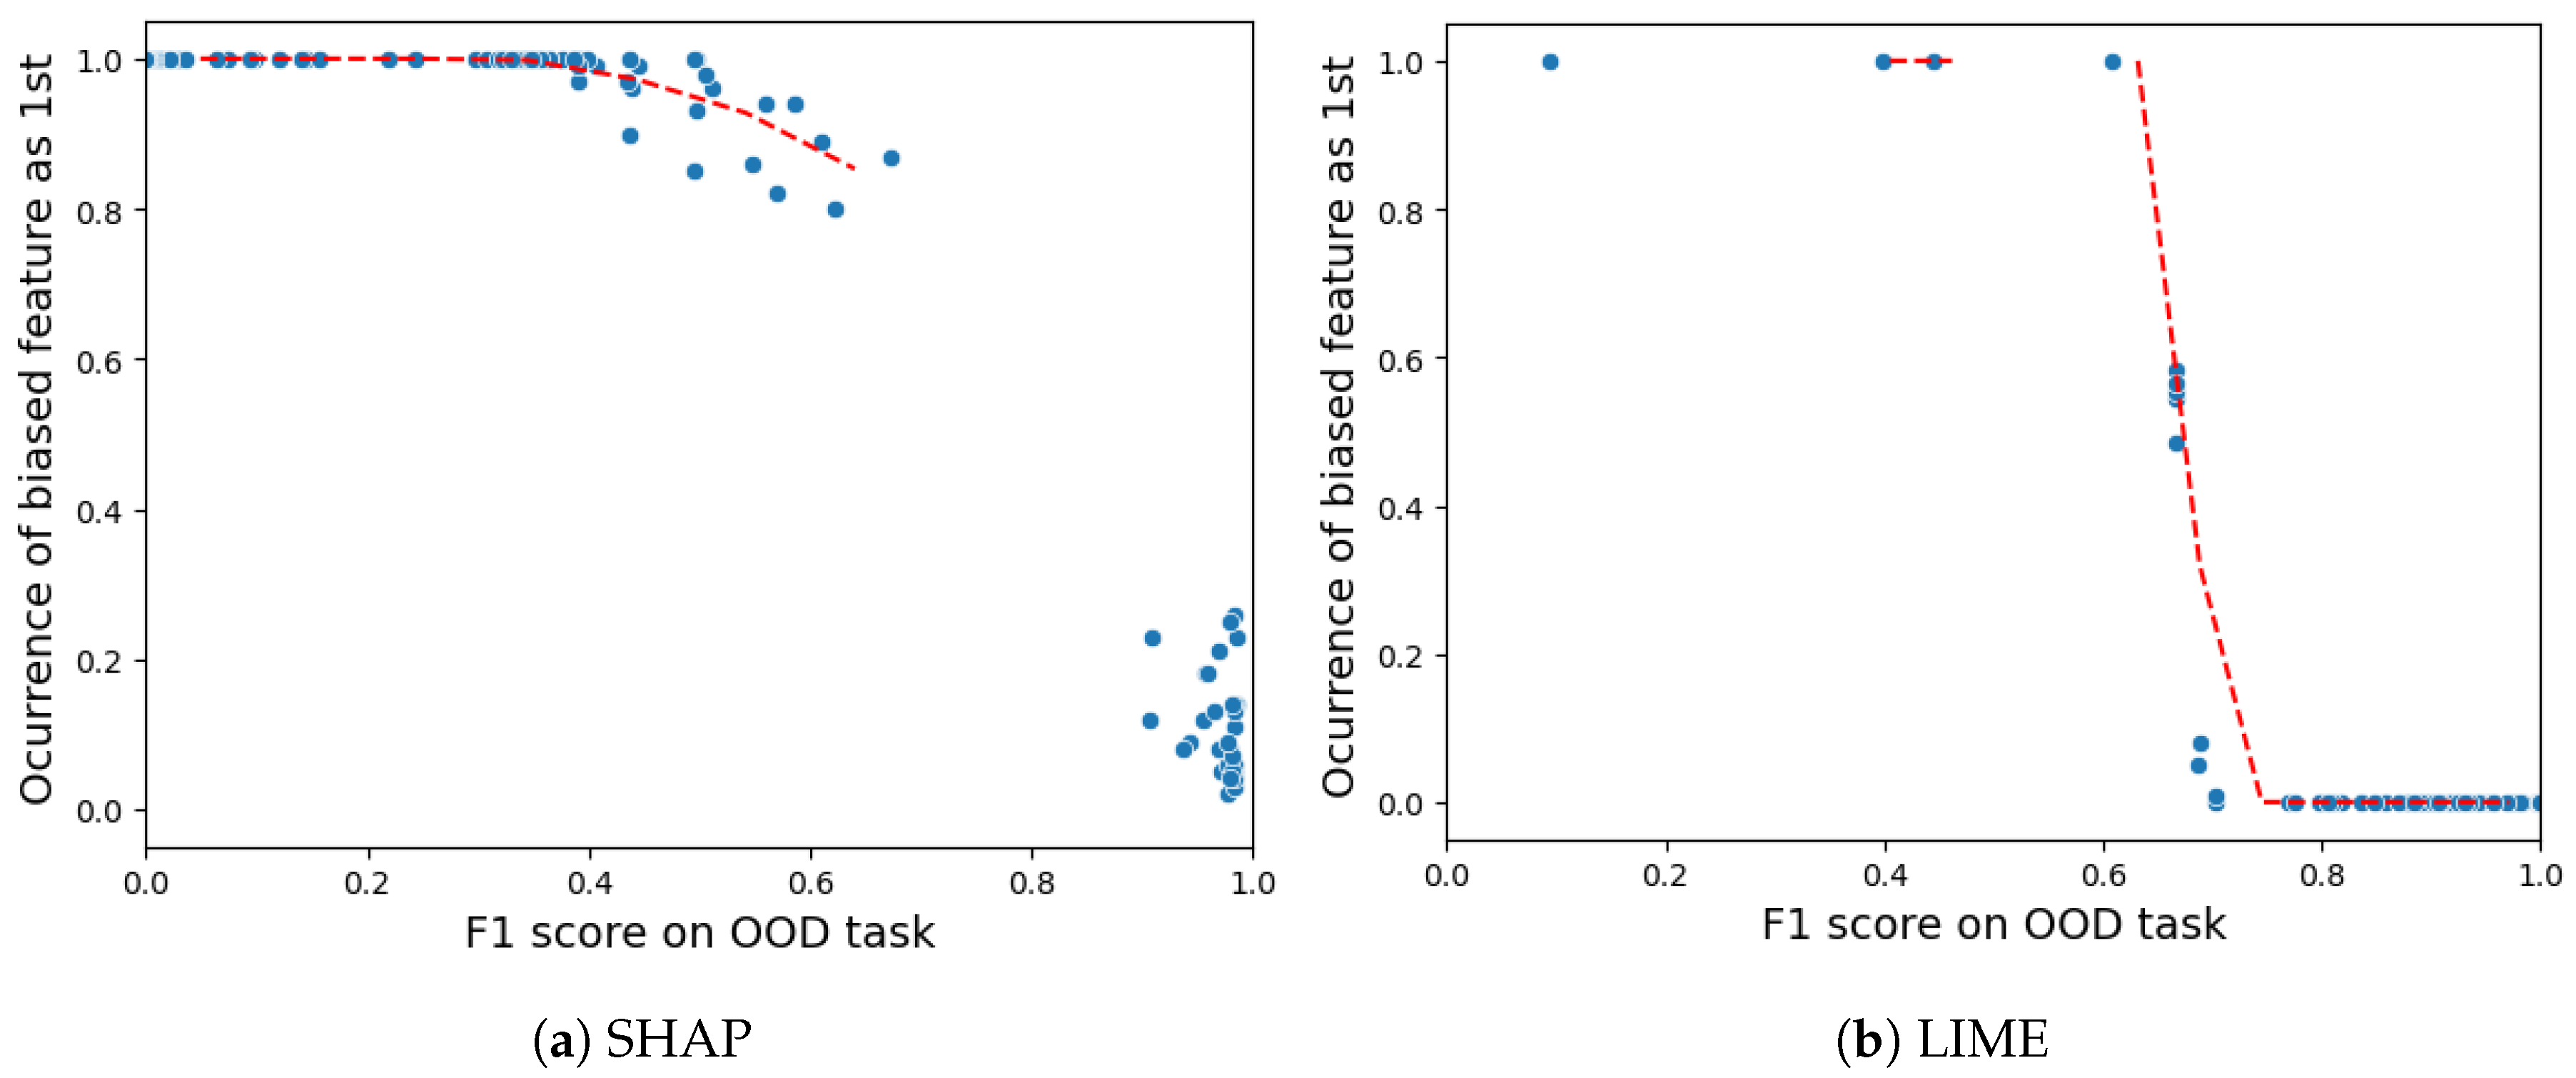
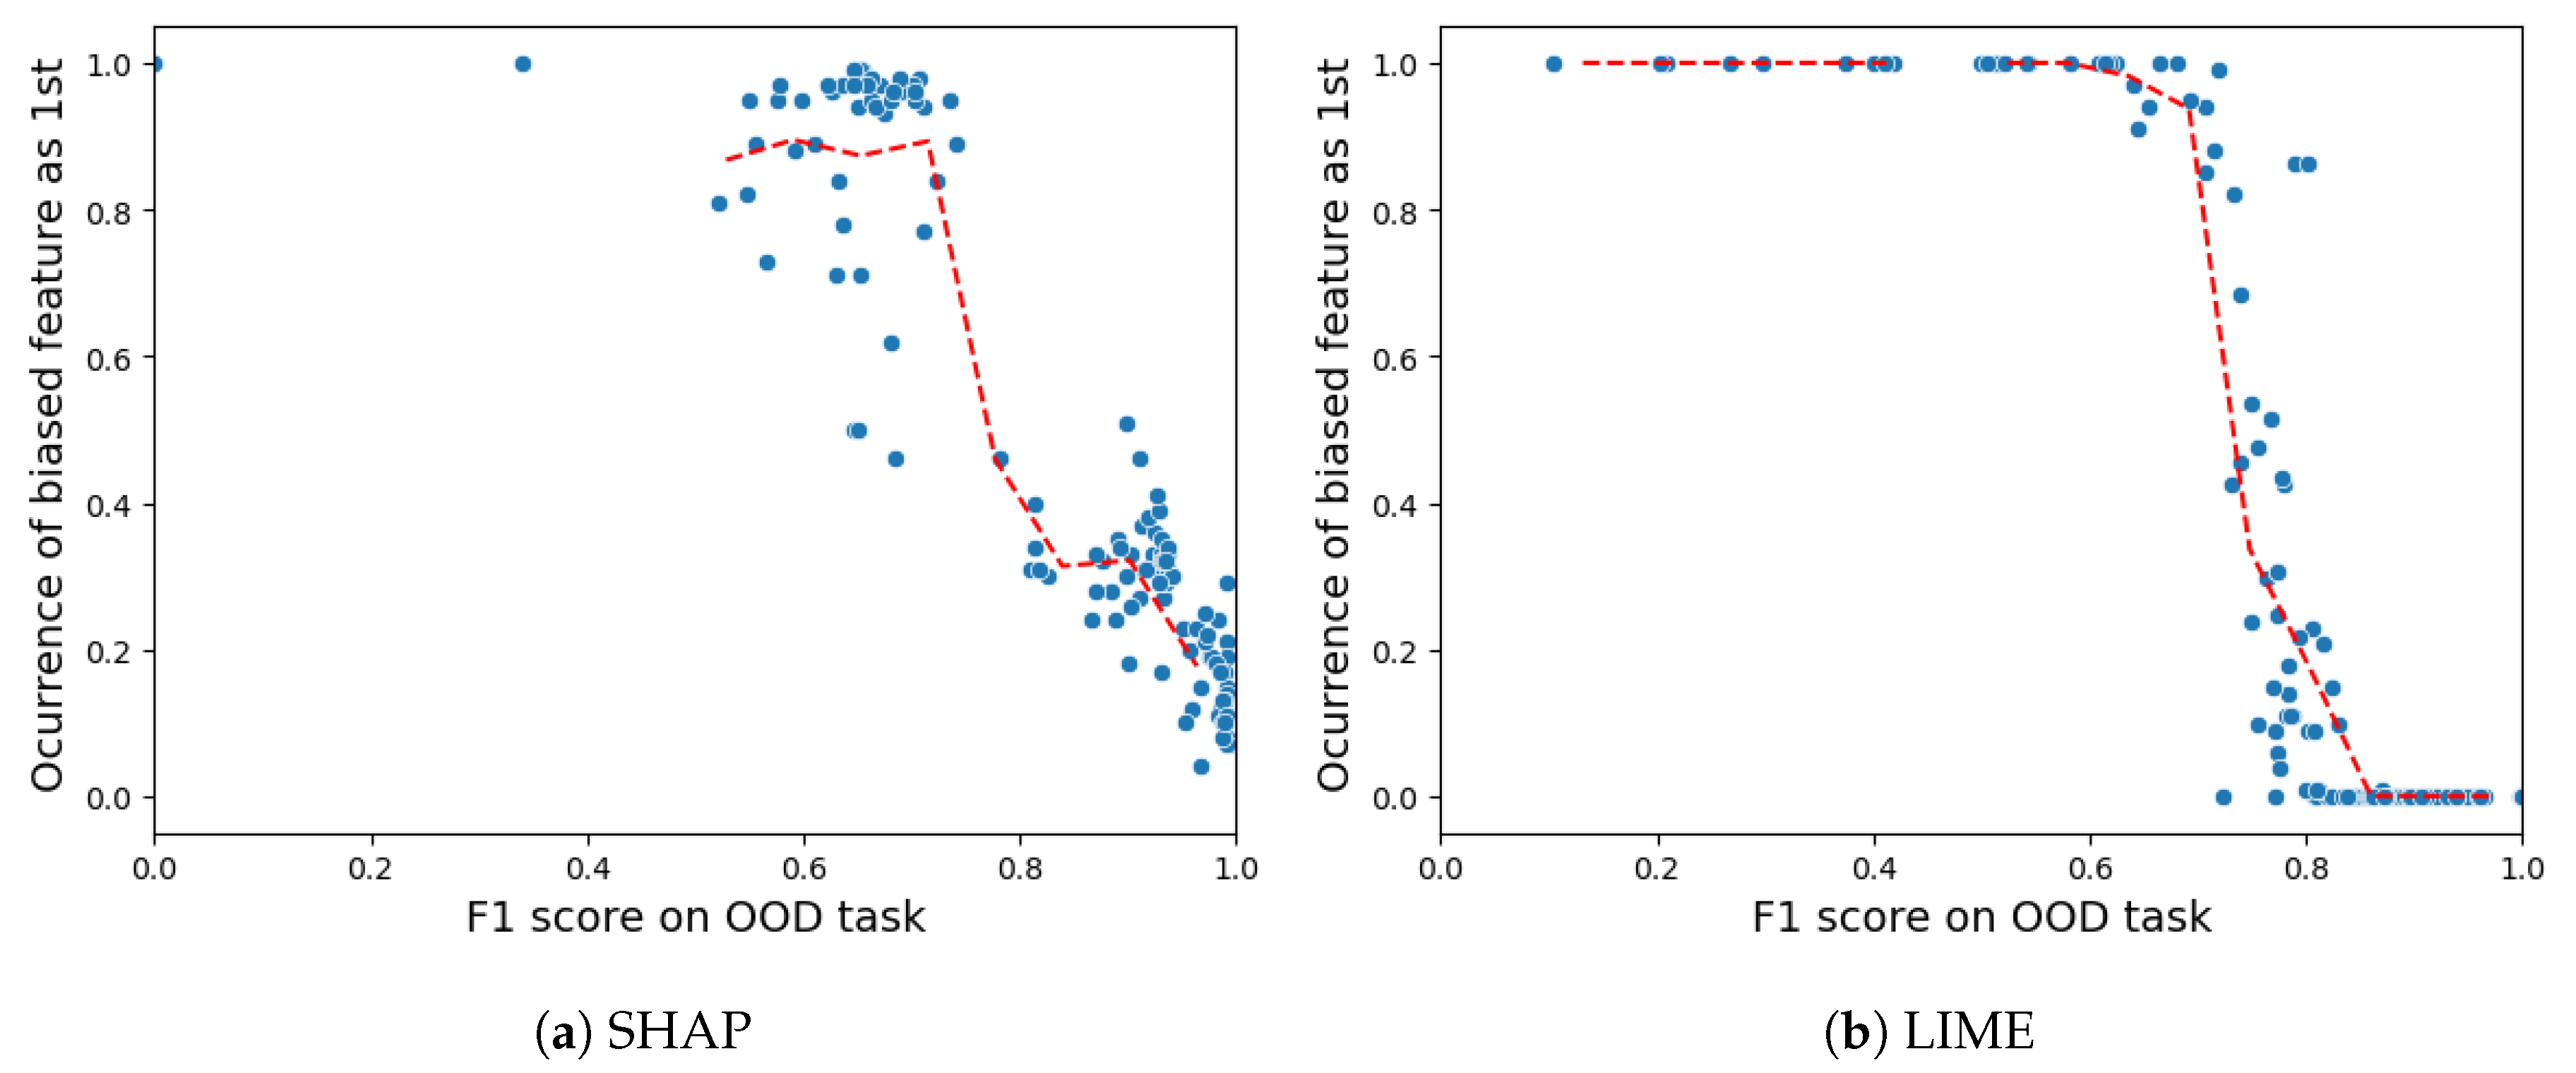
- Robustness: This metric validates the invariance of explanations to minor perturbations in the input features. Robust techniques should exhibit insensitivity to inconsequential noise or distortions in the data. The robustness of an XAI method refers to its ability to provide consistent explanations even when there are small changes in the data. These changes could be due to errors or intentional attacks. In our study, we used an adversarial model inspired by previous research [22]. This model involves training one biased model that relies heavily on a single feature and another model with all features, including a new one engineered to deceive the XAI explanation method. By generating explanations for normal samples that seem convincing but are actually misleading, there is a risk of compromising the framework’s integrity. This could lead to misidentifying an anomalous AV as a normal one, as the explanations may not accurately reflect the underlying behavior of the autonomous vehicle.
- (6)
- Completeness: This metric assesses the capacity of an XAI technique to provide valid explanations for all possible model inputs, including corner cases. More complete methods leave less opportunity for adversaries to exploit blind spots. The completeness of an XAI method means it can provide accurate explanations for all types of samples, even uncommon ones. It is important to note that a complete XAI method is also more robust, meaning it is better at detecting whether an explanation is valid. In our study, we measure completeness by ensuring that every sample has a valid explanation, while the robustness metric focuses on how well the XAI framework resists adversarial attacks.
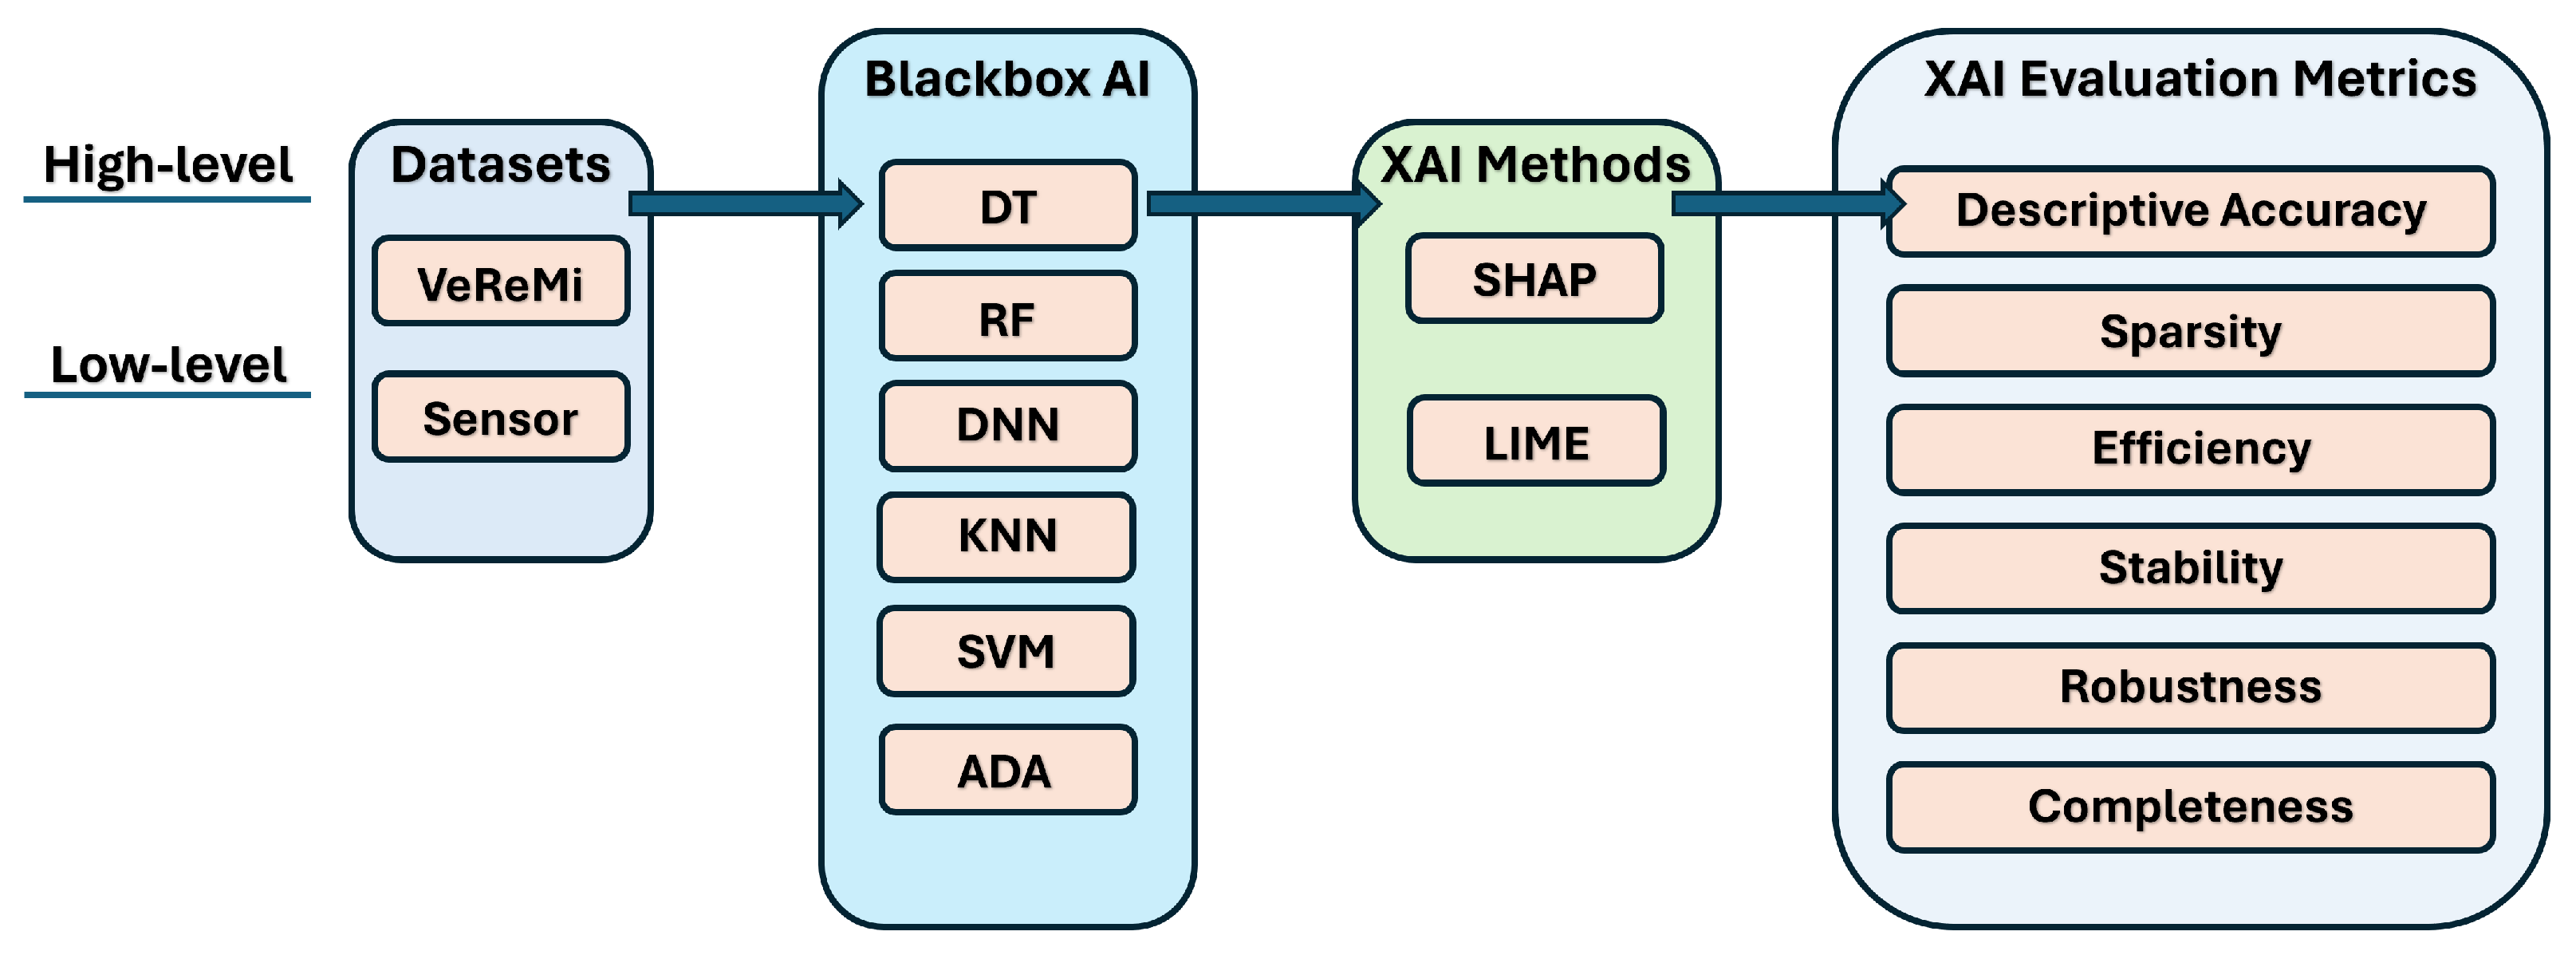
- We introduce a comprehensive framework to assess XAI techniques for anomaly detection in autonomous vehicles. This framework allows for the examination of both global and local XAI methods to gain insights into the decision-making processes of AI models that identify unusual behavior in autonomous vehicles.
- We scrutinize six distinct evaluation metrics for two widely used black-box XAI techniques: SHAP and LIME.
- We validate our XAI evaluation framework via using two prominent autonomous driving datasets (VeReMi and Sensor) across six different AI models.
- We make our source codes publicly accessible, encouraging their use as a foundational XAI evaluation framework for anomaly detection in autonomous driving. Researchers are invited to build upon and create additional models based on this resource (the URL for our source codes of the framework is https://github.com/Nazat28/EXAI_ADS (accessed on 25 May 2024)).
2. Related Works
3. The Problem Statement
3.1. Securing Autonomous Driving Systems
3.2. Shortcomings of Black-Box AI Models
3.3. Explainable AI
3.4. Benefits of Applying Explainable AI for Securing Autonomous Vehicles
3.5. Challenges of XAI for Securing Autonomous Vehicles and Need for Evaluating XAI
- Transparency challenges: Anomaly detection AI models for intrusion often operate as black boxes, posing significant difficulties for interpretation and understanding. This lack of transparency is especially problematic for autonomous driving security, restricting the ability of security experts and safety drivers to effectively audit and protect these systems against potential threats.
- Limited application of XAI in autonomous driving security: The unique challenges posed by anomaly detection in autonomous driving [50] have led to a limited development of interpretative methods for anomaly detection systems in this domain. This contrasts with other fields, like text analysis and computer vision, where a broader range of XAI methods has been established. This limitation restricts the effective use of XAI in enhancing autonomous driving security.
- Accuracy and robustness: In addition to accuracy, XAI methods utilized in autonomous driving security systems must fulfill additional criteria, including delivering comprehensive and resilient explanations. The provision of complete and robust explanations enhances the reliability of XAI methods, ensuring their effective application in the safety-critical autonomous driving security application.
- Evaluation and comparison: There is an urgent requirement to establish evaluation criteria for assessing XAI methods and facilitating comparisons within the anomaly detection domain in autonomous driving [51]. These criteria should encompass the specific demands of the autonomous driving field, including stability, robustness, reliability, and efficiency, along with general properties inherent in machine learning models such as accuracy, transparency, and explainability.
4. Framework
4.1. An End-to-End XAI Pipeline for Autonomous Driving Systems
- (i)
- Loading autonomous driving dataset: In this study, we used two different datasets. One is the vehicular reference misbehavior (VeReMi) dataset, which is a dataset to analyze misbehavior detection mechanism in VANETs. Generated from simulation environment, this dataset provides message logs of on-board units (OBUs) and labeled ground truth [23]. The other one is a dataset created based on the Sensor dataset [2], that contains data from the main communication sensors of an AV. We want to underline that when choosing the Sensor data for each AV in this dataset, we adhered to the data ranges provided by prior works [24,52].
- (ii)
- Black-box AI models: After completing the dataset preprocessing, we proceed to train the black-box AI models. We split the data, allocating 70% for training and reserving the remaining 30% for testing. We develop six models: decision tree (DT), random forest (RF), deep neural network (DNN), k-nearest neighbors (KNN), support vector machine (SVM), and AdaBoost (ADA). The hyperparameters for these AI models were fine-tuned to achieve optimal predictive performance (refer to Appendix A).
- (iii)
- XAI methods: We explain the black-box XAI methods using SHAP and LIME as prototypical examples of model-agnostic post hoc explanation methods suitable for diverse AI models. Post-construction of the black-box AI models, we leverage two prevalent model-agnostic post hoc XAI techniques—LIME [20] and SHAP [25]—to elucidate the models. These encompass both global and local scopes for comprehensive analysis. As model-agnostic approaches applied after model training, they are compatible with diverse AI models. Specifically, SHAP derives explanations by attributing an importance score to features based on Shapley values from game theory. In contrast, LIME approximates the global model locally using linear surrogate models to explain individual predictions. Although designed for a local scope, we modified LIME to generate global explanations by aggregating local feature importance scores over many samples. For each sample, LIME produces local explanations with feature scores. We then accumulate the scores for each feature across samples, and then, average the summed absolute score values per feature across samples. Finally, we rank these features by average importance and select the top features as globally influential. This allows LIME to provide global insights without re-engineering.
- (iv)
- XAI evaluation metrics: We assess the XAI methods using six key metrics: descriptive accuracy, sparsity, stability, efficiency, robustness, and completeness. Descriptive accuracy gauges the reduction in AI model accuracy when the top influential features, identified by XAI methods, are omitted. Sparsity assesses whether the explanations are centralized on a few key features or spread across numerous less significant ones. Stability examines if the explanations vary significantly across multiple runs. Efficiency evaluates the time each method requires to produce explanations, favoring quicker methods. Robustness determines whether explanations can be deceived by adversarial input changes intended to misguide the XAI method. Lastly, completeness examines whether explanations offer a thorough understanding of the AI model’s decision making, even for outlier samples.
Step-by-Step Process for Producing XAI Evaluation Metrics
| Algorithm 1 Descriptive Accuracy Metric Algorithm |
|
| Algorithm 2 Sparsity Metric Algorithm |
|
| Algorithm 3 Stability Metric Algorithm |
|
| Algorithm 4 Efficiency Metric Algorithm |
|
| Algorithm 5 Robustness Metric Algorithm |
|
| Algorithm 6 Completeness Metric Algorithm |
|
4.2. Top Features List in the Datasets
5. Evaluation
- How can XAI elucidate the decision-making processes of AI models in identifying anomalous autonomous vehicles?
- How do the two XAI techniques perform across the six evaluation metrics?
- What are the advantages and drawbacks of employing black-box XAI methods for anomaly detection in autonomous driving?
- Which black-box XAI method performs better across the six evaluation metrics?
5.1. Dataset Description
5.2. Experimental Setup
- (a)
- SHAP [56]: The predictions of AI models are explained by SHAP. It was created based on a game theory concept (Shapley value) and can evaluate the contributions of each characteristic (feature) to the classification of any AI model.
- (b)
- LIME [57]: It is a form of XAI model that aids in explaining an AI model locally and making each prediction understandable on its own. This approach describes the features that contributed to the decision of the classifier on a single instance.
5.3. Evaluation Metrics
- (1)
- Descriptive accuracy: This metric is presented through accuracy (ACC) figures for each AI model and XAI technique across datasets (refer to Figures 4 and 5).
- (2)
- (3)
- Efficiency: The efficiency tables for each XAI technique indicate the time taken to produce XAI explanations for both local (single instance) and global (multiple instances) scopes (see Tables 10–12).
- (4)
- Stability: A stability table is crafted to evaluate the reliability of XAI explanations. This experiment repeatedly generates top features for each XAI method and examines the intersection of these features across different trials under identical conditions (refer to Tables 6–9).
- (5)
- Robustness: Drawing from the code in [22], we created an adversarial model that disconnects the sample from its explanation. We tested the ability to produce false predictions while still presenting plausible explanations. For example, attempting to classify an anomalous AV as normal while offering a convincing XAI rationale for such a decision (see Figures 9 and 10).
- (6)
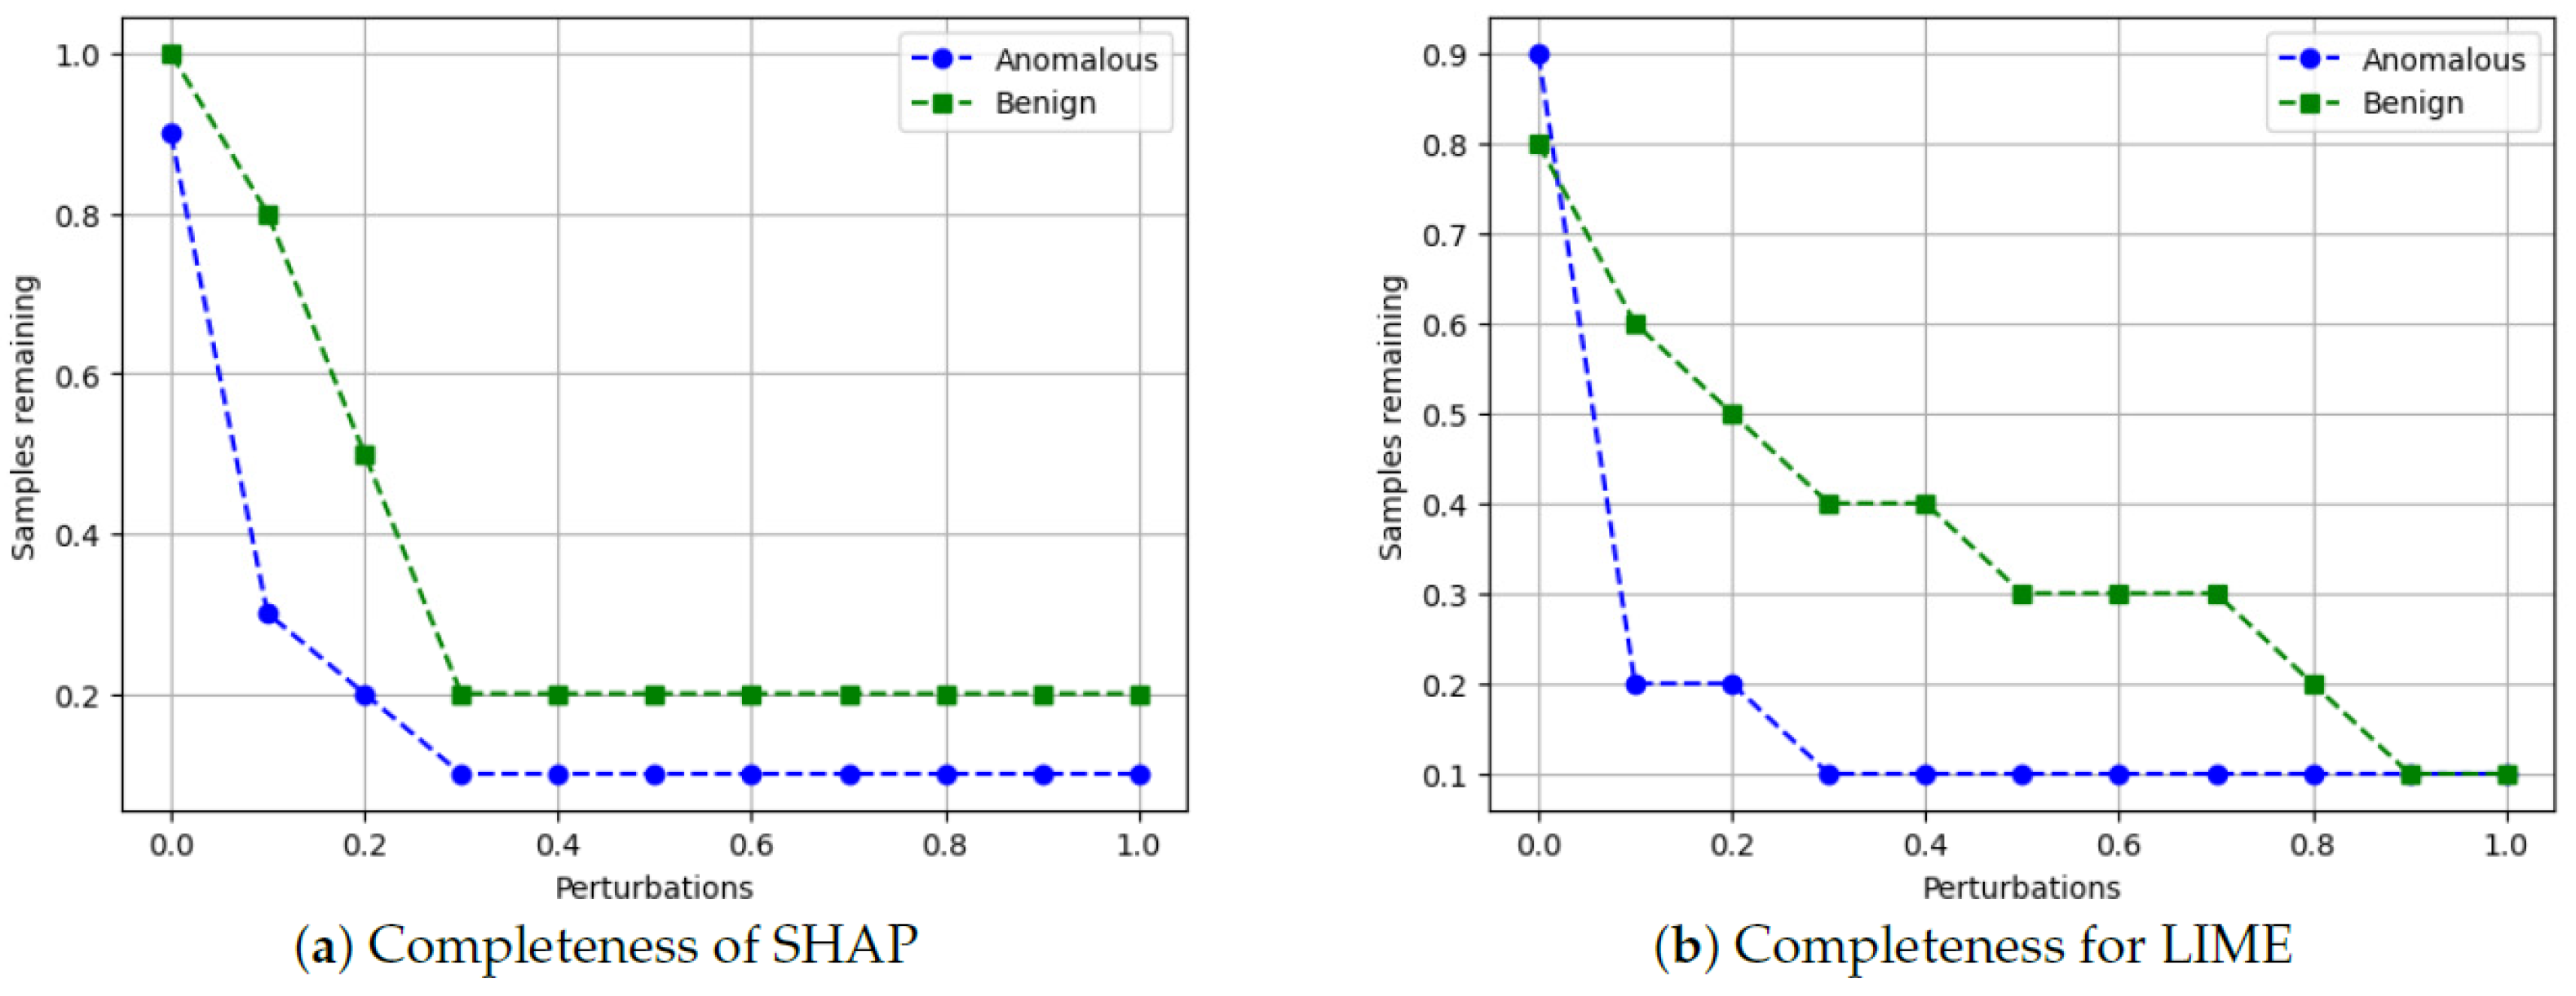
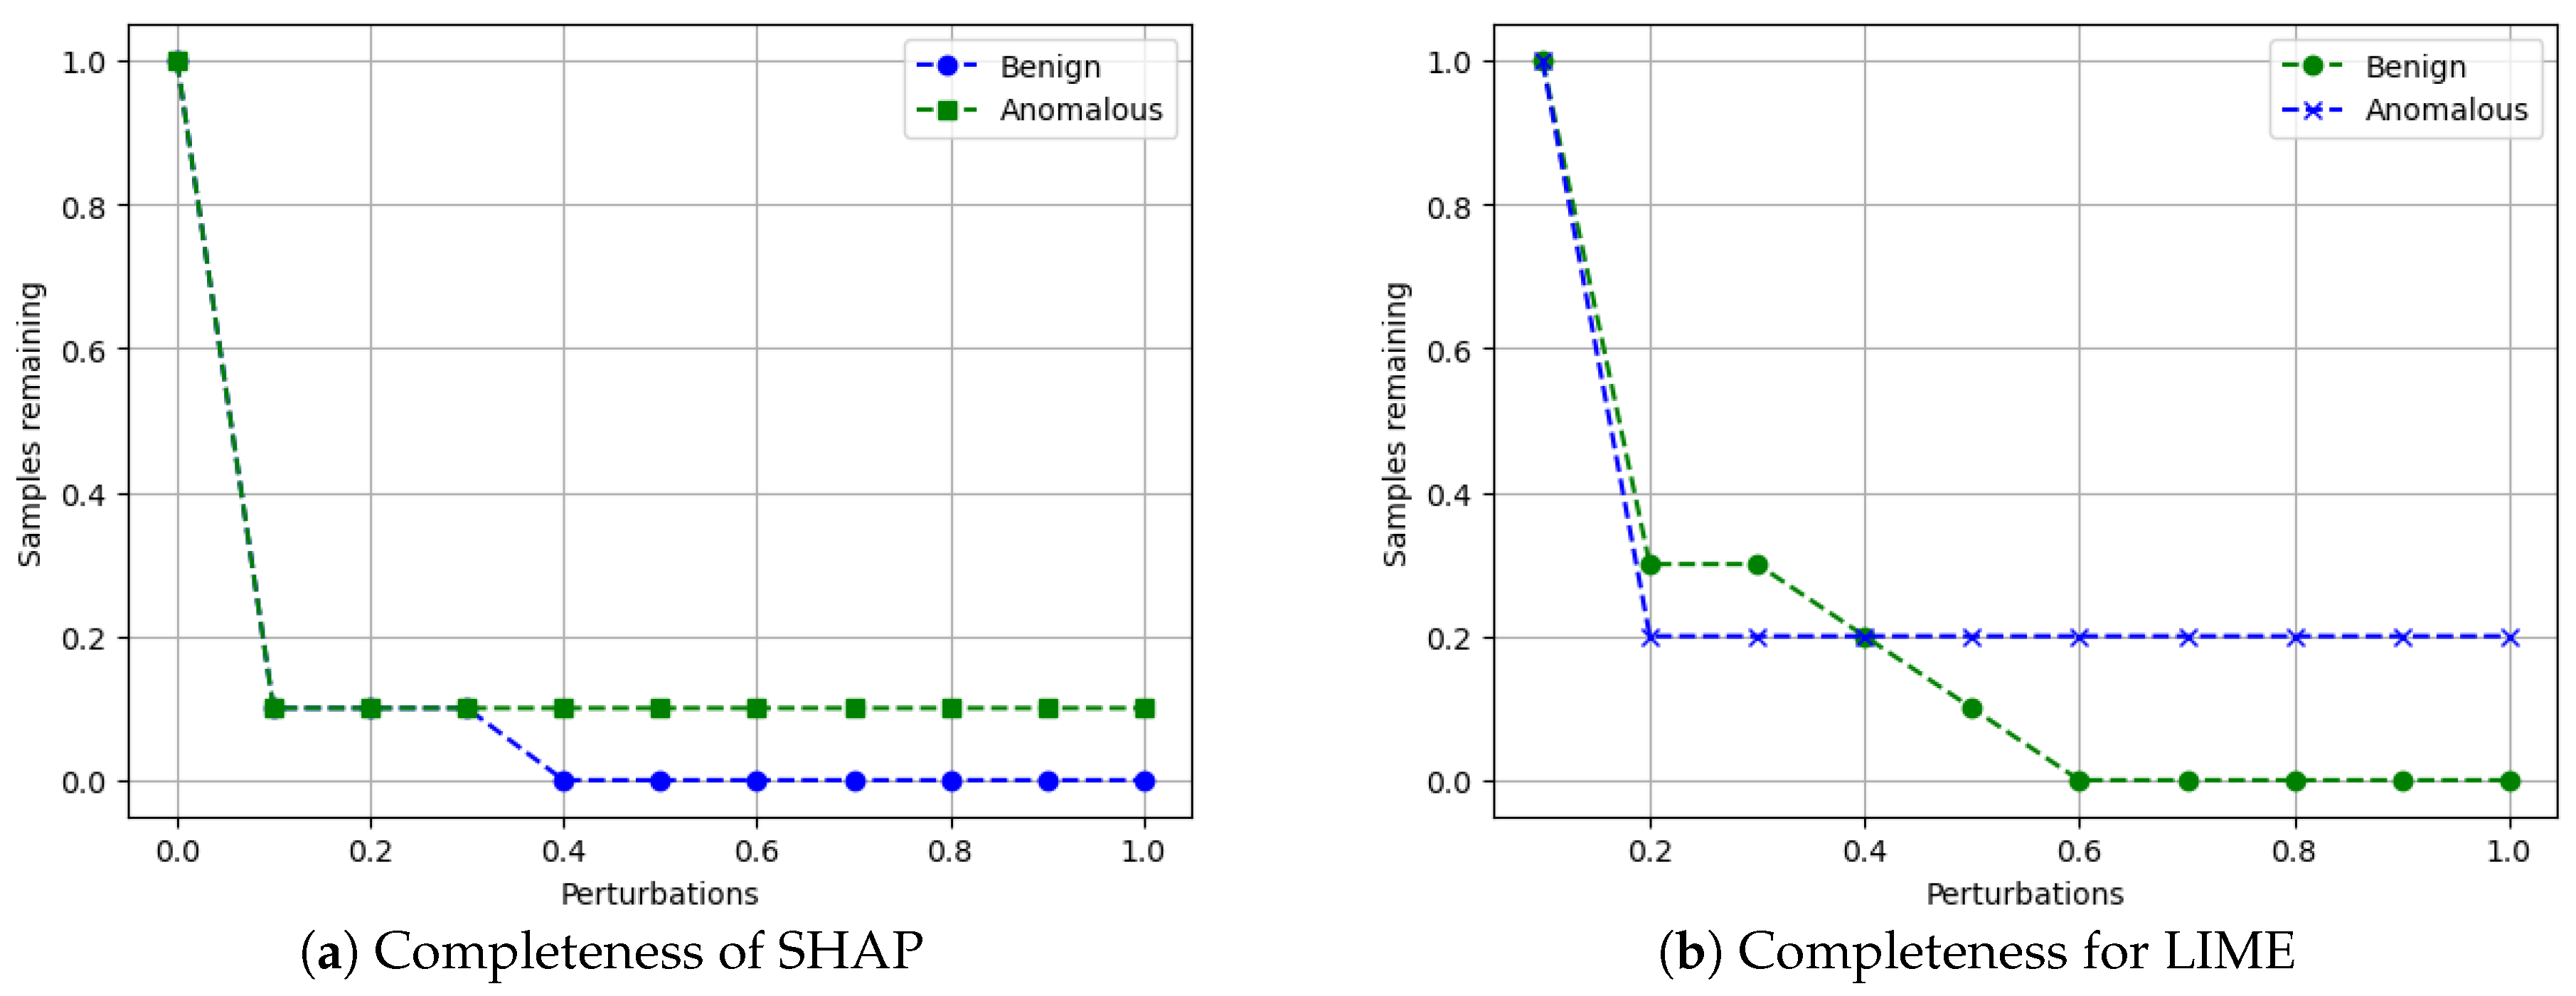
- Completeness: We assess whether XAI techniques can achieve full completeness, covering genuine explanations for all network traffic instances, including edge cases. For instance, if a perturbation alters the explanation of the top features without changing the predicted class, such an explanation cannot be trusted. Therefore, our completeness figures and tables (see Tables 13 and 14 and Figures 20 and 21) gauge whether the most influential features modify the outcomes when sufficiently perturbed.
| XAI Methods | DT | RF | DNN | KNN | SVM | ADA |
|---|---|---|---|---|---|---|
| SHAP | 0.68 | 0.71 | 0.78 | 0.63 | 0.95 | 0.71 |
| LIME | 0.63 | 0.58 | 0.65 | 0.60 | 0.56 | 0.63 |
| XAI Methods | DT | RF | DNN | KNN | SVM | ADA |
|---|---|---|---|---|---|---|
| SHAP | 0.76 | 0.62 | 0.73 | 0.67 | 0.57 | 0.71 |
| LIME | 0.62 | 0.62 | 0.53 | 0.65 | 0.70 | 0.59 |
5.4. Evaluation Results
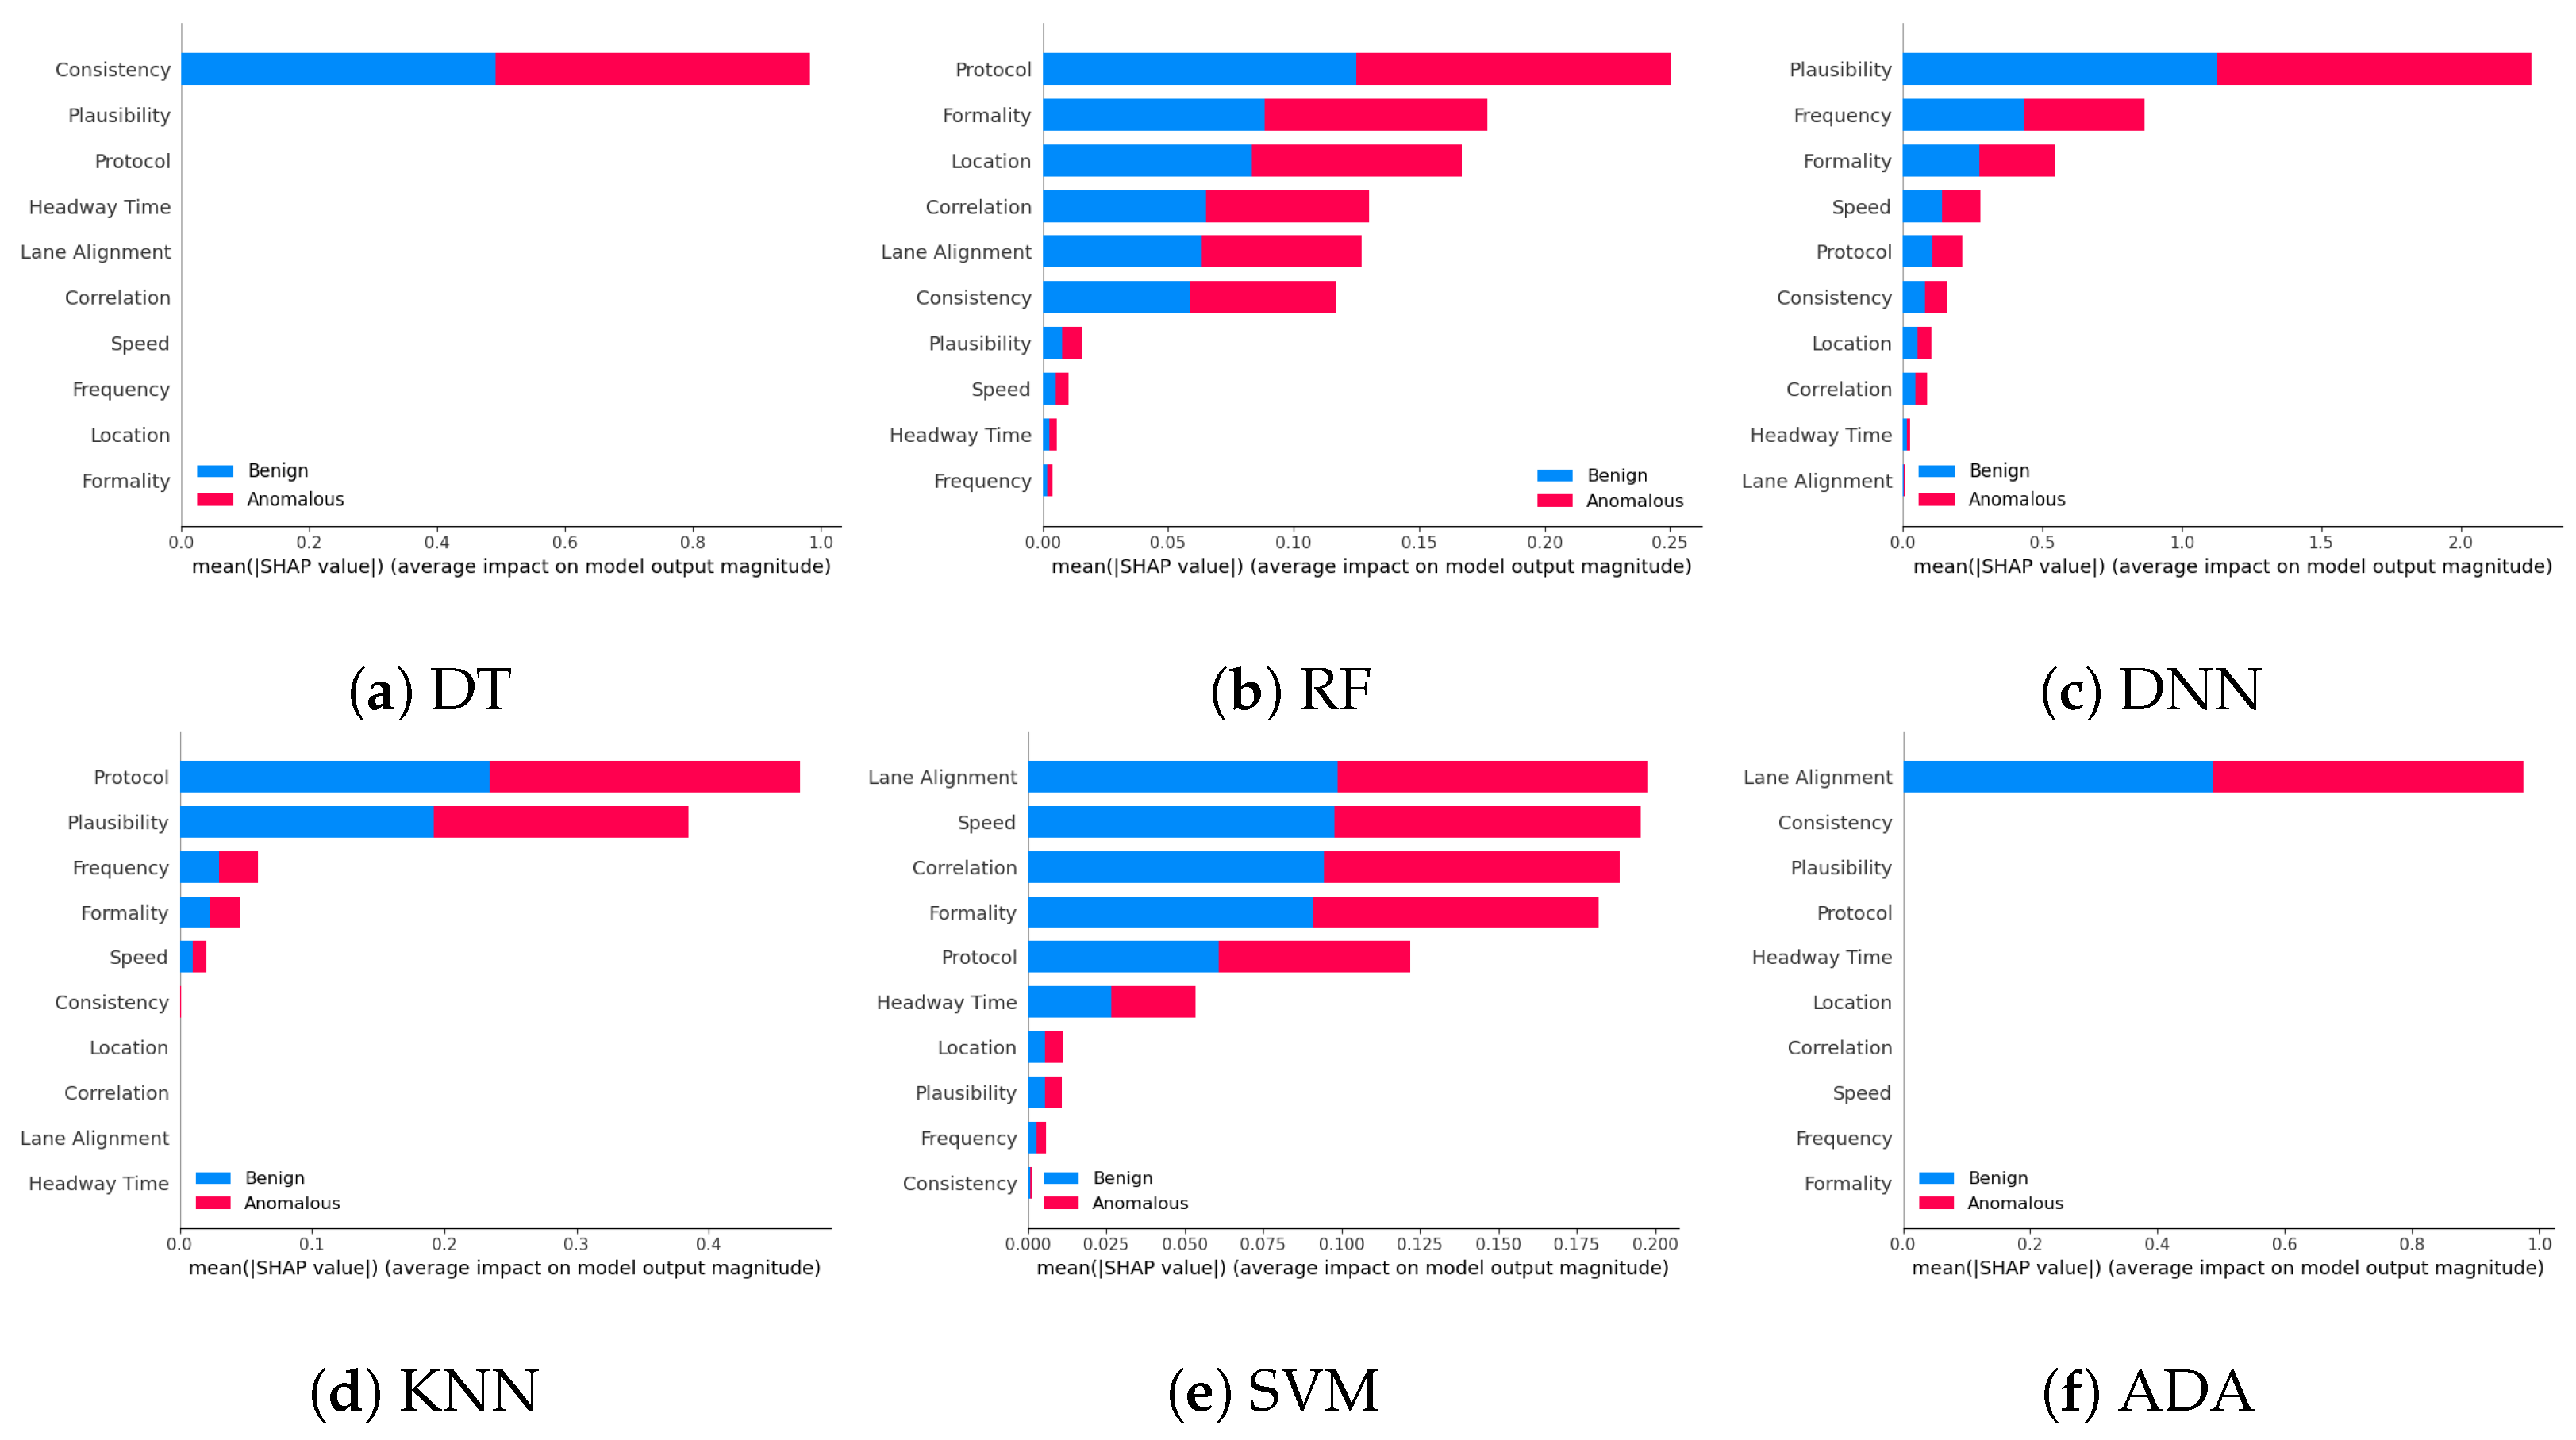
5.4.1. The Importance of Features via Explainable AI
5.4.2. Descriptive Accuracy
5.4.3. Sparsity of Explanation
5.4.4. Stability
5.4.5. Efficiency
5.4.6. Robustness
- (i)
- SHAP—VeReMi dataset: For the robustness test of SHAP for the VeReMi dataset, the adversarial model is successful in hiding the biased feature and lets SHAP explain the sample via the most significant feature “unrelated_column”, whereas in reality “pos_x” is the most significant feature for this sample to reach the classification decision. Figure 8 shows this finding. The prediction fidelity is also “1”, which means that the prediction of the two models (biased and adversarial) is the same. Therefore, the adversarial model is successful in fooling the SHAP model.
- (ii)
- SHAP—Sensor dataset: In the case of the Sensor dataset, the biased model is explaining that “Formality” is the major contributing role for this particular sample. However, Figure 9 shows that the adversarial model is successful in hiding the most important feature with the synthetic “unrelated_column” feature being the top feature under that adversarial model. Moreover, Fidelity is “1” which means the adversarial model is totally replicating the biased model on the same sample. Therefore, SHAP model was deceived here.
5.4.7. Completeness
- Scale the data between 0 to 1 using MinMax scaler [55].
- Generate an explanation for each autonomous driving sample and check its explanation.
- Perturb the top five features (change their values from 0 to 1).
- Check if the predicted class changes after perturbations.
- If class does not change even after substantial perturbations, we conclude that the XAI explanation was not complete, i.e., the original explanation is not relevant or degenerated.
5.5. Ablation Experiments
6. Limitations and Discussion
- (1)
- Multiclass XAI evaluation: In our paper, we primarily give complete treatment of evaluating XAI methods and their explanations for two datasets, with the main focus on the binary-class anomaly detection classification problem (although having some results for multiclass anomaly classification problems). However, we leave complete treatment of evaluating XAI explanations for multiclass classification for future works. For instance, identifying the different types of potential anomalies in VANETs may require further research. In this context, our proposed XAI evaluation methods can be also leveraged to test the actual contribution of different features for the multiclass anomaly detection problem. However, we leave a more thorough analysis of the multiclass XAI interpretation for autonomous driving for future research works.
- (2)
- Exploring our XAI evaluation framework on other benchmark datasets: We tested our XAI evaluation framework on two different datasets: the VeReMi [23] and Sensor [24,52] datasets. The VeReMi dataset focuses on detecting anomalies of an AV based on the position and speed of the AV while the Sensor dataset considers other communication-based data that the sensors mounted on AVs collect to detect anomalies. Nevertheless, there are other autonomous driving datasets (e.g., nuScenes [63], A2D2 [64], and Pass [65]) with other features that are not considered in our studied datasets. However, we emphasize that our proposed XAI evaluation framework can be leveraged to identify the effectiveness of XAI methods on these datasets and the contribution of different features for different types of datasets to enhance security of AVs. In addition, some of these datasets consider online anomaly detection. We highlight that our framework can be adapted to online anomaly detection, where our framework will accept instantaneous readings as inputs and provide classification and accompanying explanations and XAI evaluation metrics.
- (3)
- Reliability of current black-box XAI methods: Although XAI methods (particularly SHAP and LIME) can be used by auditors and safety drivers when gathering information and understanding logs from autonomous vehicles and accompanying networks, our work shows that the performance of SHAP and LIME would need to be improved to be used in real-world anomaly detection for autonomous driving systems. In particular, our work shows that it is desirable to enhance SHAP and LIME to be more robust against adversarial attacks. Furthermore, our analysis shows the need to validate the completeness of the explanations from SHAP and LIME before deploying them in reality in a safety-critical application like autonomous driving. To achieve such a goal, we shared our source codes to build on our framework with more models and datasets.
- (4)
- Leveraging GNN insights for enhancing XAI in autonomous vehicle networks: We used our XAI basically for the detection and evaluated the XAI methods as to whether they can be trusted, without considering the network-level aspects and dynamic topologies of vehicular communication networks. Leveraging insights of graph neural networks (GNNs) in capturing network topologies and optimizing communication networks, the XAI framework for anomaly detection in AVs could be enhanced by incorporating network-level information, exploring GNN-based XAI techniques to better capture relational aspects, adapting to dynamic network topologies, and enabling multi-objective optimization beyond anomaly detection, while evaluating the trustworthiness of the XAI methods [66].
7. Conclusions
Author Contributions
Funding
Institutional Review Board Statement
Informed Consent Statement
Data Availability Statement
Acknowledgments
Conflicts of Interest
Appendix A. Hyperparameters of AI Models
- (1)
- Decision tree (DT): Decision tree classifier was our first AI model that we experimented with on the datasets. The best hyperparameter choice for this model was when the criterion was set to “gini” for measuring impurity and the max depth of the tree was 50, which means the number of nodes from root node to the last leaf node was 50. The minimum number of samples required to be present in a leaf node was 4 () and the minimum number of samples required to split a node into two child nodes was 2 (). To have reproducibility and testing on the same data we set to 100 and the rest of the hyperparameters were set as default.
- (2)
- Random forest (RF): We next implemented RF classifier, where was set to 50. The number of estimators (number of decision trees) was set to 100, was set to 1, was the same as that of DT.
- (3)
- Deep neural network (DNN): We next show the best values for the DNN classifier. We set the dropout value to 0.1, and added one hidden layer with a size of 16 neurons with rectified linear unit (ReLU) as the activation function. Next, we set the optimization algorithm as ‘Adam’ and the loss function was set to “binary_crossentropy”. The epochs were set to 5, with a batch size of 100 to train the DNN model. We set the rest of the hyperparameters as given by the default configuration.
- (4)
- K-nearest neighbours (KNN): The parameters we set for KNN were as follows: the number of neighbors was set to 5 (), the leaf size was set to 30 to speed up the algorithm, the distance metric was set to “minkowski” to compute distance between neighbors, and the search algorithm for this model was “auto”.
- (5)
- Support vector machine (SVM): For the SVM AI classifier, we set the regularization parameter to 1 (C = 1). The kernel function was set to radial basis function (RBF). The kernel coefficient to control the decision boundary was set to “auto”. All other hyperparameters were used as they were provided by default.
- (6)
- Adaptive boosting (ADA): Finally, the hyperparameters we used for AdaBoost were as follows: “base_estimator” was set to ‘DecisionTreeClassifier’ with a maximum depth of 50. The number of estimators was 200 and the “learning_rate” was 1. The boosting algorithm was set to “SAMME.R” to converge faster and to achieve a lower test error.
Appendix B. Tuning of Hyperparameters for Our Datasets
| DT | RF | DNN | ||||||||||||||||
|---|---|---|---|---|---|---|---|---|---|---|---|---|---|---|---|---|---|---|
| max_depth | min_samples_leaf | max_depth | n_estimator | hidden_layers | Epochs | |||||||||||||
| 4 | 50 | 100 | 4 | 20 | 4 | 50 | 100 | 100 | 200 | 1 | 3 | 5 | 10 | |||||
| Acc | 0.67 | 0.79 | 0.79 | 0.79 | 0.75 | 0.67 | 0.80 | 0.80 | 0.80 | 0.80 | 0.40 | 0.67 | 0.57 | 0.67 | ||||
| Prec | 0.67 | 0.82 | 0.82 | 0.82 | 0.78 | 0.67 | 0.83 | 0.82 | 0.83 | 0.83 | 0.69 | 0.67 | 0.67 | 0.67 | ||||
| Rec | 1 | 0.87 | 0.87 | 0.87 | 0.86 | 1 | 0.88 | 0.87 | 0.88 | 0.88 | 0.19 | 1 | 0.70 | 1 | ||||
| F1 | 0.80 | 0.84 | 0.85 | 0.84 | 0.82 | 0.80 | 0.86 | 0.83 | 0.86 | 0.85 | 0.39 | 0.80 | 0.69 | 0.80 | ||||
| KNN | SVM | ADA | ||||||||||||||||
| n_neighbors | leaf_size | C | kernel | max_depth | Classifier | |||||||||||||
| 3 | 10 | 5 | 50 | 1 | 10 | rbf | linear | 4 | 50 | 100 | DT | DS | ||||||
| Acc | 0.78 | 0.75 | 0.78 | 0.78 | 0.67 | 0.67 | 0.67 | 0.67 | 0.70 | 0.79 | 0.79 | 0.79 | 0.87 | |||||
| Prec | 0.84 | 0.78 | 0.82 | 0.83 | 0.69 | 0.67 | 0.67 | 0.67 | 0.71 | 0.84 | 0.81 | 0.84 | 0.89 | |||||
| Rec | 0.84 | 0.88 | 0.85 | 0.85 | 0.92 | 1 | 0.92 | 1 | 0.93 | 0.85 | 0.82 | 0.85 | 0.89 | |||||
| F1 | 0.84 | 0.83 | 0.84 | 0.84 | 0.78 | 0.80 | 0.80 | 0.80 | 0.81 | 0.85 | 0.85 | 0.85 | 0.88 | |||||
| DT | RF | DNN | ||||||||||||||||
|---|---|---|---|---|---|---|---|---|---|---|---|---|---|---|---|---|---|---|
| max_depth | min_samples_leaf | max_depth | n_estimator | hidden_layers | Epochs | |||||||||||||
| 4 | 50 | 100 | 4 | 20 | 4 | 50 | 100 | 100 | 200 | 1 | 3 | 5 | 10 | |||||
| Acc | 0.81 | 0.85 | 0.86 | 0.85 | 0.84 | 0.82 | 0.91 | 0.91 | 0.91 | 0.90 | 0.55 | 0.49 | 0.55 | 0.49 | ||||
| Prec | 0.83 | 0.89 | 0.89 | 0.89 | 0.88 | 0.81 | 0.91 | 0.91 | 0.91 | 0.91 | 0.80 | 0.76 | 0.80 | 0.76 | ||||
| Rec | 0.94 | 0.92 | 0.93 | 0.92 | 0.93 | 0.99 | 0.98 | 0.98 | 0.98 | 0.97 | 0.55 | 0.49 | 0.55 | 0.49 | ||||
| F1 | 0.89 | 0.90 | 0.91 | 0.90 | 0.90 | 0.89 | 0.94 | 0.94 | 0.94 | 0.94 | 0.65 | 0.60 | 0.65 | 0.60 | ||||
| KNN | SVM | ADA | ||||||||||||||||
| n_neighbors | leaf_size | C | kernel | max_depth | Classifier | |||||||||||||
| 3 | 10 | 5 | 50 | 1 | 10 | rbf | linear | 4 | 50 | 100 | DT | DS | ||||||
| Acc | 0.83 | 0.84 | 0.83 | 0.82 | 0.88 | 0.81 | 0.88 | 0.81 | 0.99 | 0.85 | 0.85 | 0.99 | 1.00 | |||||
| Prec | 0.84 | 0.83 | 0.84 | 0.82 | 0.90 | 0.83 | 0.90 | 0.83 | 0.99 | 0.90 | 0.90 | 0.99 | 1.00 | |||||
| Rec | 0.96 | 0.99 | 0.96 | 0.99 | 0.95 | 0.94 | 0.95 | 0.94 | 1.00 | 0.91 | 0.91 | 1.00 | 1.00 | |||||
| F1 | 0.89 | 0.90 | 0.89 | 0.89 | 0.92 | 0.88 | 0.92 | 0.88 | 0.99 | 0.90 | 0.91 | 0.99 | 1.00 | |||||
References
- Bagloee, S.A.; Tavana, M.; Asadi, M.; Oliver, T. Autonomous vehicles: Challenges, opportunities, and future implications for transportation policies. J. Mod. Transp. 2016, 24, 284–303. [Google Scholar] [CrossRef]
- Chowdhury, A.; Karmakar, G.; Kamruzzaman, J.; Jolfaei, A.; Das, R. Attacks on Self-Driving Cars and Their Countermeasures: A Survey. IEEE Access 2020, 8, 207308–207342. [Google Scholar] [CrossRef]
- Bogdoll, D.; Nitsche, M.; Zöllner, J.M. Anomaly detection in autonomous driving: A survey. In Proceedings of the IEEE/CVF Conference on Computer Vision and Pattern Recognition, New Orleans, LA, USA, 19–24 June 2022; pp. 4488–4499. [Google Scholar]
- Ahmad, F.; Adnane, A.; Franqueira, V.N. A systematic approach for cyber security in vehicular networks. J. Comput. Commun. 2016, 4, 38–62. [Google Scholar] [CrossRef]
- Ercan, S.; Ayaida, M.; Messai, N. Misbehavior Detection for Position Falsification Attacks in VANETs Using Machine Learning. IEEE Access 2022, 10, 1893–1904. [Google Scholar] [CrossRef]
- Grover, J.; Prajapati, N.K.; Laxmi, V.; Gaur, M.S. Machine learning approach for multiple misbehavior detection in VANET. In Proceedings of the Advances in Computing and Communications: First International Conference, ACC 2011, Kochi, India, 22–24 July 2011; Proceedings, Part III 1. Springer: Berlin/Heidelberg, Germany, 2011; pp. 644–653. [Google Scholar]
- Dixit, P.; Bhattacharya, P.; Tanwar, S.; Gupta, R. Anomaly detection in autonomous electric vehicles using AI techniques: A comprehensive survey. Expert Syst. 2022, 39, e12754. [Google Scholar] [CrossRef]
- Nazat, S.; Abdallah, M. Anomaly Detection Framework for Securing Next Generation Networks of Platoons of Autonomous Vehicles in a Vehicle-to-Everything System. In Proceedings of the 9th ACM Cyber-Physical System Security Workshop, Melbourne, Australia, 10–14 July 2023; pp. 24–35. [Google Scholar]
- Javed, A.R.; Usman, M.; Rehman, S.U.; Khan, M.U.; Haghighi, M.S. Anomaly detection in automated vehicles using multistage attention-based convolutional neural network. IEEE Trans. Intell. Transp. Syst. 2020, 22, 4291–4300. [Google Scholar] [CrossRef]
- Zekry, A.; Sayed, A.; Moussa, M.; Elhabiby, M. Anomaly detection using IoT sensor-assisted ConvLSTM models for connected vehicles. In Proceedings of the 2021 IEEE 93rd Vehicular Technology Conference (VTC2021-Spring), Helsinki, Finland, 25–28 April 2021; pp. 1–6. [Google Scholar]
- Atakishiyev, S.; Salameh, M.; Yao, H.; Goebel, R. Explainable artificial intelligence for autonomous driving: A comprehensive overview and field guide for future research directions. arXiv 2021, arXiv:2112.11561. [Google Scholar]
- Mankodiya, H.; Obaidat, M.S.; Gupta, R.; Tanwar, S. Xai-av: Explainable artificial intelligence for trust management in autonomous vehicles. In Proceedings of the 2021 International Conference on Communications, Computing, Cybersecurity, and Informatics (CCCI), Beijing, China, 15–17 October 2021; pp. 1–5. [Google Scholar]
- Fernández Llorca, D.; Gómez, E. Trustworthy Autonomous Vehicles; EUR 30942 EN; Publications Office of the European Union: Luxembourg, 2021. [Google Scholar]
- Das, A.; Rad, P. Opportunities and challenges in explainable artificial intelligence (xai): A survey. arXiv 2020, arXiv:2006.11371. [Google Scholar]
- Dwivedi, R.; Dave, D.; Naik, H.; Singhal, S.; Omer, R.; Patel, P.; Qian, B.; Wen, Z.; Shah, T.; Morgan, G.; et al. Explainable AI (XAI): Core ideas, techniques, and solutions. ACM Comput. Surv. 2023, 55, 1–33. [Google Scholar] [CrossRef]
- Parkinson, S.; Ward, P.; Wilson, K.; Miller, J. Cyber threats facing autonomous and connected vehicles: Future challenges. IEEE Trans. Intell. Transp. Syst. 2017, 18, 2898–2915. [Google Scholar] [CrossRef]
- Madhav, A.S.; Tyagi, A.K. Explainable Artificial Intelligence (XAI): Connecting artificial decision-making and human trust in autonomous vehicles. In Proceedings of the Third International Conference on Computing, Communications, and Cyber-Security: IC4S 2021; Springer: Berlin/Heidelberg, Germany, 2022; pp. 123–136. [Google Scholar]
- Simkute, A.; Luger, E.; Jones, B.; Evans, M.; Jones, R. Explainability for experts: A design framework for making algorithms supporting expert decisions more explainable. J. Responsible Technol. 2021, 7, 100017. [Google Scholar] [CrossRef]
- Zheng, Q.; Wang, Z.; Zhou, J.; Lu, J. Shap-CAM: Visual Explanations for Convolutional Neural Networks Based on Shapley Value. In Proceedings of the Computer Vision–ECCV 2022: 17th European Conference, Tel Aviv, Israel, 23–27 October 2022; Proceedings, Part XII. Springer: Berlin/Heidelberg, Germany, 2022; pp. 459–474. [Google Scholar]
- Ribeiro, M.T.; Singh, S.; Guestrin, C. “Why should i trust you? ” Explaining the predictions of any classifier. In Proceedings of the 22nd ACM SIGKDD International Conference on Knowledge Discovery and Data Mining, San Francisco, CA, USA, 13–17 August 2016; pp. 1135–1144. [Google Scholar]
- Warnecke, A.; Arp, D.; Wressnegger, C.; Rieck, K. Evaluating Explanation Methods for Deep Learning in Security. In Proceedings of the 2020 IEEE European Symposium on Security and Privacy (EuroS&P), Genoa, Italy, 7–11 September 2020; pp. 158–174. [Google Scholar] [CrossRef]
- Slack, D.; Hilgard, S.; Jia, E.; Singh, S.; Lakkaraju, H. Fooling lime and shap: Adversarial attacks on post hoc explanation methods. In Proceedings of the AAAI/ACM Conference on AI, Ethics, and Society, New York, NY, USA, 7–9 February 2020; pp. 180–186. [Google Scholar]
- van der Heijden, R.W.; Lukaseder, T.; Kargl, F. VeReMi: A Dataset for Comparable Evaluation of Misbehavior Detection in VANETs. arXiv 2018, arXiv:1804.06701. [Google Scholar]
- Müter, M.; Groll, A.; Freiling, F.C. A structured approach to anomaly detection for in-vehicle networks. In Proceedings of the 2010 Sixth International Conference on Information Assurance and Security, Atlanta, GA, USA, 23–25 August 2010; pp. 92–98. [Google Scholar] [CrossRef]
- Lundberg, S.M.; Erion, G.; Chen, H.; DeGrave, A.; Prutkin, J.M.; Nair, B.; Katz, R.; Himmelfarb, J.; Bansal, N.; Lee, S.I. From local explanations to global understanding with explainable AI for trees. Nat. Mach. Intell. 2020, 2, 56–67. [Google Scholar] [CrossRef] [PubMed]
- Sivaramakrishnan Rajendar, V.K.K. Sensor Data Based Anomaly Detection in Autonomous Vehicles using Modified Convolutional Neural Network. Intell. Autom. Soft Comput. 2022, 32, 859–875. [Google Scholar] [CrossRef]
- Alsulami, A.A.; Abu Al-Haija, Q.; Alqahtani, A.; Alsini, R. Symmetrical Simulation Scheme for Anomaly Detection in Autonomous Vehicles Based on LSTM Model. Symmetry 2022, 14, 1450. [Google Scholar] [CrossRef]
- Van Wyk, F.; Wang, Y.; Khojandi, A.; Masoud, N. Real-Time Sensor Anomaly Detection and Identification in Automated Vehicles. IEEE Trans. Intell. Transp. Syst. 2020, 21, 1264–1276. [Google Scholar] [CrossRef]
- Pesé, M.D.; Schauer, J.W.; Li, J.; Shin, K.G. S2-CAN: Sufficiently Secure Controller Area Network. In Proceedings of the Annual Computer Security Applications Conference, ACSAC ’21, New York, NY, USA, 6–10 December 2021; pp. 425–438. [Google Scholar] [CrossRef]
- Prathiba, S.B.; Raja, G.; Anbalagan, S.; S, A.K.; Gurumoorthy, S.; Dev, K. A Hybrid Deep Sensor Anomaly Detection for Autonomous Vehicles in 6G-V2X Environment. IEEE Trans. Netw. Sci. Eng. 2023, 10, 1246–1255. [Google Scholar] [CrossRef]
- Hwang, C.; Lee, T. E-SFD: Explainable Sensor Fault Detection in the ICS Anomaly Detection System. IEEE Access 2021, 9, 140470–140486. [Google Scholar] [CrossRef]
- Nwakanma, C.I.; Ahakonye, L.A.C.; Njoku, J.N.; Odirichukwu, J.C.; Okolie, S.A.; Uzondu, C.; Ndubuisi Nweke, C.C.; Kim, D.S. Explainable Artificial Intelligence (XAI) for Intrusion Detection and Mitigation in Intelligent Connected Vehicles: A Review. Appl. Sci. 2023, 13, 1252. [Google Scholar] [CrossRef]
- Lundberg, H.; Mowla, N.I.; Abedin, S.F.; Thar, K.; Mahmood, A.; Gidlund, M.; Raza, S. Experimental Analysis of Trustworthy In-Vehicle Intrusion Detection System Using eXplainable Artificial Intelligence (XAI). IEEE Access 2022, 10, 102831–102841. [Google Scholar] [CrossRef]
- Raja, R.; Sarkar, B.K. Chapter 12 - An entropy-based hybrid feature selection approach for medical datasets. In Machine Learning, Big Data, and IoT for Medical Informatics; Intelligent Data-Centric Systems; Kumar, P., Kumar, Y., Tawhid, M.A., Eds.; Academic Press: Cambridge, MA, USA, 2021; pp. 201–214. [Google Scholar] [CrossRef]
- Gundu, R.; Maleki, M. Securing CAN Bus in Connected and Autonomous Vehicles Using Supervised Machine Learning Approaches. In Proceedings of the 2022 IEEE International Conference on Electro Information Technology (eIT), Mankato, MN, USA, 19–21 May 2022; pp. 42–46. [Google Scholar] [CrossRef]
- Ali Alheeti, K.M.; McDonald-Maier, K. Intelligent intrusion detection in external communication systems for autonomous vehicles. Syst. Sci. Control Eng. 2018, 6, 48–56. [Google Scholar] [CrossRef]
- Zhang, Q.; Shen, J.; Tan, M.; Zhou, Z.; Li, Z.; Chen, Q.A.; Zhang, H. Play the Imitation Game: Model Extraction Attack against Autonomous Driving Localization. In Proceedings of the 38th Annual Computer Security Applications Conference, Austin, TX, USA, 5–9 December 2022; pp. 56–70. [Google Scholar]
- Xiong, J.; Bi, R.; Zhao, M.; Guo, J.; Yang, Q. Edge-Assisted Privacy-Preserving Raw Data Sharing Framework for Connected Autonomous Vehicles. IEEE Wirel. Commun. 2020, 27, 24–30. [Google Scholar] [CrossRef]
- Feng, D.; Rosenbaum, L.; Dietmayer, K. Towards safe autonomous driving: Capture uncertainty in the deep neural network for lidar 3D vehicle detection. In Proceedings of the 2018 21st International Conference on Intelligent Transportation Systems (ITSC), Maui, HI, USA, 4–7 November 2018; pp. 3266–3273. [Google Scholar]
- Che, Z.; Purushotham, S.; Cho, K.; Sontag, D.; Liu, Y. Recurrent neural networks for multivariate time series with missing values. Sci. Rep. 2018, 8, 6085. [Google Scholar] [CrossRef]
- Arreche, O.; Guntur, T.R.; Roberts, J.W.; Abdallah, M. E-XAI: Evaluating Black-Box Explainable AI Frameworks for Network Intrusion Detection. IEEE Access 2024, 12, 23954–23988. [Google Scholar] [CrossRef]
- Gao, C.; Wang, G.; Shi, W.; Wang, Z.; Chen, Y. Autonomous driving security: State of the art and challenges. IEEE Internet Things J. 2021, 9, 7572–7595. [Google Scholar] [CrossRef]
- Guidotti, R.; Monreale, A.; Ruggieri, S.; Turini, F.; Giannotti, F.; Pedreschi, D. A survey of methods for explaining black box models. ACM Comput. Surv. CSUR 2018, 51, 1–42. [Google Scholar] [CrossRef]
- Lipton, Z.C. The Mythos of Model Interpretability. arXiv 2017, arXiv:1606.03490. [Google Scholar]
- Mahbooba, B.; Timilsina, M.; Sahal, R.; Serrano, M. Explainable artificial intelligence (XAI) to enhance trust management in intrusion detection systems using decision tree model. Complexity 2021, 2021, 6634811. [Google Scholar] [CrossRef]
- Dilmegani, C. Explainable AI (XAI) in 2023: Guide to Enterprise-Ready AI. Available online: https://research.aimultiple.com/xai/ (accessed on 22 April 2024).
- Holliday, D.; Wilson, S.; Stumpf, S. User Trust in Intelligent Systems: A Journey Over Time. In Proceedings of the 21st International Conference on Intelligent User Interfaces, IUI ’16, Sonoma, CA, USA, 7–10 March 2016; pp. 164–168. [Google Scholar] [CrossRef]
- Israelsen, B.W.; Ahmed, N.R. “Dave…I Can Assure You…That It’s Going to Be All Right…” A Definition, Case for, and Survey of Algorithmic Assurances in Human-Autonomy Trust Relationships. ACM Comput. Surv. 2019, 51, 113. [Google Scholar] [CrossRef]
- Martinho, A.; Herber, N.; Kroesen, M.; Chorus, C. Ethical issues in focus by the autonomous vehicles industry. Transp. Rev. 2021, 41, 556–577. [Google Scholar] [CrossRef]
- Dong, J.; Chen, S.; Miralinaghi, M.; Chen, T.; Li, P.; Labi, S. Why did the AI make that decision? Towards an explainable artificial intelligence (XAI) for autonomous driving systems. Transp. Res. Part C Emerg. Technol. 2023, 156, 104358. [Google Scholar] [CrossRef]
- Capuano, N.; Fenza, G.; Loia, V.; Stanzione, C. Explainable Artificial Intelligence in CyberSecurity: A Survey. IEEE Access 2022, 10, 93575–93600. [Google Scholar] [CrossRef]
- Santini, S.; Salvi, A.; Valente, A.; Pescapè, A.; Segata, M.; Lo Cigno, R. A Consensus-based Approach for Platooning with Inter-Vehicular Communications. In Proceedings of the 2015 IEEE Conference on Computer Communications (INFOCOM), Hong Kong, China, 26 April–1 May 2015. [Google Scholar] [CrossRef]
- Arreche, O.; Guntur, T.; Abdallah, M. Xai-Ids: Towards Proposing an Explainable Artificial Intelligence Framework for Enhancing Network Intrusion Detection Systems. Appl. Sci. 2024, 14, 4170. [Google Scholar] [CrossRef]
- Chollet, F. Keras. 2015. Available online: https://github.com/fchollet/keras (accessed on 2 March 2024).
- Pedregosa, F.; Varoquaux, G.; Gramfort, A.; Michel, V.; Thirion, B.; Grisel, O.; Blondel, M.; Prettenhofer, P.; Weiss, R.; Dubourg, V.; et al. Scikit-learn: Machine Learning in Python. J. Mach. Learn. Res. 2011, 12, 2825–2830. [Google Scholar]
- Bhattacharya, A. Understand the Workings of SHAP and Shapley Values Used in Explainable AI. Available online: https://shorturl.at/kloHT (accessed on 18 April 2024).
- Molnar, C. Interpretable Machine Learning. 2019. Available online: https://christophm.github.io/interpretable-ml-book/ (accessed on 25 March 2024).
- Tang, C.; Luktarhan, N.; Zhao, Y. SAAE-DNN: Deep learning method on intrusion detection. Symmetry 2020, 12, 1695. [Google Scholar] [CrossRef]
- Waskle, S.; Parashar, L.; Singh, U. Intrusion detection system using PCA with random forest approach. In Proceedings of the 2020 International Conference on Electronics and Sustainable Communication Systems (ICESC), Coimbatore, India, 2–4 July 2020; pp. 803–808. [Google Scholar]
- Yulianto, A.; Sukarno, P.; Suwastika, N.A. Improving adaboost-based intrusion detection system (IDS) performance on CIC IDS 2017 dataset. J. Physics Conf. Ser. 2019, 1192, 012018. [Google Scholar] [CrossRef]
- Li, W.; Yi, P.; Wu, Y.; Pan, L.; Li, J. A new intrusion detection system based on KNN classification algorithm in wireless sensor network. J. Electr. Comput. Eng. 2014, 2014, 240217. [Google Scholar] [CrossRef]
- Tao, P.; Sun, Z.; Sun, Z. An improved intrusion detection algorithm based on GA and SVM. IEEE Access 2018, 6, 13624–13631. [Google Scholar] [CrossRef]
- Caesar, H.; Bankiti, V.; Lang, A.H.; Vora, S.; Liong, V.E.; Xu, Q.; Krishnan, A.; Pan, Y.; Baldan, G.; Beijbom, O. nuScenes: A multimodal dataset for autonomous driving. arXiv 2020, arXiv:1903.11027. [Google Scholar]
- Geyer, J.; Kassahun, Y.; Mahmudi, M.; Ricou, X.; Durgesh, R.; Chung, A.S.; Hauswald, L.; Pham, V.H.; Mühlegg, M.; Dorn, S.; et al. A2D2: Audi Autonomous Driving Dataset. arXiv 2020, arXiv:2004.06320. [Google Scholar]
- Hu, Z.; Shen, J.; Guo, S.; Zhang, X.; Zhong, Z.; Chen, Q.A.; Li, K. Pass: A system-driven evaluation platform for autonomous driving safety and security. In Proceedings of the NDSS Workshop on Automotive and Autonomous Vehicle Security (AutoSec), Virtual, 24 April 2022. [Google Scholar]
- Tam, P.; Song, I.; Kang, S.; Ros, S.; Kim, S. Graph Neural Networks for Intelligent Modelling in Network Management and Orchestration: A Survey on Communications. Electronics 2022, 11, 3371. [Google Scholar] [CrossRef]







| Sensor Name | Normal Data Range | Description |
|---|---|---|
| Formality | 1–10 bit | Checks every message for if it is maintaining correct formality |
| Location | 0/1 | Checks if the message reached the destined location |
| Frequency | 1–10 Hz | Checks the interval time of messages |
| Speed | 50–90 mph | Checking if the AV is within the speed limit (highway) |
| Correlation | 0/1 | Checks if several messages adhere to defined specification |
| Lane Alignment | 1–3 | Checks if the AV is in the lane of the platoon |
| Headway Time | 0.3–0.95 s | Checks if the AV maintains the headway time range |
| Protocol | 1–10,000 | Checks for the correct order of communication messages |
| Plausibility | 50–200% | Checks if the data are plausible (relative size difference between two consecutive payloads) |
| Consistency | 0/1 | Checks if all the parts of the AV are delivering consistent information about an incident |
| Column | Description |
|---|---|
| pos_x | The x-coordinate of the vehicle position |
| pos_y | The y-coordinate of the vehicle position |
| pos_z | The z-coordinate of the vehicle position |
| spd_x | The speed of the vehicle in x-direction |
| spd_y | The speed of the vehicle in y-direction |
| spd_z | The speed of the vehicle in z-direction |
| Parameter | VeReMi Dataset | Sensor Dataset |
|---|---|---|
| Labels | 5 | 2 |
| Number of Features | 6 | 10 |
| Dataset Size | 993,834 | 10,000 |
| Training Sample | 695,684 | 7000 |
| Testing Sample | 298,150 | 3000 |
| Normal Samples No. | 664,131 | 5000 |
| Anomalous Samples No. | 329,703 | 5000 |
| XAI Methods | DT | RF | DNN | KNN | SVM | ADA |
|---|---|---|---|---|---|---|
| SHAP | 0.67 | 0.33 | 0.67 | 0.33 | 1.00 | 1.00 |
| LIME | 0.67 | 0.67 | 0.33 | 0.33 | 0.67 | 0.67 |
| XAI Methods | DT | RF | DNN | KNN | SVM | ADA |
|---|---|---|---|---|---|---|
| SHAP | 0.33 | 0.33 | 1.00 | 1.00 | 0.67 | 1.00 |
| LIME | 0.33 | 0.67 | 0.67 | 1.00 | 0.33 | 0.33 |
| XAI Methods | DT | RF | DNN | KNN | SVM | ADA |
|---|---|---|---|---|---|---|
| SHAP | 0.67 | 1.00 | 1.00 | 0.67 | 1.00 | 0.67 |
| LIME | 0.67 | 0.67 | 1.00 | 0.67 | 0.67 | 0.67 |
| XAI Methods | DT | RF | DNN | KNN | SVM | ADA |
|---|---|---|---|---|---|---|
| SHAP | 0.40 | 0.40 | 1.00 | 1.00 | 1.00 | 1.00 |
| LIME | 0.60 | 0.40 | 0.80 | 0.20 | 0.60 | 0.80 |
| XAI Model | # Samples | DT | RF | DNN | KNN | SVM | ADA |
|---|---|---|---|---|---|---|---|
| SHAP | 500 | 0.87 | 1.87 | 0.29 | 2.71 | 60.18 | 1.30 |
| 1 k | 3.26 | 6.80 | 0.47 | 10.53 | 264.45 | 4.85 | |
| 10 k | 401.91 | 662.81 | 22.53 | 1259.01 | 28,087 | 437.75 | |
| 50 k | 7159.65 | 18,735.48 | NA | 29,902.33 | 26,201.26 | 14,101.28 | |
| LIME | 500 | 0.11 | 2.49 | 2.9 | 3.45 | 72.96 | 0.45 |
| 1 k | 0.22 | 2.96 | 7.71 | 2.91 | 84.62 | 1.04 | |
| 10 k | 4.18 | 33.03 | 57.88 | 55.11 | NA | 15.39 | |
| 50 k | 20.56 | 136 | 289.80 | 197.4 | NA | 70.9 |
| XAI Model | # Samples | DT | RF | DNN | KNN | SVM | ADA |
|---|---|---|---|---|---|---|---|
| SHAP | 500 | 0.72 | 1.84 | 0.13 | 2.47 | 19.09 | 1.13 |
| 1 k | 2.97 | 6.29 | 0.15 | 9.06 | 93.66 | 4.15 | |
| 10 k | 219.66 | 535.31 | 6.98 | 929.98 | 6711.26 | 477.23 | |
| 50 k | 8054.65 | 13,256.81 | NA | 22,128.2 | 271,275 | 8828.6 | |
| LIME | 500 | 0.12 | 2.48 | 4.65 | 4.94 | 25.53 | 1.04 |
| 1 k | 0.43 | 3.11 | 5.66 | 5.16 | 24.71 | 0.65 | |
| 10 k | 27.24 | 43.1 | 95.90 | 89 | 379.38 | 18.88 | |
| 50 k | 27.23 | 131.88 | 501.67 | 287.75 | NA | 56.41 |
| XAI Models | No. of Samples | DT | RF | DNN | SVM | KNN | ADA |
|---|---|---|---|---|---|---|---|
| SHAP | 500 | 0.15 | 0.67 | 169.3 | 588 | 369 | 0.6 |
| 1 k | 34 | 143 | 692 | 1915 | 1209 | 104 | |
| 3 k | 409 | 1327 | 6057 | 22,677 | 12,721 | 1202 | |
| LIME | 500 | 0.27 | 0.84 | 3.31 | 5.36 | 3.42 | 0.65 |
| 1 k | 0.77 | 2.17 | 7.32 | 10.75 | 7.19 | 1.71 | |
| 3 k | 2.4 | 6.51 | 20.13 | 32.77 | 21.97 | 5.07 |
| XAI Methods | Benign (0) | Anomalous (1) |
|---|---|---|
| SHAP | 80% | 90% |
| LIME | 90% | 90% |
| XAI Methods | Benign (0) | Anomalous (1) |
|---|---|---|
| SHAP | 100% | 90% |
| LIME | 100% | 80% |
| XAI Models | Descriptive Accuracy | Sparsity | Stability | Efficiency | Robustness | Completeness | Total Score |
|---|---|---|---|---|---|---|---|
| SHAP | 1 | 1 | 1 | 0 | 0 | 0 | 3 |
| LIME | 0 | 0 | 0 | 1 | 1 | 0 | 2 |
| XAI Method | DT | RF | DNN | KNN | SVM | ADA | Average | |
|---|---|---|---|---|---|---|---|---|
| SHAP | Acc | 0.75 | 0.80 | 0.61 | 0.78 | 0.67 | 0.69 | 0.71 |
| Acc | 0.75 | ✗ | 0.61 | 0.78 | 0.67 | 0.69 | 0.70 | |
| LIME | Acc | 0.75 | 0.80 | 0.61 | 0.78 | 0.67 | 0.69 | 0.71 |
| Acc | 0.75 | ✗ | 0.61 | 0.78 | 0.67 | 0.69 | 0.70 |
| XAI Method | DT | RF | DNN | KNN | SVM | ADA | Average | |
|---|---|---|---|---|---|---|---|---|
| SHAP | Acc | 0.85 | 0.90 | 0.55 | 0.84 | 0.88 | 0.99 | 0.83 |
| Acc | 0.85 | 0.90 | 0.55 | 0.84 | 0.88 | ✗ | 0.80 | |
| LIME | Acc | 0.85 | 0.90 | 0.55 | 0.84 | 0.88 | 0.99 | 0.83 |
| Acc | 0.85 | 0.90 | 0.55 | 0.84 | 0.88 | ✗ | 0.80 |
| Evaluation Metric | Normalized | Not Normalized | ||||||||||
|---|---|---|---|---|---|---|---|---|---|---|---|---|
| DT | RF | DNN | KNN | SVM | ADA | DT | RF | DNN | KNN | SVM | ADA | |
| Acc | 0.78 | 0.80 | 0.65 | 0.78 | 0.67 | 0.73 | 0.79 | 0.80 | 0.33 | 0.79 | 0.67 | 0.73 |
| Prec | 0.82 | 0.82 | 0.67 | 0.82 | 0.67 | 0.75 | 0.82 | 0.82 | 0.33 | 0.83 | 0.69 | 0.75 |
| Rec | 0.87 | 0.91 | 0.96 | 0.85 | 1.00 | 0.91 | 0.87 | 0.91 | 1.00 | 0.85 | 0.79 | 0.91 |
| F1 | 0.84 | 0.86 | 0.79 | 0.84 | 0.80 | 0.82 | 0.84 | 0.86 | 0.50 | 0.84 | 0.79 | 0.82 |
| Evaluation Metric | Normalized | Not Normalized | ||||||||||
|---|---|---|---|---|---|---|---|---|---|---|---|---|
| DT | RF | DNN | KNN | SVM | ADA | DT | RF | DNN | KNN | SVM | ADA | |
| Acc | 0.84 | 0.90 | 0.49 | 0.82 | 0.83 | 1.00 | 0.85 | 0.91 | 0.67 | 0.78 | 0.83 | 1.00 |
| Prec | 0.89 | 0.90 | 0.76 | 0.82 | 0.85 | 1.00 | 0.89 | 0.91 | 0.79 | 0.79 | 0.85 | 1.00 |
| Rec | 0.91 | 0.97 | 0.49 | 0.99 | 0.95 | 1.00 | 0.92 | 0.98 | 0.77 | 0.96 | 0.94 | 1.00 |
| F1 | 0.90 | 0.94 | 0.60 | 0.90 | 0.89 | 1.00 | 0.90 | 0.95 | 0.78 | 0.87 | 0.89 | 1.00 |
Disclaimer/Publisher’s Note: The statements, opinions and data contained in all publications are solely those of the individual author(s) and contributor(s) and not of MDPI and/or the editor(s). MDPI and/or the editor(s) disclaim responsibility for any injury to people or property resulting from any ideas, methods, instructions or products referred to in the content. |
© 2024 by the authors. Licensee MDPI, Basel, Switzerland. This article is an open access article distributed under the terms and conditions of the Creative Commons Attribution (CC BY) license (https://creativecommons.org/licenses/by/4.0/).
Share and Cite
Nazat, S.; Arreche, O.; Abdallah, M. On Evaluating Black-Box Explainable AI Methods for Enhancing Anomaly Detection in Autonomous Driving Systems. Sensors 2024, 24, 3515. https://doi.org/10.3390/s24113515
Nazat S, Arreche O, Abdallah M. On Evaluating Black-Box Explainable AI Methods for Enhancing Anomaly Detection in Autonomous Driving Systems. Sensors. 2024; 24(11):3515. https://doi.org/10.3390/s24113515
Chicago/Turabian StyleNazat, Sazid, Osvaldo Arreche, and Mustafa Abdallah. 2024. "On Evaluating Black-Box Explainable AI Methods for Enhancing Anomaly Detection in Autonomous Driving Systems" Sensors 24, no. 11: 3515. https://doi.org/10.3390/s24113515
APA StyleNazat, S., Arreche, O., & Abdallah, M. (2024). On Evaluating Black-Box Explainable AI Methods for Enhancing Anomaly Detection in Autonomous Driving Systems. Sensors, 24(11), 3515. https://doi.org/10.3390/s24113515


