
SGK-Net: A Novel Navigation Scene Graph Generation Network

Abstract
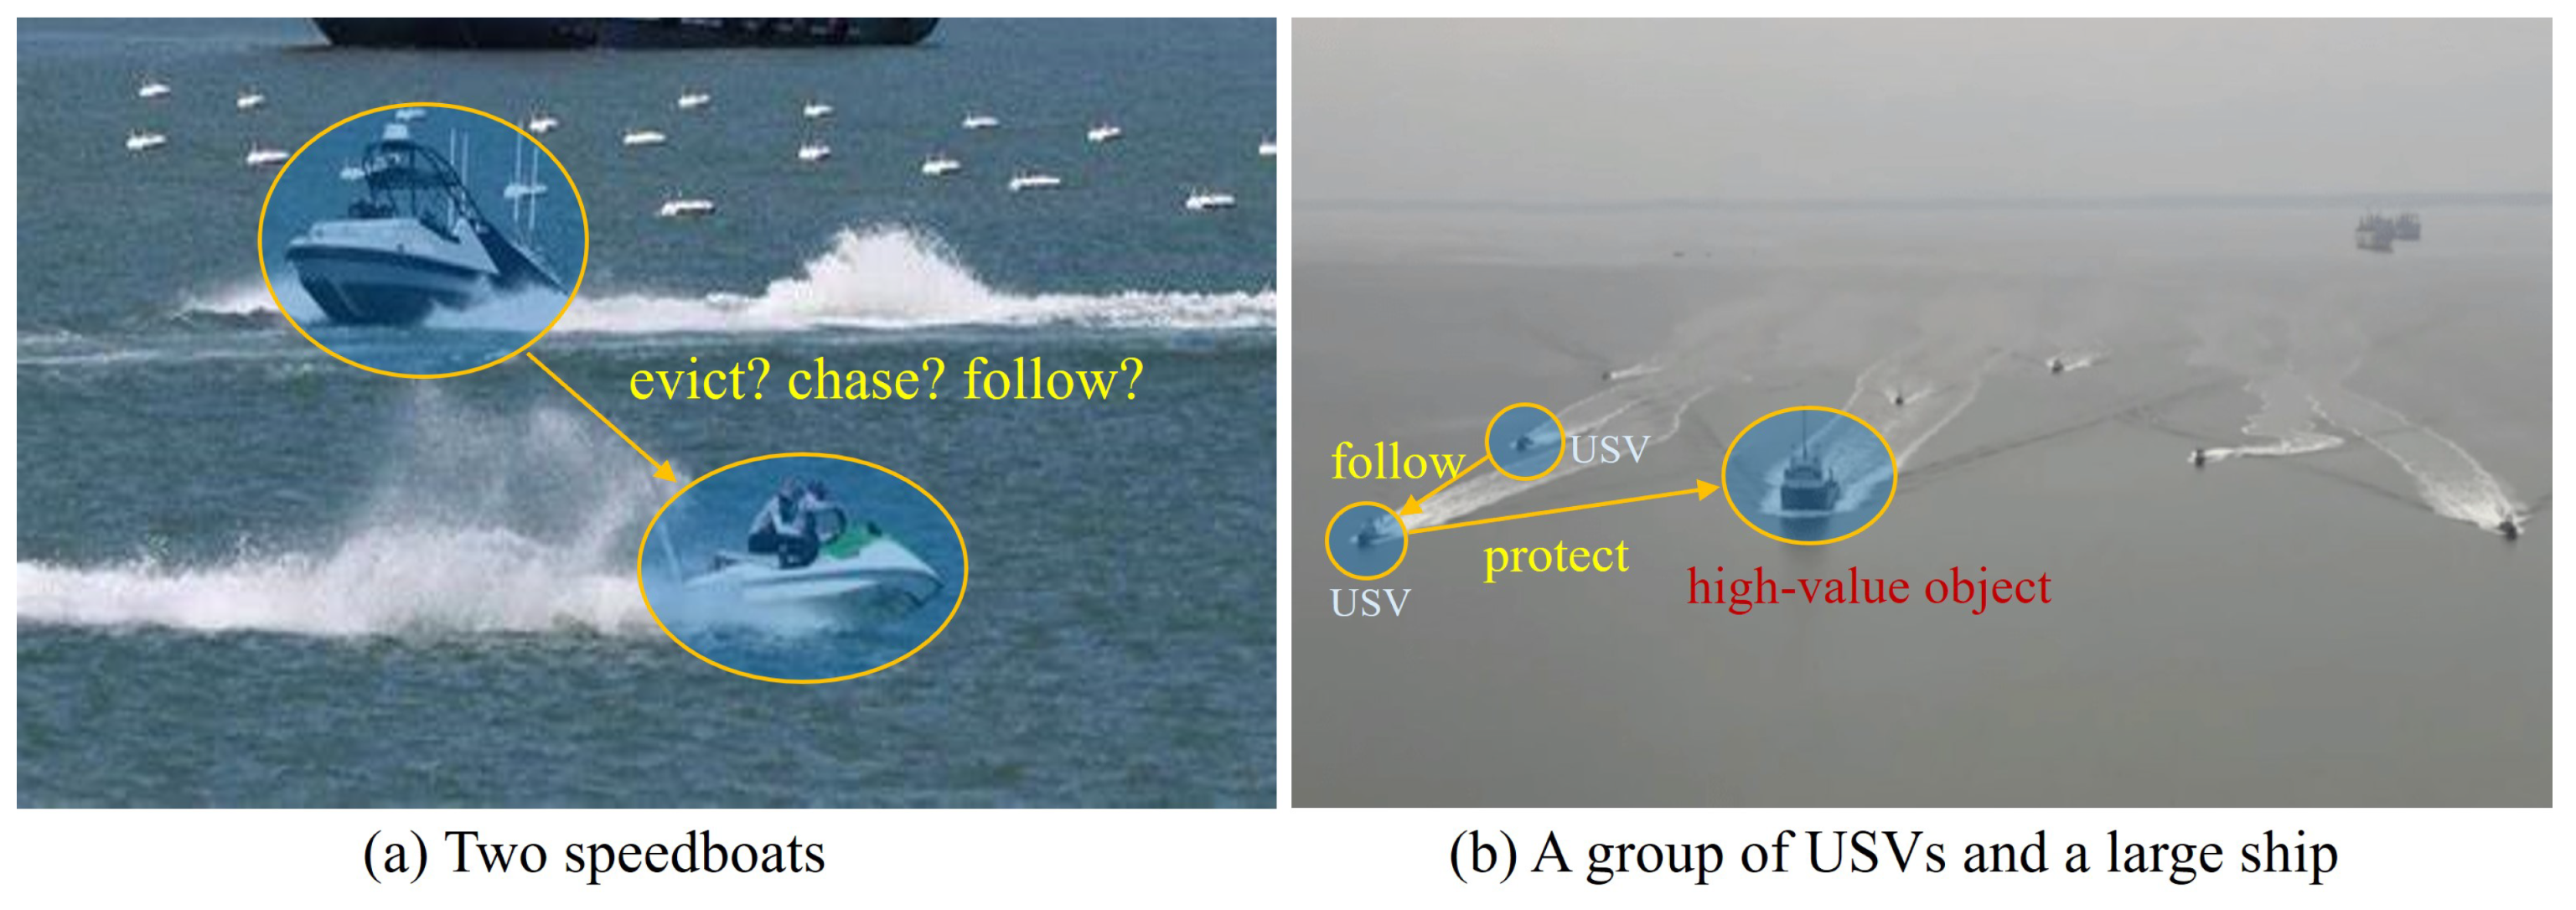
1. Introduction
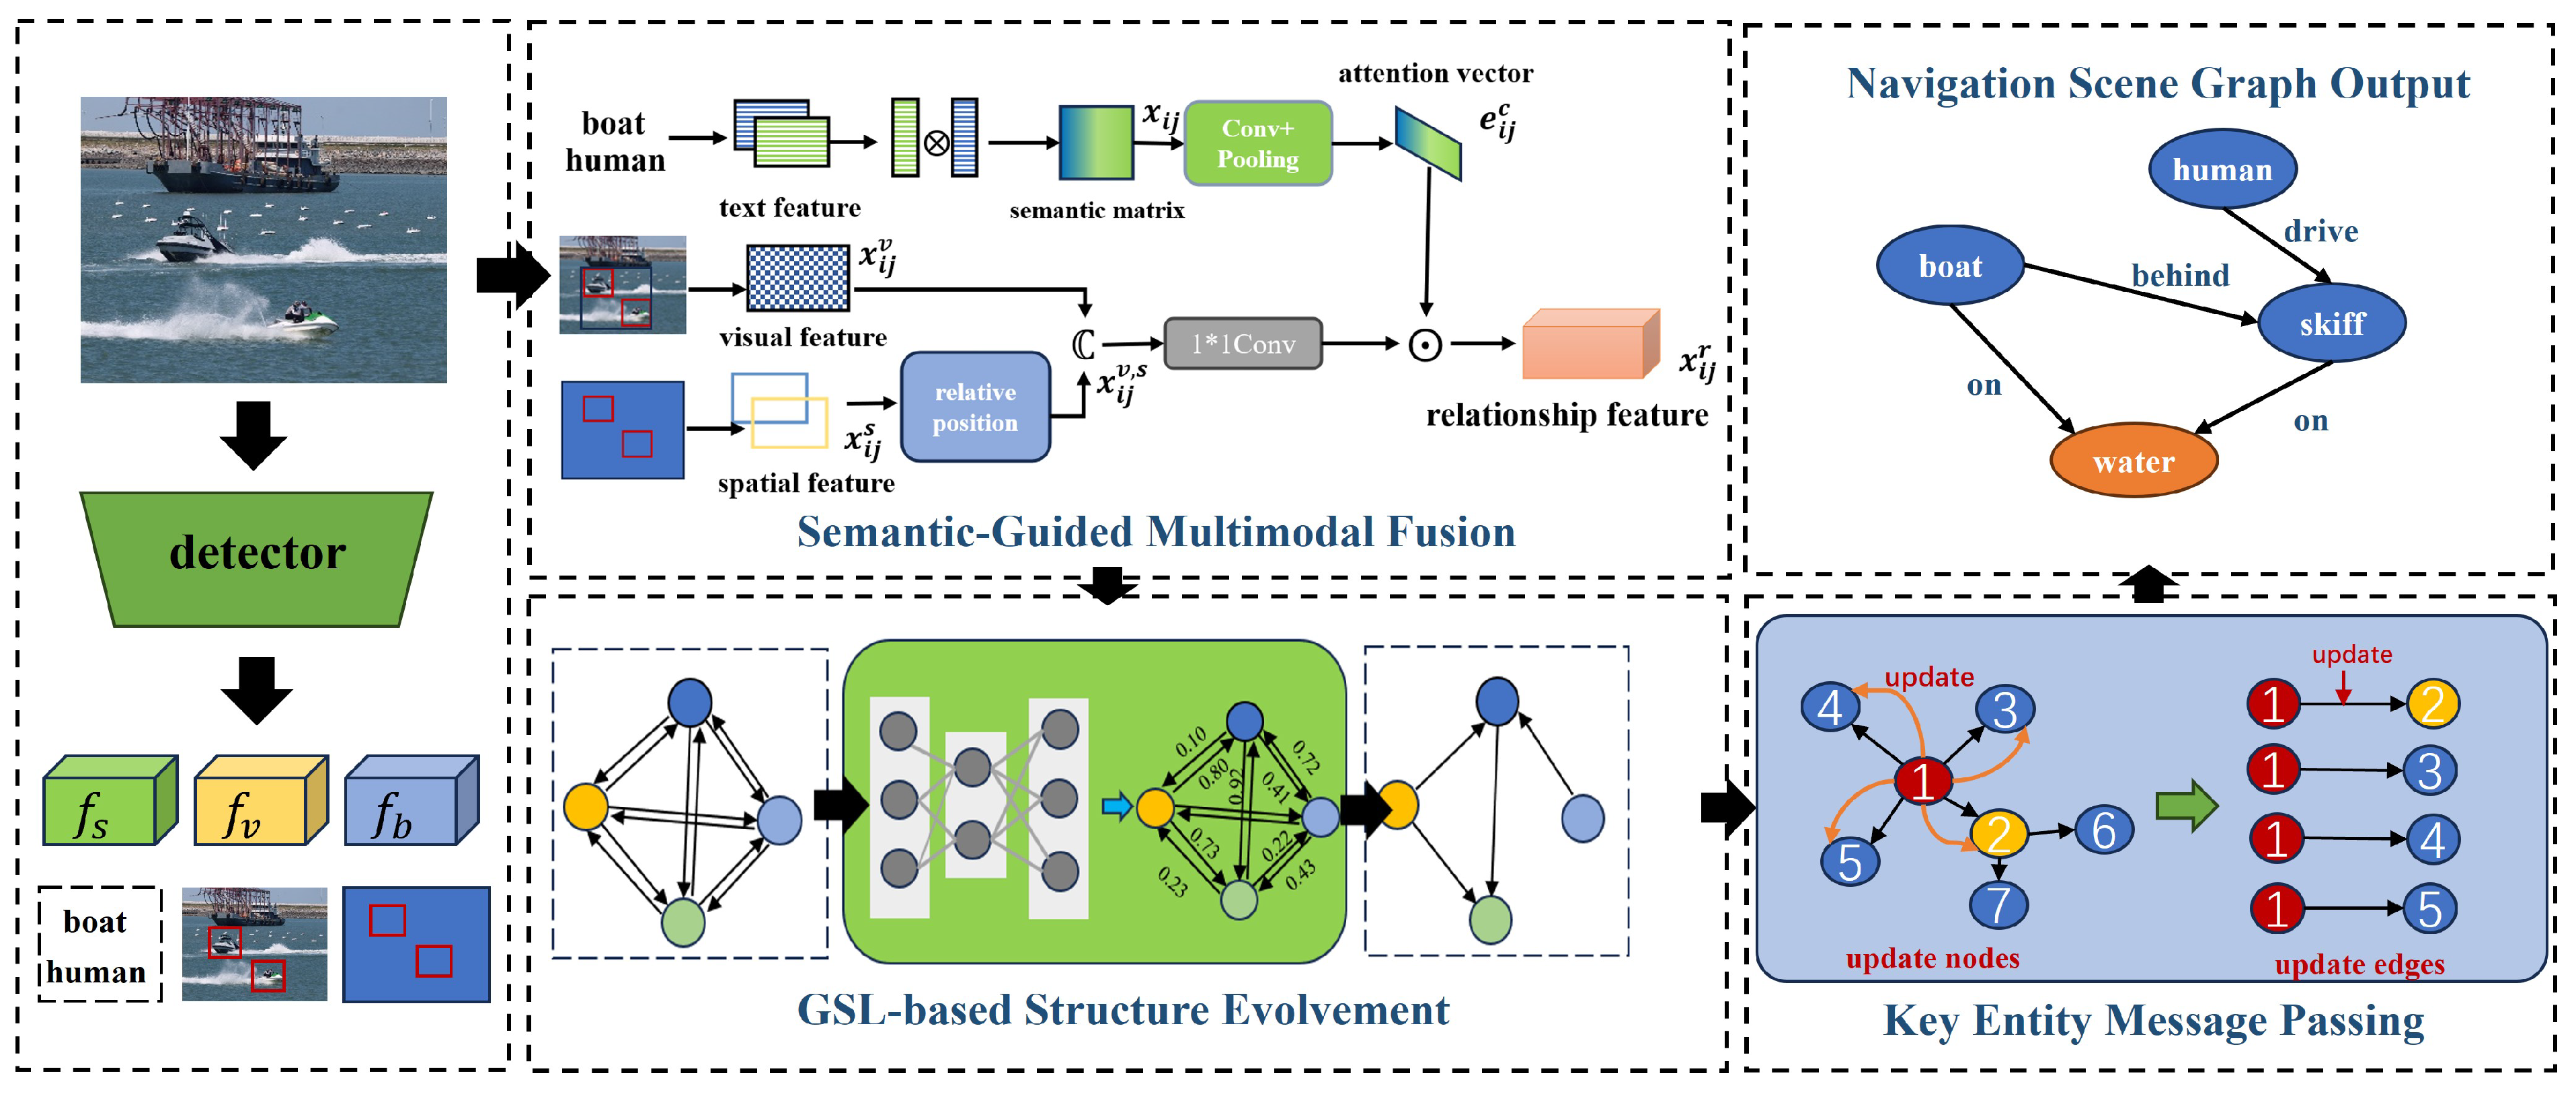
- To address the challenge of complex and diverse relationships among target entities in the current SGG process, making it difficult to obtain the key relationships that are contextually relevant, we propose the Semantic-Guided Multimodal Fusion (SGMF) module. This module leverages prior information on relationship semantics to fuse multimodal information and construct relationship features, allowing for weighted relationships between entities and providing clarity on the key relationships among target entities in the current context.
- To tackle the issue of redundancy in relationship features during the current SGG process, we propose the Graph Structure Learning-based Structure Evolution (GSLSE) module. This module utilizes graph structure learning to reduce redundancy in relationship features and optimize the computational complexity in subsequent contextual message passing.
- To address the issue of unstable SGG caused by noise interference in the context information relied upon for relational reasoning, this paper proposes the Key Entity Message Passing (KEMP) module. It effectively utilizes context information to refine the relational features and reduce noise interference from non-key nodes.
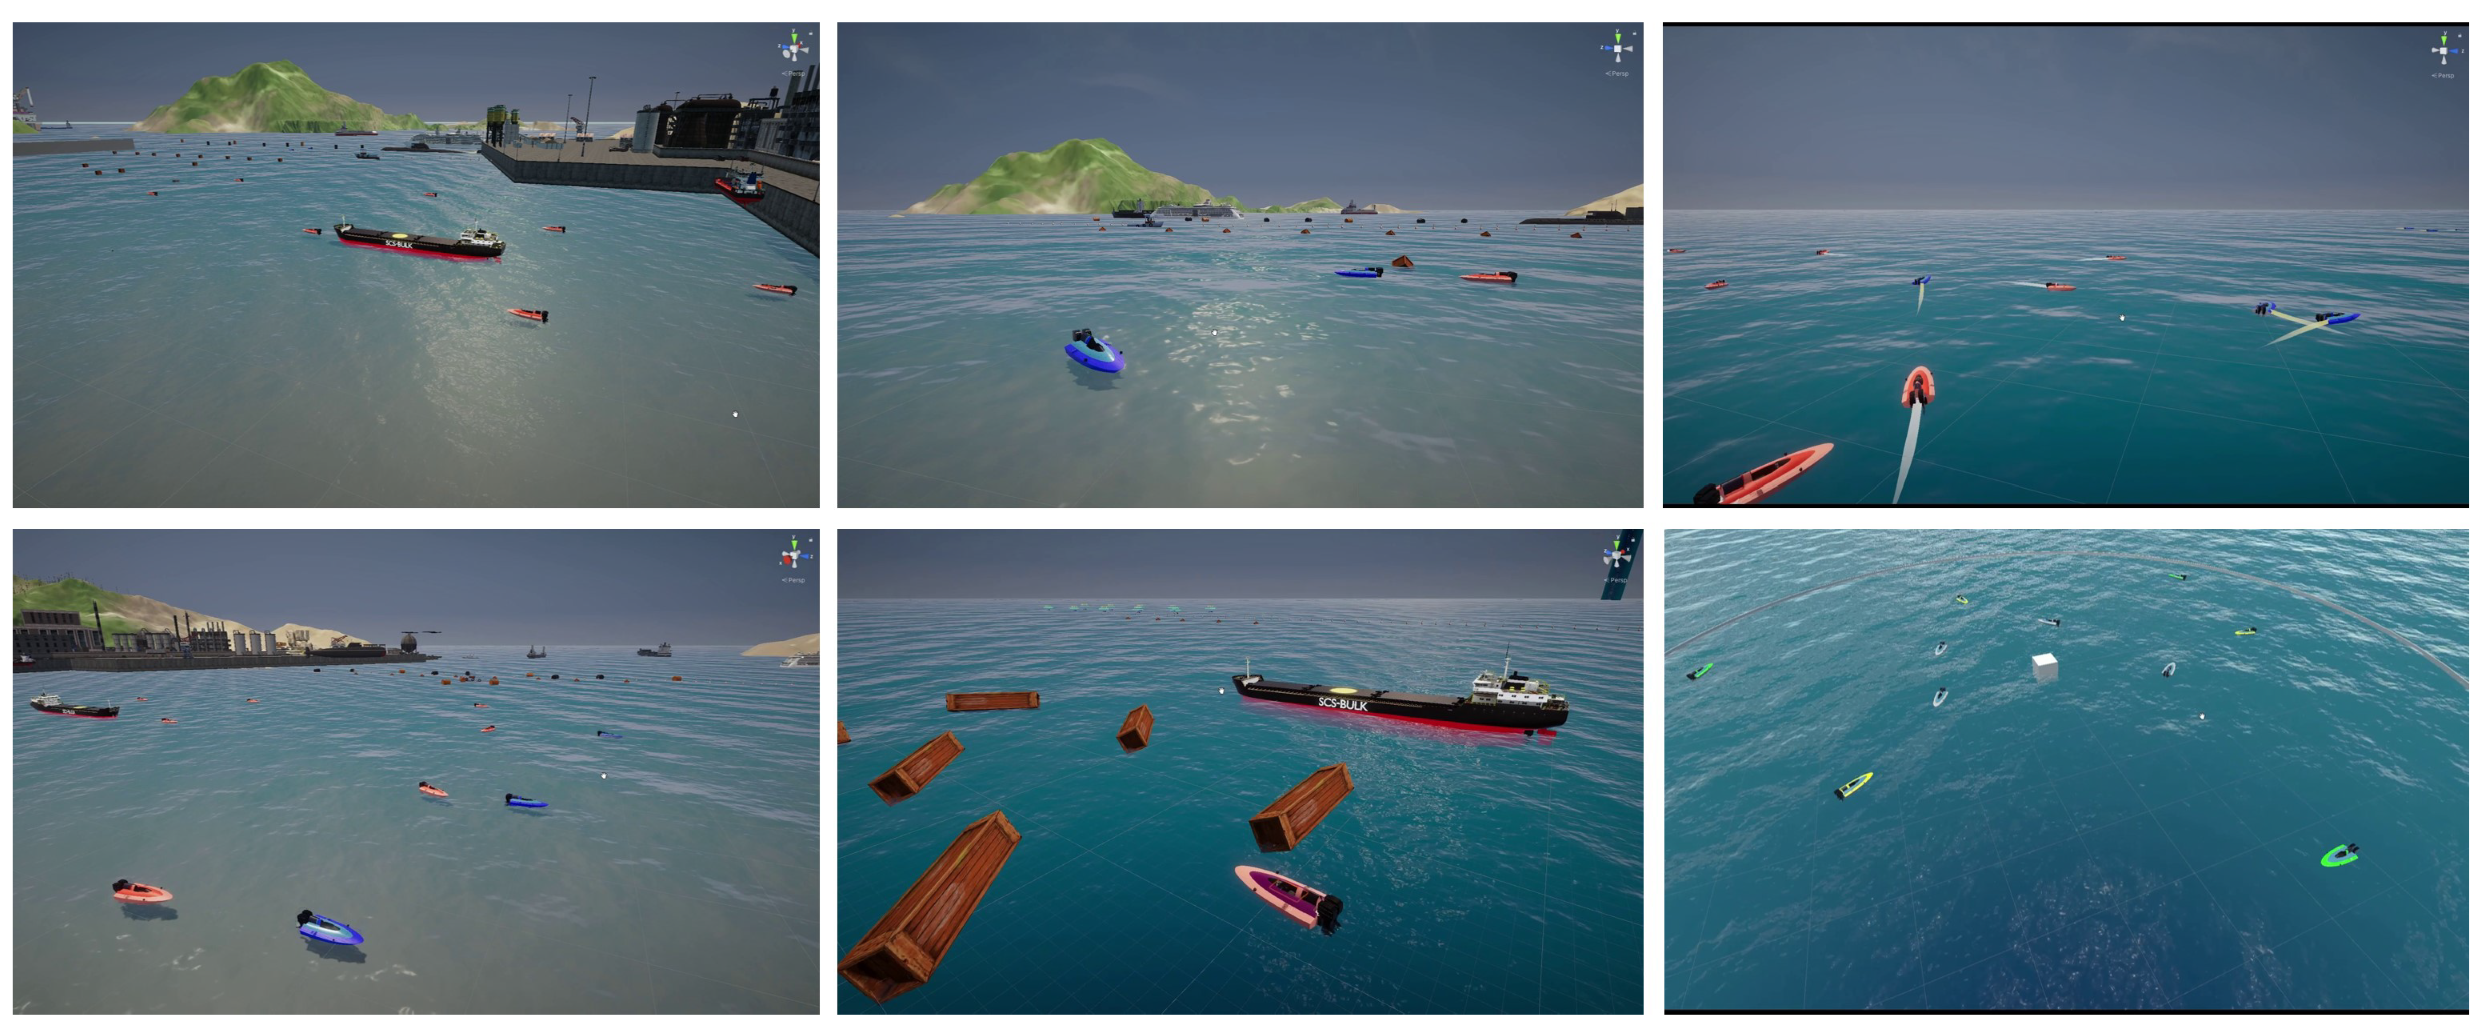
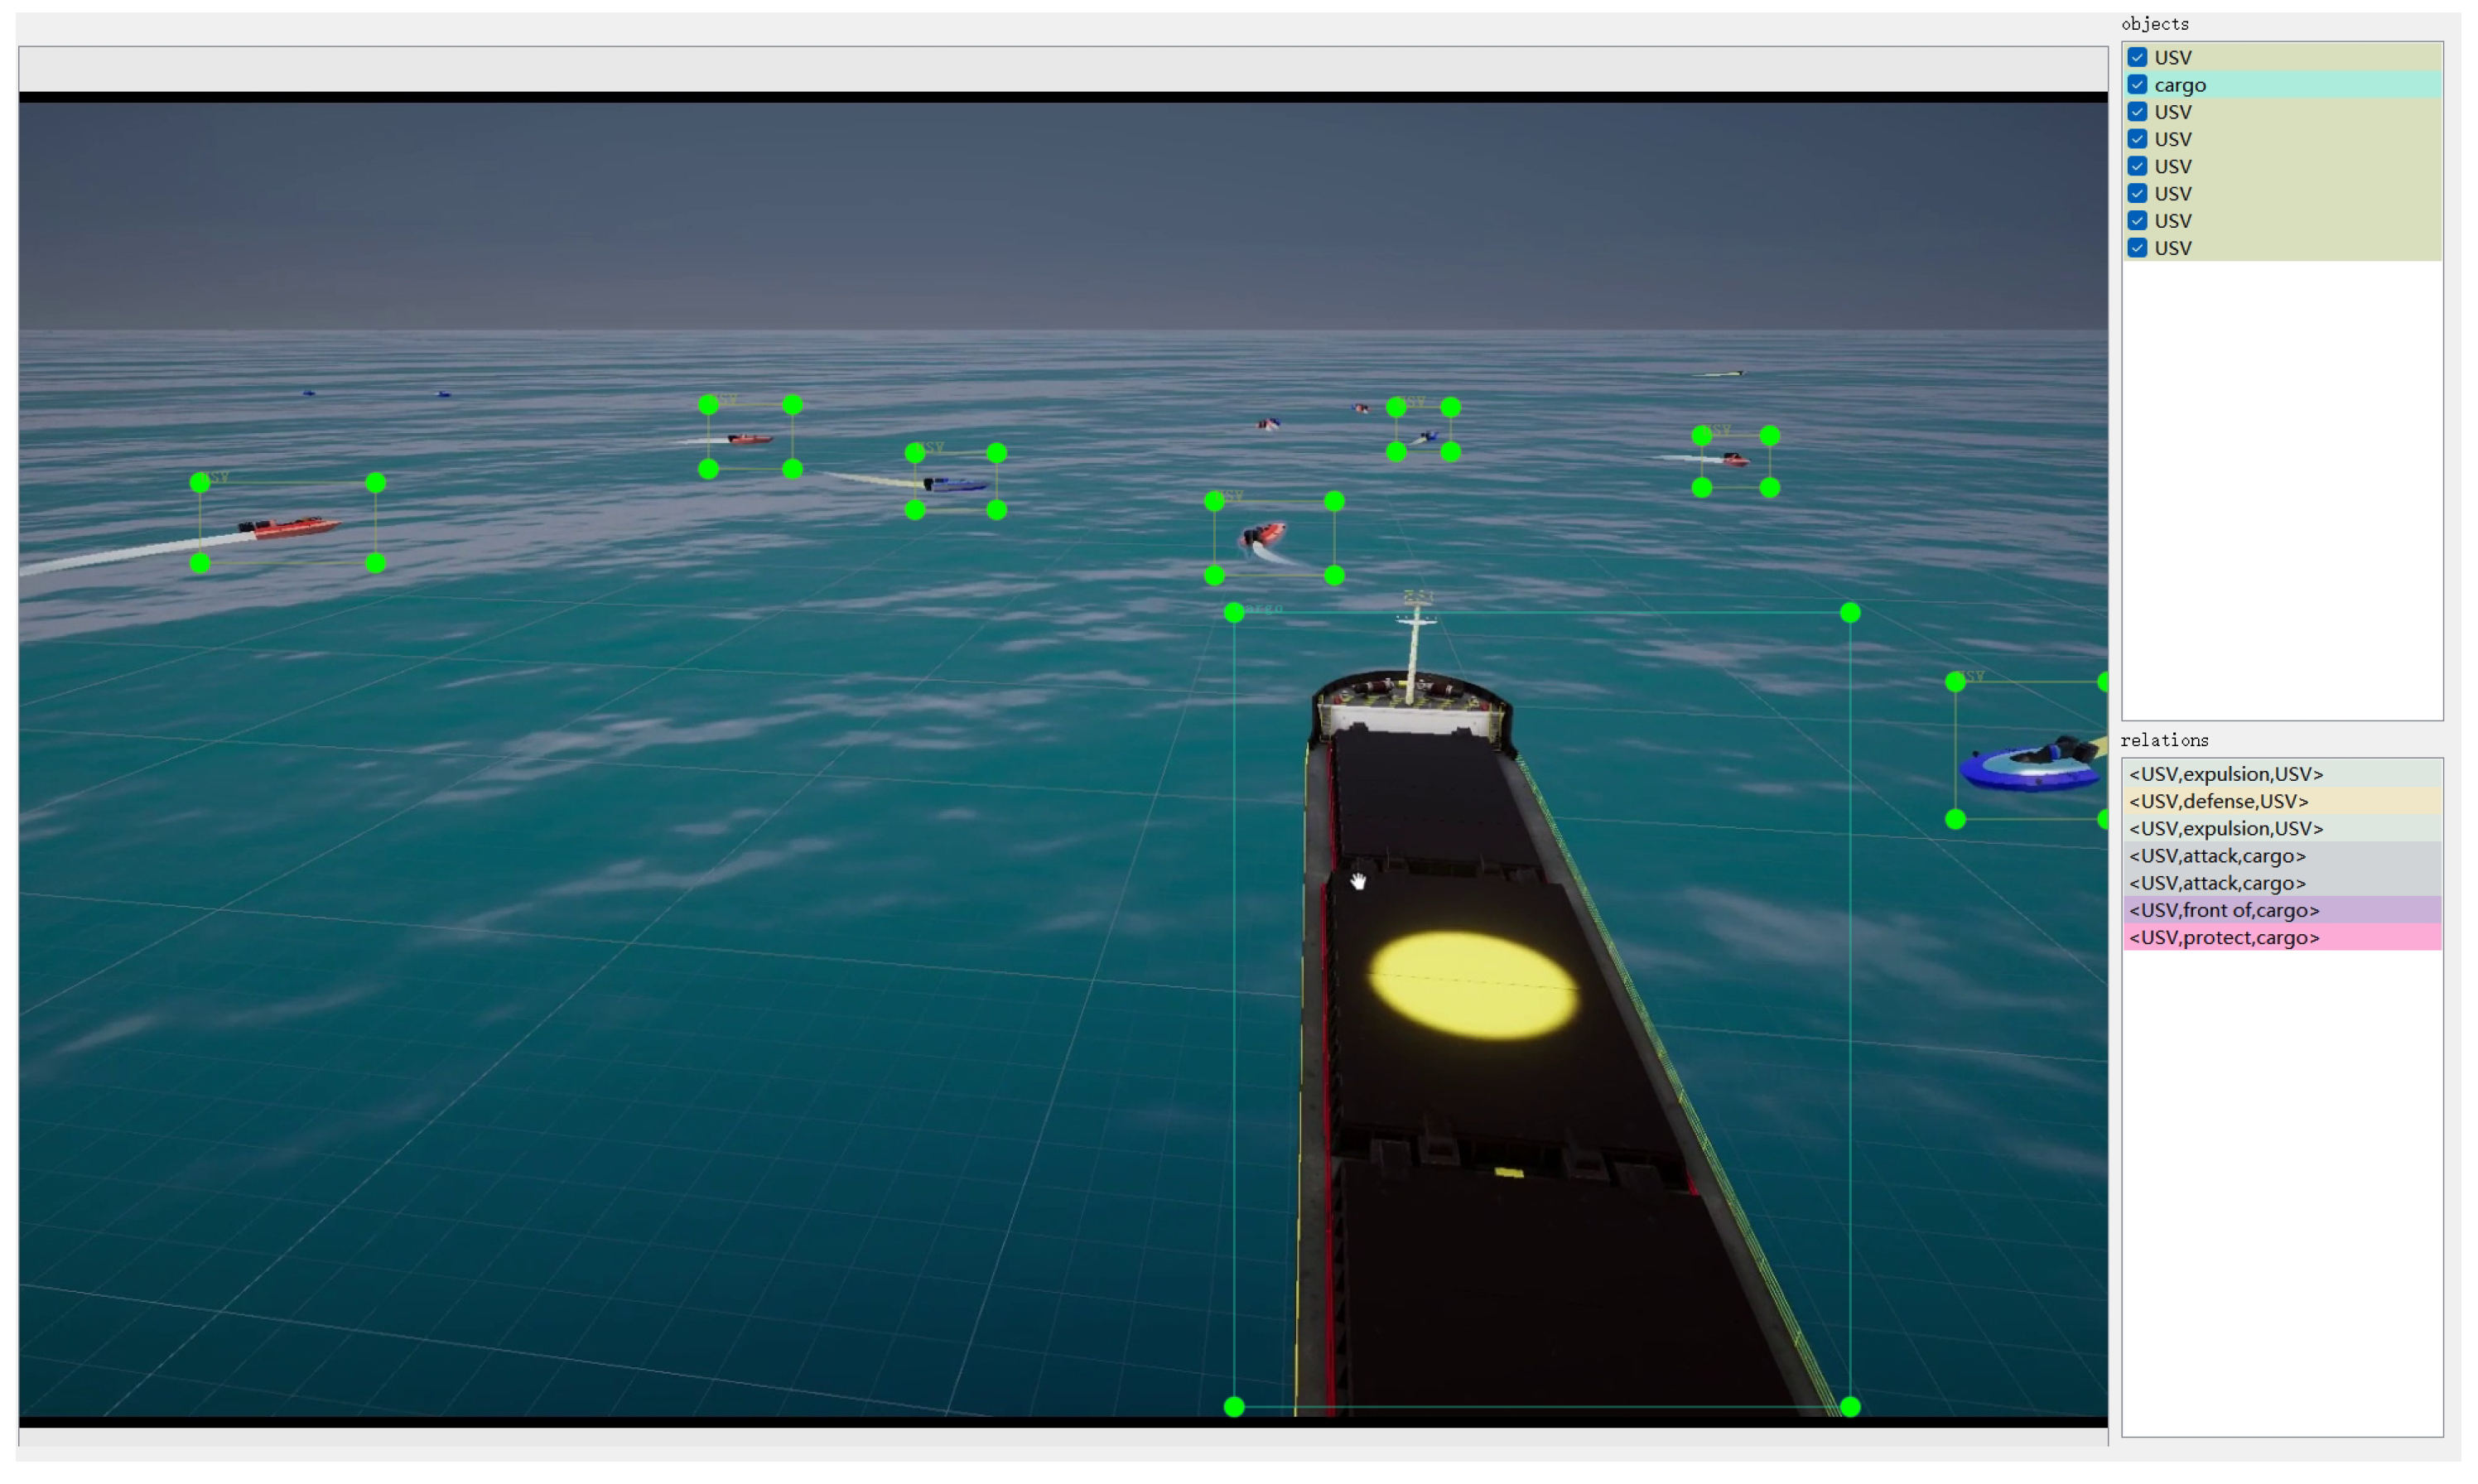
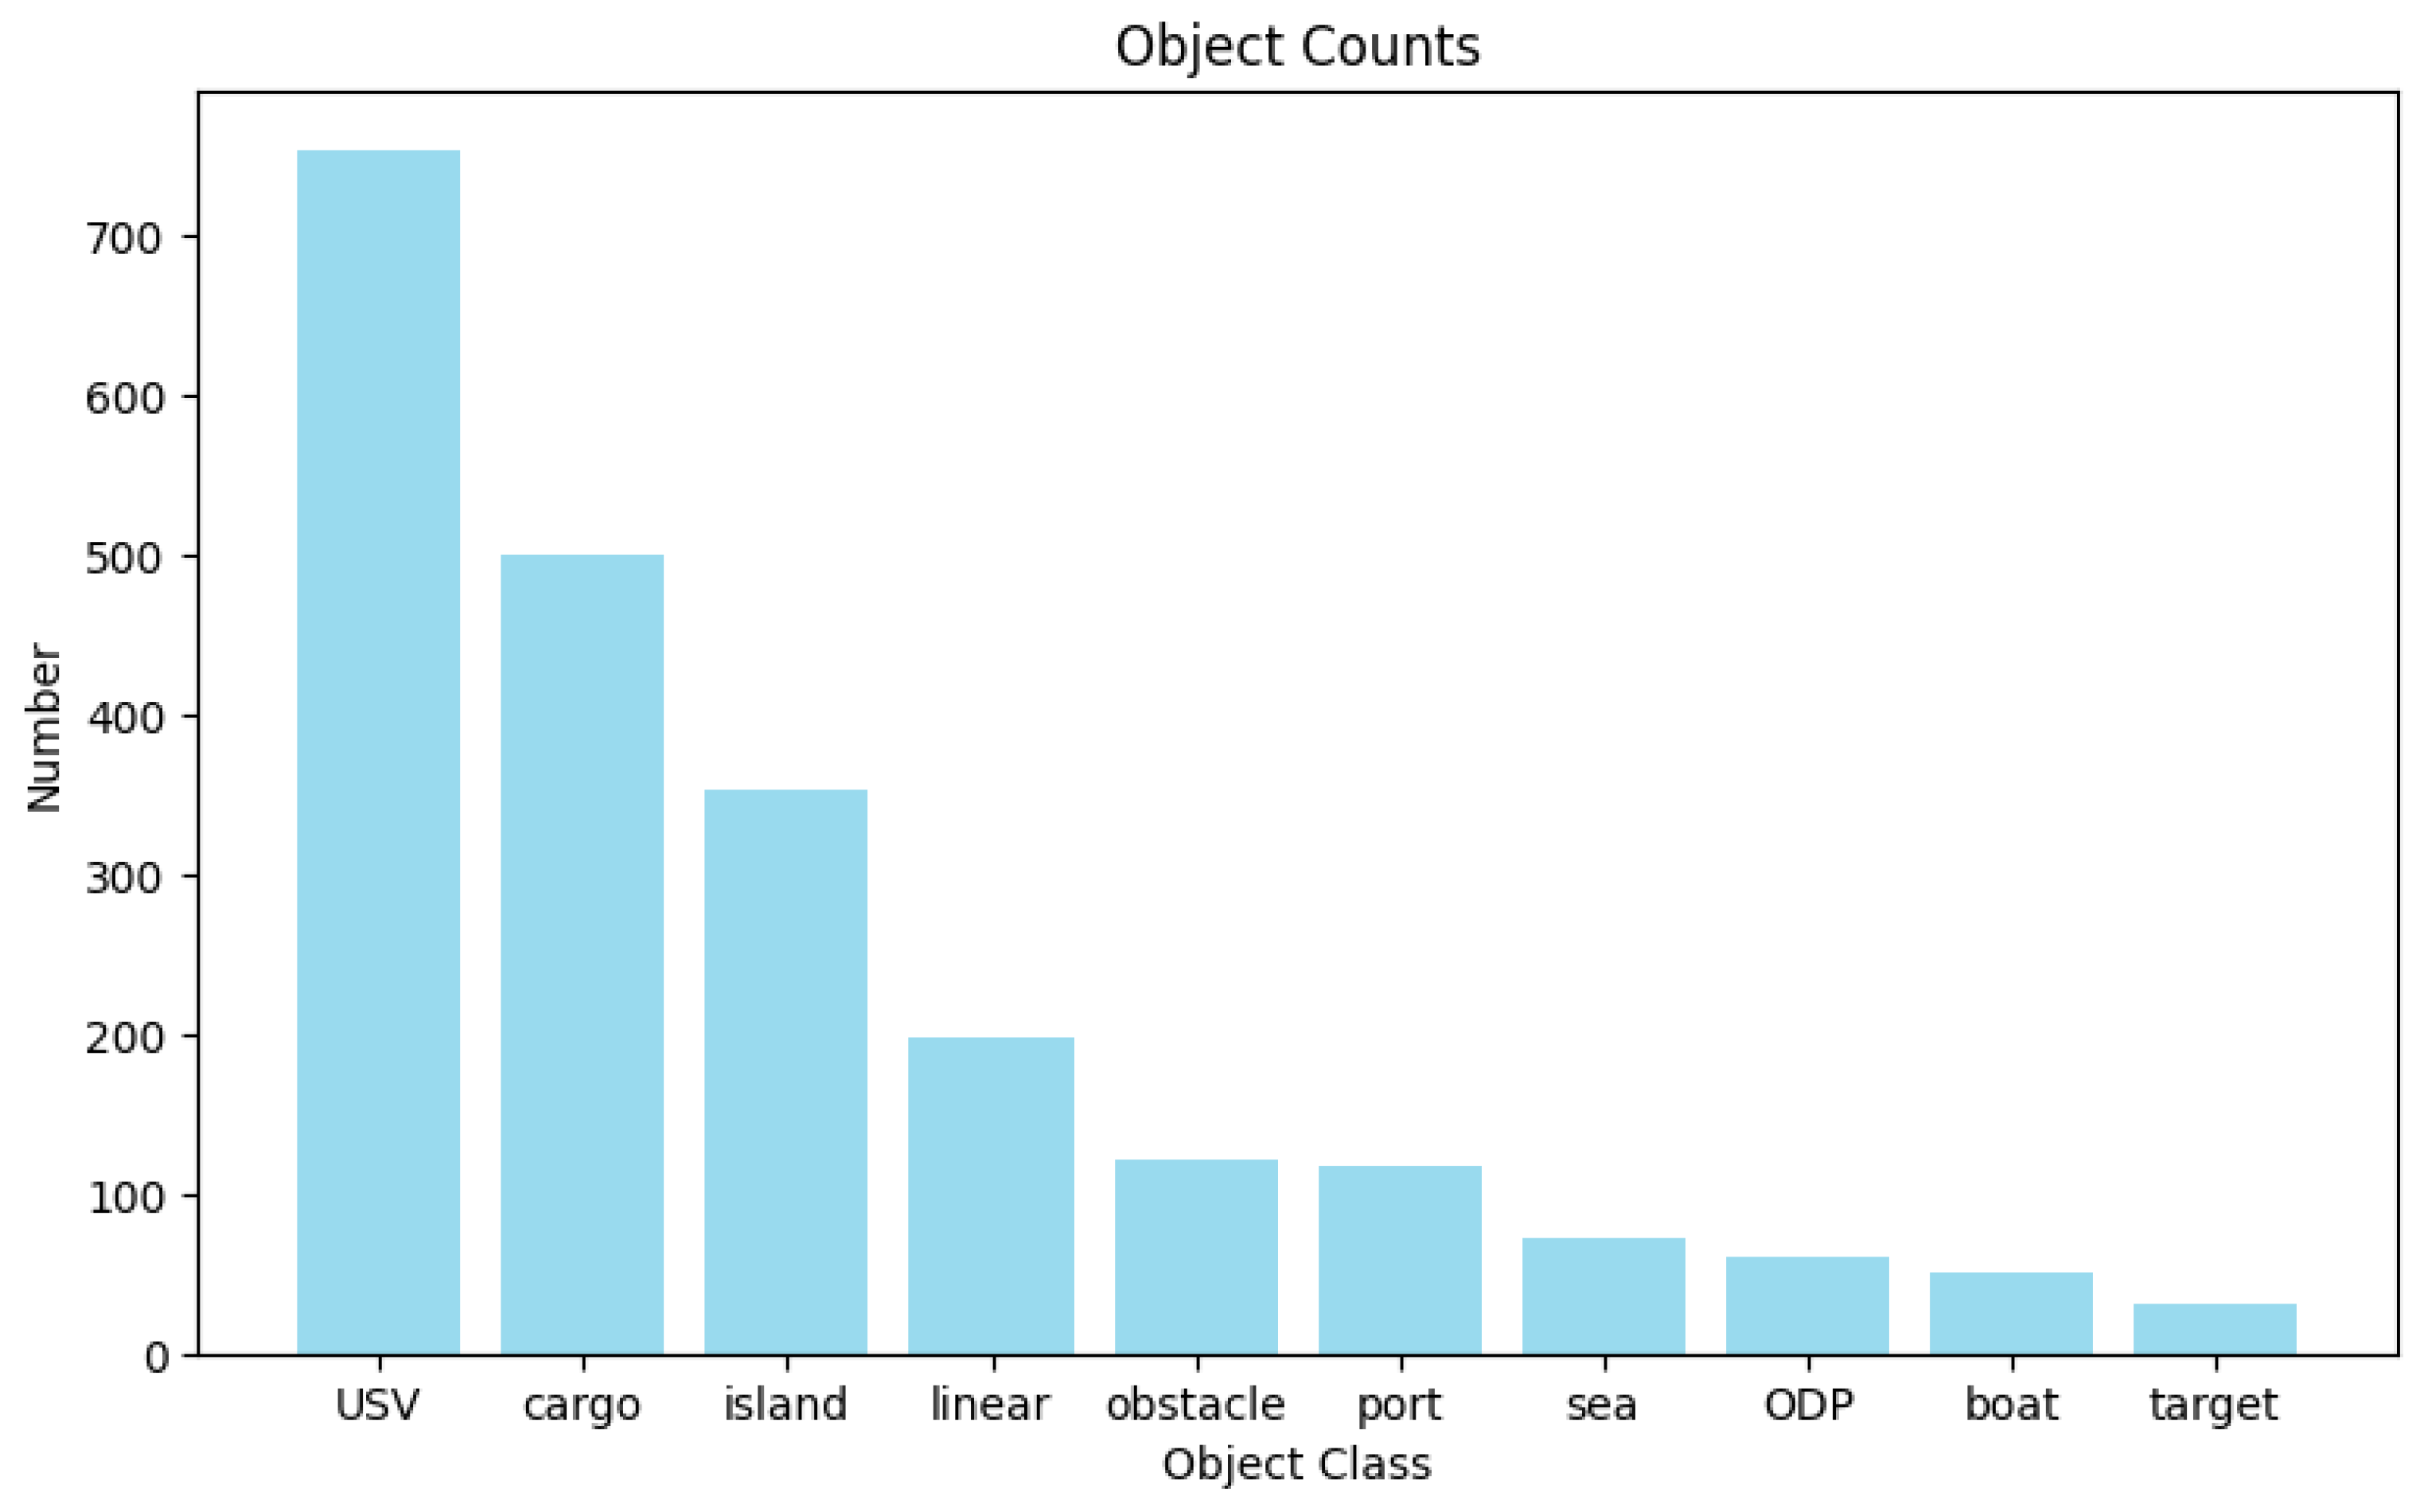
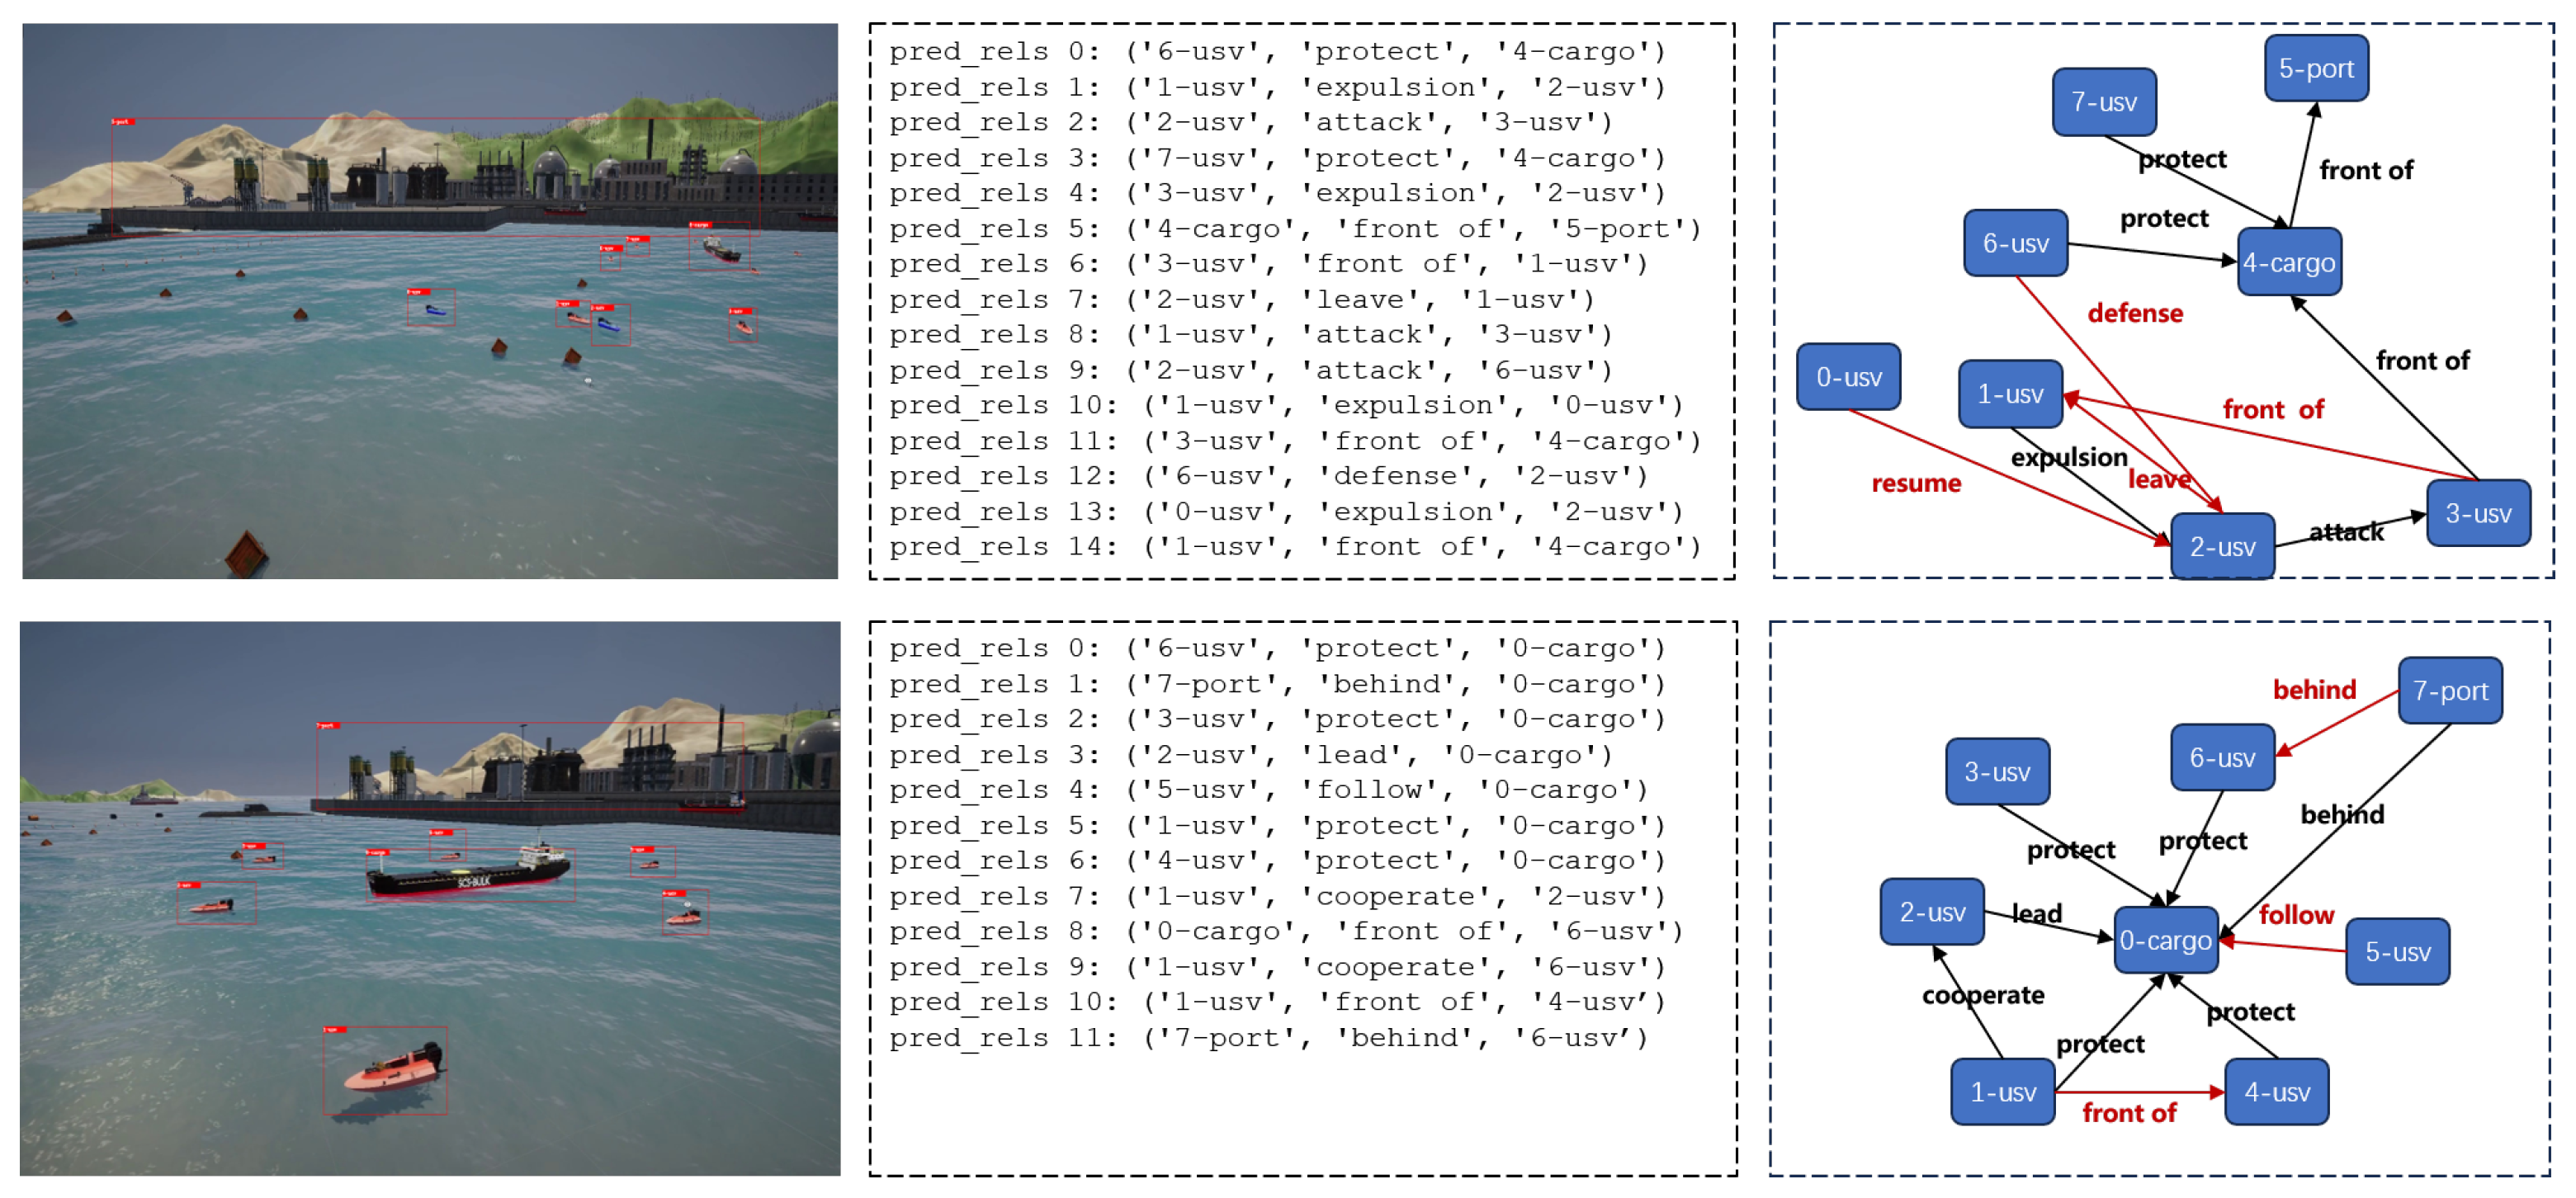
- In response to the lack of domain-specific datasets for generating navigation scene graphs, this paper introduces the first ship navigation scene graph simulation dataset, SNSG-sim. The dataset consists of 2240 frames of image data captured in different navigation scenes, encompassing 10 common navigation scene entities and 20 inter-entity relationships. This dataset serves as a foundation for research on NSGG.
2. Related Work
2.1. Scene Graph Generation
2.2. Scene Graph Datasets
3. Methodology
3.1. Motivation
3.2. Network Architecture
3.3. Semantic-Guided Multimodal Fusion
3.4. Graph Structure Learning-Based Structure Evolvement
3.5. Key Entity Message Passing
3.6. Training Losses
4. SNSG-Sim Dataset
4.1. Dataset Construction
4.2. Dataset Analysis
5. Experiments
5.1. Scene Graph Evaluation Tasks and Metrics
5.2. Experimental Settings
5.3. Quantitative Results and Comparison
5.4. Ablation Studies
6. Conclusions and Future Work
Author Contributions
Funding
Institutional Review Board Statement
Informed Consent Statement
Data Availability Statement
Conflicts of Interest
References
- Yang, W.; Wang, X.; Luo, X.; Xie, S.; Chen, J. S2S-Sim: A Benchmark Dataset for Ship Cooperative 3D Object Detection. Electronics 2024, 13, 885. [Google Scholar] [CrossRef]
- Bae, I.; Hong, J. Survey on the developments of unmanned marine vehicles: Intelligence and cooperation. Sensors 2023, 23, 4643. [Google Scholar] [CrossRef] [PubMed]
- Guo, Y.; Yu, H.; Ma, L.; Zeng, L.; Luo, X. THFE: A Triple-hierarchy Feature Enhancement method for tiny boat detection. Eng. Appl. Artif. Intell. 2023, 123, 106271. [Google Scholar] [CrossRef]
- Guo, Y.; Yu, H.; Xie, S.; Ma, L.; Cao, X.; Luo, X. DSCA: A Dual Semantic Correlation Alignment Method for domain adaptation object detection. Pattern Recognit. 2024, 150, 110329. [Google Scholar] [CrossRef]
- Berwo, M.A.; Khan, A.; Fang, Y.; Fahim, H.; Javaid, S.; Mahmood, J.; Abideen, Z.U.; MS, S. Deep learning techniques for vehicle detection and classification from images/videos: A survey. Sensors 2023, 23, 4832. [Google Scholar] [CrossRef] [PubMed]
- Sun, X.; Wang, P.; Yan, Z.; Xu, F.; Wang, R.; Diao, W.; Chen, J.; Li, J.; Feng, Y.; Xu, T.; et al. FAIR1M: A benchmark dataset for fine-grained object recognition in high-resolution remote sensing imagery. ISPRS J. Photogramm. Remote Sens. 2022, 184, 116–130. [Google Scholar] [CrossRef]
- Tan, J.; Wang, C.; Li, B.; Li, Q.; Ouyang, W.; Yin, C.; Yan, J. Equalization loss for long-tailed object recognition. In Proceedings of the IEEE/CVF Conference on Computer Vision and Pattern Recognition, Seattle, WA, USA, 13–19 June 2020; pp. 11662–11671. [Google Scholar]
- Gao, G.; Zhou, P.; Yao, L.; Liu, J.; Zhang, C.; Duan, D. A bi-prototype BDC metric network with lightweight adaptive task attention for few-shot fine-grained ship classification in remote sensing images. IEEE Trans. Geosci. Remote Sens. 2023, 61, 5622416. [Google Scholar] [CrossRef]
- Yang, W.; Sheng, S.; Luo, X.; Xie, S. Geometric relation based point clouds classification and segmentation. Concurr. Comput. Pract. Exp. 2022, 34, e6845. [Google Scholar] [CrossRef]
- Han, W.; Zhao, B.; Luo, J. Towards Smaller and Stronger: An Edge-Aware Lightweight Segmentation Approach for Unmanned Surface Vehicles in Water Scenarios. Sensors 2023, 23, 4789. [Google Scholar] [CrossRef]
- Li, L.; Ji, W.; Wu, Y.; Li, M.; Qin, Y.; Wei, L.; Zimmermann, R. Panoptic scene graph generation with semantics-prototype learning. In Proceedings of the AAAI Conference on Artificial Intelligence, Vancouver, BC, Canada, 20–27 February 2024; Volume 38, pp. 3145–3153. [Google Scholar]
- Johnson, J.; Krishna, R.; Stark, M.; Li, L.J.; Shamma, D.; Bernstein, M.; Fei-Fei, L. Image retrieval using scene graphs. In Proceedings of the IEEE Conference on Computer Vision and Pattern Recognition, Boston, MA, USA, 7–12 June 2015; pp. 3668–3678. [Google Scholar]
- Li, H.; Zhu, G.; Zhang, L.; Jiang, Y.; Dang, Y.; Hou, H.; Shen, P.; Zhao, X.; Shah, S.A.A.; Bennamoun, M. Scene graph generation: A comprehensive survey. Neurocomputing 2024, 566, 127052. [Google Scholar] [CrossRef]
- Peng, C.; Xia, F.; Naseriparsa, M.; Osborne, F. Knowledge graphs: Opportunities and challenges. Artif. Intell. Rev. 2023, 56, 13071–13102. [Google Scholar] [CrossRef]
- Gao, L.; Sun, J.M.; Mo, K.; Lai, Y.K.; Guibas, L.J.; Yang, J. Scenehgn: Hierarchical graph networks for 3d indoor scene generation with fine-grained geometry. IEEE Trans. Pattern Anal. Mach. Intell. 2023, 45, 8902–8919. [Google Scholar] [CrossRef]
- Wald, J.; Dhamo, H.; Navab, N.; Tombari, F. Learning 3d semantic scene graphs from 3d indoor reconstructions. In Proceedings of the IEEE/CVF Conference on Computer Vision and Pattern Recognition, Seattle, WA, USA, 13–19 June 2020; pp. 3961–3970. [Google Scholar]
- Tahara, T.; Seno, T.; Narita, G.; Ishikawa, T. Retargetable AR: Context-aware augmented reality in indoor scenes based on 3D scene graph. In Proceedings of the 2020 IEEE International Symposium on Mixed and Augmented Reality Adjunct (ISMAR-Adjunct), Recife, Brazil, 9–13 November 2020; IEEE: Piscataway, NJ, USA, 2020; pp. 249–255. [Google Scholar]
- Gu, J.; Zhao, H.; Lin, Z.; Li, S.; Cai, J.; Ling, M. Scene graph generation with external knowledge and image reconstruction. In Proceedings of the IEEE/CVF Conference on Computer Vision and Pattern Recognition, Long Beach, CA, USA, 15–20 June 2019; pp. 1969–1978. [Google Scholar]
- Malawade, A.V.; Yu, S.Y.; Hsu, B.; Muthirayan, D.; Khargonekar, P.P.; Al Faruque, M.A. Spatiotemporal scene-graph embedding for autonomous vehicle collision prediction. IEEE Internet Things J. 2022, 9, 9379–9388. [Google Scholar] [CrossRef]
- Yu, S.Y.; Malawade, A.V.; Muthirayan, D.; Khargonekar, P.P.; Al Faruque, M.A. Scene-graph augmented data-driven risk assessment of autonomous vehicle decisions. IEEE Trans. Intell. Transp. Syst. 2021, 23, 7941–7951. [Google Scholar] [CrossRef]
- Pei, J.; Zhong, K.; Yu, Z.; Wang, L.; Lakshmanna, K. Scene graph semantic inference for image and text matching. ACM Trans. Asian Low-Resour. Lang. Inf. Process. 2023, 22, 1–23. [Google Scholar] [CrossRef]
- Wang, Y.; Dai, P.; Jia, X.; Zeng, Z.; Li, R.; Cao, X. Hi-SIGIR: Hierachical Semantic-Guided Image-to-image Retrieval via Scene Graph. In Proceedings of the 31st ACM International Conference on Multimedia, Ottawa, ON, Canada, 29 October–3 November 2023; pp. 6400–6409. [Google Scholar]
- D’souza, J.; Aleema, P.; Dhanyashree, S.; Fernandes, C.; Kavitha, K.; Naik, C. Knowledge-Based Scene Graph Generation in Medical Field. In Proceedings of the 2023 IEEE International Conference on Distributed Computing, VLSI, Electrical Circuits and Robotics (DISCOVER), Mangalore, India, 13–14 October 2023; IEEE: Piscataway, NJ, USA, 2023; pp. 232–237. [Google Scholar]
- Holm, F.; Ghazaei, G.; Czempiel, T.; Özsoy, E.; Saur, S.; Navab, N. Dynamic Scene Graph Representation for Surgical Video. In Proceedings of the IEEE/CVF International Conference on Computer Vision, Paris, France, 2–3 October 2023; pp. 81–87. [Google Scholar]
- Krishna, R.; Zhu, Y.; Groth, O.; Johnson, J.; Hata, K.; Kravitz, J.; Chen, S.; Kalantidis, Y.; Li, L.J.; Shamma, D.A.; et al. Visual genome: Connecting language and vision using crowdsourced dense image annotations. Int. J. Comput. Vis. 2017, 123, 32–73. [Google Scholar] [CrossRef]
- Kuznetsova, A.; Rom, H.; Alldrin, N.; Uijlings, J.; Krasin, I.; Pont-Tuset, J.; Kamali, S.; Popov, S.; Malloci, M.; Kolesnikov, A.; et al. The open images dataset v4: Unified image classification, object detection, and visual relationship detection at scale. Int. J. Comput. Vis. 2020, 128, 1956–1981. [Google Scholar] [CrossRef]
- Lin, X.; Ding, C.; Zhan, Y.; Li, Z.; Tao, D. Hl-net: Heterophily learning network for scene graph generation. In Proceedings of the IEEE/CVF Conference on Computer Vision and Pattern Recognition, New Orleans, LA, USA, 18–24 June 2022; pp. 19476–19485. [Google Scholar]
- Lin, X.; Ding, C.; Zhang, J.; Zhan, Y.; Tao, D. Ru-net: Regularized unrolling network for scene graph generation. In Proceedings of the IEEE/CVF Conference on Computer Vision and Pattern Recognition, New Orleans, LA, USA, 18–24 June 2022; pp. 19457–19466. [Google Scholar]
- Tang, K.; Niu, Y.; Huang, J.; Shi, J.; Zhang, H. Unbiased scene graph generation from biased training. In Proceedings of the IEEE/CVF Conference on Computer Vision and Pattern Recognition, Seattle, WA, USA, 13–19 June 2020; pp. 3716–3725. [Google Scholar]
- Liu, A.A.; Tian, H.; Xu, N.; Nie, W.; Zhang, Y.; Kankanhalli, M. Toward region-aware attention learning for scene graph generation. IEEE Trans. Neural Netw. Learn. Syst. 2021, 33, 7655–7666. [Google Scholar] [CrossRef] [PubMed]
- Li, R.; Zhang, S.; He, X. Sgtr: End-to-end scene graph generation with transformer. In Proceedings of the IEEE/CVF Conference on Computer Vision and Pattern Recognition, New Orleans, LA, USA, 18–24 June 2022; pp. 19486–19496. [Google Scholar]
- Cong, Y.; Yang, M.Y.; Rosenhahn, B. Reltr: Relation transformer for scene graph generation. IEEE Trans. Pattern Anal. Mach. Intell. 2023, 45, 11169–11183. [Google Scholar] [CrossRef]
- Xu, L.; Qu, H.; Kuen, J.; Gu, J.; Liu, J. Meta spatio-temporal debiasing for video scene graph generation. In Proceedings of the European Conference on Computer Vision, Tel Aviv, Israel, 23–27 October 2022; Springer: Berlin/Heidelberg, Germany, 2022; pp. 374–390. [Google Scholar]
- Cong, Y.; Liao, W.; Ackermann, H.; Rosenhahn, B.; Yang, M.Y. Spatial-temporal transformer for dynamic scene graph generation. In Proceedings of the IEEE/CVF International Conference on Computer Vision, Montreal, BC, Canada, 11–17 October 2021; pp. 16372–16382. [Google Scholar]
- Ji, J.; Krishna, R.; Fei-Fei, L.; Niebles, J.C. Action genome: Actions as compositions of spatio-temporal scene graphs. In Proceedings of the IEEE/CVF Conference on Computer Vision and Pattern Recognition, Seattle, WA, USA, 13–19 June 2020; pp. 10236–10247. [Google Scholar]
- Zhan, L.; Li, W.; Min, W. FA-ResNet: Feature affine residual network for large-scale point cloud segmentation. Int. J. Appl. Earth Obs. Geoinf. 2023, 118, 103259. [Google Scholar] [CrossRef]
- Lu, Y.; Jiang, Q.; Chen, R.; Hou, Y.; Zhu, X.; Ma, Y. See more and know more: Zero-shot point cloud segmentation via multi-modal visual data. In Proceedings of the IEEE/CVF International Conference on Computer Vision, Paris, France, 2–3 October 2023; pp. 21674–21684. [Google Scholar]
- Shi, S.; Jiang, L.; Deng, J.; Wang, Z.; Guo, C.; Shi, J.; Wang, X.; Li, H. PV-RCNN++: Point-voxel feature set abstraction with local vector representation for 3D object detection. Int. J. Comput. Vis. 2023, 131, 531–551. [Google Scholar] [CrossRef]
- Mao, J.; Shi, S.; Wang, X.; Li, H. 3D object detection for autonomous driving: A comprehensive survey. Int. J. Comput. Vis. 2023, 131, 1909–1963. [Google Scholar] [CrossRef]
- Wang, L.; Zhang, X.; Song, Z.; Bi, J.; Zhang, G.; Wei, H.; Tang, L.; Yang, L.; Li, J.; Jia, C.; et al. Multi-modal 3d object detection in autonomous driving: A survey and taxonomy. IEEE Trans. Intell. Veh. 2023, 8, 3781–3798. [Google Scholar] [CrossRef]
- Feng, M.; Hou, H.; Zhang, L.; Guo, Y.; Yu, H.; Wang, Y.; Mian, A. Exploring hierarchical spatial layout cues for 3d point cloud based scene graph prediction. IEEE Trans. Multimed. 2023. early access. [Google Scholar] [CrossRef]
- Koch, S.; Hermosilla, P.; Vaskevicius, N.; Colosi, M.; Ropinski, T. Sgrec3d: Self-supervised 3d scene graph learning via object-level scene reconstruction. In Proceedings of the IEEE/CVF Winter Conference on Applications of Computer Vision, Waikoloa, HI, USA, 3–8 January 2024; pp. 3404–3414. [Google Scholar]
- Wu, S.C.; Wald, J.; Tateno, K.; Navab, N.; Tombari, F. Scenegraphfusion: Incremental 3d scene graph prediction from rgb-d sequences. In Proceedings of the IEEE/CVF Conference on Computer Vision and Pattern Recognition, Nashville, TN, USA, 20–25 June 2021; pp. 7515–7525. [Google Scholar]
- Lin, T.Y.; Maire, M.; Belongie, S.; Hays, J.; Perona, P.; Ramanan, D.; Dollár, P.; Zitnick, C.L. Microsoft coco: Common objects in context. In Proceedings of the Computer Vision—ECCV 2014: 13th European Conference, Zurich, Switzerland, 6–12 September 2014; Proceedings, Part V 13. Springer: Berlin/Heidelberg, Germany, 2014; pp. 740–755. [Google Scholar]
- Caesar, H.; Uijlings, J.; Ferrari, V. Coco-stuff: Thing and stuff classes in context. In Proceedings of the IEEE Conference on Computer Vision and Pattern Recognition, Salt Lake City, UT, USA, 18–23 June 2018; pp. 1209–1218. [Google Scholar]
- Belz, A.; Muscat, A.; Anguill, P.; Sow, M.; Vincent, G.; Zinessabah, Y. Spatialvoc2k: A multilingual dataset of images with annotations and features for spatial relations between objects. In Proceedings of the 11th International Conference on Natural Language Generation, Tilburg, The Netherlands, 5–8 November 2018; pp. 140–145. [Google Scholar]
- Lu, C.; Krishna, R.; Bernstein, M.; Fei-Fei, L. Visual relationship detection with language priors. In Proceedings of the Computer Vision–ECCV 2016: 14th European Conference, Amsterdam, The Netherlands, 11–14 October 2016; Proceedings, Part I 14. Springer: Berlin/Heidelberg, Germany, 2016; pp. 852–869. [Google Scholar]
- Yang, K.; Russakovsky, O.; Deng, J. Spatialsense: An adversarially crowdsourced benchmark for spatial relation recognition. In Proceedings of the IEEE/CVF International Conference on Computer Vision, Seoul, Republic of Korea, 27 October–2 November 2019; pp. 2051–2060. [Google Scholar]
- Zellers, R.; Yatskar, M.; Thomson, S.; Choi, Y. Neural motifs: Scene graph parsing with global context. In Proceedings of the IEEE Conference on Computer Vision and Pattern Recognition, Salt Lake City, UT, USA, 18–23 June 2018; pp. 5831–5840. [Google Scholar]
- Li, Y.; Ouyang, W.; Zhou, B.; Wang, K.; Wang, X. Scene graph generation from objects, phrases and region captions. In Proceedings of the IEEE International Conference on Computer Vision, Venice, Italy, 22–29 October 2017; IEEE: Piscataway, NJ, USA, 2017; pp. 1261–1270. [Google Scholar]
- Li, R.; Zhang, S.; Wan, B.; He, X. Bipartite graph network with adaptive message passing for unbiased scene graph generation. In Proceedings of the IEEE/CVF Conference on Computer Vision and Pattern Recognition, Nashville, TN, USA, 20–25 June 2021; pp. 11109–11119. [Google Scholar]
- Xu, D.; Zhu, Y.; Choy, C.B.; Fei-Fei, L. Scene graph generation by iterative message passing. In Proceedings of the IEEE Conference on Computer Vision and Pattern Recognition, Honolulu, HI, USA, 21–26 July 2017; pp. 5410–5419. [Google Scholar]
- Tang, K.; Zhang, H.; Wu, B.; Luo, W.; Liu, W. Learning to compose dynamic tree structures for visual contexts. In Proceedings of the IEEE/CVF Conference on Computer Vision and Pattern Recognition, Long Beach, CA, USA, 15–20 June 2019; pp. 6619–6628. [Google Scholar]
- Gaidon, A.; Wang, Q.; Cabon, Y.; Vig, E. Virtual worlds as proxy for multi-object tracking analysis. In Proceedings of the IEEE Conference on Computer Vision and Pattern Recognition, Las Vegas, NV, USA, 27–30 June 2016; pp. 4340–4349. [Google Scholar]
- Herzig, R.; Raboh, M.; Chechik, G.; Berant, J.; Globerson, A. Mapping images to scene graphs with permutation-invariant structured prediction. Adv. Neural Inf. Process. Syst. 2018, 31, 7211–7221. [Google Scholar]
- Lin, X.; Ding, C.; Zeng, J.; Tao, D. Gps-net: Graph property sensing network for scene graph generation. In Proceedings of the IEEE/CVF Conference on Computer Vision and Pattern Recognition, Seattle, WA, USA, 13–19 June 2020; pp. 3746–3753. [Google Scholar]
- Yang, J.; Lu, J.; Lee, S.; Batra, D.; Parikh, D. Graph r-cnn for scene graph generation. In Proceedings of the European Conference on Computer Vision (ECCV), Munich, Germany, 8–14 September 2018; Springer: Berlin/Heidelberg, Germany, 2018; pp. 670–685. [Google Scholar]
- Zhong, Y.; Shi, J.; Yang, J.; Xu, C.; Li, Y. Learning to generate scene graph from natural language supervision. In Proceedings of the CVF International Conference on Computer Vision (ICCV), Montreal, BC, Canada, 11–17 October 2021; IEEE: Piscataway, NJ, USA, 2021; pp. 1803–1814. [Google Scholar]
- Lu, Y.; Rai, H.; Chang, J.; Knyazev, B.; Yu, G.; Shekhar, S.; Taylor, G.W.; Volkovs, M. Context-aware scene graph generation with seq2seq transformers. In Proceedings of the IEEE/CVF International Conference on Computer Vision, Montreal, BC, Canada, 11–17 October 2021; IEEE: Piscataway, NJ, USA, 2021; pp. 15931–15941. [Google Scholar]


| Method | B | SGCls | ||
|---|---|---|---|---|
| R@20 | R@50 | B | R@50 | |
| MOTIFS [49] | 54.4 | 55.9 | 40.5 | 41.6 |
| IMP [52] | 48.6 | 49.3 | 42.3 | 44.1 |
| VCTREE [53] | 59.6 | 60.7 | 29.4 | 31.7 |
| HL-Net [27] | 57.2 | 59.1 | 51.9 | 52.7 |
| RU-Net [28] | 52.9 | 54.0 | 49.5 | 50.3 |
| RelTR [32] | 55.1 | 56.3 | 42.1 | 44.4 |
| Ours | 62.0 | 62.3 | 57.3 | 58.3 |
| Method | PreCls | SGCls | ||
|---|---|---|---|---|
| R@50 | R@100 | R@50 | R@100 | |
| MOTIFS [49] | 65.8 | 67.1 | 35.8 | 36.5 |
| IMP [52] | 59.3 | 61.3 | 34.6 | 35.7 |
| GPI [55] | 65.1 | 66.9 | 36.5 | 38.8 |
| VCTREE [53] | 66.4 | 68.1 | 38.1 | 38.8 |
| GPS-Net [56] | 66.9 | 68.8 | 39.2 | 40.1 |
| G-RCNN [57] | 54.2 | 59.1 | 29.6 | 31.6 |
| SGGNLS [58] | 65.6 | 67.4 | 40.0 | 40.8 |
| Seq2Seq-RL [59] | 66.4 | 68.5 | 38.3 | 39.0 |
| RU-Net [28] | 67.7 | 69.6 | 41.4 | 42.3 |
| RelTR [32] | 64.2 | - | 36.6 | - |
| Ours | 69.1 | 71.1 | 42.7 | 43.6 |
| EXP. | SGMF | GSLSE | KEMP | PreCls | SGCls | ||
|---|---|---|---|---|---|---|---|
| R@20 | R@50 | R@20 | R@50 | ||||
| 1 | 52.8 | 54.0 | 49.5 | 50.3 | |||
| 2 | ✓ | 54.2 | 55.7 | 52.2 | 53.5 | ||
| 3 | ✓ | 57.8 | 58.3 | 54.6 | 55.2 | ||
| 4 | ✓ | 52.3 | 55.3 | 48.3 | 50.1 | ||
| 5 | ✓ | ✓ | 60.6 | 61.1 | 55.7 | 56.4 | |
| 6 | ✓ | ✓ | ✓ | 62.0 | 62.3 | 57.3 | 58.3 |
| EXP. | SGMF | GSLSE | KEMP | PreCls | SGCls | ||
|---|---|---|---|---|---|---|---|
| R@20 | R@50 | R@20 | R@50 | ||||
| 1 | 57.6 | 63.4 | 35.2 | 35.3 | |||
| 2 | ✓ | 58.2 | 64.7 | 35.8 | 35.9 | ||
| 3 | ✓ | 59.3 | 66.3 | 36.2 | 37.1 | ||
| 4 | ✓ | 58.1 | 65.0 | 35.0 | 37.4 | ||
| 5 | ✓ | ✓ | 61.7 | 68.3 | 37.4 | 42.5 | |
| 6 | ✓ | ✓ | ✓ | 62.3 | 69.1 | 42.7 | 43.6 |
Disclaimer/Publisher’s Note: The statements, opinions and data contained in all publications are solely those of the individual author(s) and contributor(s) and not of MDPI and/or the editor(s). MDPI and/or the editor(s) disclaim responsibility for any injury to people or property resulting from any ideas, methods, instructions or products referred to in the content. |
© 2024 by the authors. Licensee MDPI, Basel, Switzerland. This article is an open access article distributed under the terms and conditions of the Creative Commons Attribution (CC BY) license (https://creativecommons.org/licenses/by/4.0/).
Share and Cite
Yang, W.; Qiu, H.; Luo, X.; Xie, S. SGK-Net: A Novel Navigation Scene Graph Generation Network. Sensors 2024, 24, 4329. https://doi.org/10.3390/s24134329
Yang W, Qiu H, Luo X, Xie S. SGK-Net: A Novel Navigation Scene Graph Generation Network. Sensors. 2024; 24(13):4329. https://doi.org/10.3390/s24134329
Chicago/Turabian StyleYang, Wenbin, Hao Qiu, Xiangfeng Luo, and Shaorong Xie. 2024. "SGK-Net: A Novel Navigation Scene Graph Generation Network" Sensors 24, no. 13: 4329. https://doi.org/10.3390/s24134329
APA StyleYang, W., Qiu, H., Luo, X., & Xie, S. (2024). SGK-Net: A Novel Navigation Scene Graph Generation Network. Sensors, 24(13), 4329. https://doi.org/10.3390/s24134329