
Evaluation of the Diagnostic Sensitivity of Digital Vibration Sensors Based on Capacitive MEMS Accelerometers

Abstract
:1. Introduction
1.1. Vibration Symptoms of Bearing Faults
1.2. Methods of Bearing Diagnostics
1.3. Measuremnt of Bearing Vibration
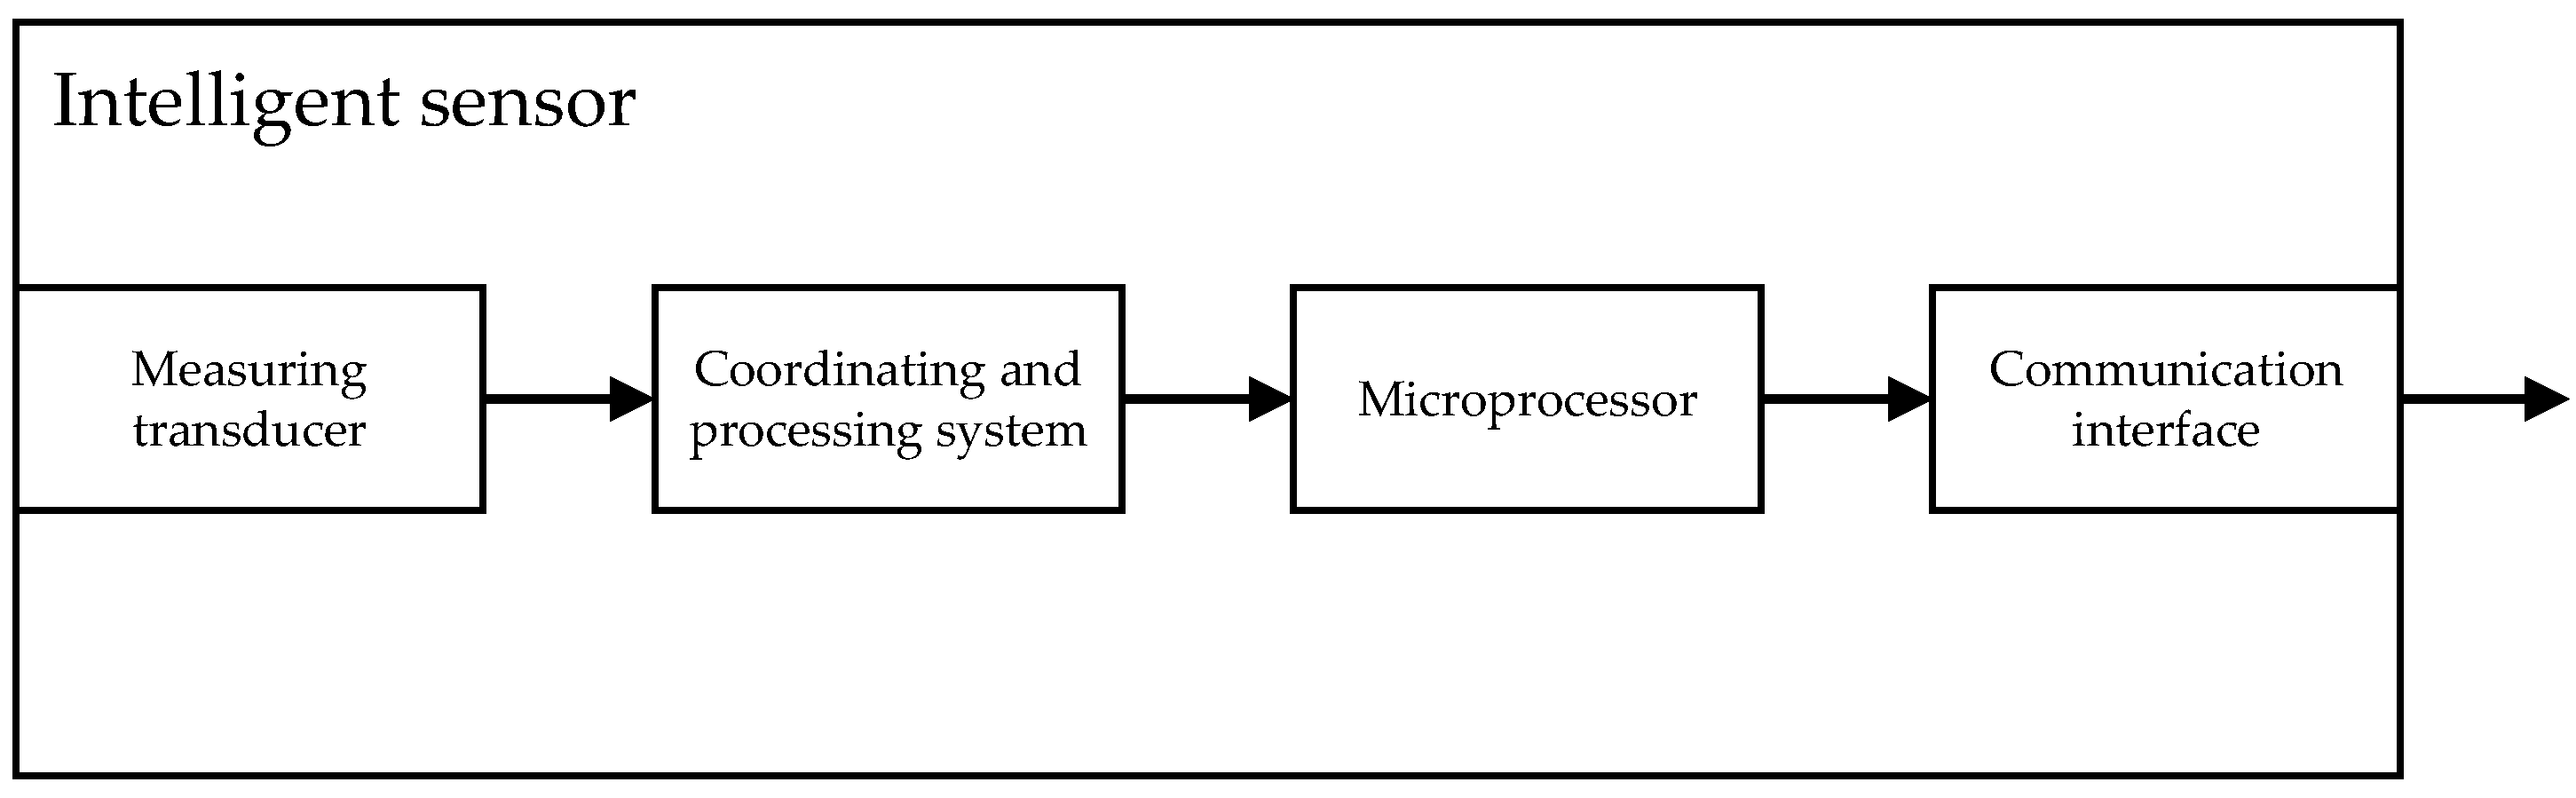
1.4. Contemporary Digital Vibration Sensors and Its Usefulness to Bearing Faults Diagnostics
- ADC converter and microcontroller.
- The ability to process and analyse measured signals.
- Ability to linearization of processing characteristics.
- Digital two-way communication interface.
- Self-test and auto calibration unit.
- The ability to learn and make independent decisions.
1.5. Novelty of This Research
2. Materials and Methods
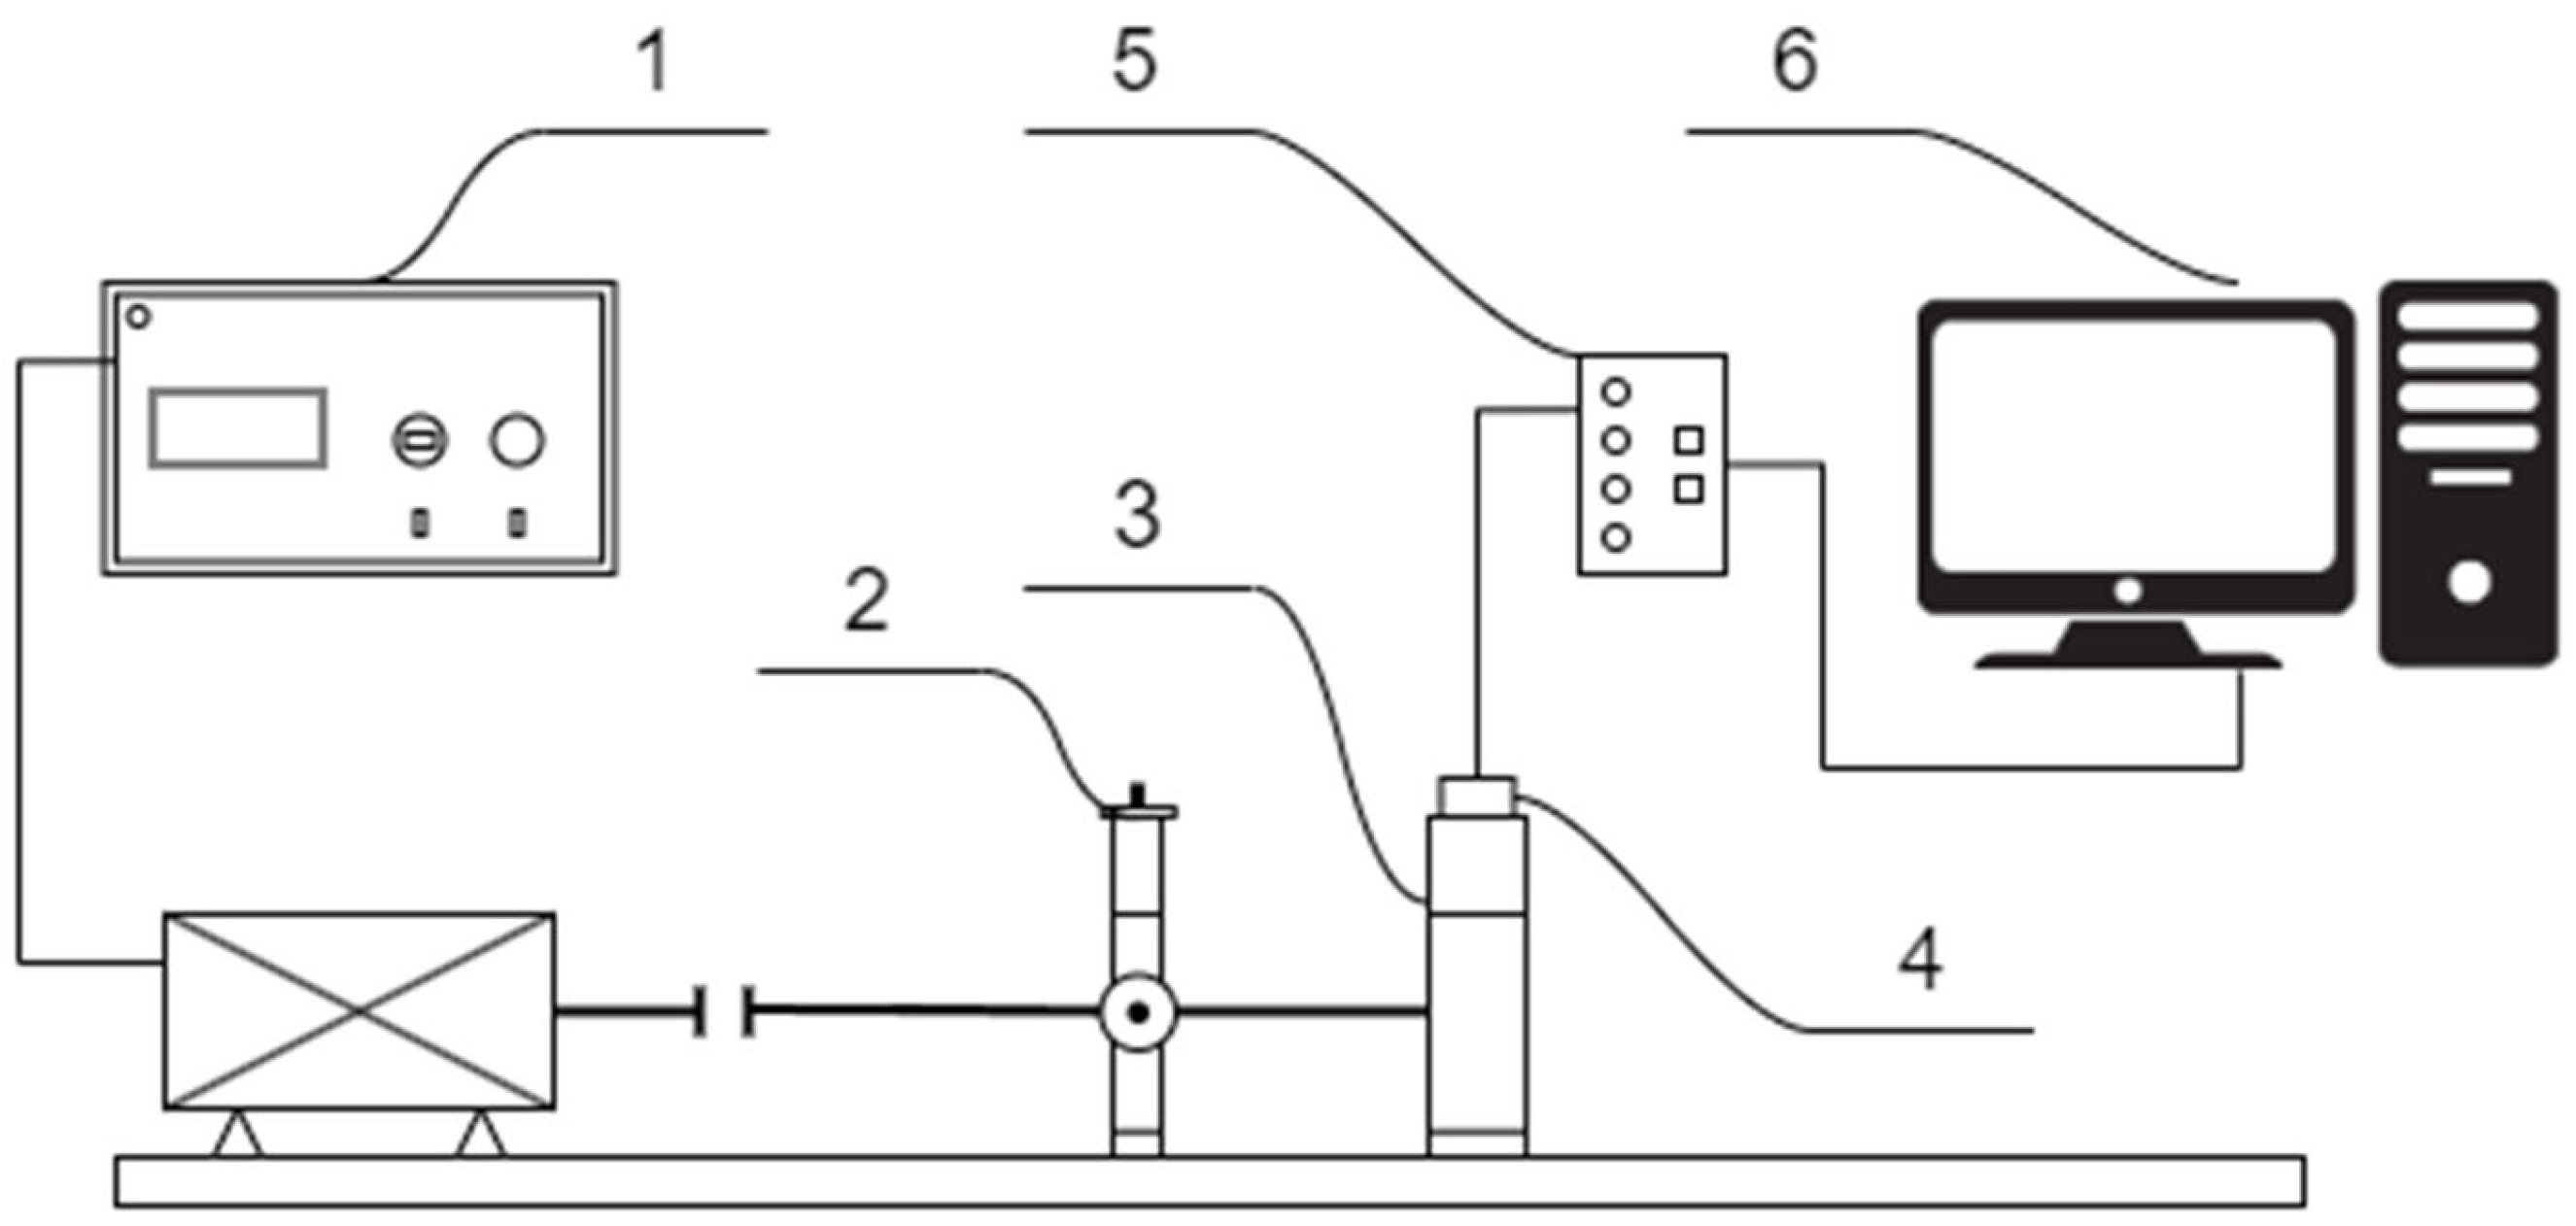
2.1. The Test Bench and Experiment Description
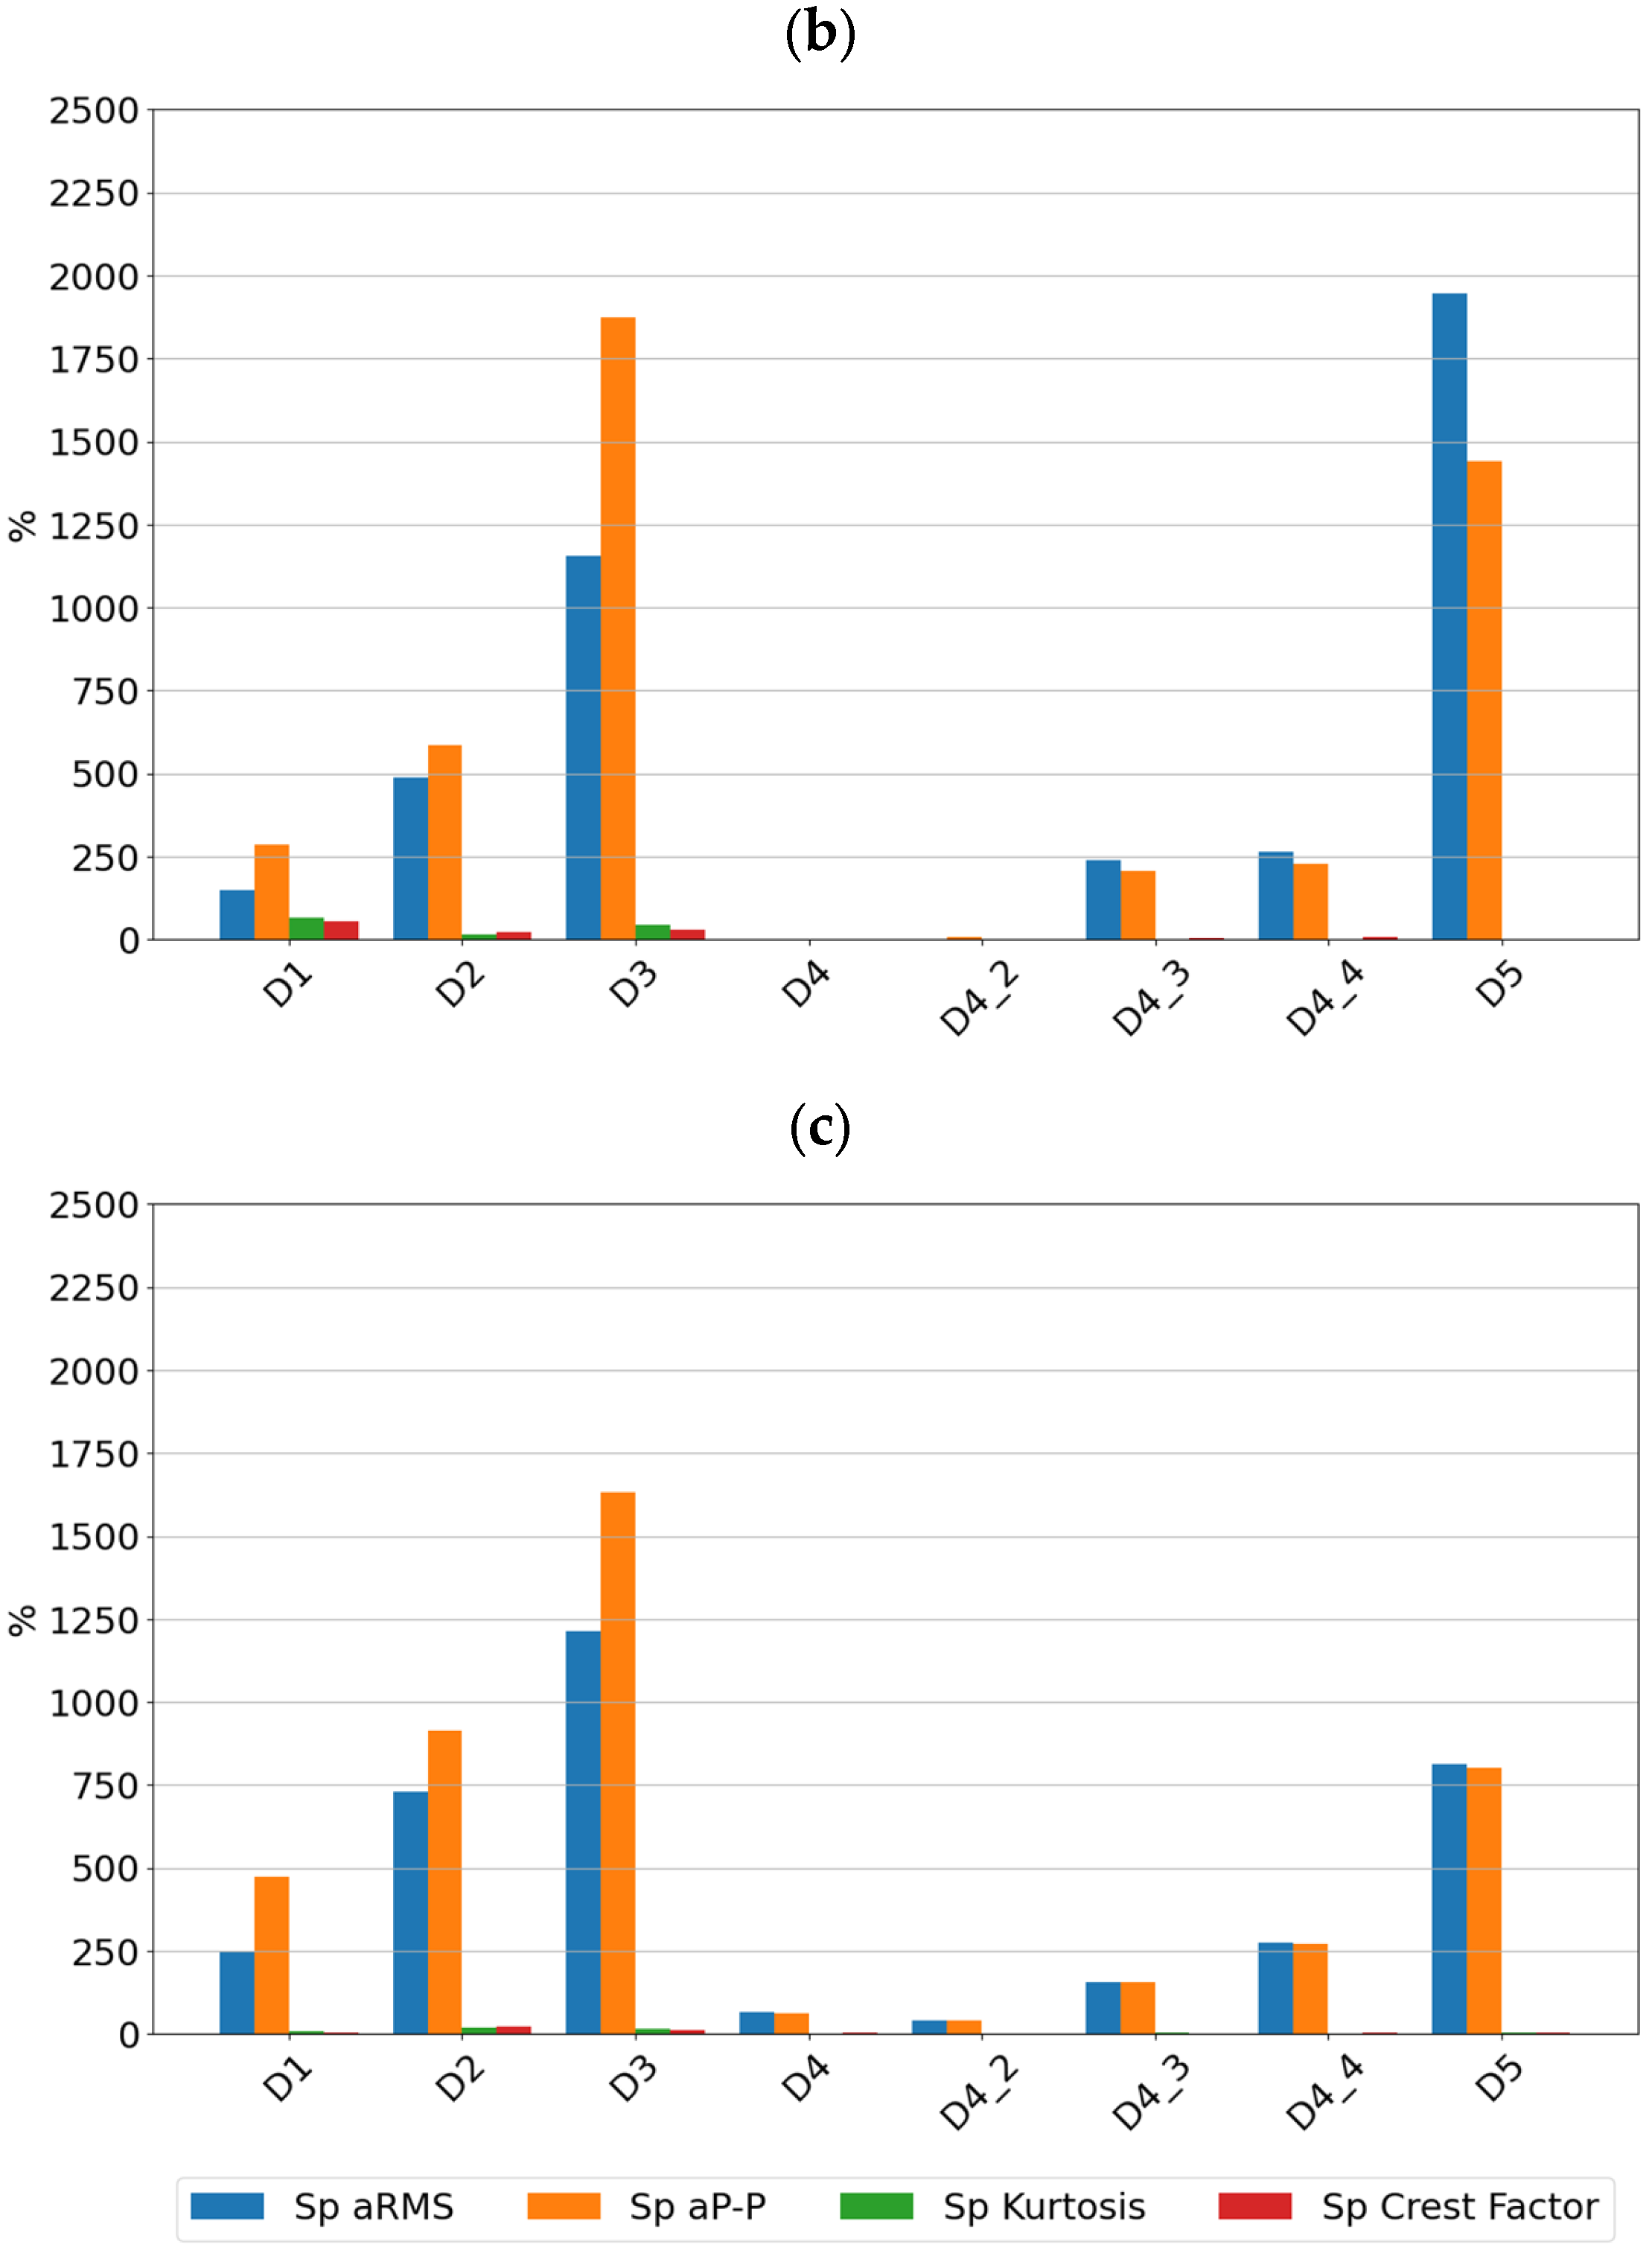
2.2. Method of Evaluation of the Diagnostic Sensitivity of Investigated Digital Vibration Sensors
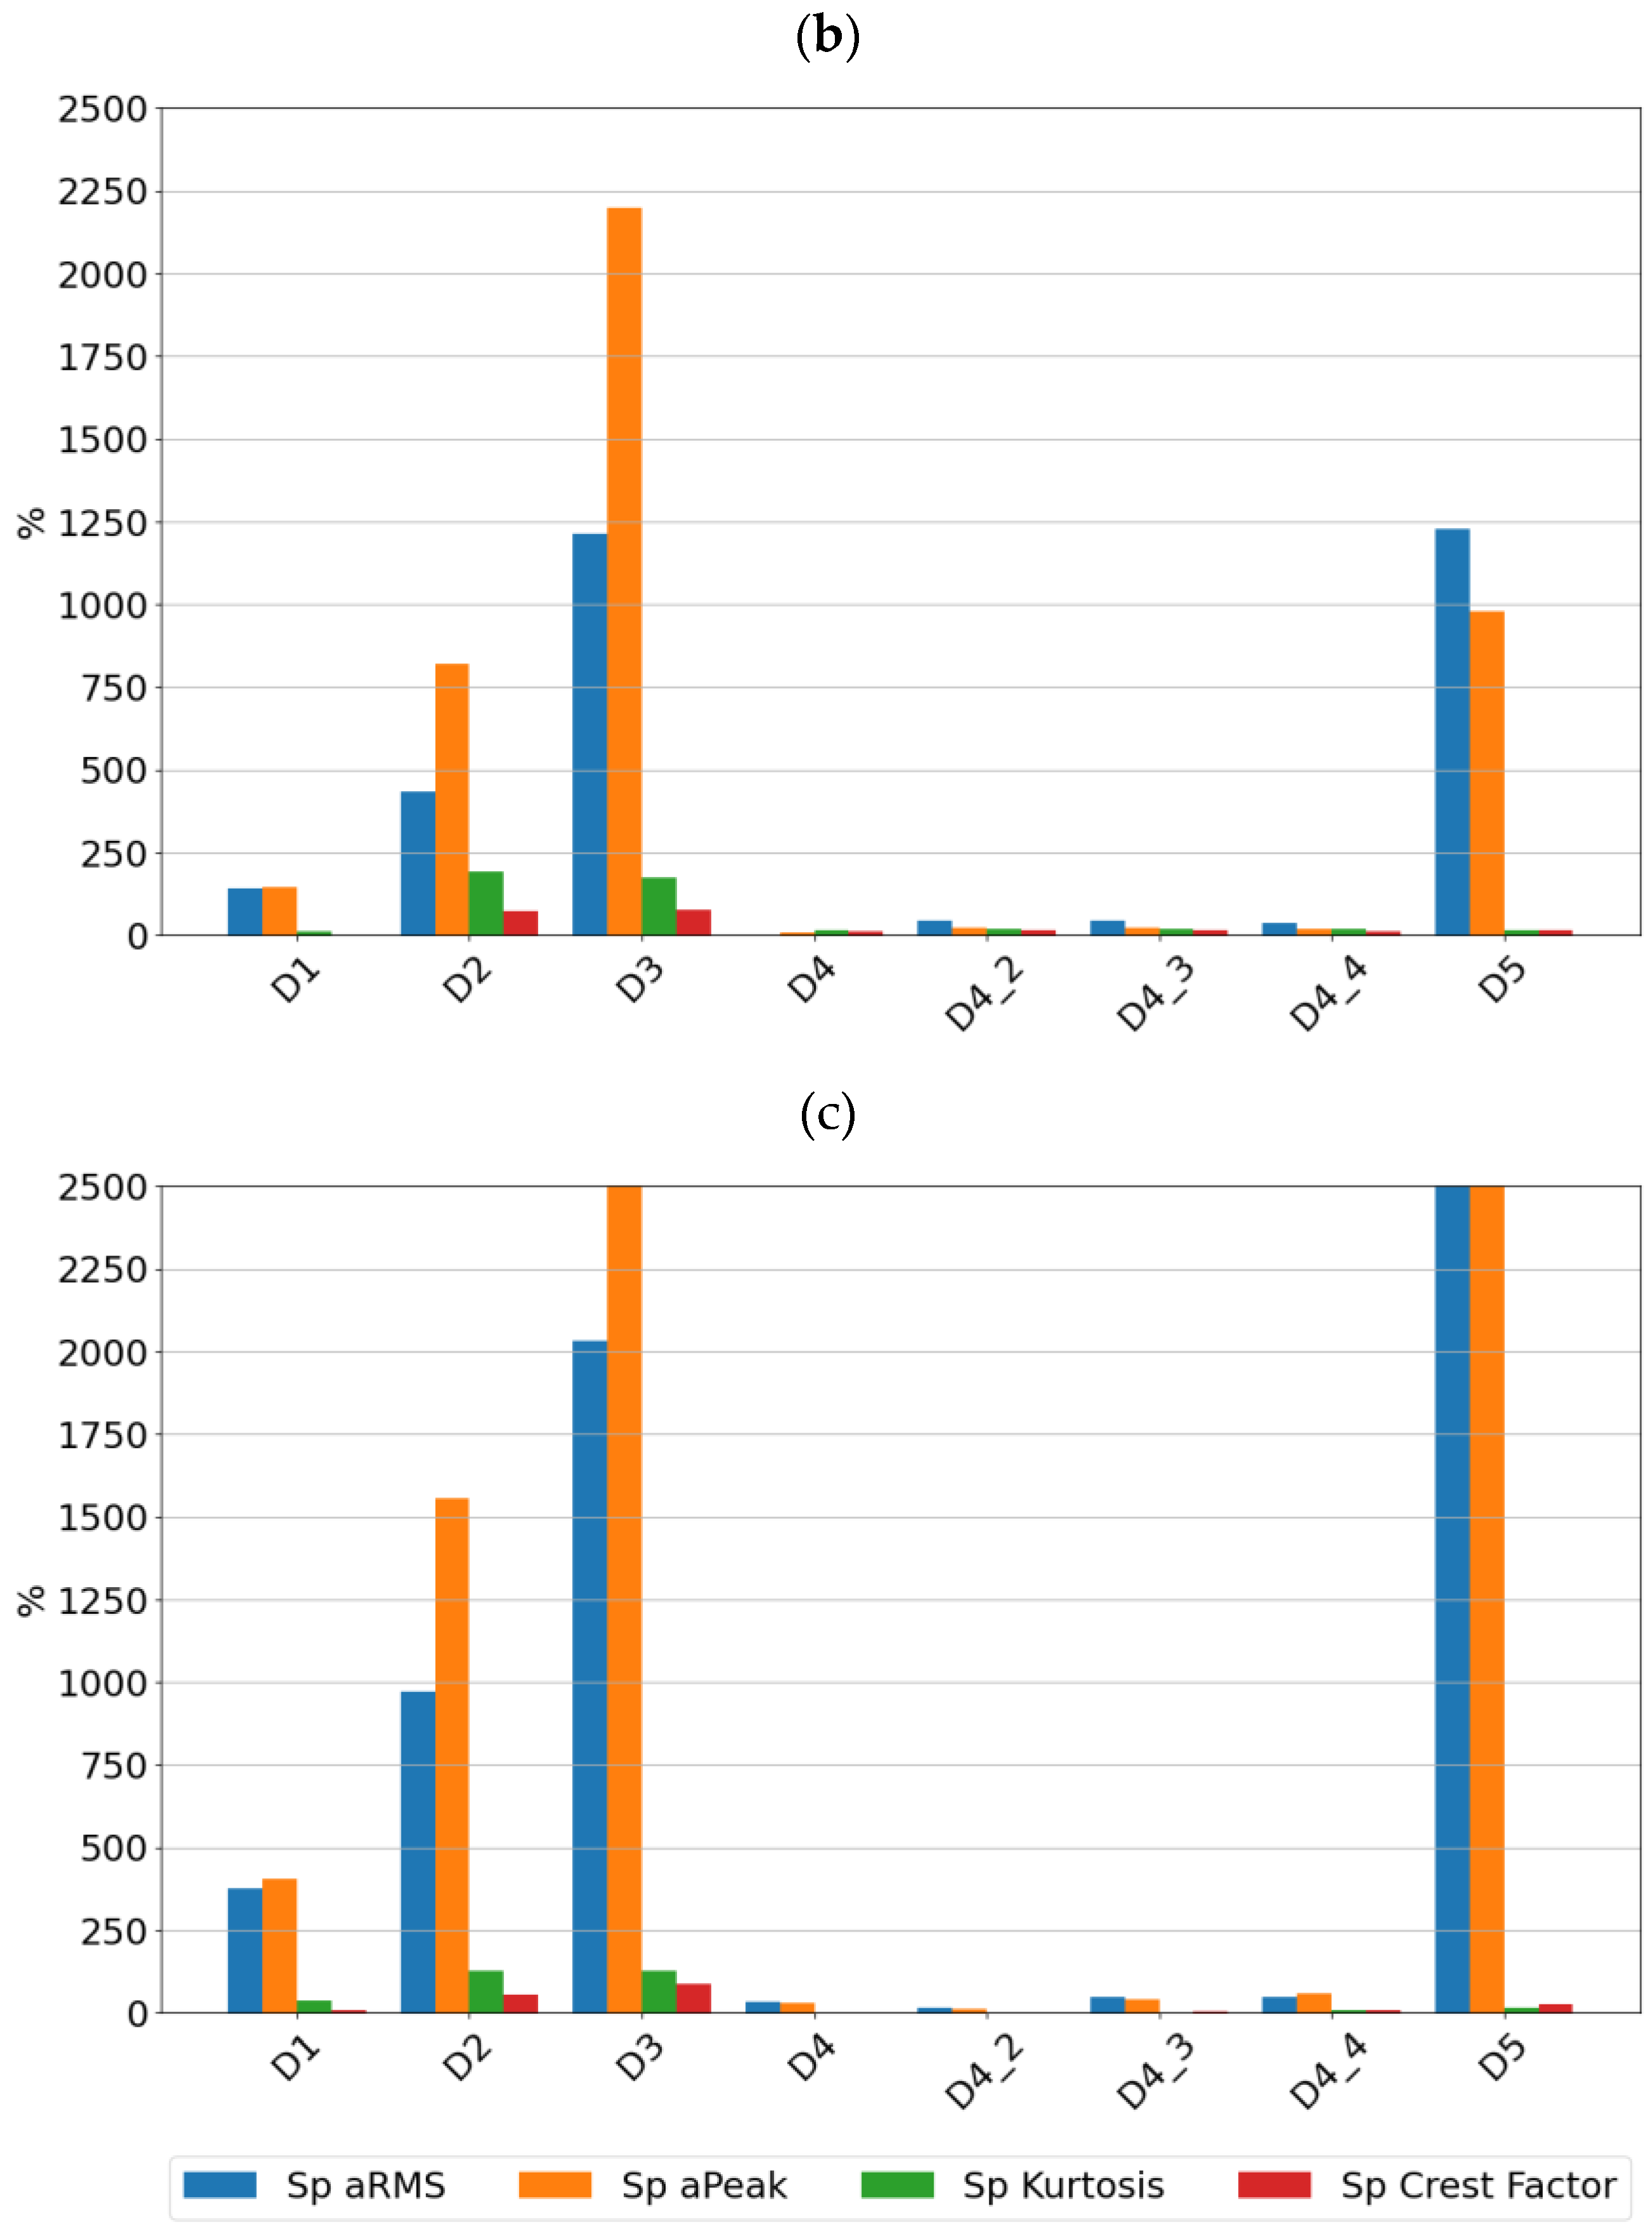
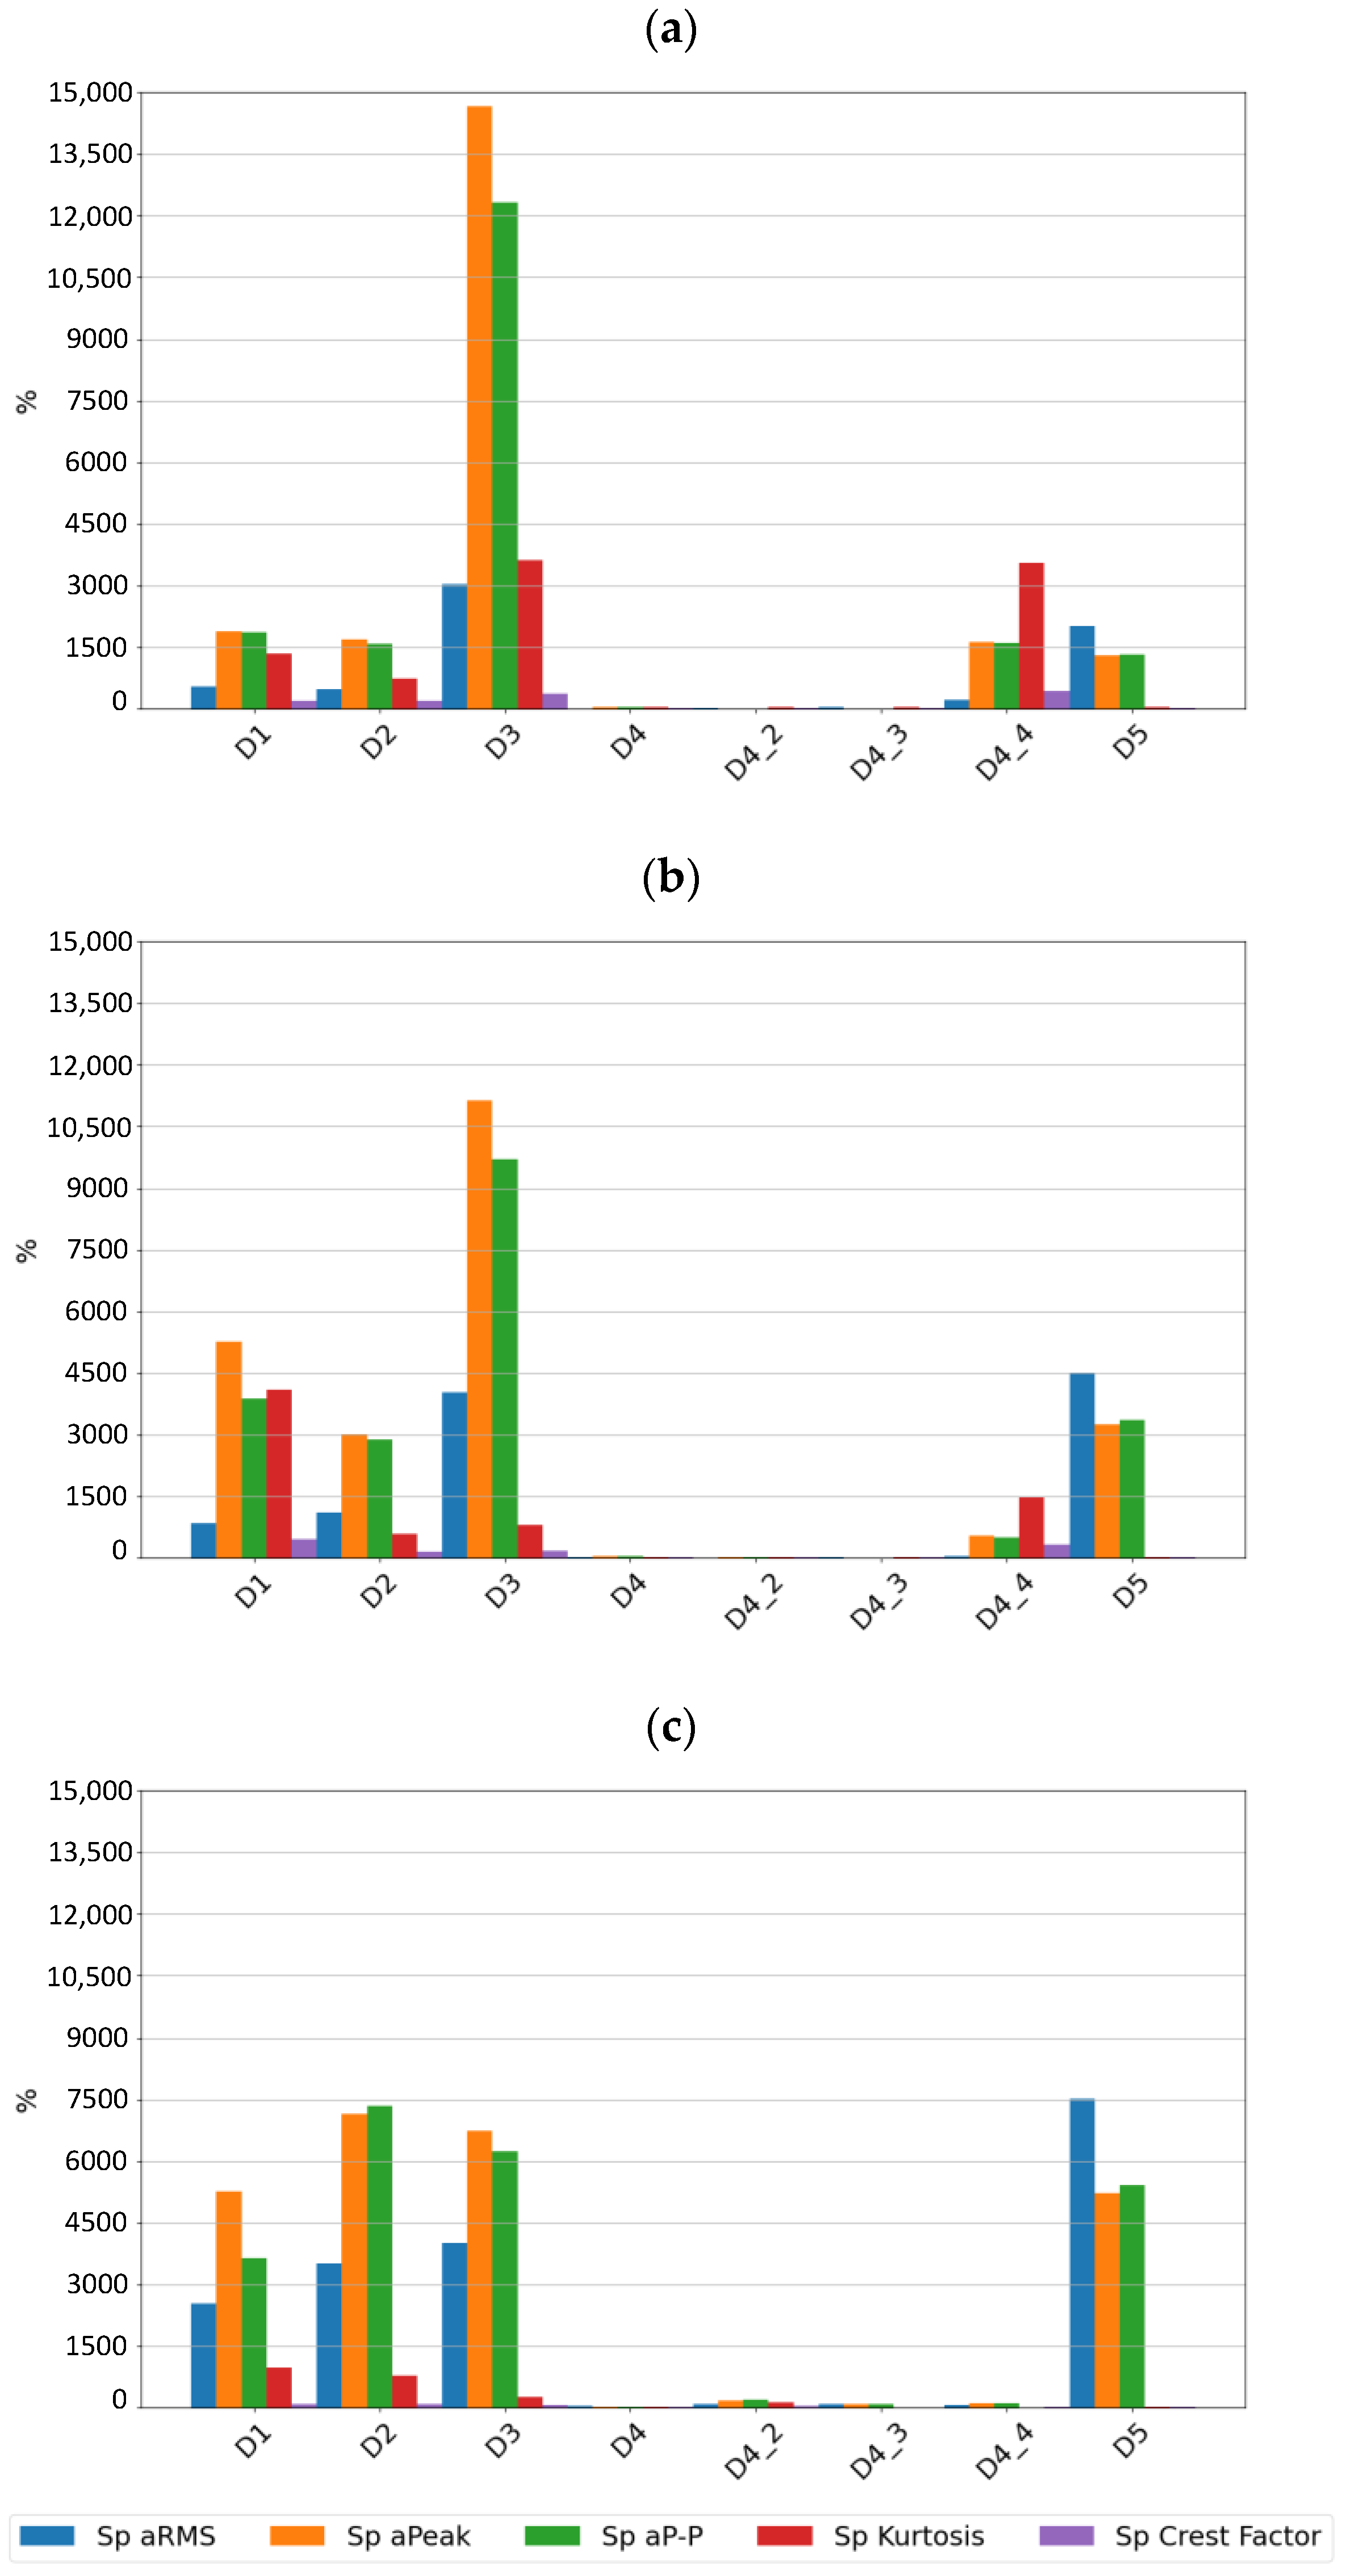
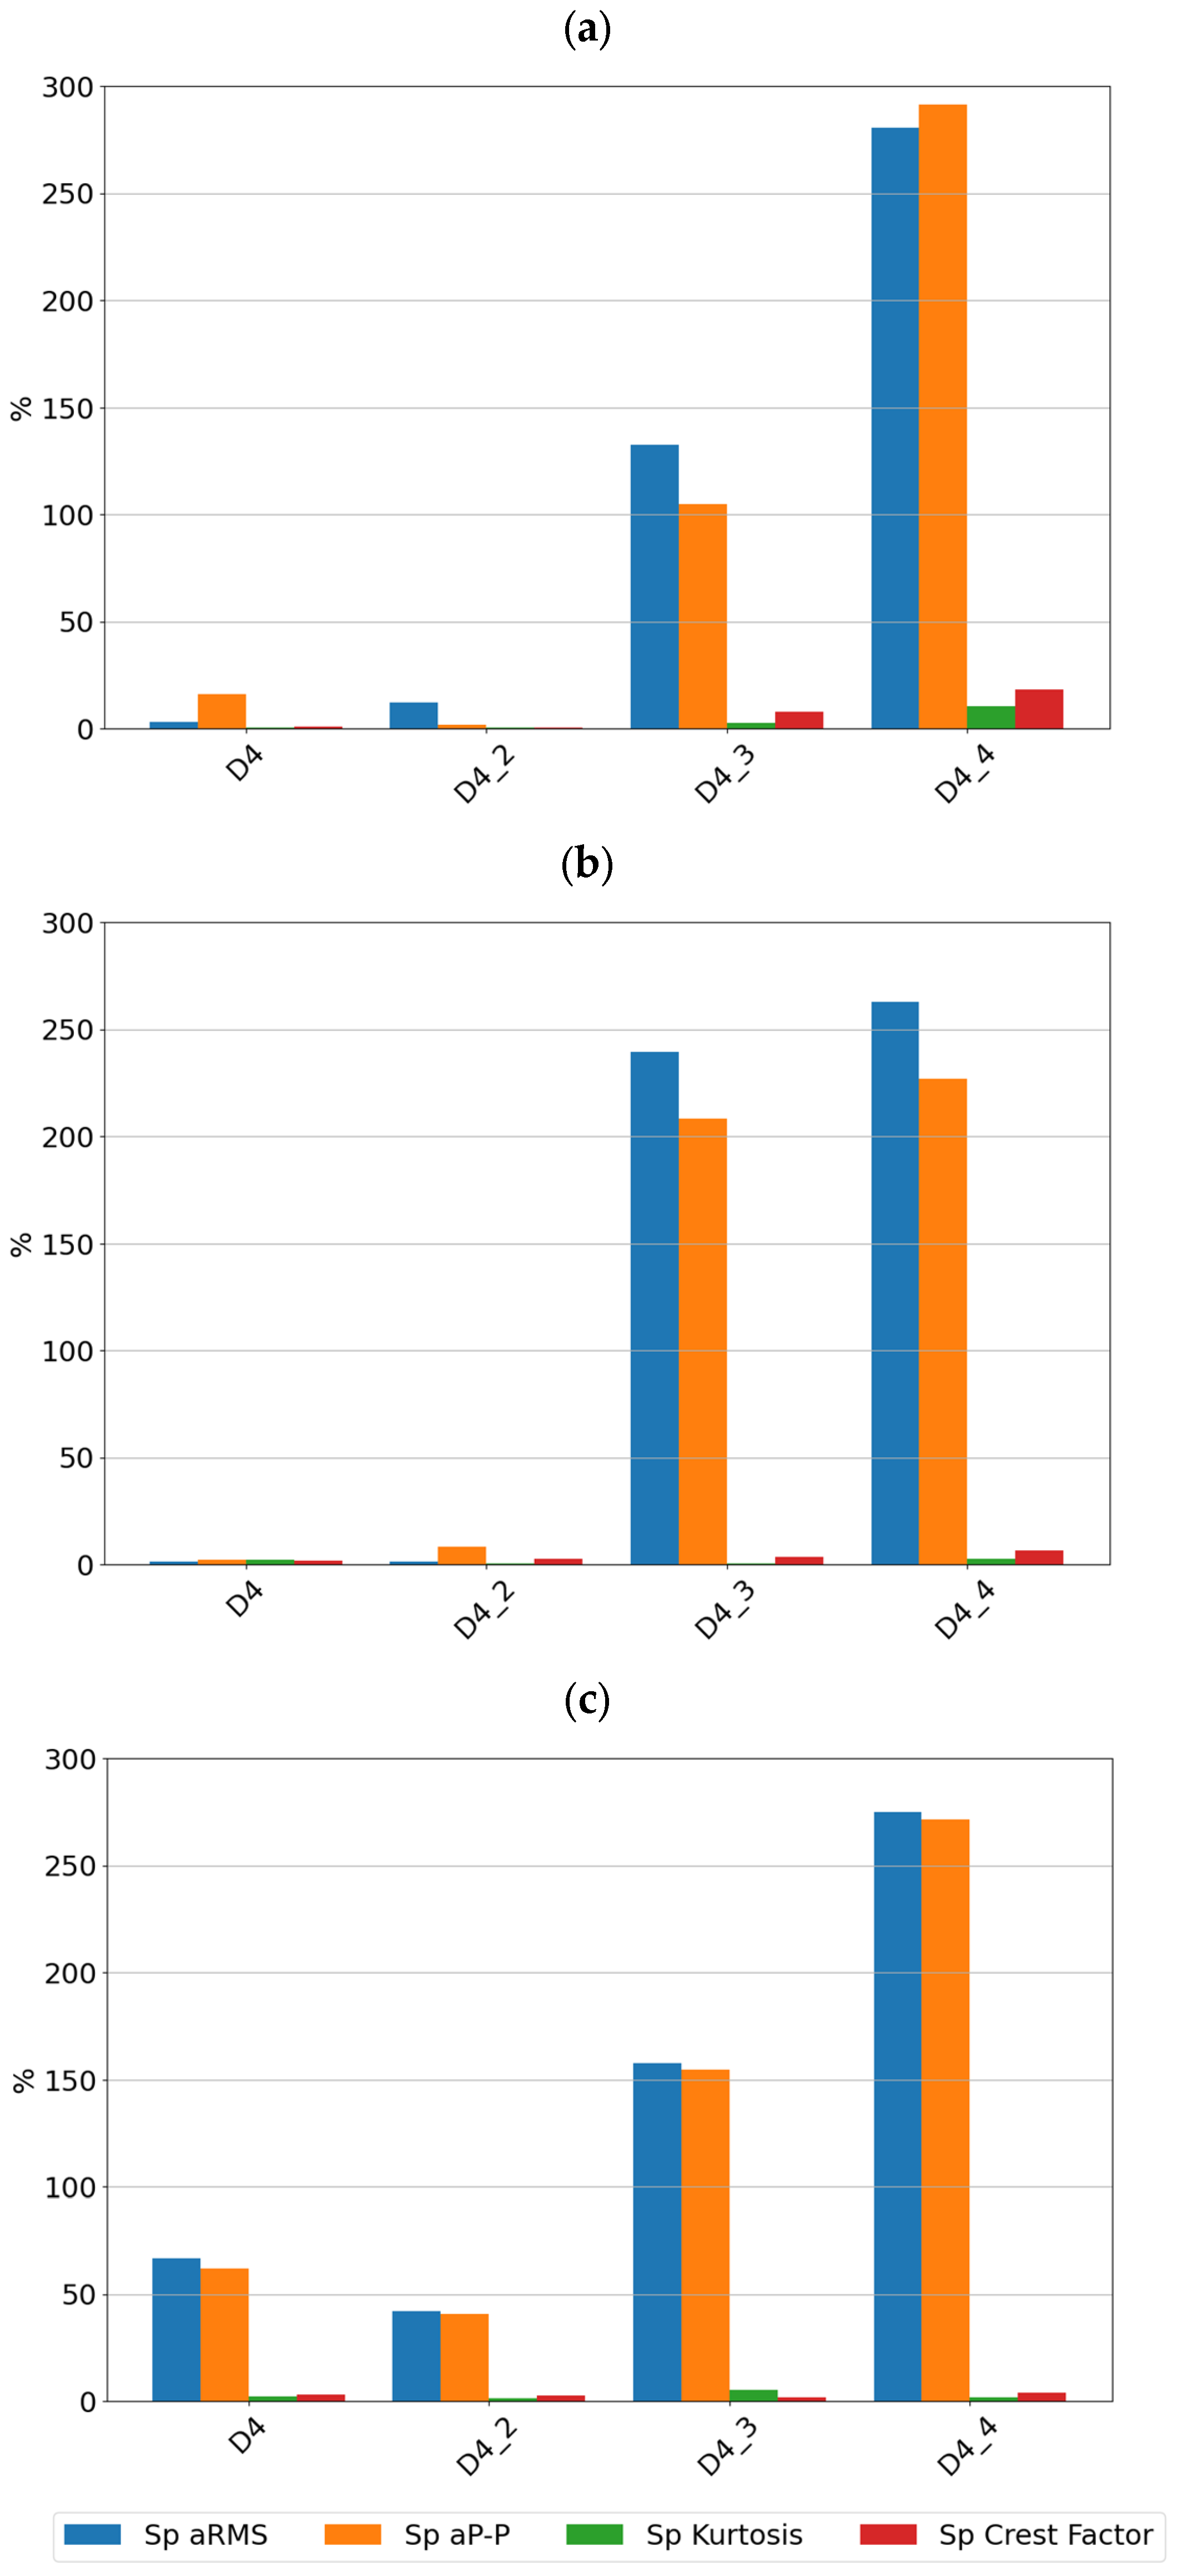
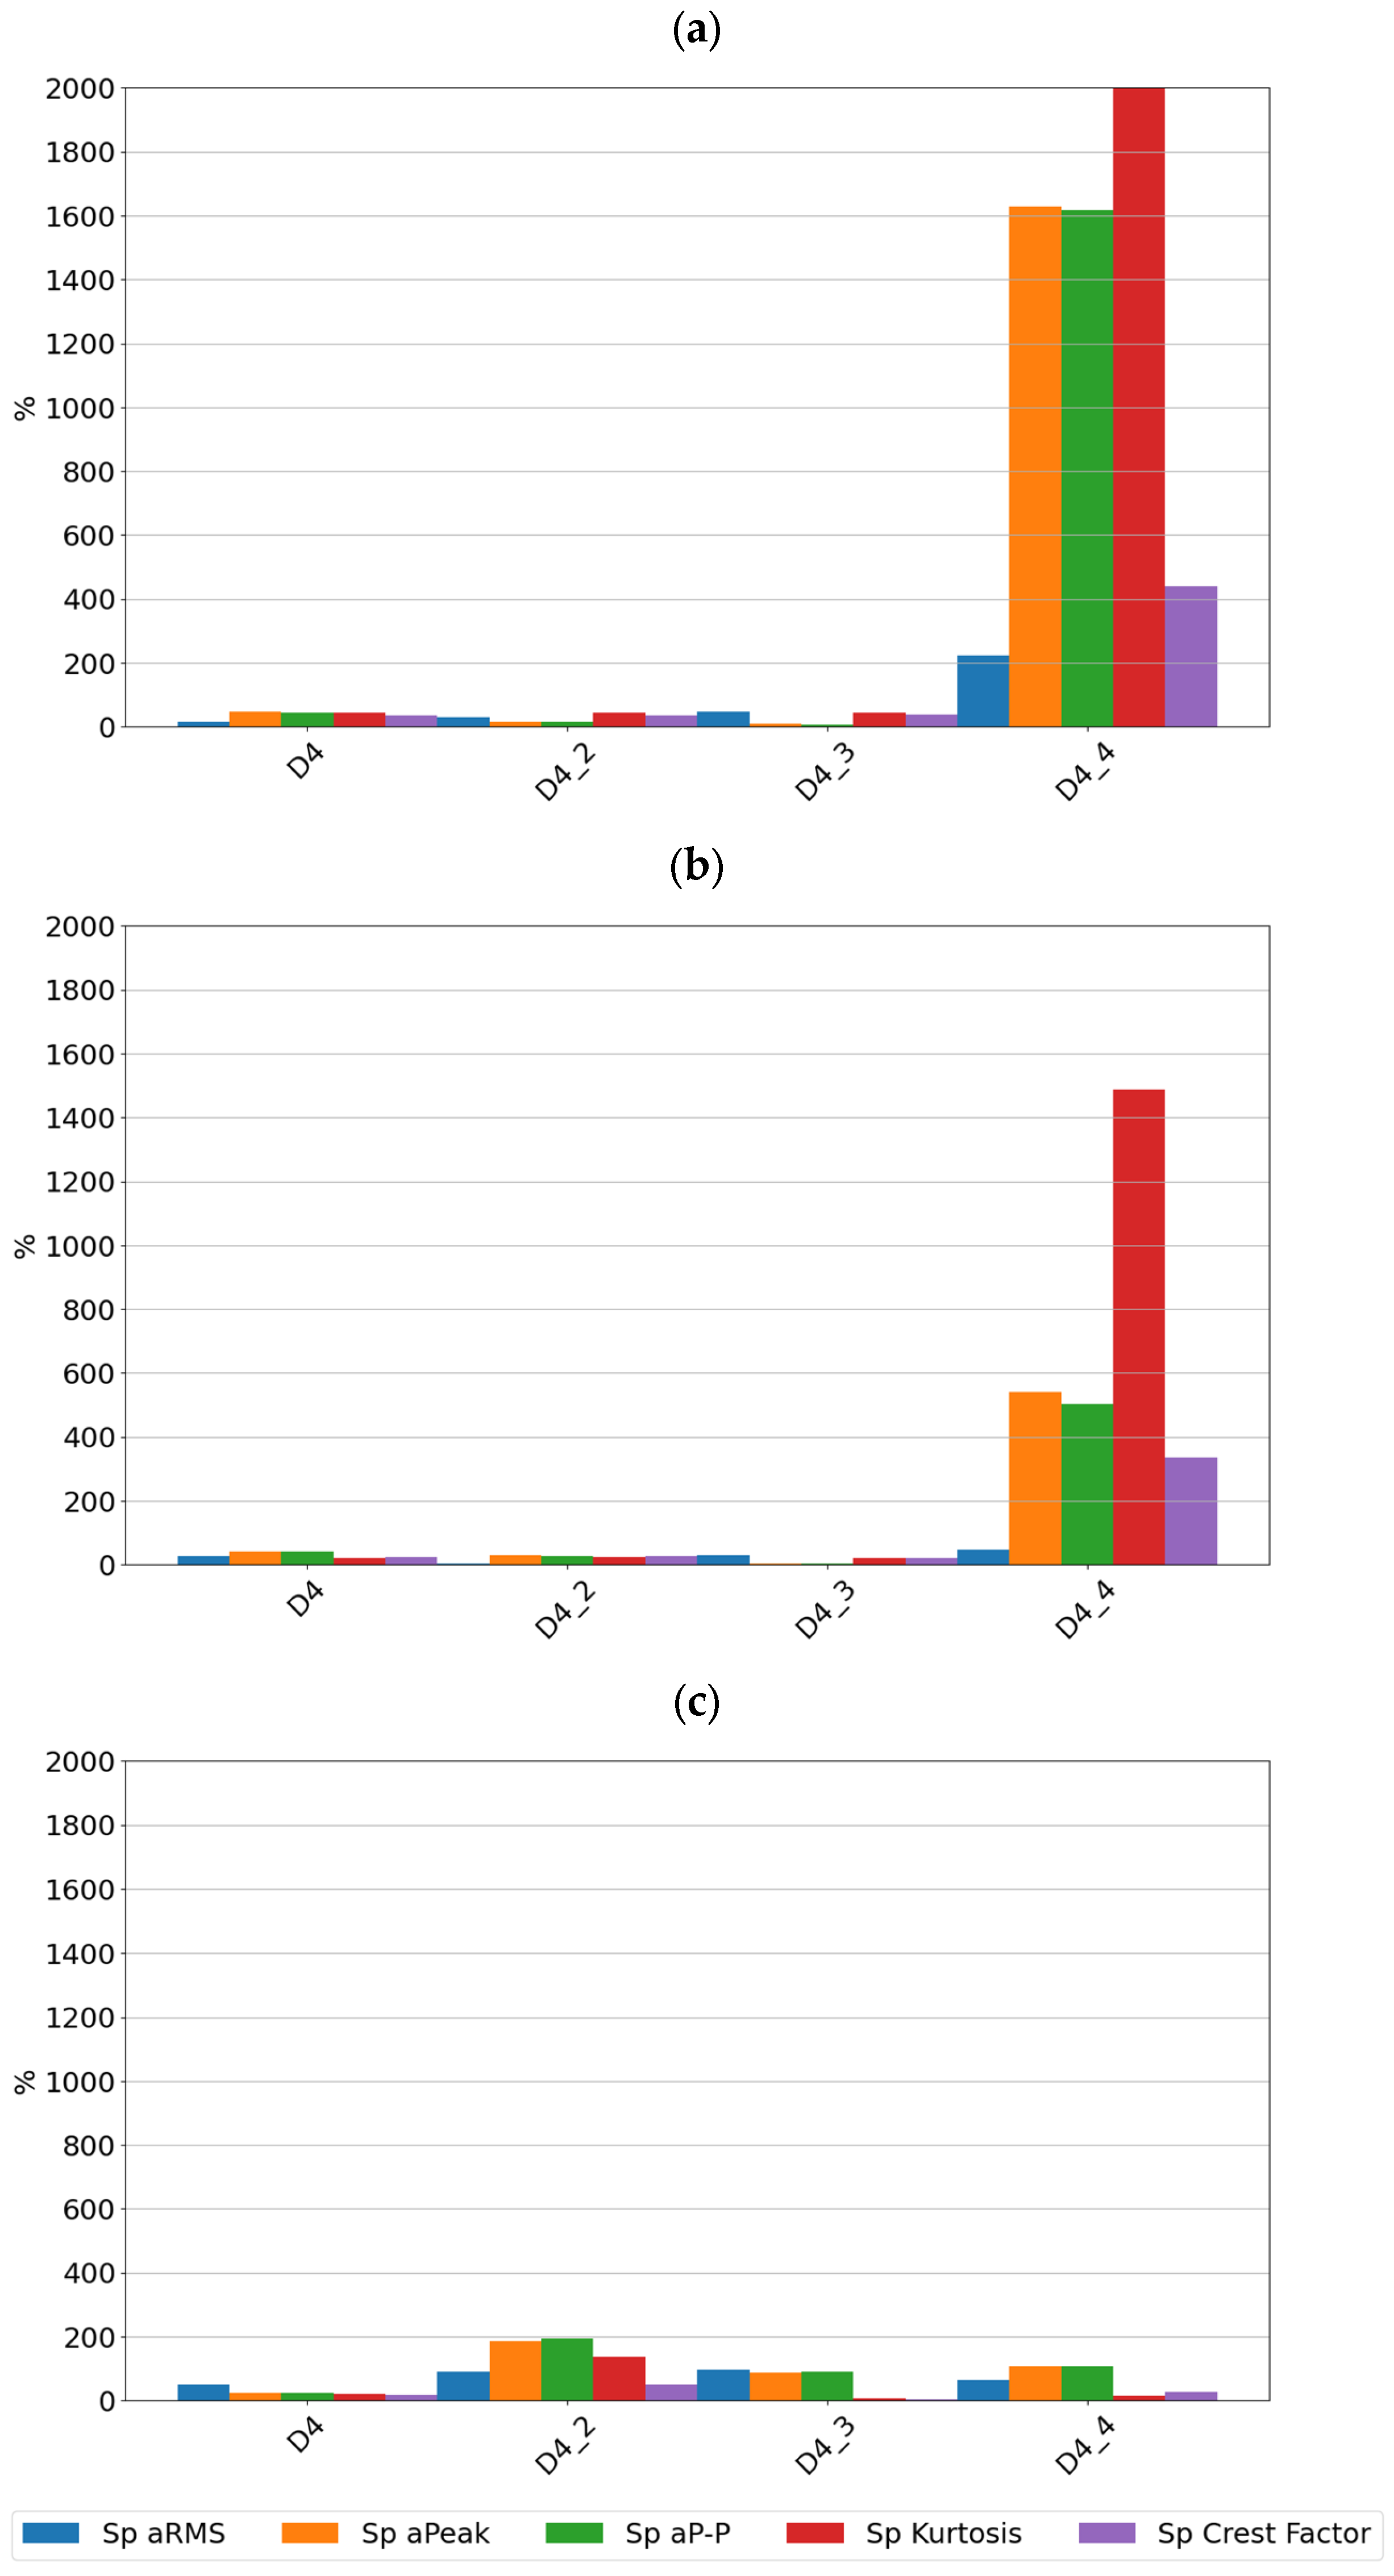
3. Results
The Test Bench and Experiment Description
4. Conclusions
Author Contributions
Funding
Institutional Review Board Statement
Informed Consent Statement
Data Availability Statement
Conflicts of Interest
References
- Howard, I. A Review of Rolling Element Bearing Vibration: Detection, Diagnosis and Prognosis; Department of Defense: Sydney, Australia, 1994.
- Randall, R.B.; Antoni, J. Rolling Element Bearing Diagnostics—A Tutorial. Mech. Syst. Signal Process. 2011, 25, 485–520. [Google Scholar] [CrossRef]
- Mathew, J.; Alfredson, R.J. The Condition Monitoring of Rolling Element Bearings Using Vibration Analysis. J. Vib. Acoust. 1984, 106, 447–453. [Google Scholar] [CrossRef]
- Ghazaly, N.; Samy, A.; Mousa, M.O. Bearing Fault Detection Techniques—A Review. Turk. J. Eng. Sci. Technol. 2015, 3, 1–18. [Google Scholar]
- ISO 15243:2017; Rolling Bearings. Damage and Failures. Terms, Characteristics and Causes. International Standards Organization: Geneva, Switzerland, 2017.
- Niu, W.; Fang, L.; Xu, L.; Li, X.; Huo, R.; Guo, D.; Qi, Z. Summary of Research Status and Application of MEMS Accelerometers. J. Comput. Commun. 2018, 6, 215–221. [Google Scholar] [CrossRef]
- SPM Instrument AB. Bearing Condition Monitoring: Case Studies. Available online: https://www.spminstrument.com/ (accessed on 5 June 2024).
- Sundström, T. An Introduction to the SPM HD Method, R&D; SPM Instrument AB: Strängnäs, Sweden, 2010. [Google Scholar]
- Adash. DDS Software Manual. 2023. Available online: https://adash.com/ (accessed on 5 June 2024).
- ISO 13373-3:2015; Condition Monitoring and Diagnostics of Machines Vibration Condition Monitoring Part 3: Guidelines for Vibration Diagnosis. International Standards Organization: Geneva, Switzerland, 2015.
- VDI 3832:2013; Measurement of Structure-Borne Sound of Rolling Element Bearings in Machines and Plants for Evaluation of Condition. Verein Deutscher Ingenieure: Düsseldorf, Germany, 2013.
- Tandon, N.; Choudhury, A. A Review of Vibration and Acoustic Measurement Methods for the Detection of Defects in Rolling Element Bearings. Tribol. Int. 1999, 32, 469–480. [Google Scholar] [CrossRef]
- Murphy, C. Choosing the Most Suitable Predictive Maintenance Sensor. Analog Devices. 2020. Available online: https://www.analog.com/en/resources/technical-articles/choosing-the-most-suitable-predictive (accessed on 5 June 2024).
- Murphy, C. Why MEMS Accelerometers Are Becoming the Designer’s Best Choice for CbM Applications. Analog Devices. 2021. Available online: https://www.analog.com/en/resources/technical-articles/why-memes-acceler-are-best-choice-for-cbm-apps.html (accessed on 5 June 2024).
- Landi, E.; Prato, A.; Fort, A.; Mugnaini, M.; Vignoli, V.; Facello, A.; Mazzoleni, F.; Murgia, M.; Schiavi, A. Highly Reliable Multicomponent MEMS Sensor for Predictive Maintenance Management of Rolling Bearings. Micromachines 2023, 14, 376. [Google Scholar] [CrossRef] [PubMed]
- Staszewski, W.; Jablonski, A.; Dziedziech, K.; Barszcz, T. Modelling and testing of MEMS based vibration sensor for rolling element bearing fault detection. In Proceedings of the Diagnostyka Maszyn: XLVII Ogólnopolskie Sympozjum, Wisła, Poland, 1–5 March 2020. [Google Scholar]
- Zusman, G. The Comparison of Piezoelectric and MEM Sensors Intended for Vibration Condition Machinery Monitoring. In Proceedings of the Latin American Workshop on Structural Health Monitoring, Cartagena de Indias, Colombia, 5–7 December 2023; CIMNE: Barcelona, Spain, 2024. [Google Scholar]
- Rossi, A.; Bocchetta, G.; Botta, F.; Scorza, A. Accuracy Characterization of a MEMS Accelerometer for Vibration Monitoring in a Rotating Framework. Appl. Sci. 2023, 13, 5070. [Google Scholar] [CrossRef]
- Varanis, M.; Silva, A.; Mereles, A.; Pederiva, R. MEMS Accelerometers for Mechanical Vibrations Analysis: A Comprehensive Review with Applications. J. Braz. Soc. Mech. Sci. Eng. 2018, 40, 527. [Google Scholar] [CrossRef]
- Augustyn, D.; Fidali, M. Identification and Evaluation of the Characteristics of a Selected Commercial Mems Based Vibration Sensor for the Machine Condition Monitoring. Diagnostyka 2023, 24, 1–8. [Google Scholar] [CrossRef]
- ISO 10816-8:2014; Mechanical Vibration — Evaluation of machine vibration by measurements on non-rotating parts. International Standards Organization: Geneva, Switzerland.
- ISO 20816-1:2016; Mechanical Vibration—Measurement and Evaluation of Machine Vibration. International Standards Organization: Geneva, Switzerland.
- Anslow, R. How to Design a Good Vibration Sensor Enclosure Using Modal Analysis; Analog Devices: Wilmington, MA, USA, 2022. [Google Scholar]
- Albarbar, A.; Mekid, S.; Starr, A.; Pietruszkiewicz, R. Suitability of MEMS Accelerometers for Condition Monitoring: An Experimental Study. Sensors 2008, 8, 784–799. [Google Scholar] [CrossRef]
- Sick AG. Condition Monitoring Sensors for Vibration, Shock, and Temperature Monitoring (Technical Documentation). Available online: https://www.sick.com/ (accessed on 5 June 2024).
- Balluff GmbH. Condition Monitoring Sensor with Integrated Data Preprocessing, (Technical Documentation). Available online: https://www.balluff.com/ (accessed on 5 June 2024).
- Banner Engineering Corp. Sure Cross® QM30VT2 Vibration and Temperature Sensor (Technical Documentation). Available online: https://www.bannerengineering.com/ (accessed on 5 June 2024).
- ISO 20816-3:2022; Mechanical Vibration—Measurement and Evaluation of Machine Vibration Part 3: Industrial Machinery with a Power Rating above 15 kW and Operating Speeds between 120 r/Min and 30 000 r/Min. International Standards Organization: Geneva, Switzerland, 2022.
- Wachla, D. Badanie Wrażliwości Diagnostycznej Cech Sygnałów Wibroakustycznych Przekładni Zębatych w Dziedzinie Czasu. In Methods of Artificial Intelligence in Mechanics and Mechanical Engineering; Silesian University of Technology: Gliwice, Poland, 2000; pp. 319–324. [Google Scholar]
- Wojtusik, J. Wrażliwość Diagnostyczna Wzajemnych Cech Par Sygnałów Wibroakustycznych w Ujęciu Metod Klasyfikacji i Grupowania. In Methods of Artificial Intelligence in Mechanics and Mechanical Engineering; Silesian University of Technology: Gliwice, Poland, 2000; pp. 363–366. [Google Scholar]
- Cholewa, W.; Cholewa, W.; Kiciński, J. Diagnostyka Techniczna: Metody Odwracania Nieliniowych Modeli Obiektów; Silesian University of Technology: Gliwice, Poland, 2001; ISBN 978-83-906533-8-9. [Google Scholar]


| Classification of Bearing Condition | |
|---|---|
| >1 | Condition improvement |
| 1.0–0.5 | Standard bearing condition |
| 0.5–0.2 | Deteriorating bearing condition |
| 0.2–0.02 | Advanced damage |
| <0.02 | Failure |
| Balluff BCM0002 | Banner QM30VT2 | Sick MPB10 | |
|---|---|---|---|
| Number of axes | 3 | 2 | 3 |
| Measuring range | ±16 g | N/A | ±8 g |
| Measuring range vRMS | N/A | 0–46 mm/s | 0–100 mm/s (at 88 Hz) |
| Frequency range | 2–2500 Hz | 10–4000 Hz | 0.78–3200 Hz |
| Accuracy | ±10% (2–1800 Hz) ±3 dB (2–2500 Hz) | ±10% (at 25 °C) | ±6% |
| Interface | IO-Link 1.1 | RS-485 (Modbus RTU) | IO-Link 1.1 |
| Operating temperature | −25 to +70 °C | −40 to +105 °C | –40 to +80 °C |
| Balluff BCM0003 | Banner QM30VT2 | Sick MPB10 | |
|---|---|---|---|
| 10–1000 Hz | 1000–4000 Hz | ||
| RMS Peak to Peak Max Kurtosis Crest Factor Skewness | vRMS (mm/s) vPeak (mm/s) aRMS (G) vPeak Component Frequency (Hz) Simplified Order Spectrum | aRMS (G) aPeak (G) Kurtosis Crest Factor | aRMS vRMS Variance Skewness Peak to Peak Shape factor Crest factor Impulse factor FFT spectrum analysis |
| Bearing ID | Condition Characterization |
|---|---|
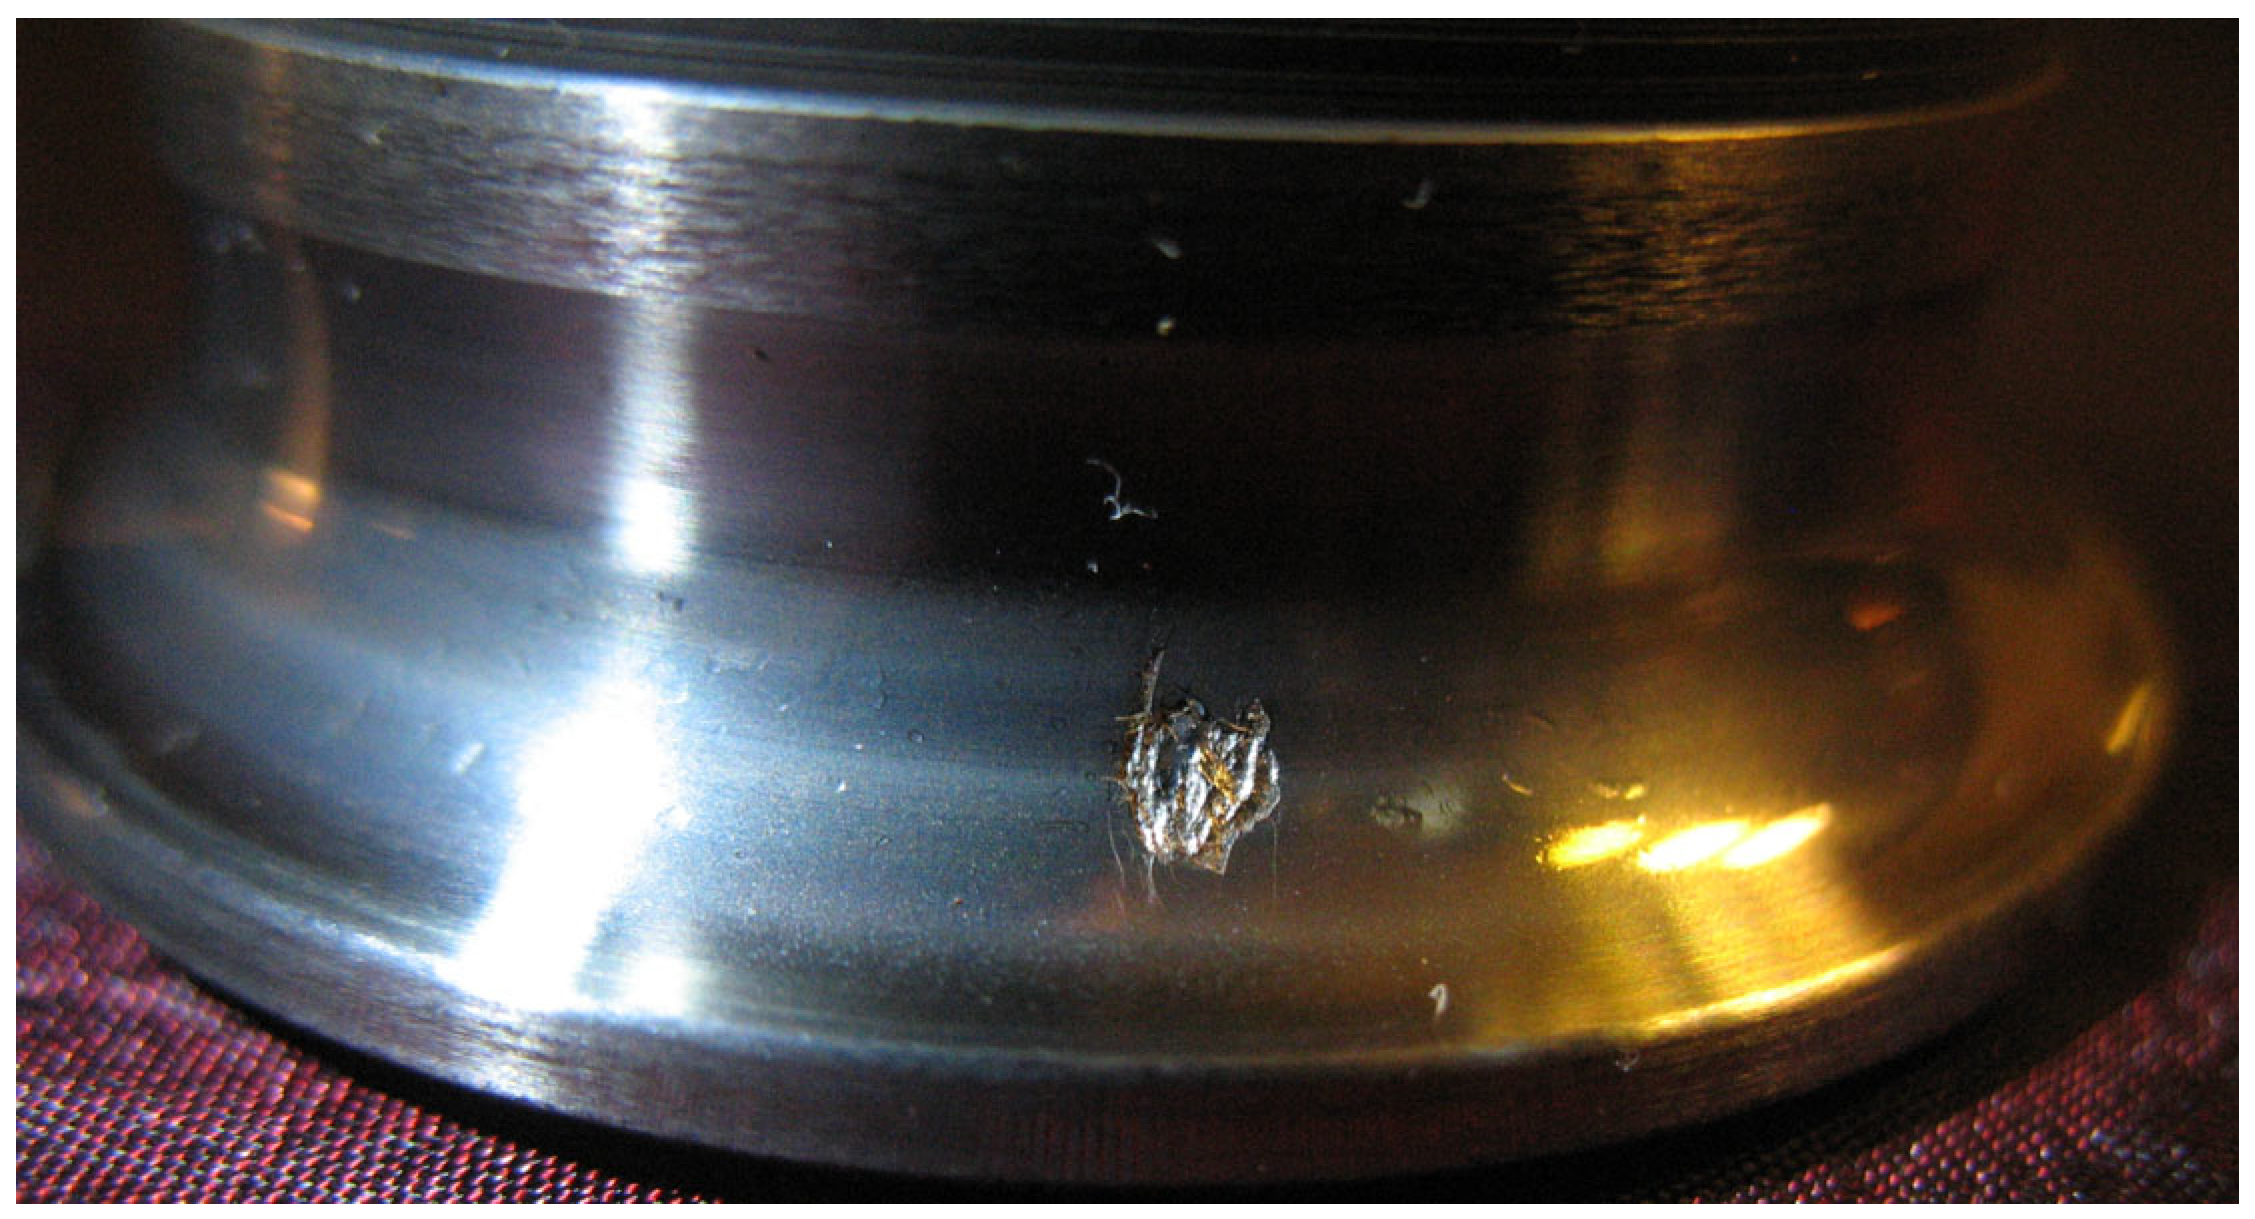
| D1 | Damaged outer race |
| D2 | Damaged inner race |
| D3 | Damaged rolling element |
| D4 | Bearing cage damaged (1 crack) |
| D4_2 | Bearing cage damaged (2 cracks) |
| D4_3 | Bearing cage damaged (3 cracks) |
| D4_4 | Bearing cage missing |
| D5 | No bearing lubricant |
| Speed | 600 | 1500 | 3000 | ||||||
|---|---|---|---|---|---|---|---|---|---|
| Feature Name | SEref | SE1 | SE2 | SEref | SE1 | SE2 | SEref | SE1 | SE2 |
| 3.25 | 4.66 | - | 3.51 | 7.52 | - | 2.7 | 6.22 | - | |
| 3.18 | - | 8.05 | 3.43 | - | 7.61 | 2.82 | - | 9.18 | |
| 14.19 | - | 19.96 | 15.56 | - | 14.6 | 15.42 | - | 15.86 | |
| 14.48 | 11.15 | - | 14.50 | 13.02 | - | 16.34 | 9.12 | - | |
| 9.11 | 12.51 | 19.92 | 7.59 | 7.53 | 9.48 | 17.49 | 5.33 | 6.39 | |
| 12.83 | 10.85 | 15.16 | 13.74 | 9.17 | 12.32 | 14.07 | 8.48 | 10.88 | |
Disclaimer/Publisher’s Note: The statements, opinions and data contained in all publications are solely those of the individual author(s) and contributor(s) and not of MDPI and/or the editor(s). MDPI and/or the editor(s) disclaim responsibility for any injury to people or property resulting from any ideas, methods, instructions or products referred to in the content. |
© 2024 by the authors. Licensee MDPI, Basel, Switzerland. This article is an open access article distributed under the terms and conditions of the Creative Commons Attribution (CC BY) license (https://creativecommons.org/licenses/by/4.0/).
Share and Cite
Fidali, M.; Augustyn, D.; Ochmann, J.; Uchman, W. Evaluation of the Diagnostic Sensitivity of Digital Vibration Sensors Based on Capacitive MEMS Accelerometers. Sensors 2024, 24, 4463. https://doi.org/10.3390/s24144463
Fidali M, Augustyn D, Ochmann J, Uchman W. Evaluation of the Diagnostic Sensitivity of Digital Vibration Sensors Based on Capacitive MEMS Accelerometers. Sensors. 2024; 24(14):4463. https://doi.org/10.3390/s24144463
Chicago/Turabian StyleFidali, Marek, Damian Augustyn, Jakub Ochmann, and Wojciech Uchman. 2024. "Evaluation of the Diagnostic Sensitivity of Digital Vibration Sensors Based on Capacitive MEMS Accelerometers" Sensors 24, no. 14: 4463. https://doi.org/10.3390/s24144463