
Study of Resonance between Bogie Hunting and Carbody Mode via Field Measurements and Dynamic Simulation

Abstract
:1. Introduction
2. Field Measurements for EMUs
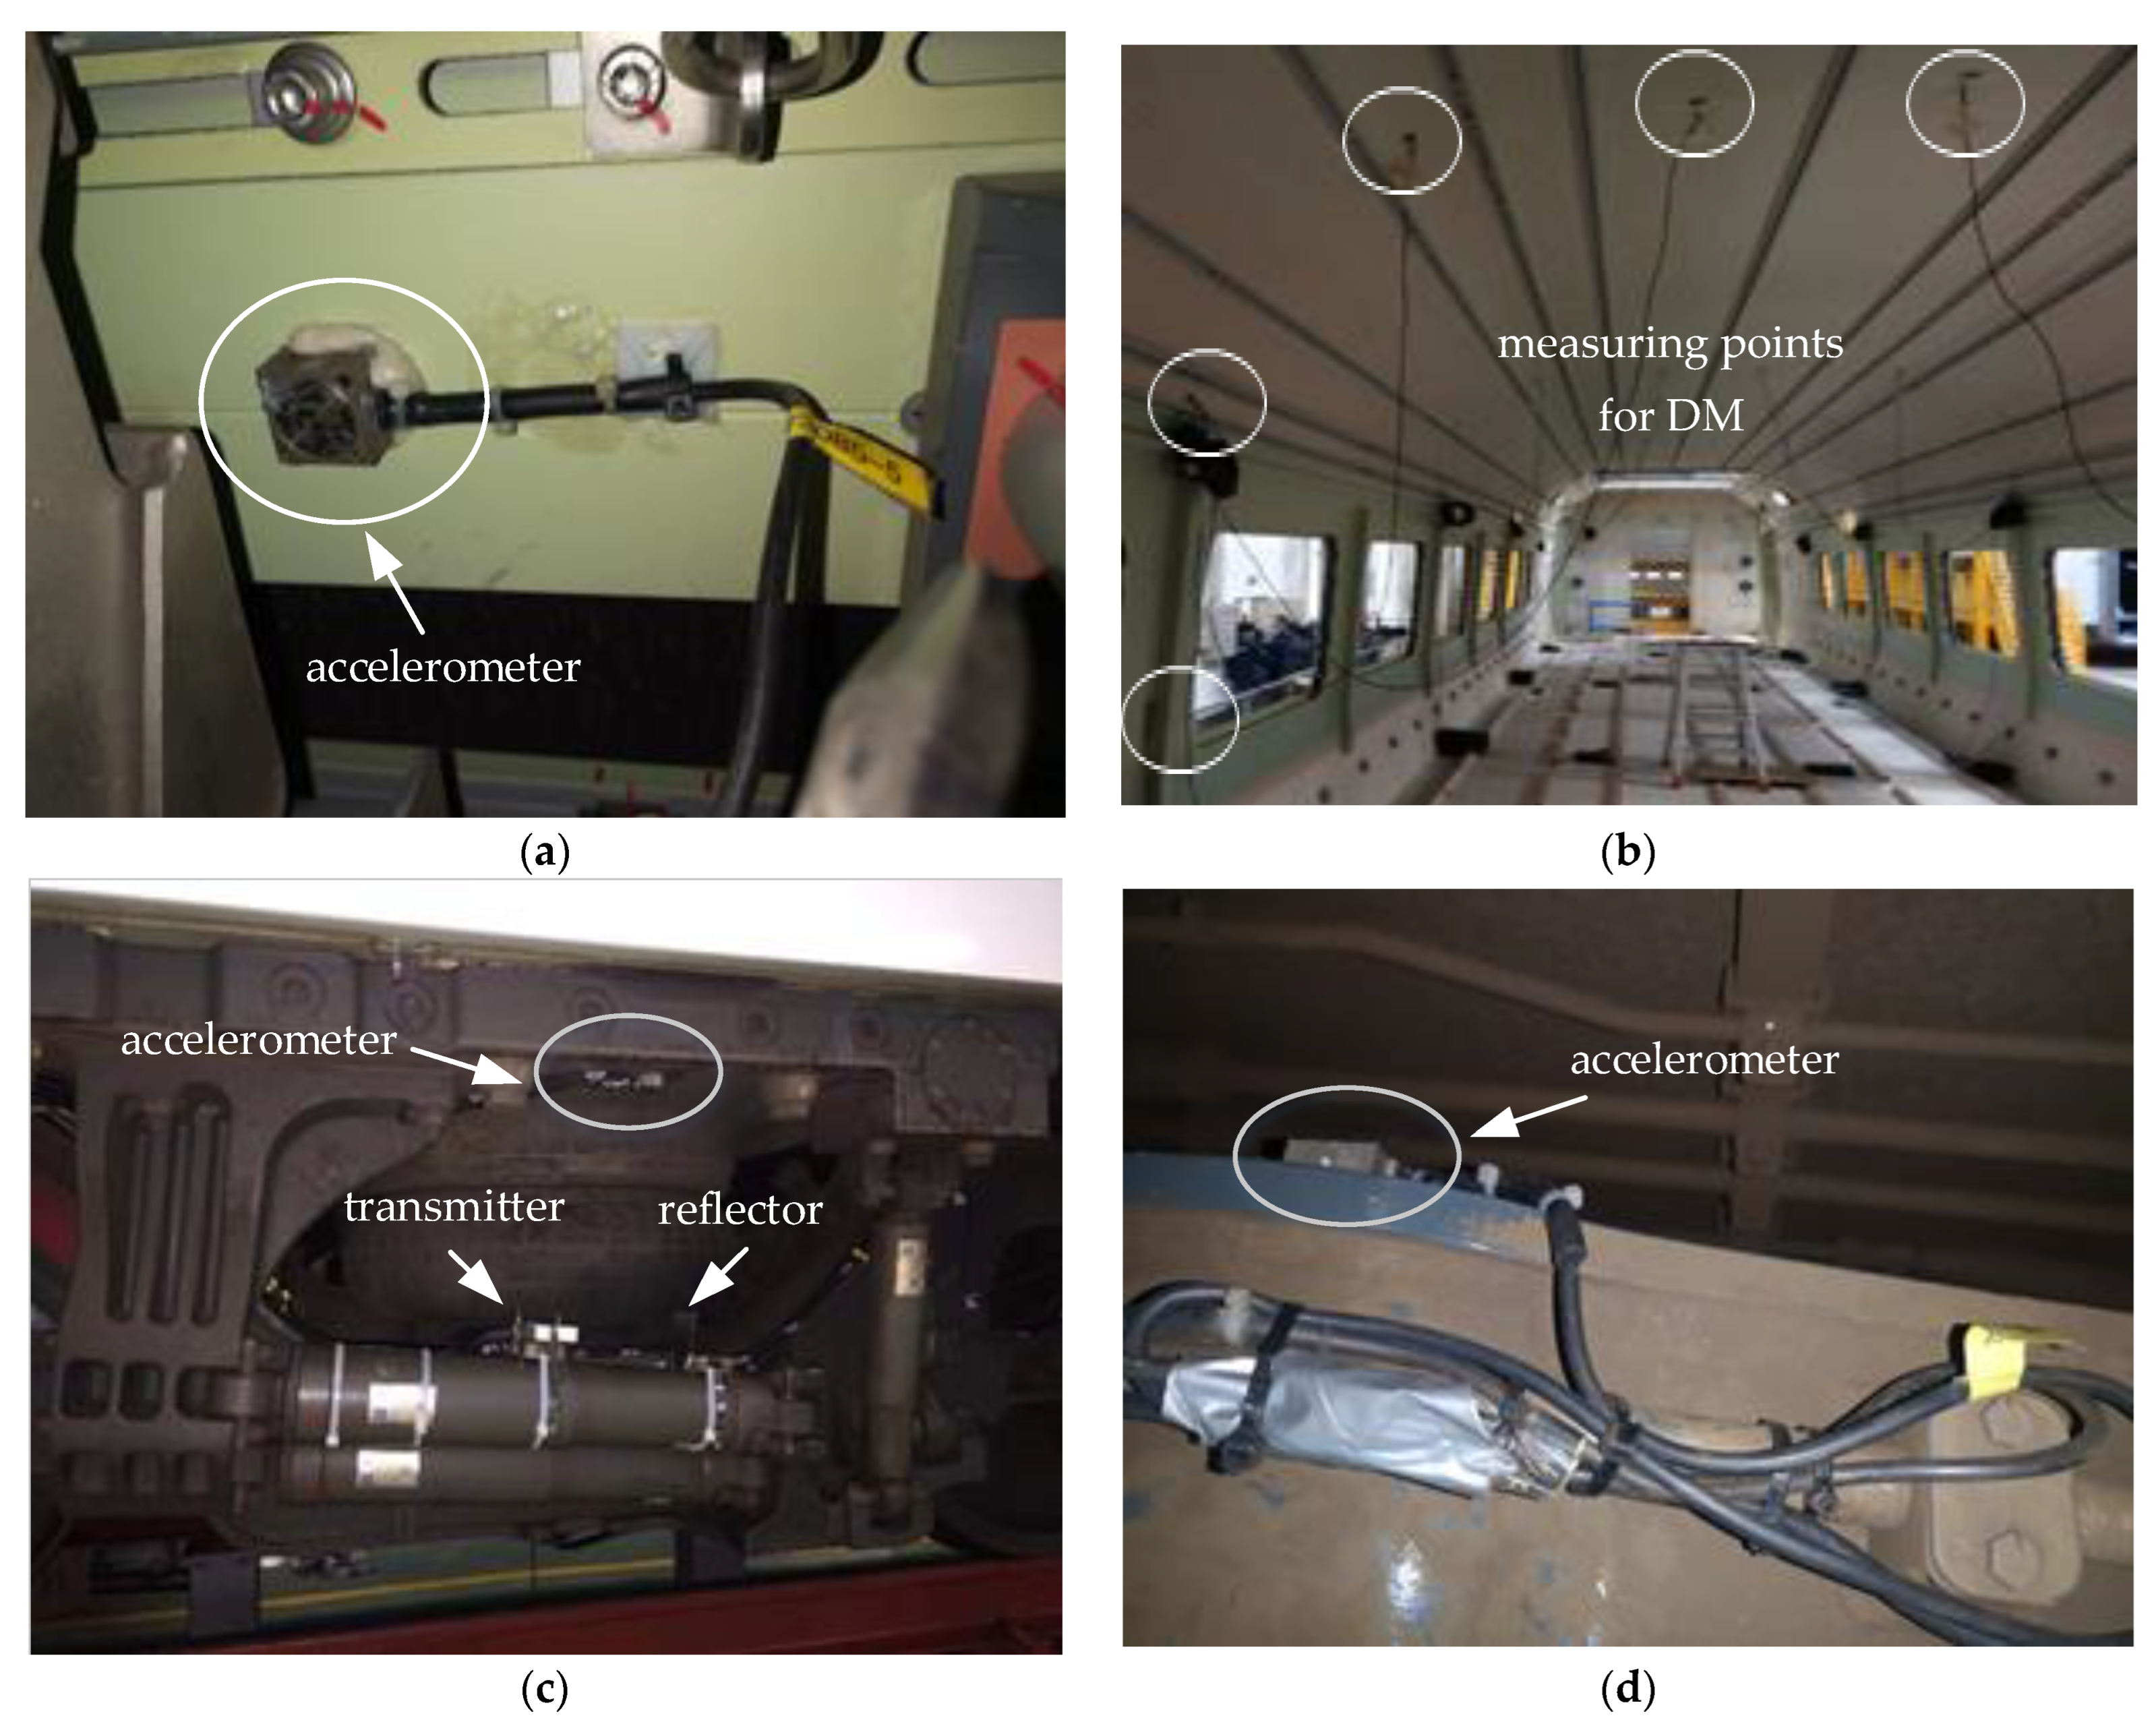
2.1. Methods for Field Test
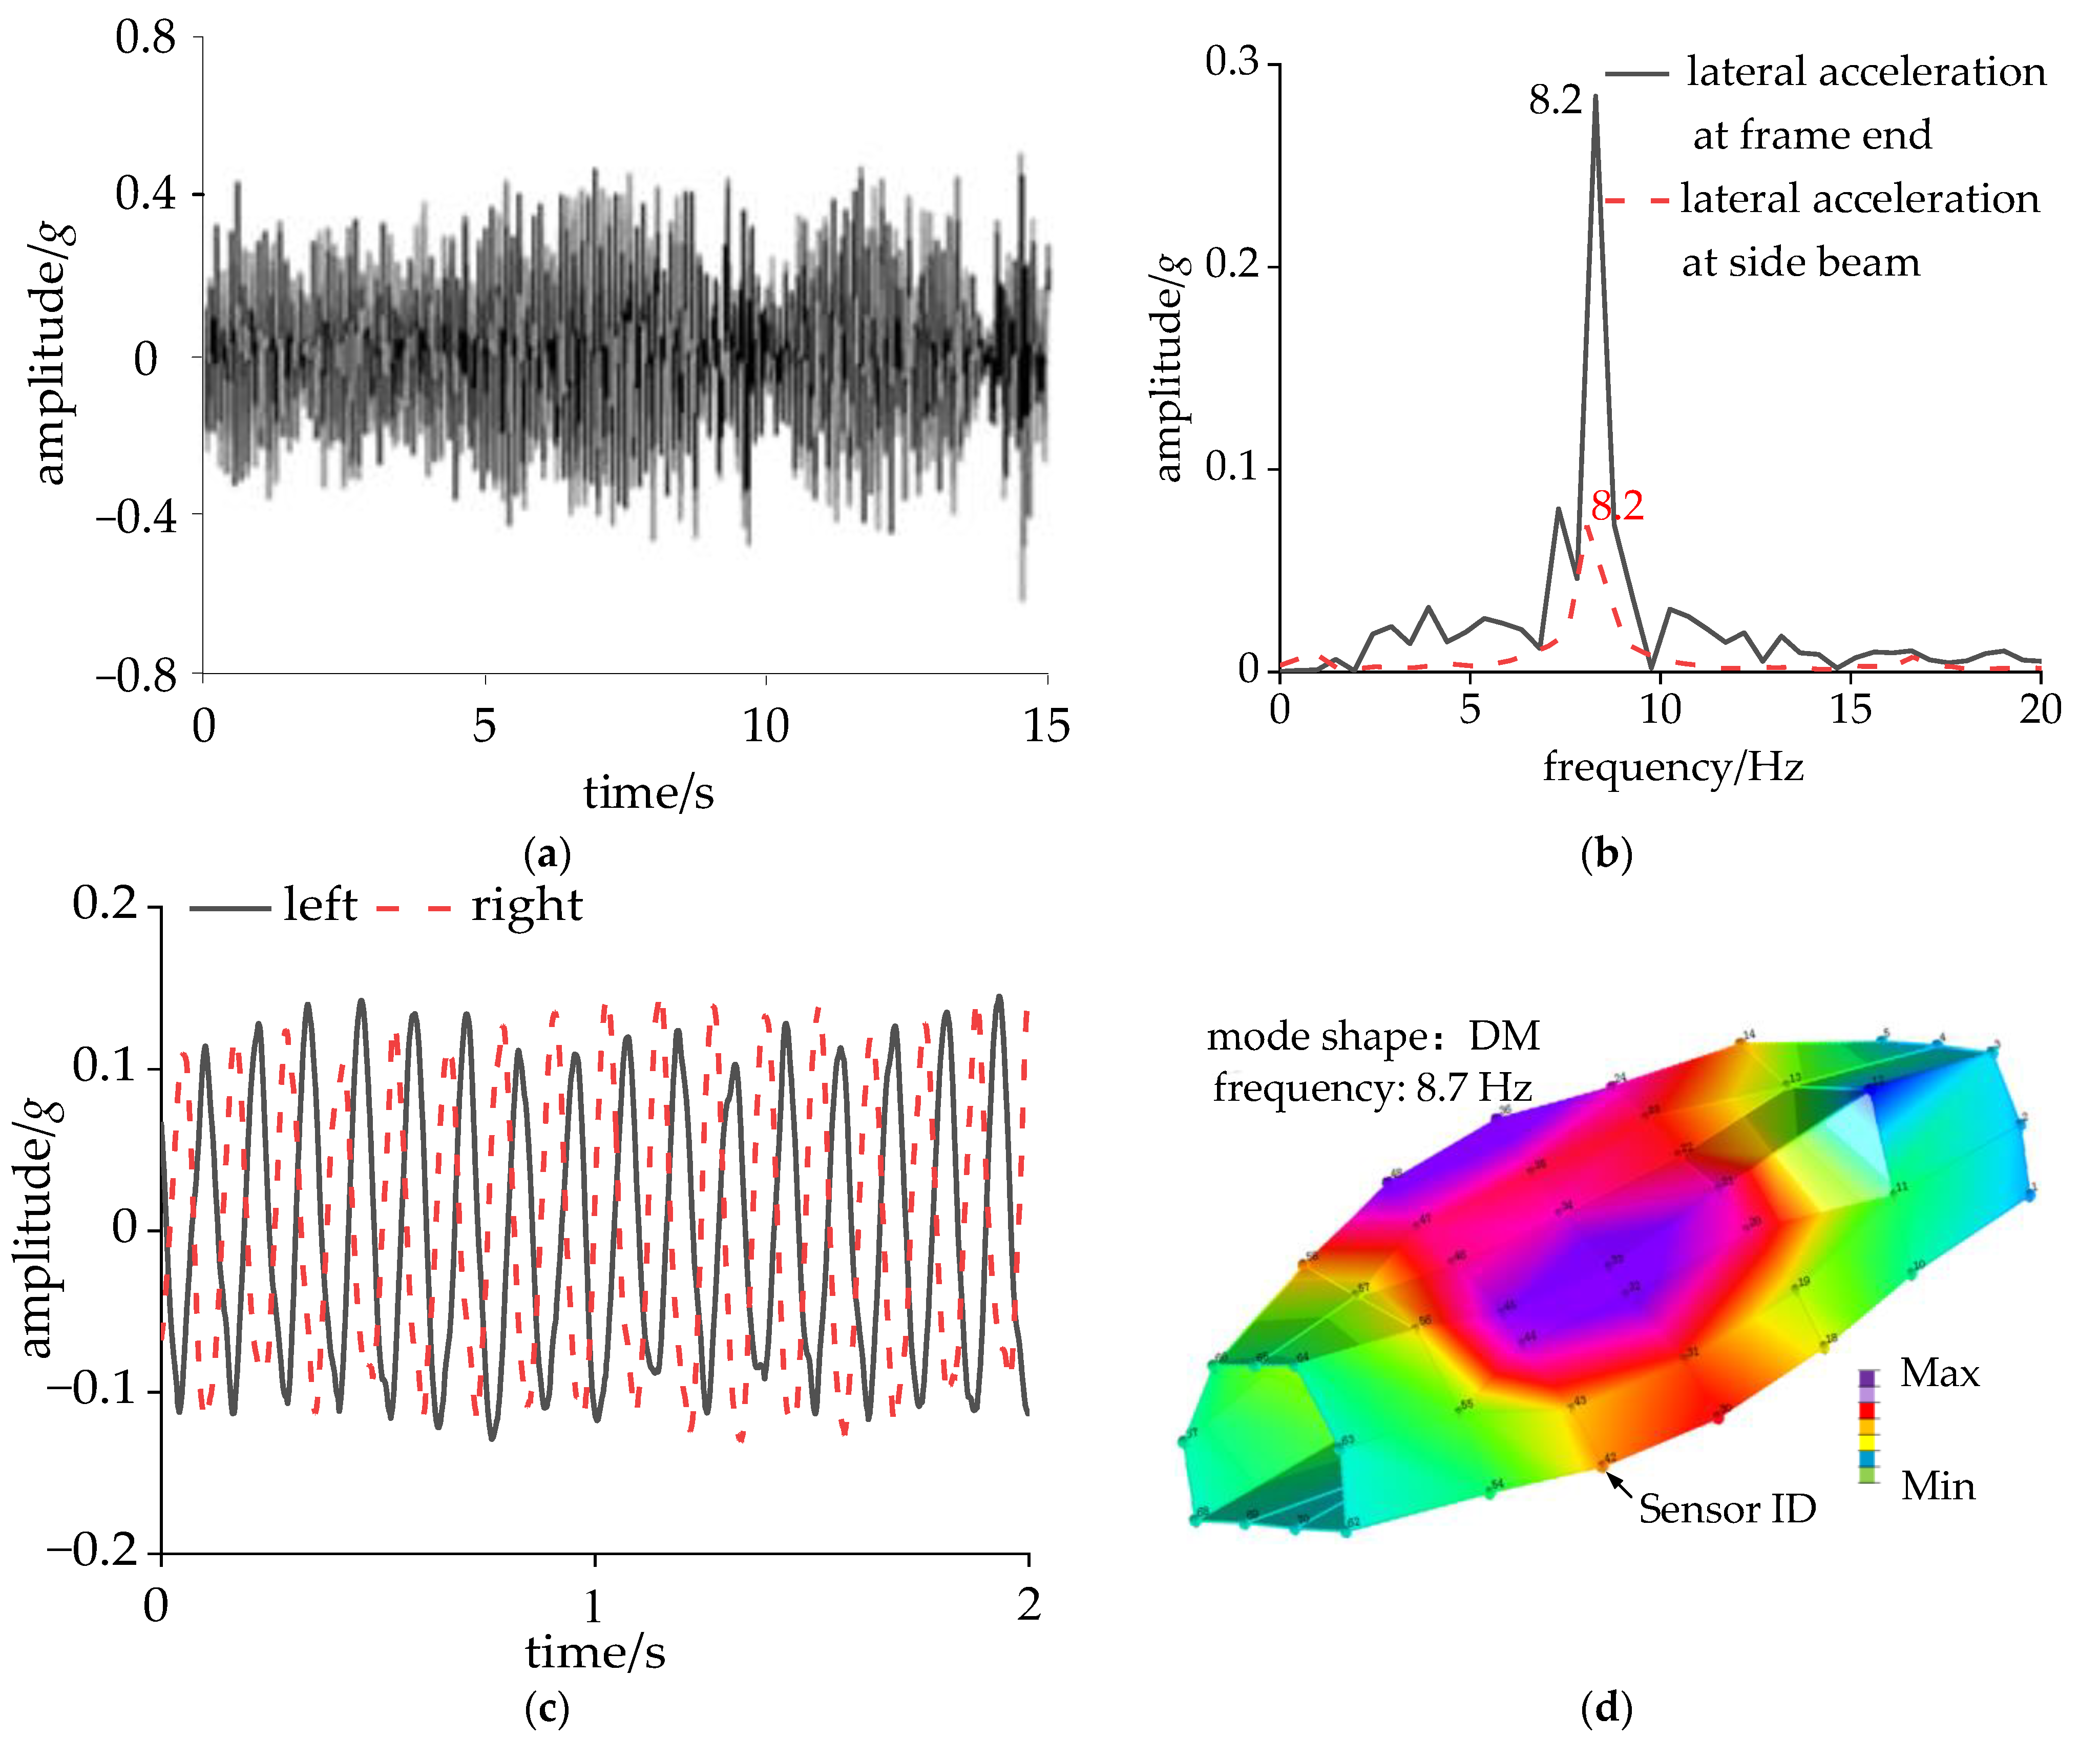
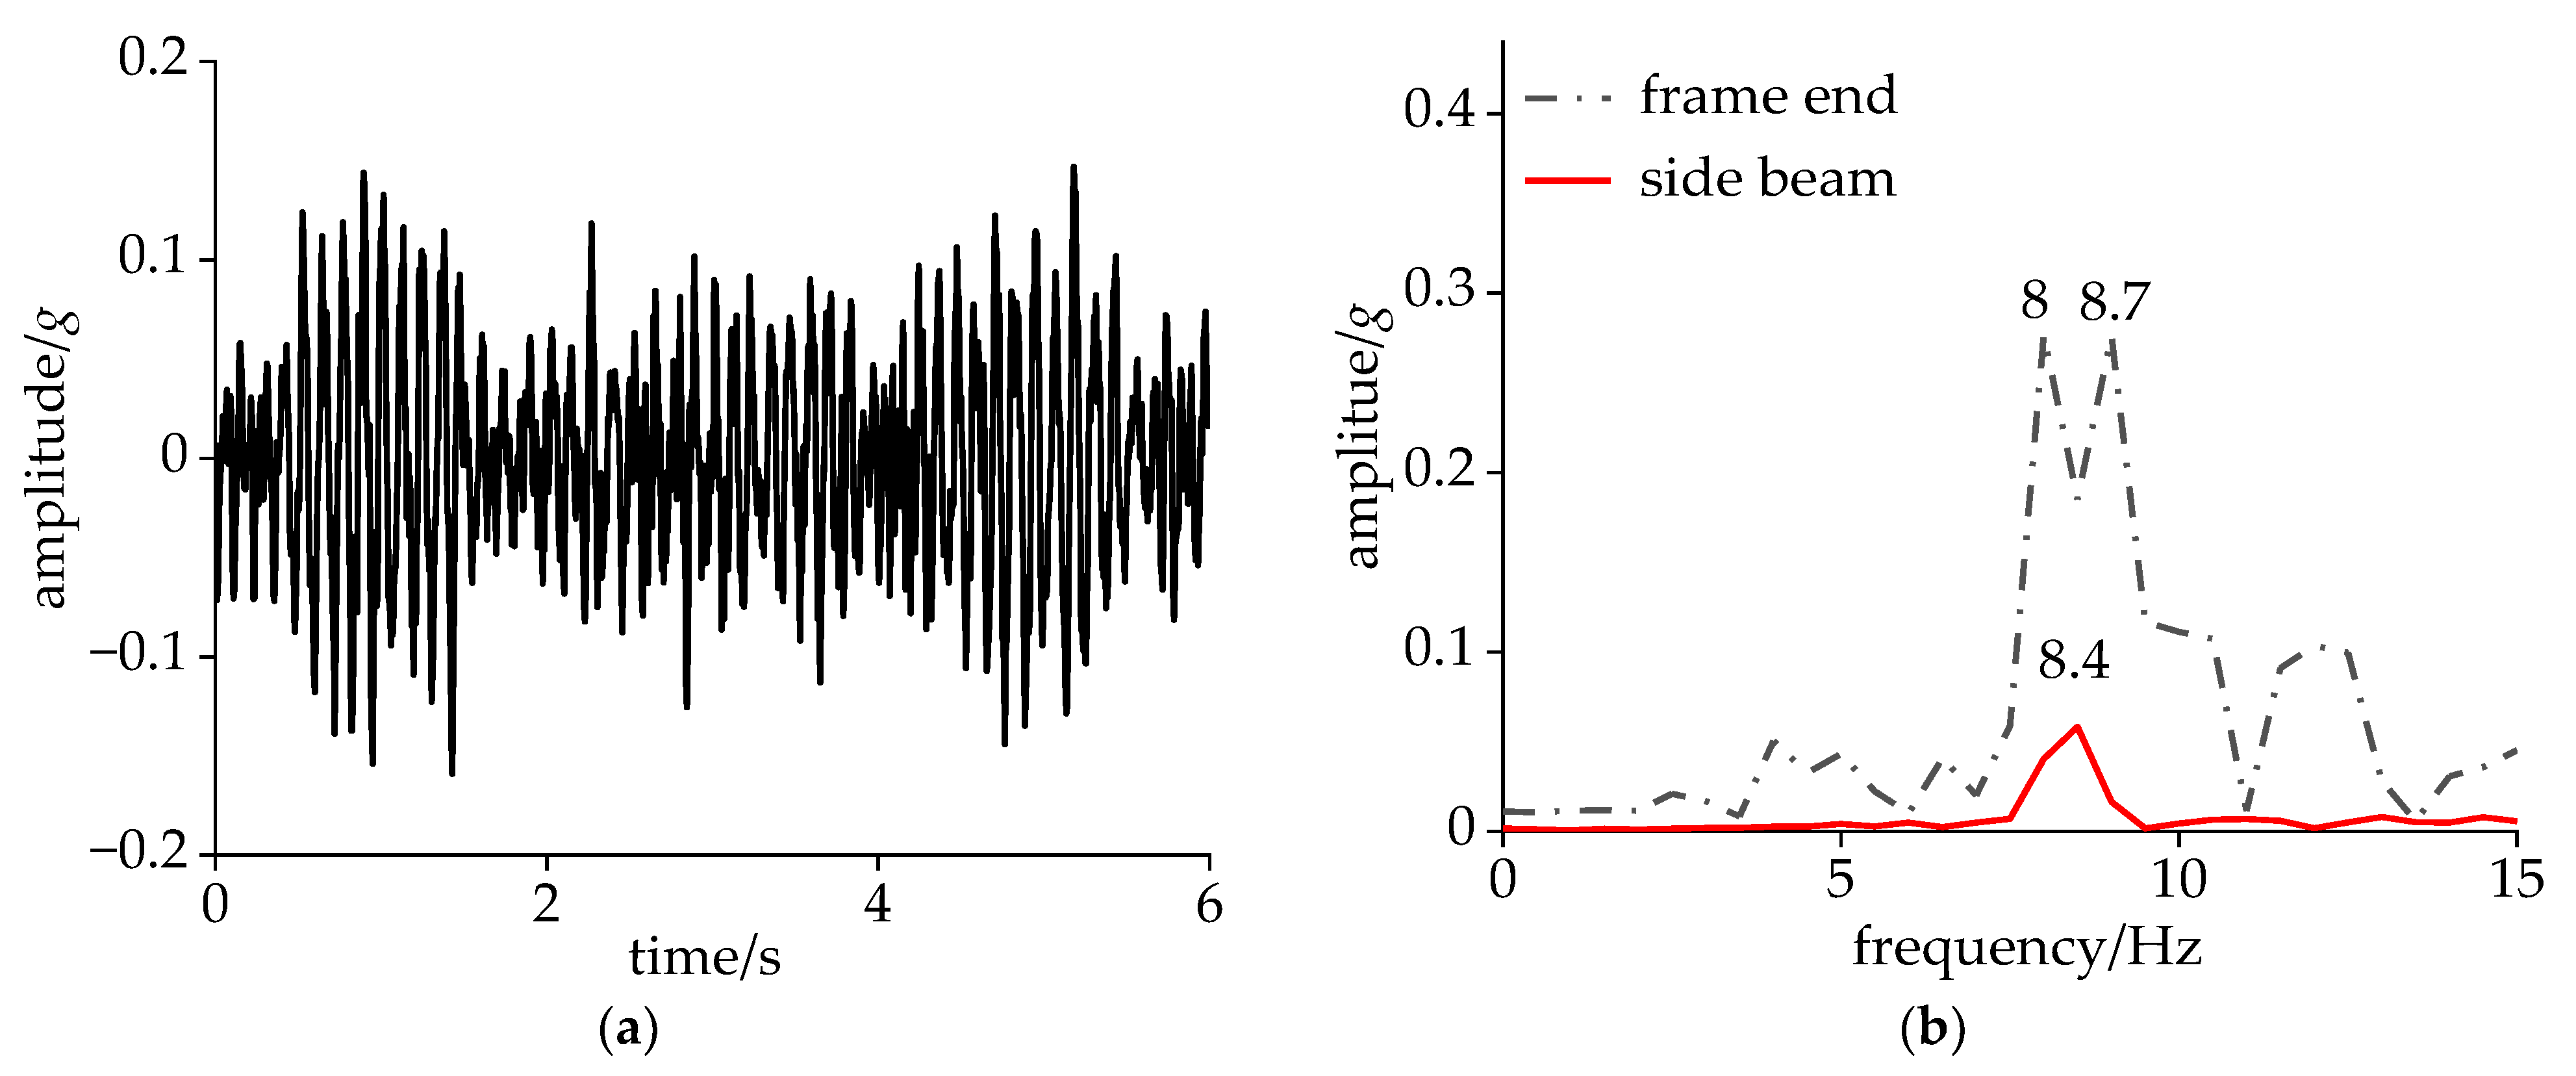
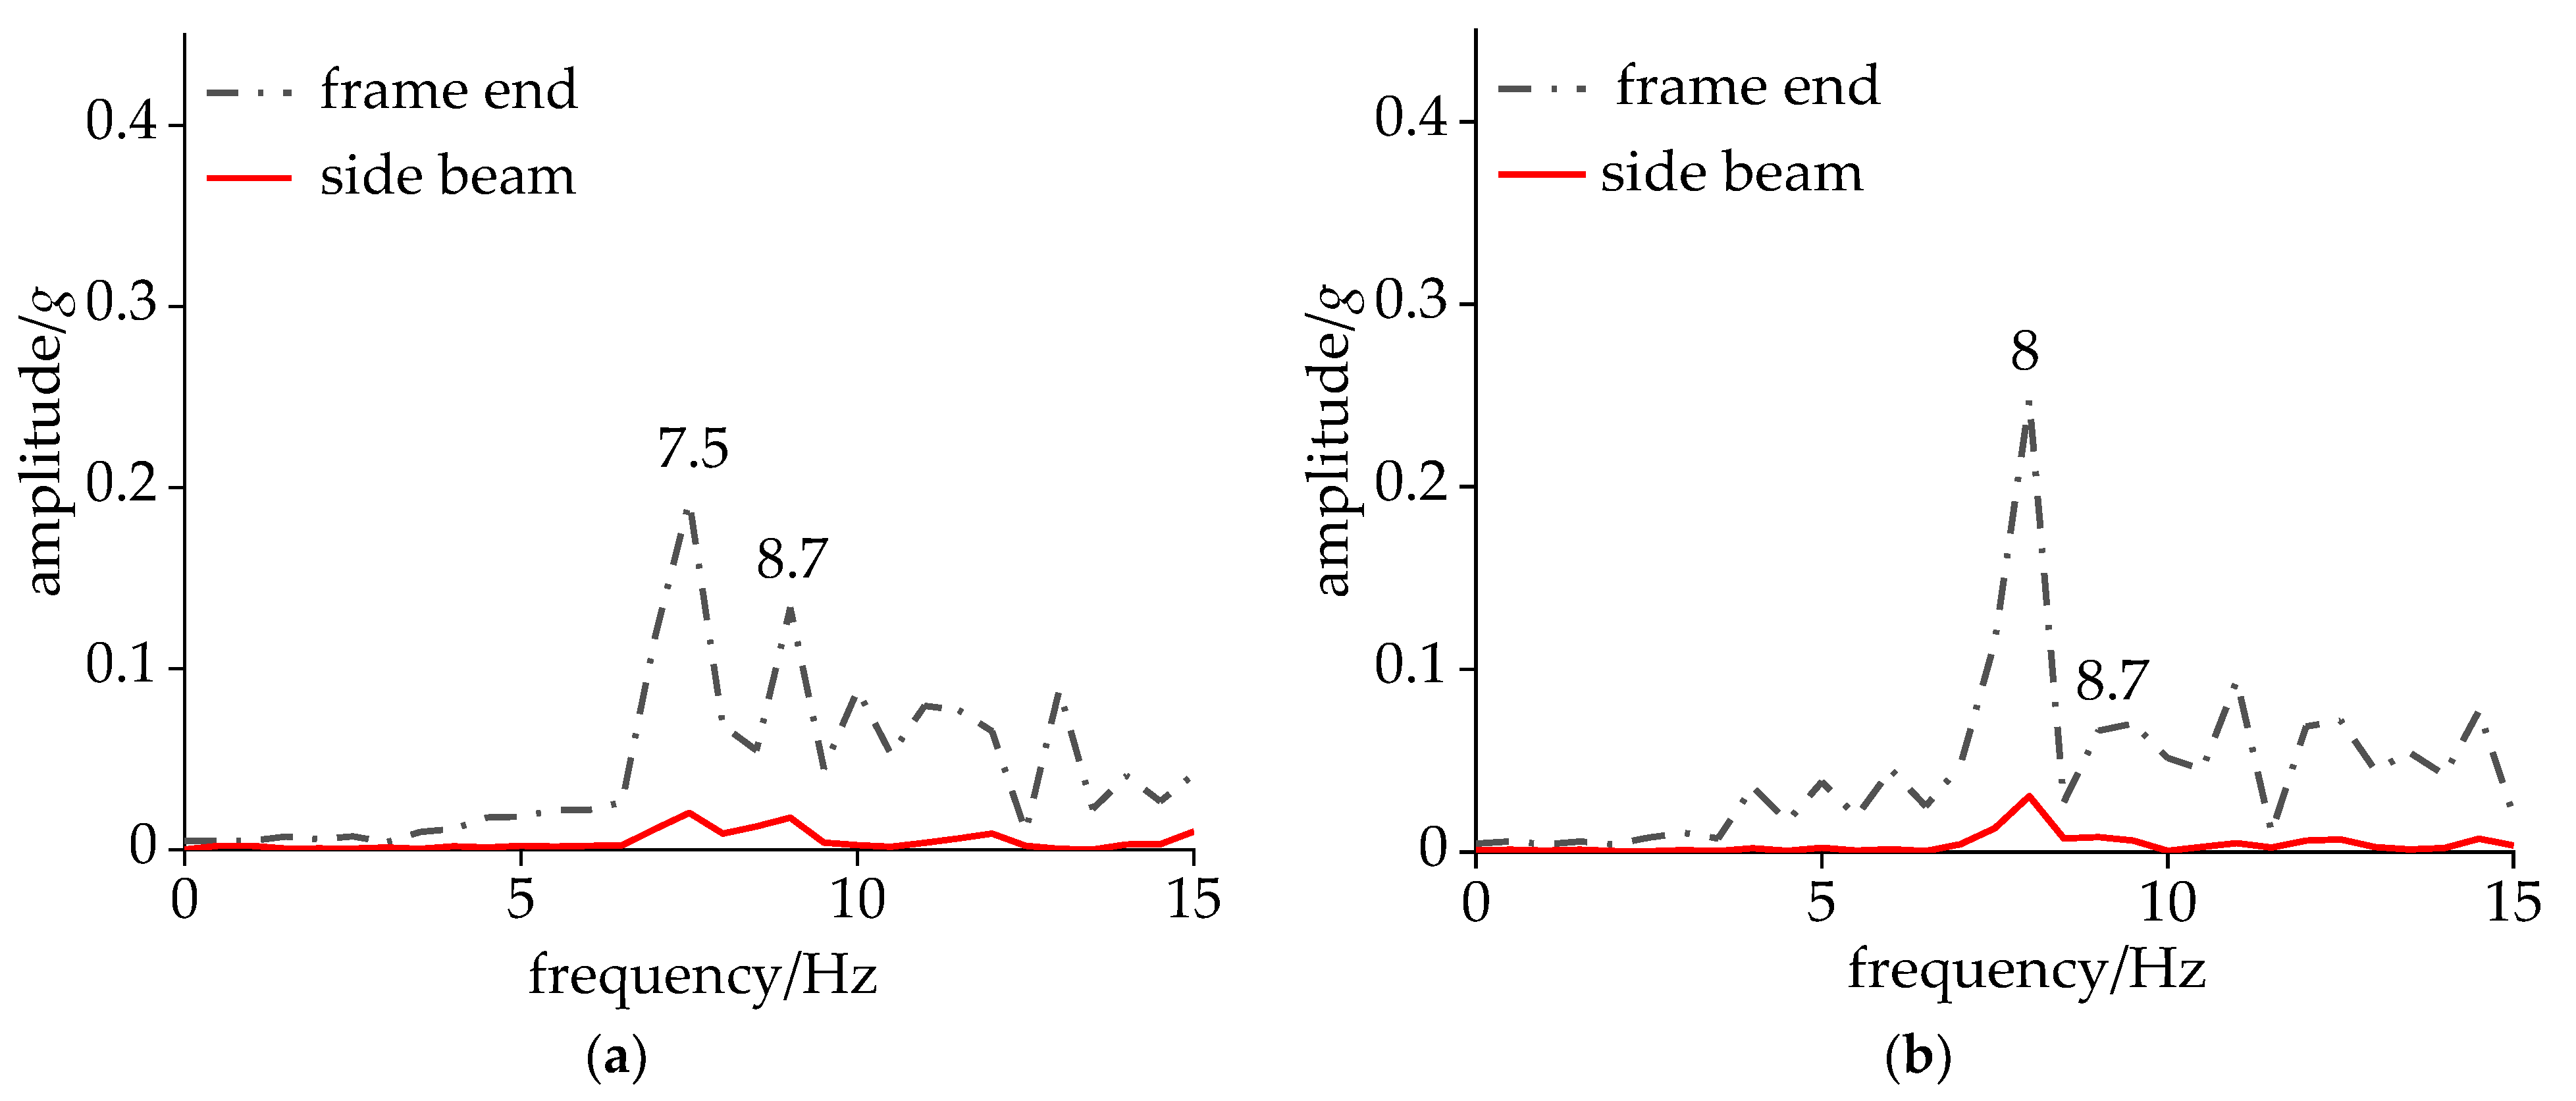
2.2. Analysis of Field Data
3. Simulation of Multi-Body Dynamics
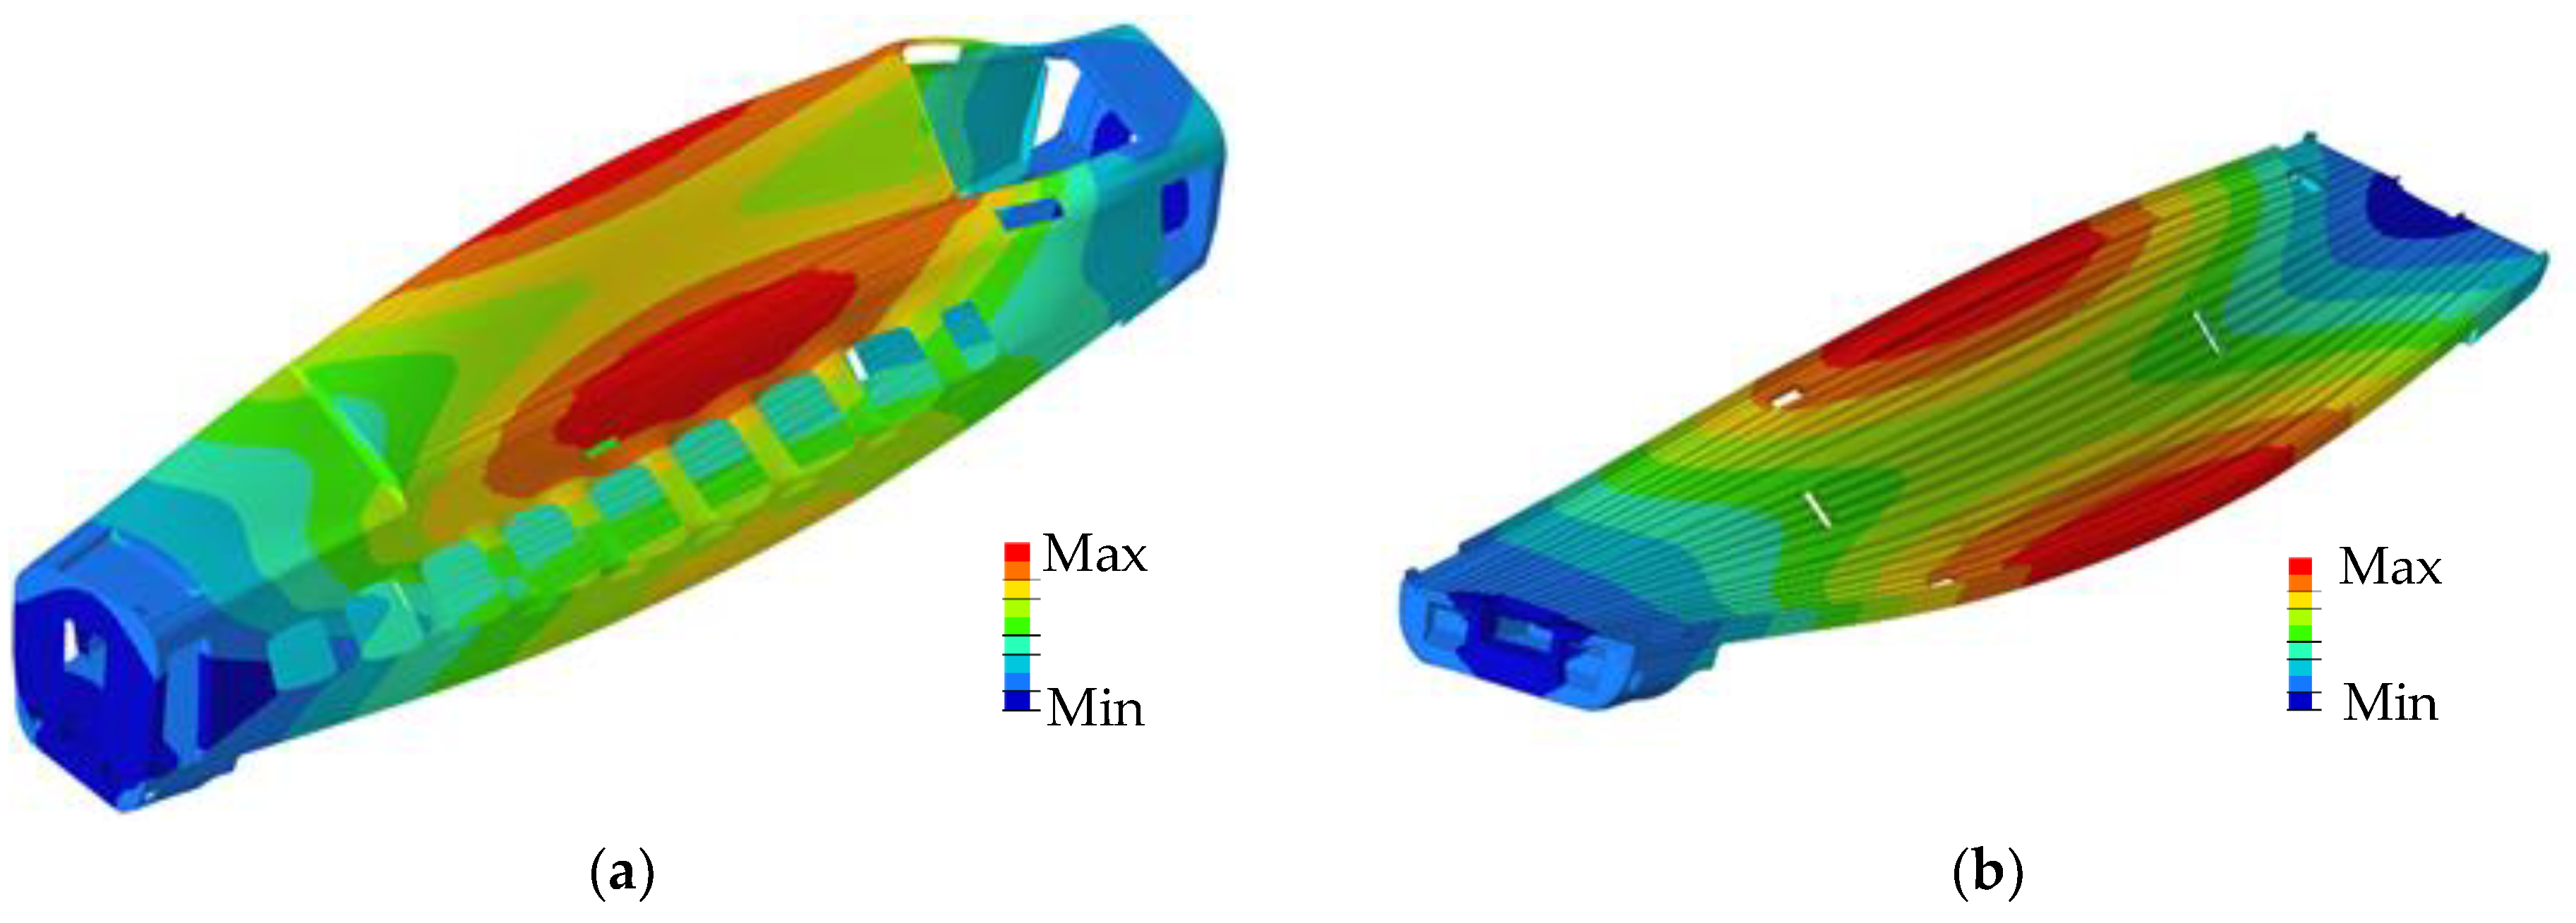
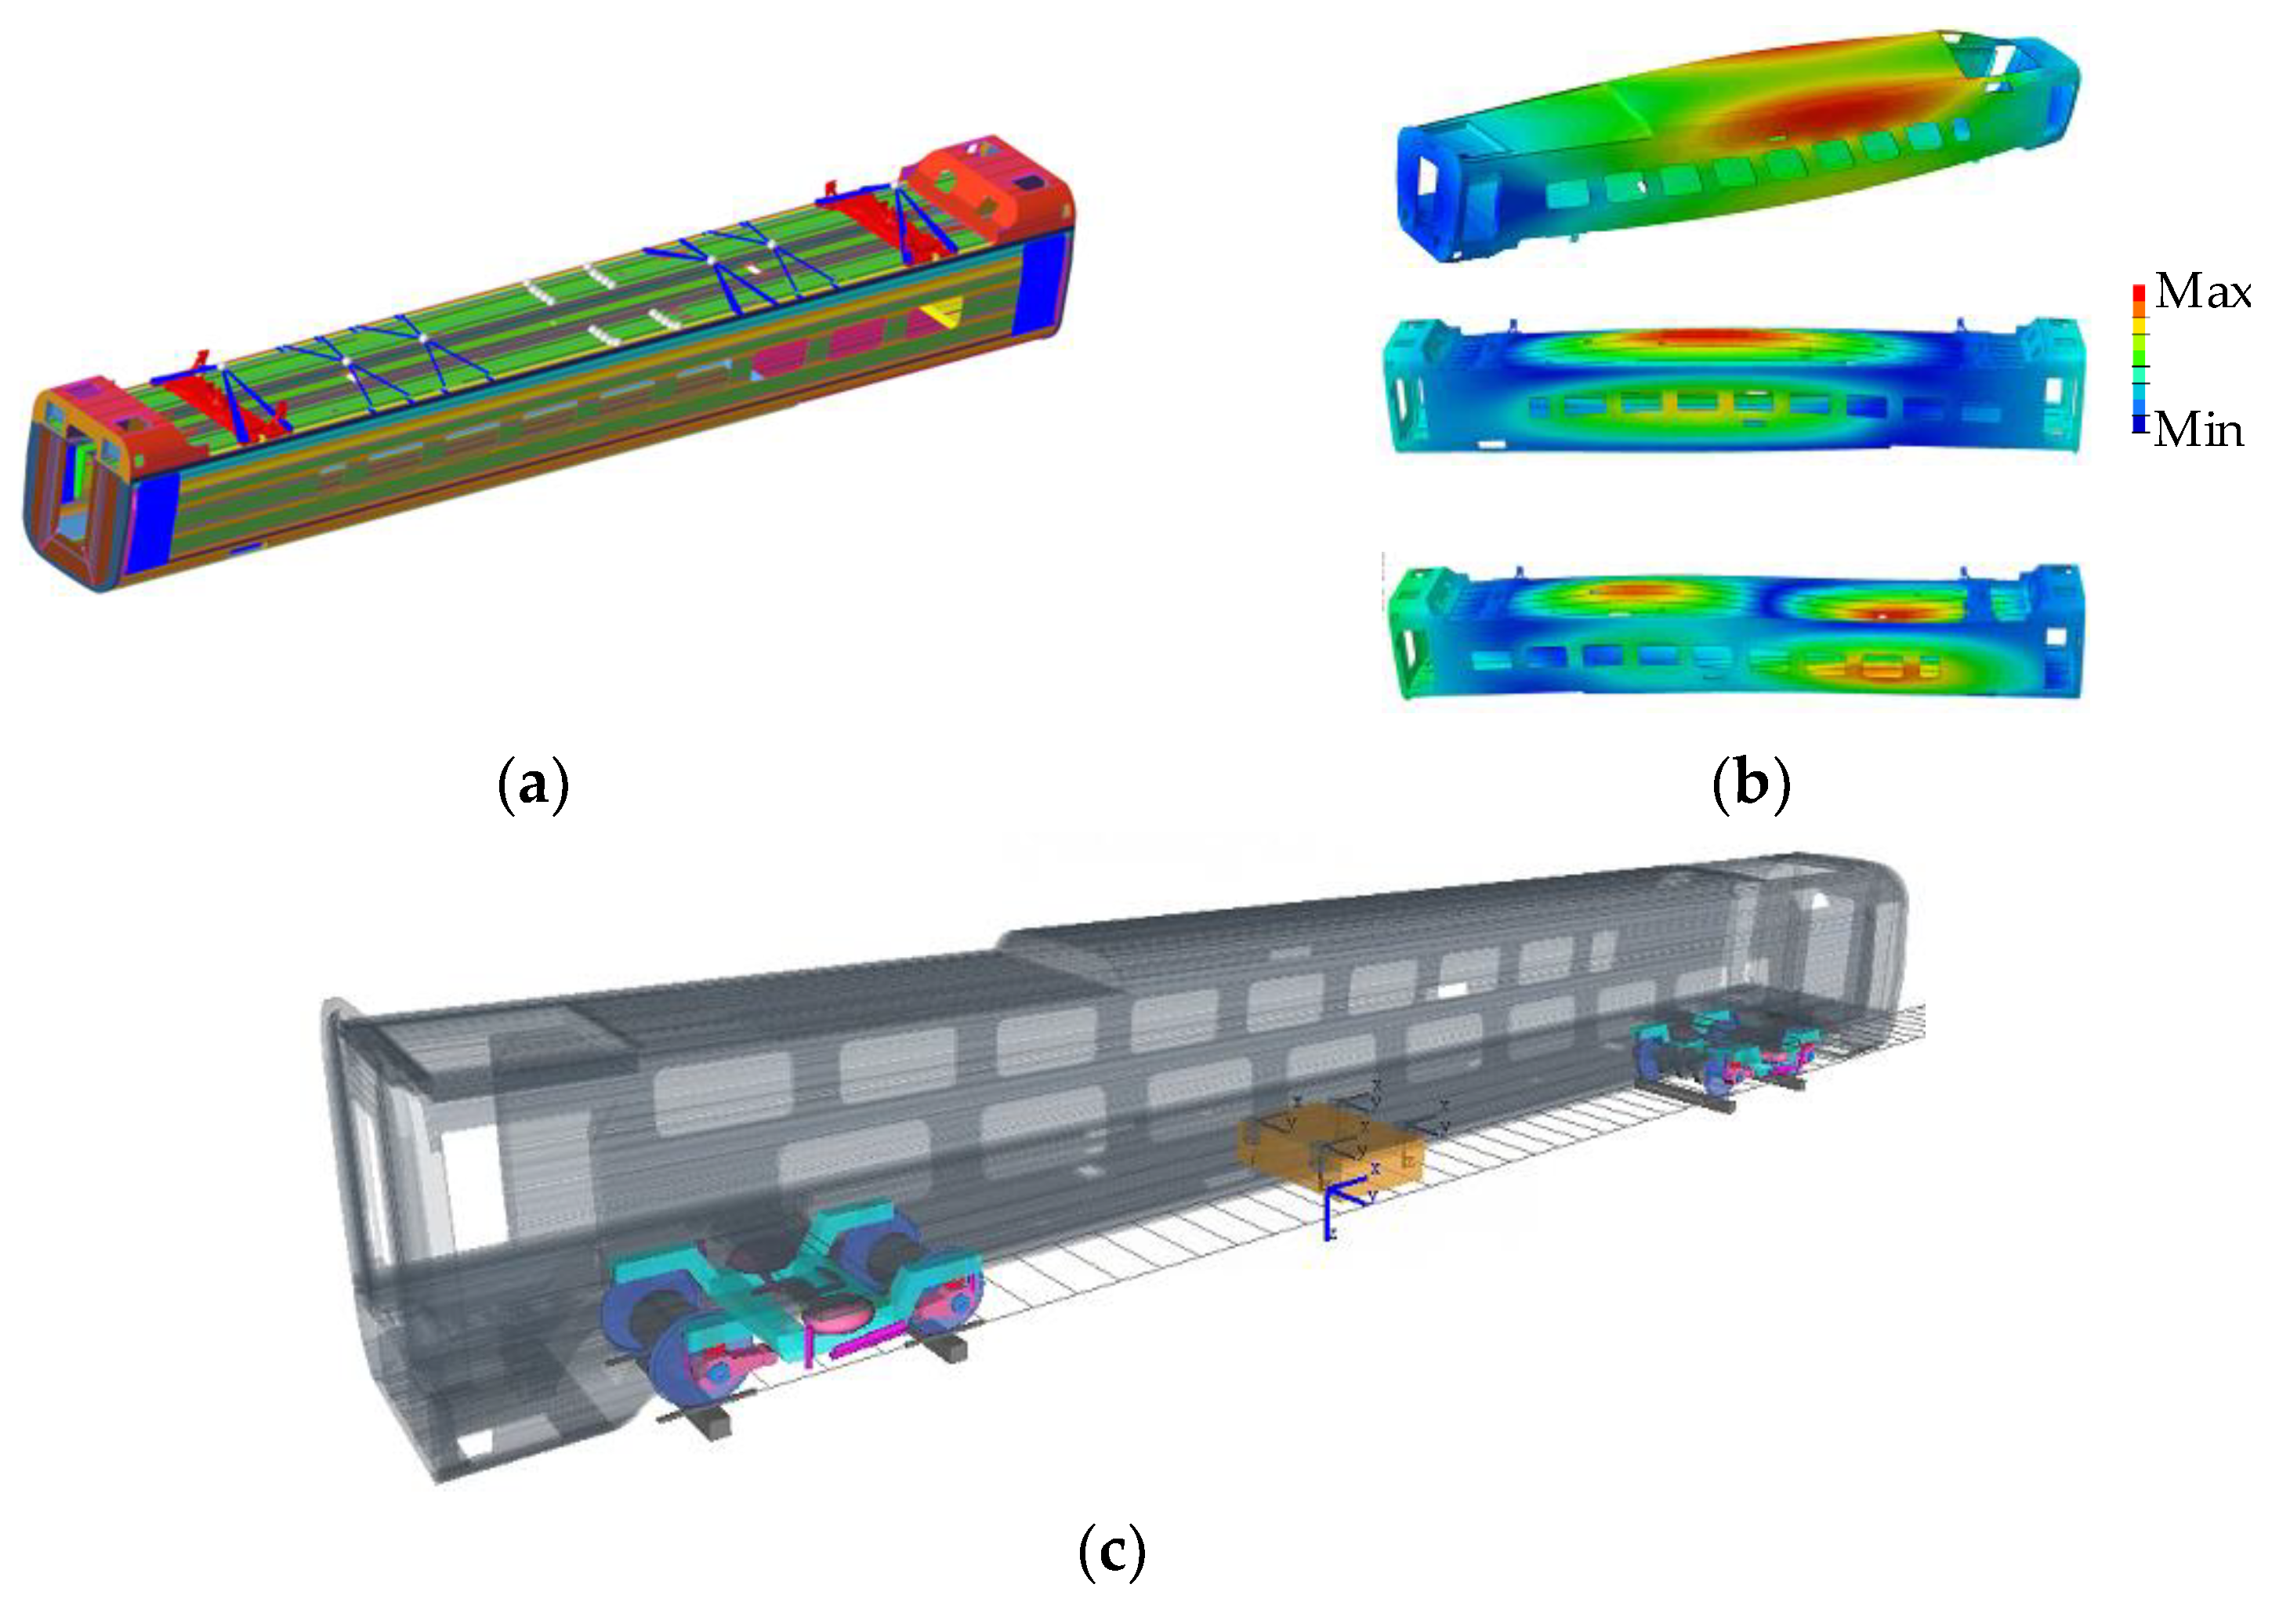
3.1. Modeling of Rigid Flexible Coupled Dynamics
3.2. Reproduction and Analysis of CS
4. Analysis of CS Based on Modal Vibration Equation
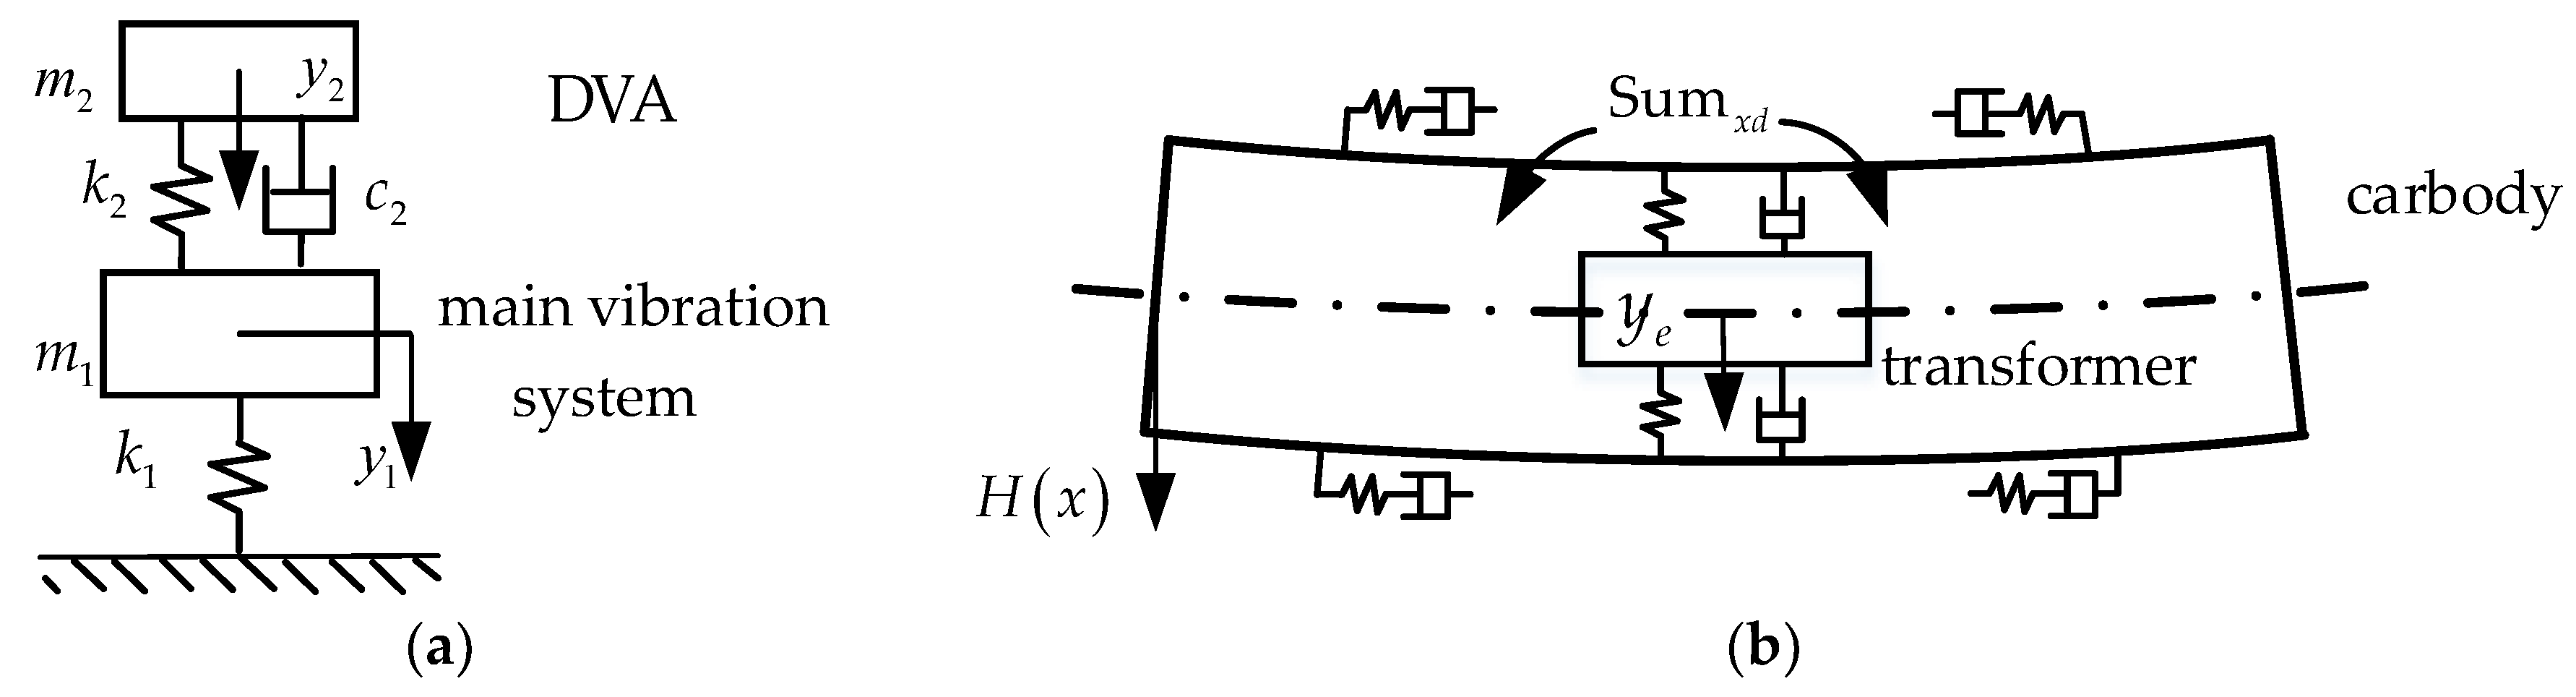
4.1. Simplified Method for DM
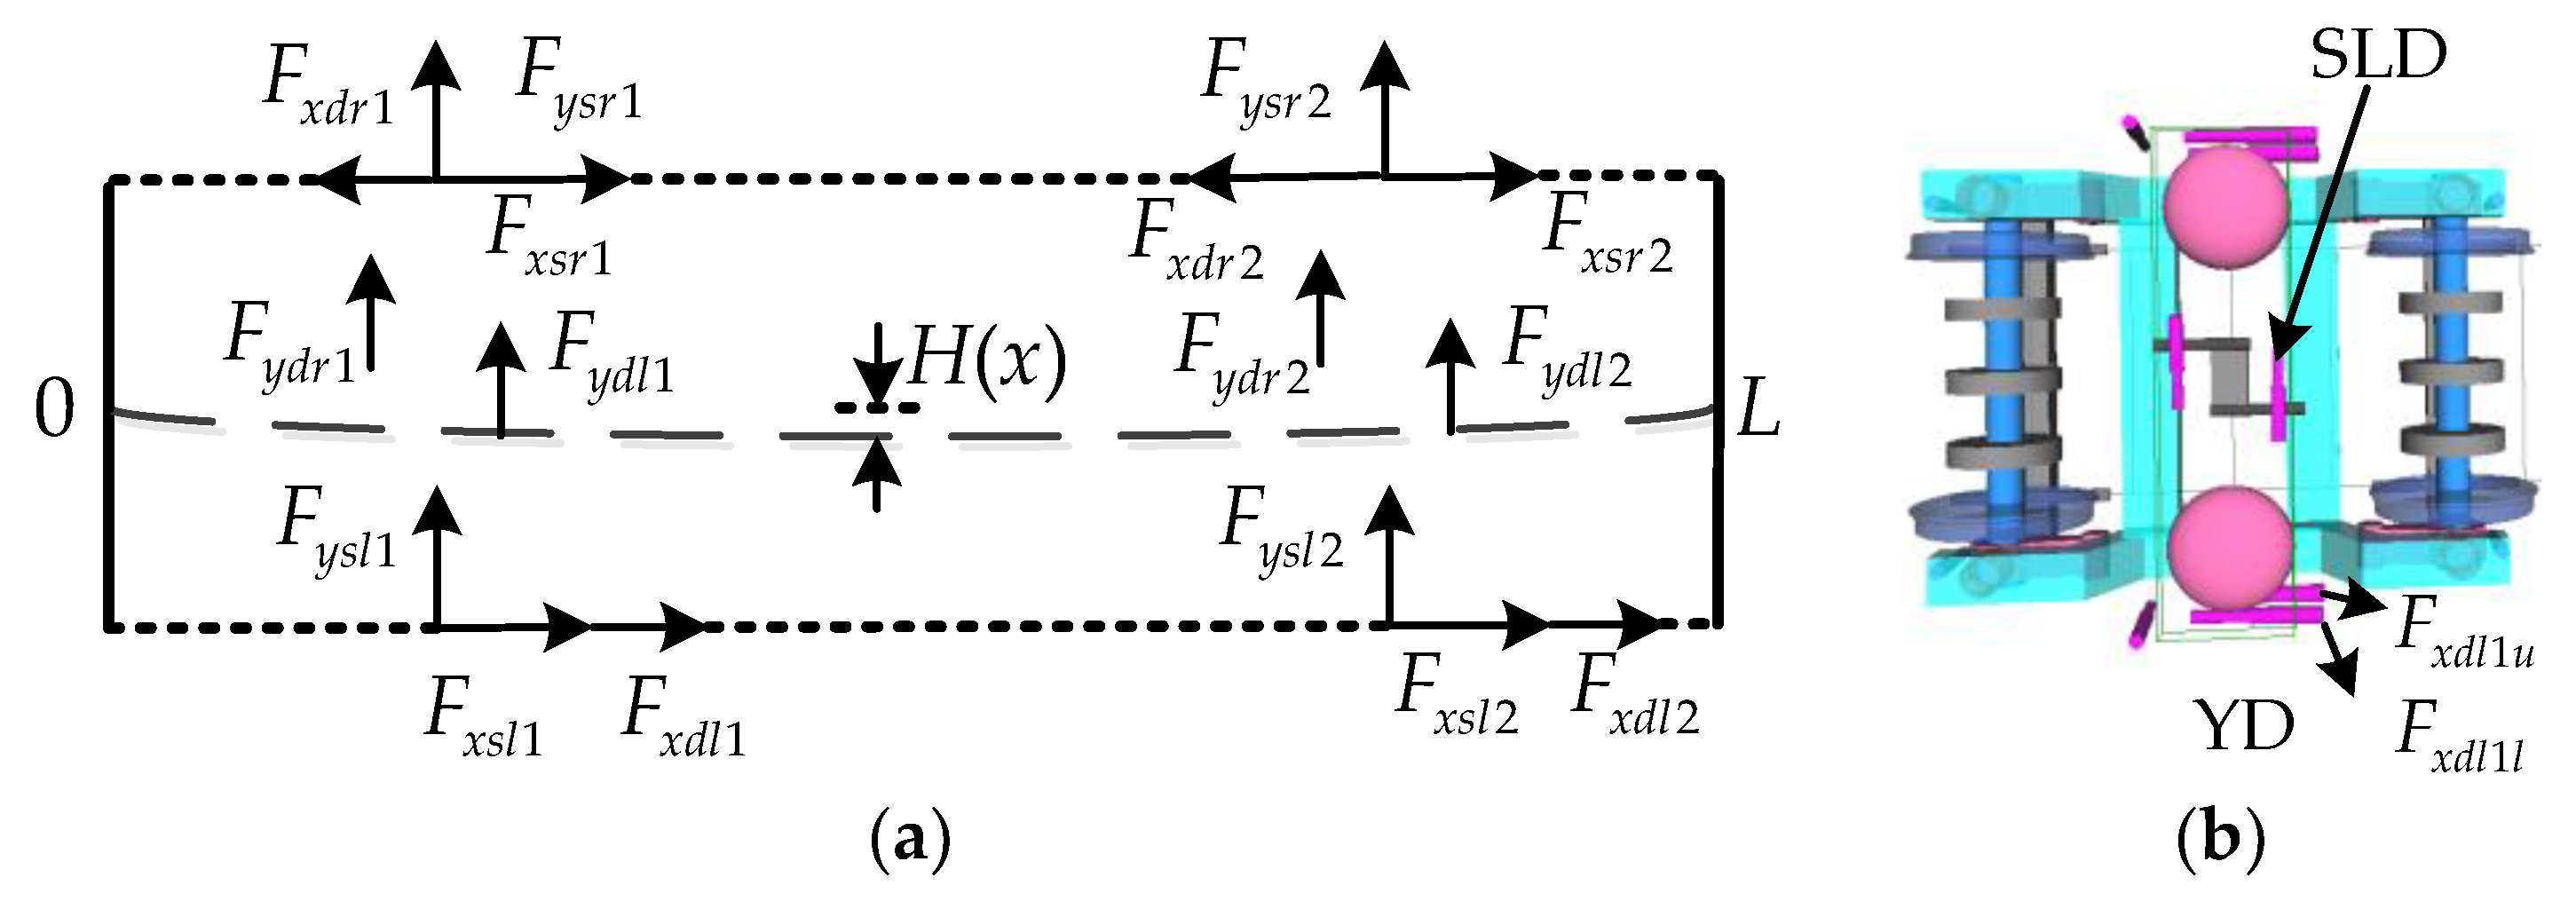
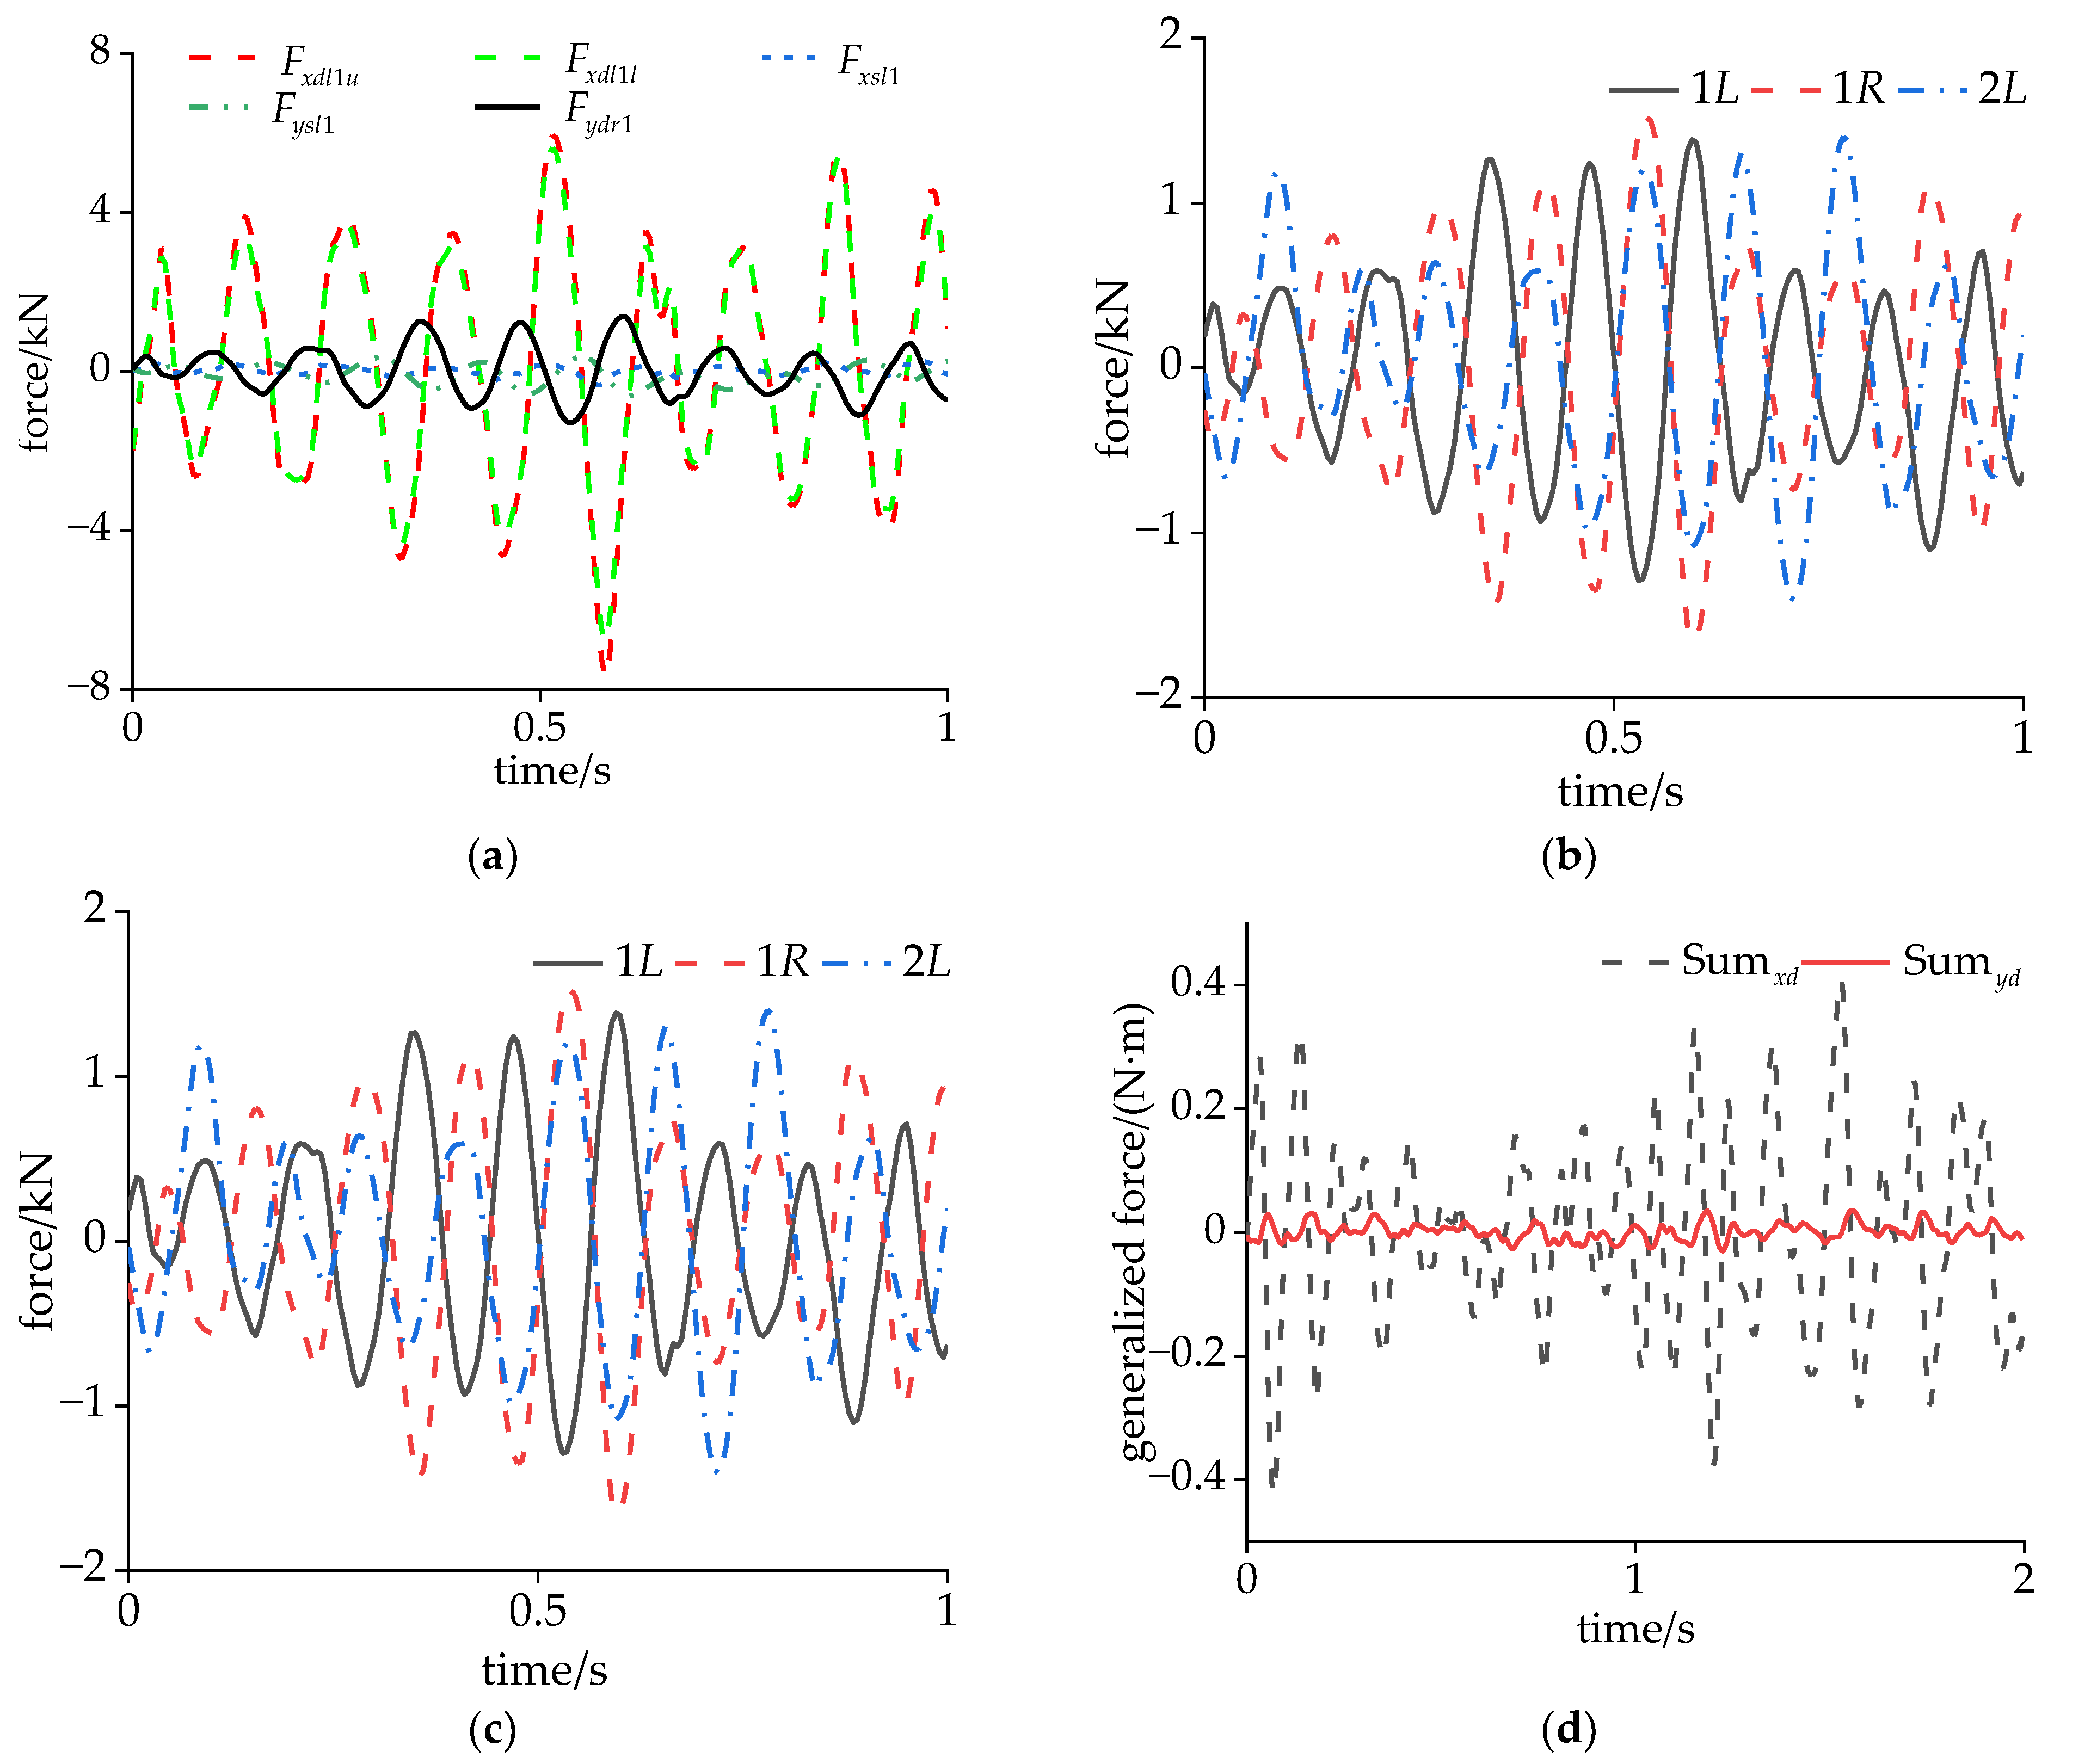
4.2. Vibration Contribution of Secondary Suspension Forces
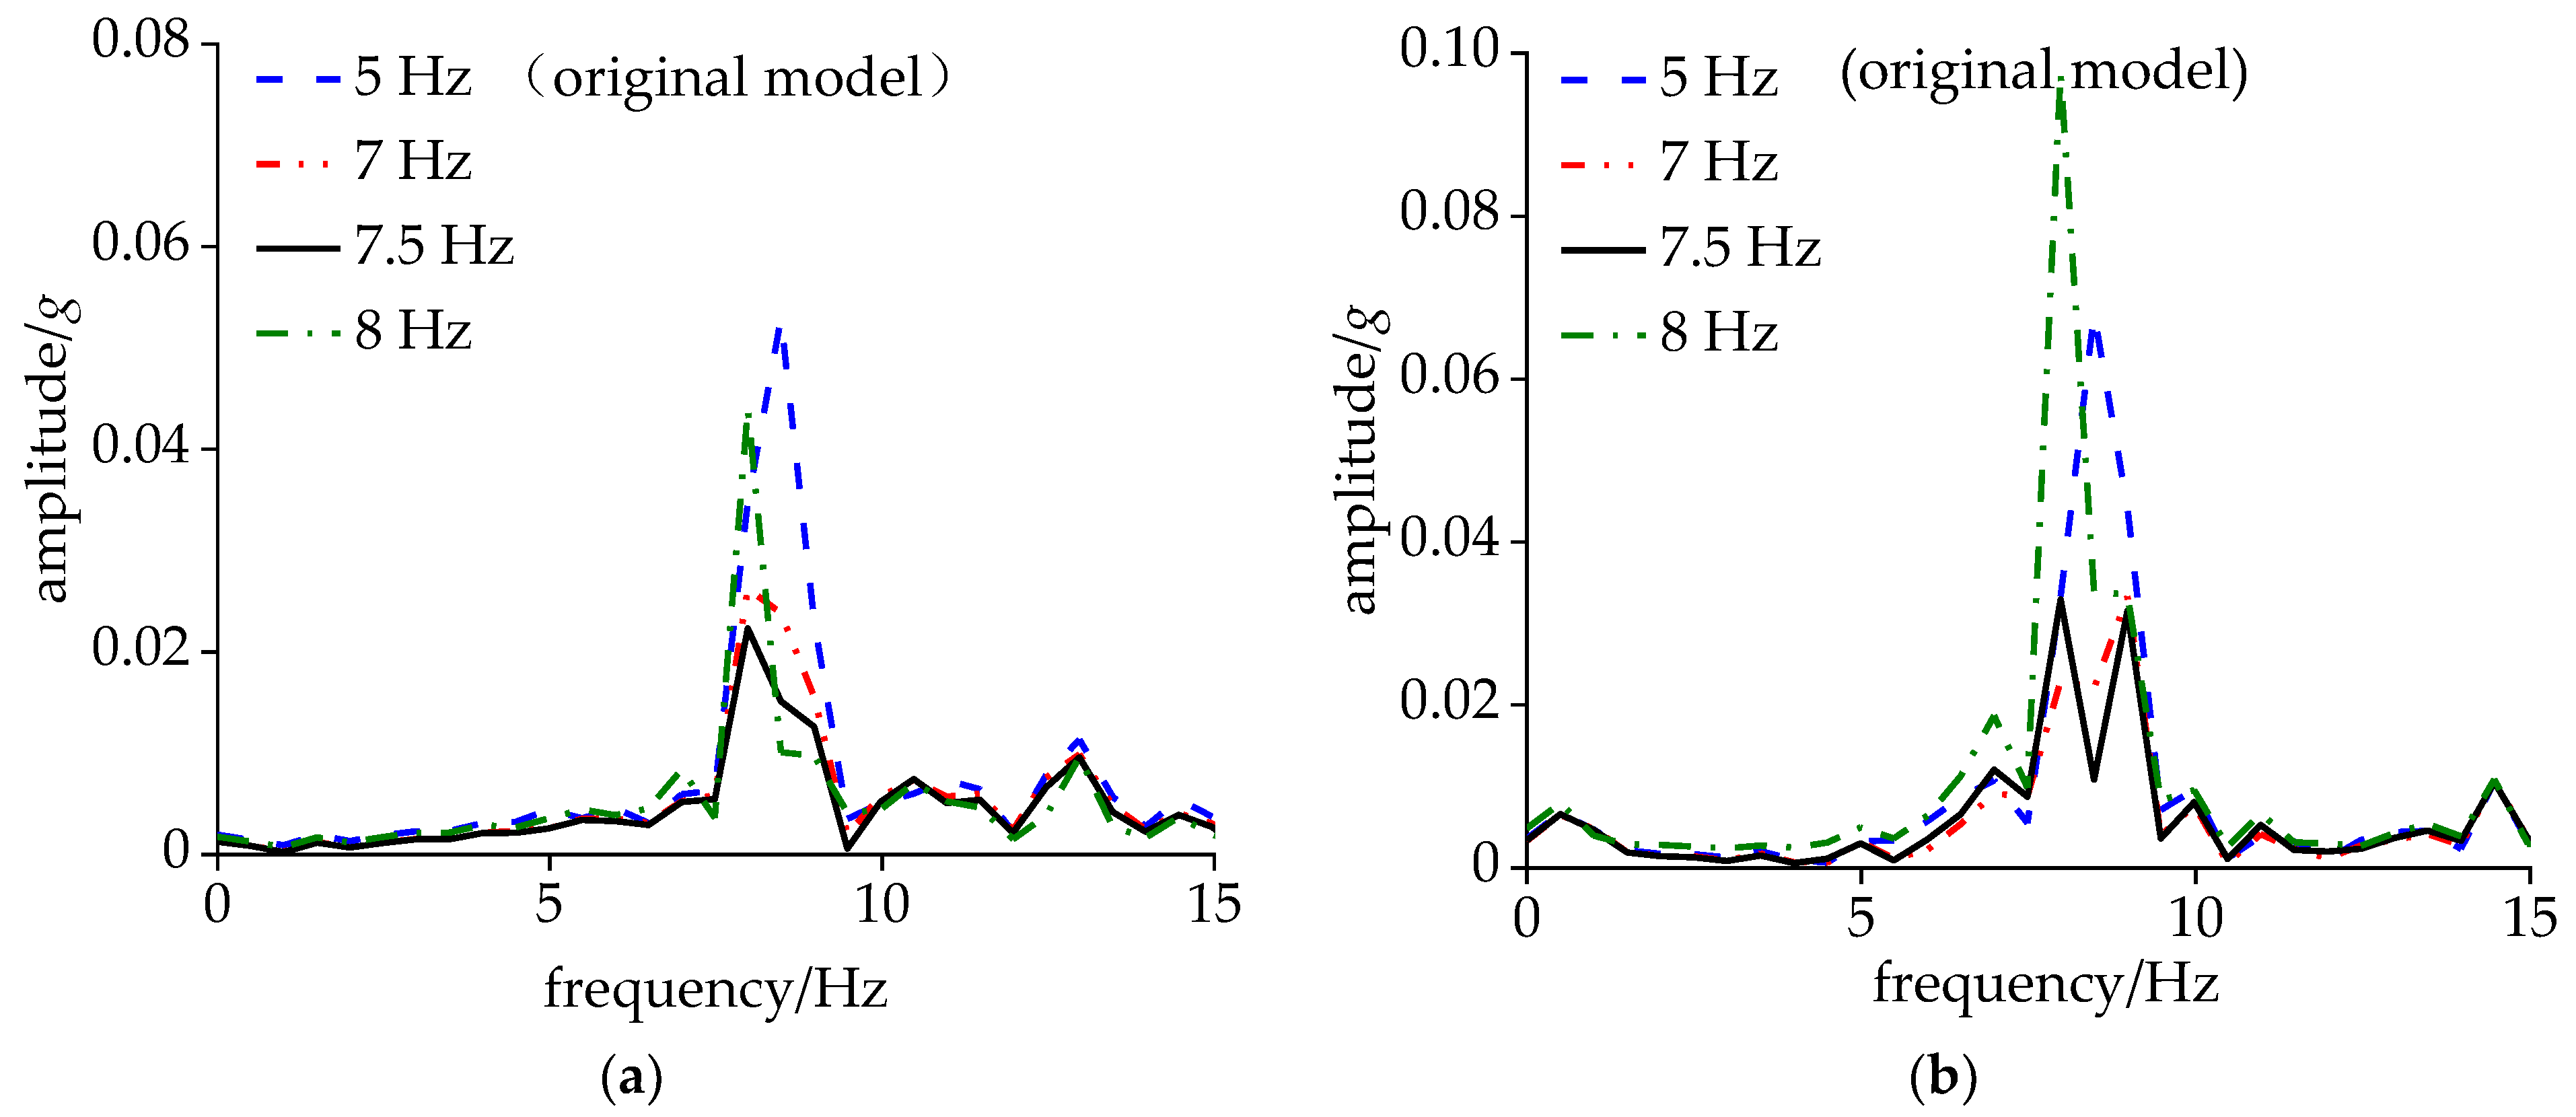
4.3. Optimization of Transformer Suspension Parameters
5. Conclusions
- (1)
- When carbody shaking occurs, the wheels are at the end of their maintenance cycle and the rails are in an under-polished state. The abnormal wheel–rail relationship can cause the high-frequency hunting of the bogie, which can excite the diamond mode. Relevant operational departments should promptly carry out maintenance on the wheels and rail.
- (2)
- During carbody shaking, the main contribution to the modal vibration of the vehicle body among the secondary suspension forces originated from the yaw dampers, with the hunting motion of the front and rear bogies being in opposite phases. Further research can be conducted based on these conclusions to develop active control strategies for suppressing carbody shaking.
- (3)
- When the lateral suspension frequency of the transformer was adjusted to 7.5 Hz, the reduction in the acceleration at the midsection of the side beam was the greatest, and the comfort index at this location was reduced by 33% at the speed of 350 km/h. Since the shaking of the carbody in the lateral and vertical directions are coupled, optimizing the suspension parameters in multiple directions can further enhance the vibration absorption capability of the underframe equipment.
Author Contributions
Funding
Institutional Review Board Statement
Informed Consent Statement
Data Availability Statement
Acknowledgments
Conflicts of Interest
References
- Dumitriu, M. A new passive approach to reducing the carbody vertical bending vibration of railway vehicles. Veh. Syst. Dyn. 2017, 55, 1787–1806. [Google Scholar] [CrossRef]
- Gong, D.; Zhou, J.; Sun, W. Passive control of railway vehicle car body flexural vibration by means of underframe dampers. J. Mech. Sci. Technol. 2017, 31, 555–564. [Google Scholar] [CrossRef]
- Fu, B.; Liu, B.; Gialleonardo, E.; Bruni, S. Semi-active control of primary suspensions to improve ride quality in a high-speed railway vehicle. Veh. Syst. Dyn. 2023, 61, 2664–2688. [Google Scholar] [CrossRef]
- Wang, Q.; Zeng, J.; Wu, Y.; Zhu, B. Study on semi-active suspension applied on carbody underneath suspended system of high-speed railway vehicle. J. Vib. Control 2020, 26, 671–679. [Google Scholar] [CrossRef]
- Zheng, X.; Zolotas, A.; Goodall, R. Combined active suspension and structural damping control for suppression of flexible bodied railway vehicle vibration. Veh. Syst. Dyn. 2020, 58, 198–228. [Google Scholar] [CrossRef]
- Shi, H.; Zeng, J.; Guo, J. Disturbance observer-based sliding mode control of active vertical suspension for high-speed rail vehicles. Veh. Syst. Dyn. 2024. [Google Scholar] [CrossRef]
- Tomioka, T.; Takigami, T. Reduction of bending vibration in railway vehicle carbodies using carbody bogie dynamic interaction. Veh. Syst. Dyn. 2010, 48, 467–486. [Google Scholar] [CrossRef]
- Bokaeian, V.; Rezvani, M.; Arcos, R. A numerical and scaled experimental study on ride comfort enhancement of a high-speed rail vehicle through optimizing traction rod stiffness. J. Vib. Control 2021, 27, 2548–2563. [Google Scholar] [CrossRef]
- Li, F.; Yang, S.; Yang, Z.; Shi, H.; Zeng, J.; Ye, Y. A novel vertical elastic vibration reduction for railway vehicle carbody based on minimum generalized force principle. Mech. Syst. Signal Process. 2023, 189, 110035. [Google Scholar] [CrossRef]
- Huang, C.; Zeng, J.; Luo, G.; Shi, H. Numerical and experimental studies on the car body flexible vibration reduction due to the effect of car body-mounted equipment. Proc. Inst. Mech. Eng. Part F J. Rail Rapid Transit 2018, 232, 103–120. [Google Scholar] [CrossRef]
- Wen, Y.; Sun, Q.; Zou, Y.; You, H. Study on the vibration suppression of a flexible carbody for urban railway vehicles with a magnetorheological elastomer-based dynamic vibration absorber. Proc. Inst. Mech. Eng. Part F J. Rail Rapid Transit 2020, 234, 749–764. [Google Scholar] [CrossRef]
- Xia, Z.; Zhou, J.; Liang, J.; Ding, S.; Gong, D.; Sun, W.; Sun, Y. Online detection and control of car body low-frequency swaying in railway vehicles. Veh. Syst. Dyn. 2019, 59, 70–100. [Google Scholar] [CrossRef]
- Wu, Y.; Zeng, J.; Qu, S.; Shi, H.; Wei, L. Low-frequency carbody sway modelling based on low wheel-rail contact conicity analysis. Shock. Vib. 2020, 2020, 6671049. [Google Scholar] [CrossRef]
- Li, F.; Wu, H.; Liu, C.; Wu, P.; Zeng, J. Vibration fatigue analysis of high-speed railway vehicle carbody under shaking condition. Veh. Syst. Dyn. 2022, 60, 1867–1887. [Google Scholar] [CrossRef]
- Shi, Y.; Wang, Q.; Dai, H.; Wei, L.; Yang, Z. Research about carbody abnormal vibration of light rail transit based on suspension failure. Eng. Fail. Anal. 2021, 127, 105513. [Google Scholar] [CrossRef]
- Shi, H.; Qu, S.; Zhang, D.; Wang, J. Dynamic response performance analysis of high-speed trans on track. J. China Railw. Soc. 2011, 41, 30–37. [Google Scholar]
- Zheng, B.; Wei, L.; Zeng, J.; Zhang, D. Experimental and numerical investigation of bogie hunting instability for railway vehicles based on multiple sensors. Sensors. 2024, 24, 4027. [Google Scholar] [CrossRef] [PubMed]
- Shi, H.; Wu, P. Flexible vibration analysis for car body of high-speed EMU. J. Mech. Sci. Technol. 2016, 30, 55–66. [Google Scholar] [CrossRef]
- Wei, L.; Zeng, J.; Chi, M.; Wang, J. Carbody elastic vibrations of high-speed vehicles caused by bogie hunting instability. Veh. Syst. Dyn. 2017, 55, 1321–1342. [Google Scholar] [CrossRef]
- Chang, C.; Ding, X.; Ling, L.; Li, F.; Liu, T.; Wang, K.; Zhai, W. Mechanism of high-speed train carbody shaking due to degradation of wheel-rail contact geometry. Int. J. Rail Transp. 2023, 11, 289–316. [Google Scholar] [CrossRef]
- Qi, Y.; Dai, H.; Song, C.; Qu, S. Shaking analysis of high-speed train’s carbody when cross lines. J. Mech. Sci. Technol. 2019, 33, 1055–1064. [Google Scholar] [CrossRef]
- Gong, D.; Liu, G.; Zhou, J. Research on mechanism and control methods of carbody chattering of an electric multiple-unit train. Multibody Syst. Dyn. 2021, 53, 135–172. [Google Scholar] [CrossRef]
- Gong, D.; Wang, Z.; Zhou, J.; Zhu, J. Suppression of abnormal chattering of a high-speed EMU carbody. J. Mech. Sci. Technol. 2021, 35, 1387–1399. [Google Scholar] [CrossRef]
- Yao, Y.; Li, G.; Sardahi, Y.; Sun, J. Stability enhancement of a high-speed train bogie using active mass inertial actuators. Veh. Syst. Dyn. 2019, 57, 389–407. [Google Scholar] [CrossRef]
- Zhang, X.; Wu, G.; Li, G.; Yao, Y. Actuator optimal placement studies of high-speed power bogie for active hunting stability. Veh. Syst. Dyn. 2020, 58, 108–122. [Google Scholar] [CrossRef]
- Huang, C.; Zeng, J. Suppression of the flexible carbody resonance due to bogie instability by using a DVA suspended on the bogie frame. Veh. Syst. Dyn. 2022, 60, 3051–3070. [Google Scholar] [CrossRef]
- Wei, L.; Zeng, J.; Huang, C.; Zheng, B.; Li, X. Hunting stability and dynamic stress analysis of a high-speed bogie using elastic-suspended motors as dynamic vibration absorber. Veh. Syst. Dyn. 2024, 62, 2332–2354. [Google Scholar] [CrossRef]
- Yang, S.; Li, F.; Shi, H.; Wu, P.; Zeng, J. A roll frequency design method for underframe equipment of a high-speed railway vehicle for elastic vibration reduction. Veh. Syst. Dyn. 2021, 60, 2211–2230. [Google Scholar] [CrossRef]
- Guo, J.; Shi, H.; Luo, R.; Zeng, J. Bifurcation analysis of a railway wheelset with nonlinear wheel–rail contact. Nonlinear Dyn. 2021, 104, 989–1005. [Google Scholar] [CrossRef]
- Guo, P.; Huang, C.; Zeng, J.; Gao, H. Hopf–Hopf bifurcation analysis based on resonance and non-resonance in a simplified railway wheelset model. Nonlinear Dyn. 2022, 108, 1197–1215. [Google Scholar] [CrossRef]
- Wang, J.; Ling, L.; Wang, K.; Zhai, W. Nonlinear stability evolution of railway wagon system due to wheel profile wear. Nonlinear Dyn. 2024, 112, 11971–11991. [Google Scholar] [CrossRef]
- GB/T 5599; Specification for Dynamic Performance Assessment and Testing Verification of Rolling Stock. Chinese National Standardization Technical Committee: Beijing, China, 2019.
- Paz, M. Dynamic Condensation. AIAA J. 1984, 22, 724–727. [Google Scholar] [CrossRef]
- Hartog, J. Mechanical Vibration, 4th ed.; McGraw-Hill: New York, NY, USA, 1956. [Google Scholar]


| Type | Installation Position | Measuring Range | Sample Rate | Voltage Sensitivity |
|---|---|---|---|---|
| Accelerometers | Carbody | 0–2g | 1000 Hz | 310 mV/g |
| Bogie frame | 0–18g | 2000 Hz | 100 mV/g | |
| Laser transducer | Yaw damper | 30–130 mm | 2000 Hz | 40 mV/g |
| Material ID | Location | Density/(t/m3) | Elastic Modulus/GPa | Poisson’s Ratio |
|---|---|---|---|---|
| 1 | Roof | 7.42 | 80 | 0.33 |
| 2 | Floor | 8.9 | 66 | 0.33 |
| 3 | Side wall | 8.9 | 135 | 0.33 |
| 4 | End wall | 5.4 | 69 | 0.33 |
| Order | Name | FE Frequency/Hz | fbi Frequency/Hz | Error |
|---|---|---|---|---|
| 1 | 1st-order DM | 9.10 | 9.66 | 0.66% |
| 2 | 1st-order VBM | 10.37 | 10.52 | 1.45% |
| 3 | 2nd-order VBM | 12.51 | 12.88 | 2.96% |
| 4 | 2nd-order DM | 12.61 | 13.07 | 3.65% |
| 5 | Local mode of the roof and floor | 13.89 | 13.98 | 0.65% |
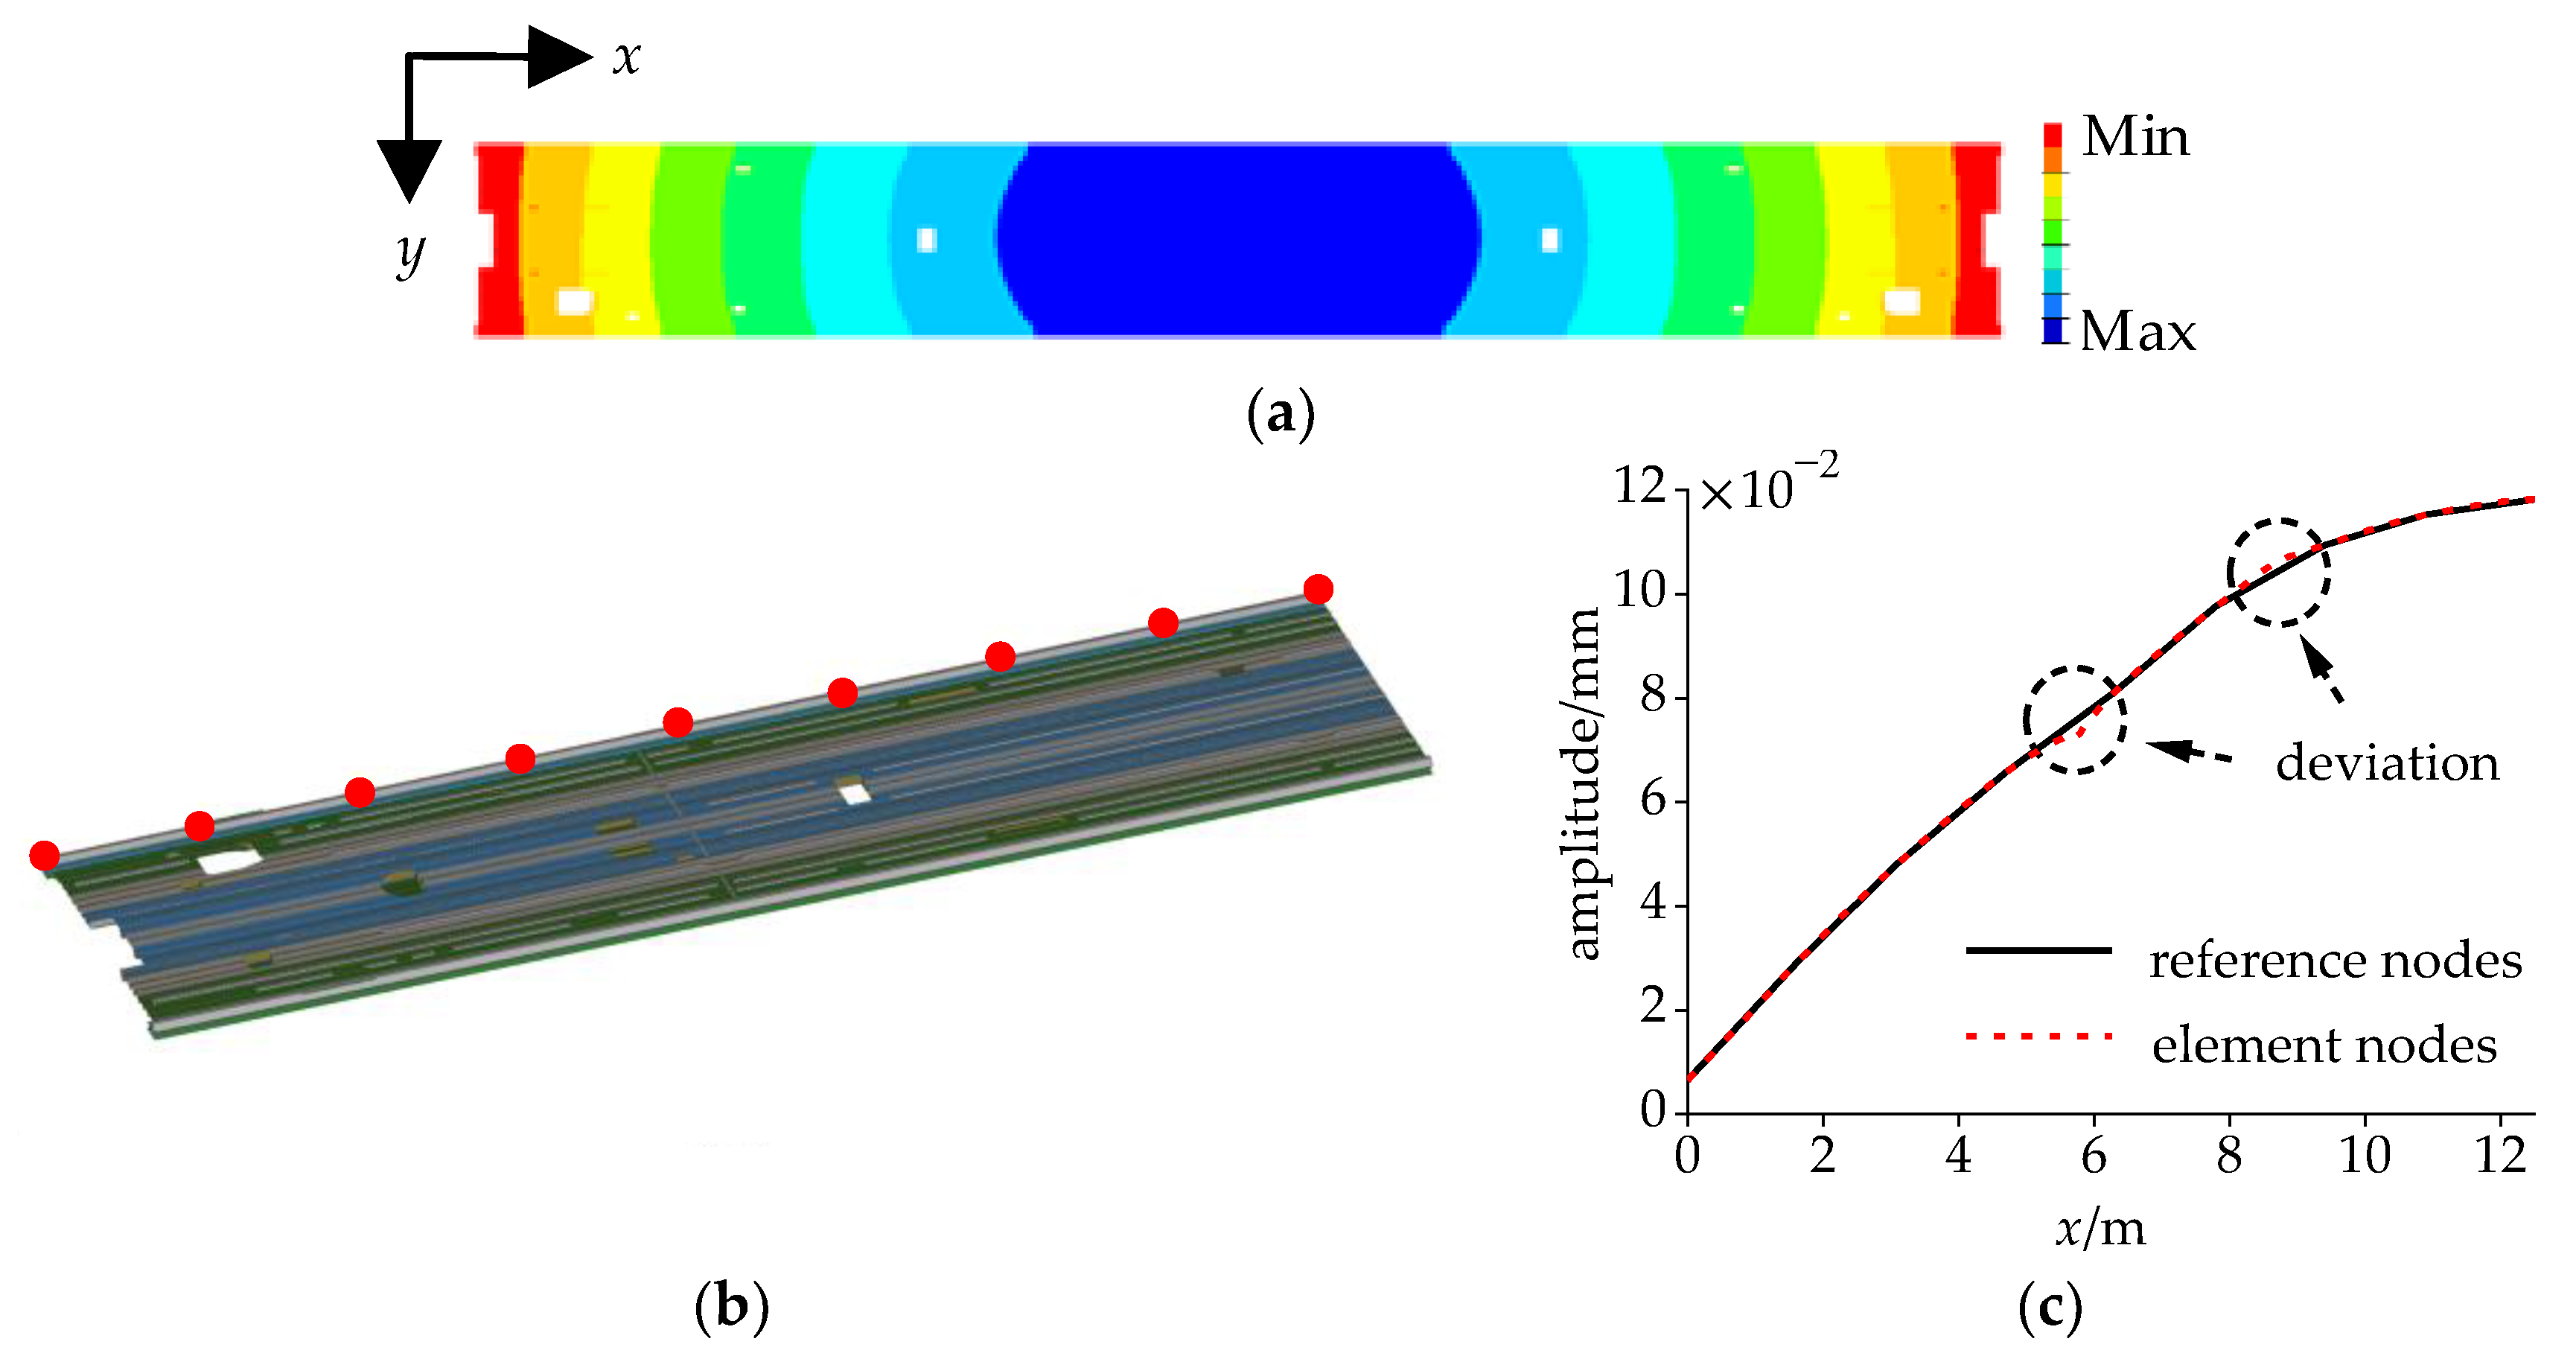
| x/m | 0 | 1.6 | 3.1 | 4.7 | 6.3 | 7.8 | 9.4 | 10.9 | 12.5 |
| amplitude/mm | 0.0065 | 0.0290 | 0.0482 | 0.0658 | 0.0812 | 0.0977 | 0.1094 | 0.1153 | 0.1182 |
Disclaimer/Publisher’s Note: The statements, opinions and data contained in all publications are solely those of the individual author(s) and contributor(s) and not of MDPI and/or the editor(s). MDPI and/or the editor(s) disclaim responsibility for any injury to people or property resulting from any ideas, methods, instructions or products referred to in the content. |
© 2024 by the authors. Licensee MDPI, Basel, Switzerland. This article is an open access article distributed under the terms and conditions of the Creative Commons Attribution (CC BY) license (https://creativecommons.org/licenses/by/4.0/).
Share and Cite
Yang, S.; Li, F.; Wu, P.; Gong, J. Study of Resonance between Bogie Hunting and Carbody Mode via Field Measurements and Dynamic Simulation. Sensors 2024, 24, 5194. https://doi.org/10.3390/s24165194
Yang S, Li F, Wu P, Gong J. Study of Resonance between Bogie Hunting and Carbody Mode via Field Measurements and Dynamic Simulation. Sensors. 2024; 24(16):5194. https://doi.org/10.3390/s24165194
Chicago/Turabian StyleYang, Sheng, Fansong Li, Pingbo Wu, and Jijun Gong. 2024. "Study of Resonance between Bogie Hunting and Carbody Mode via Field Measurements and Dynamic Simulation" Sensors 24, no. 16: 5194. https://doi.org/10.3390/s24165194