
A Polymer Thick Film on an Organic Substrate Grid Electrode and an Open-Source Recording System for UHF MRI: An Imaging Study

 , ,
, , 
Abstract
1. Introduction
2. Materials and Methods
2.1. PTFOS Construction
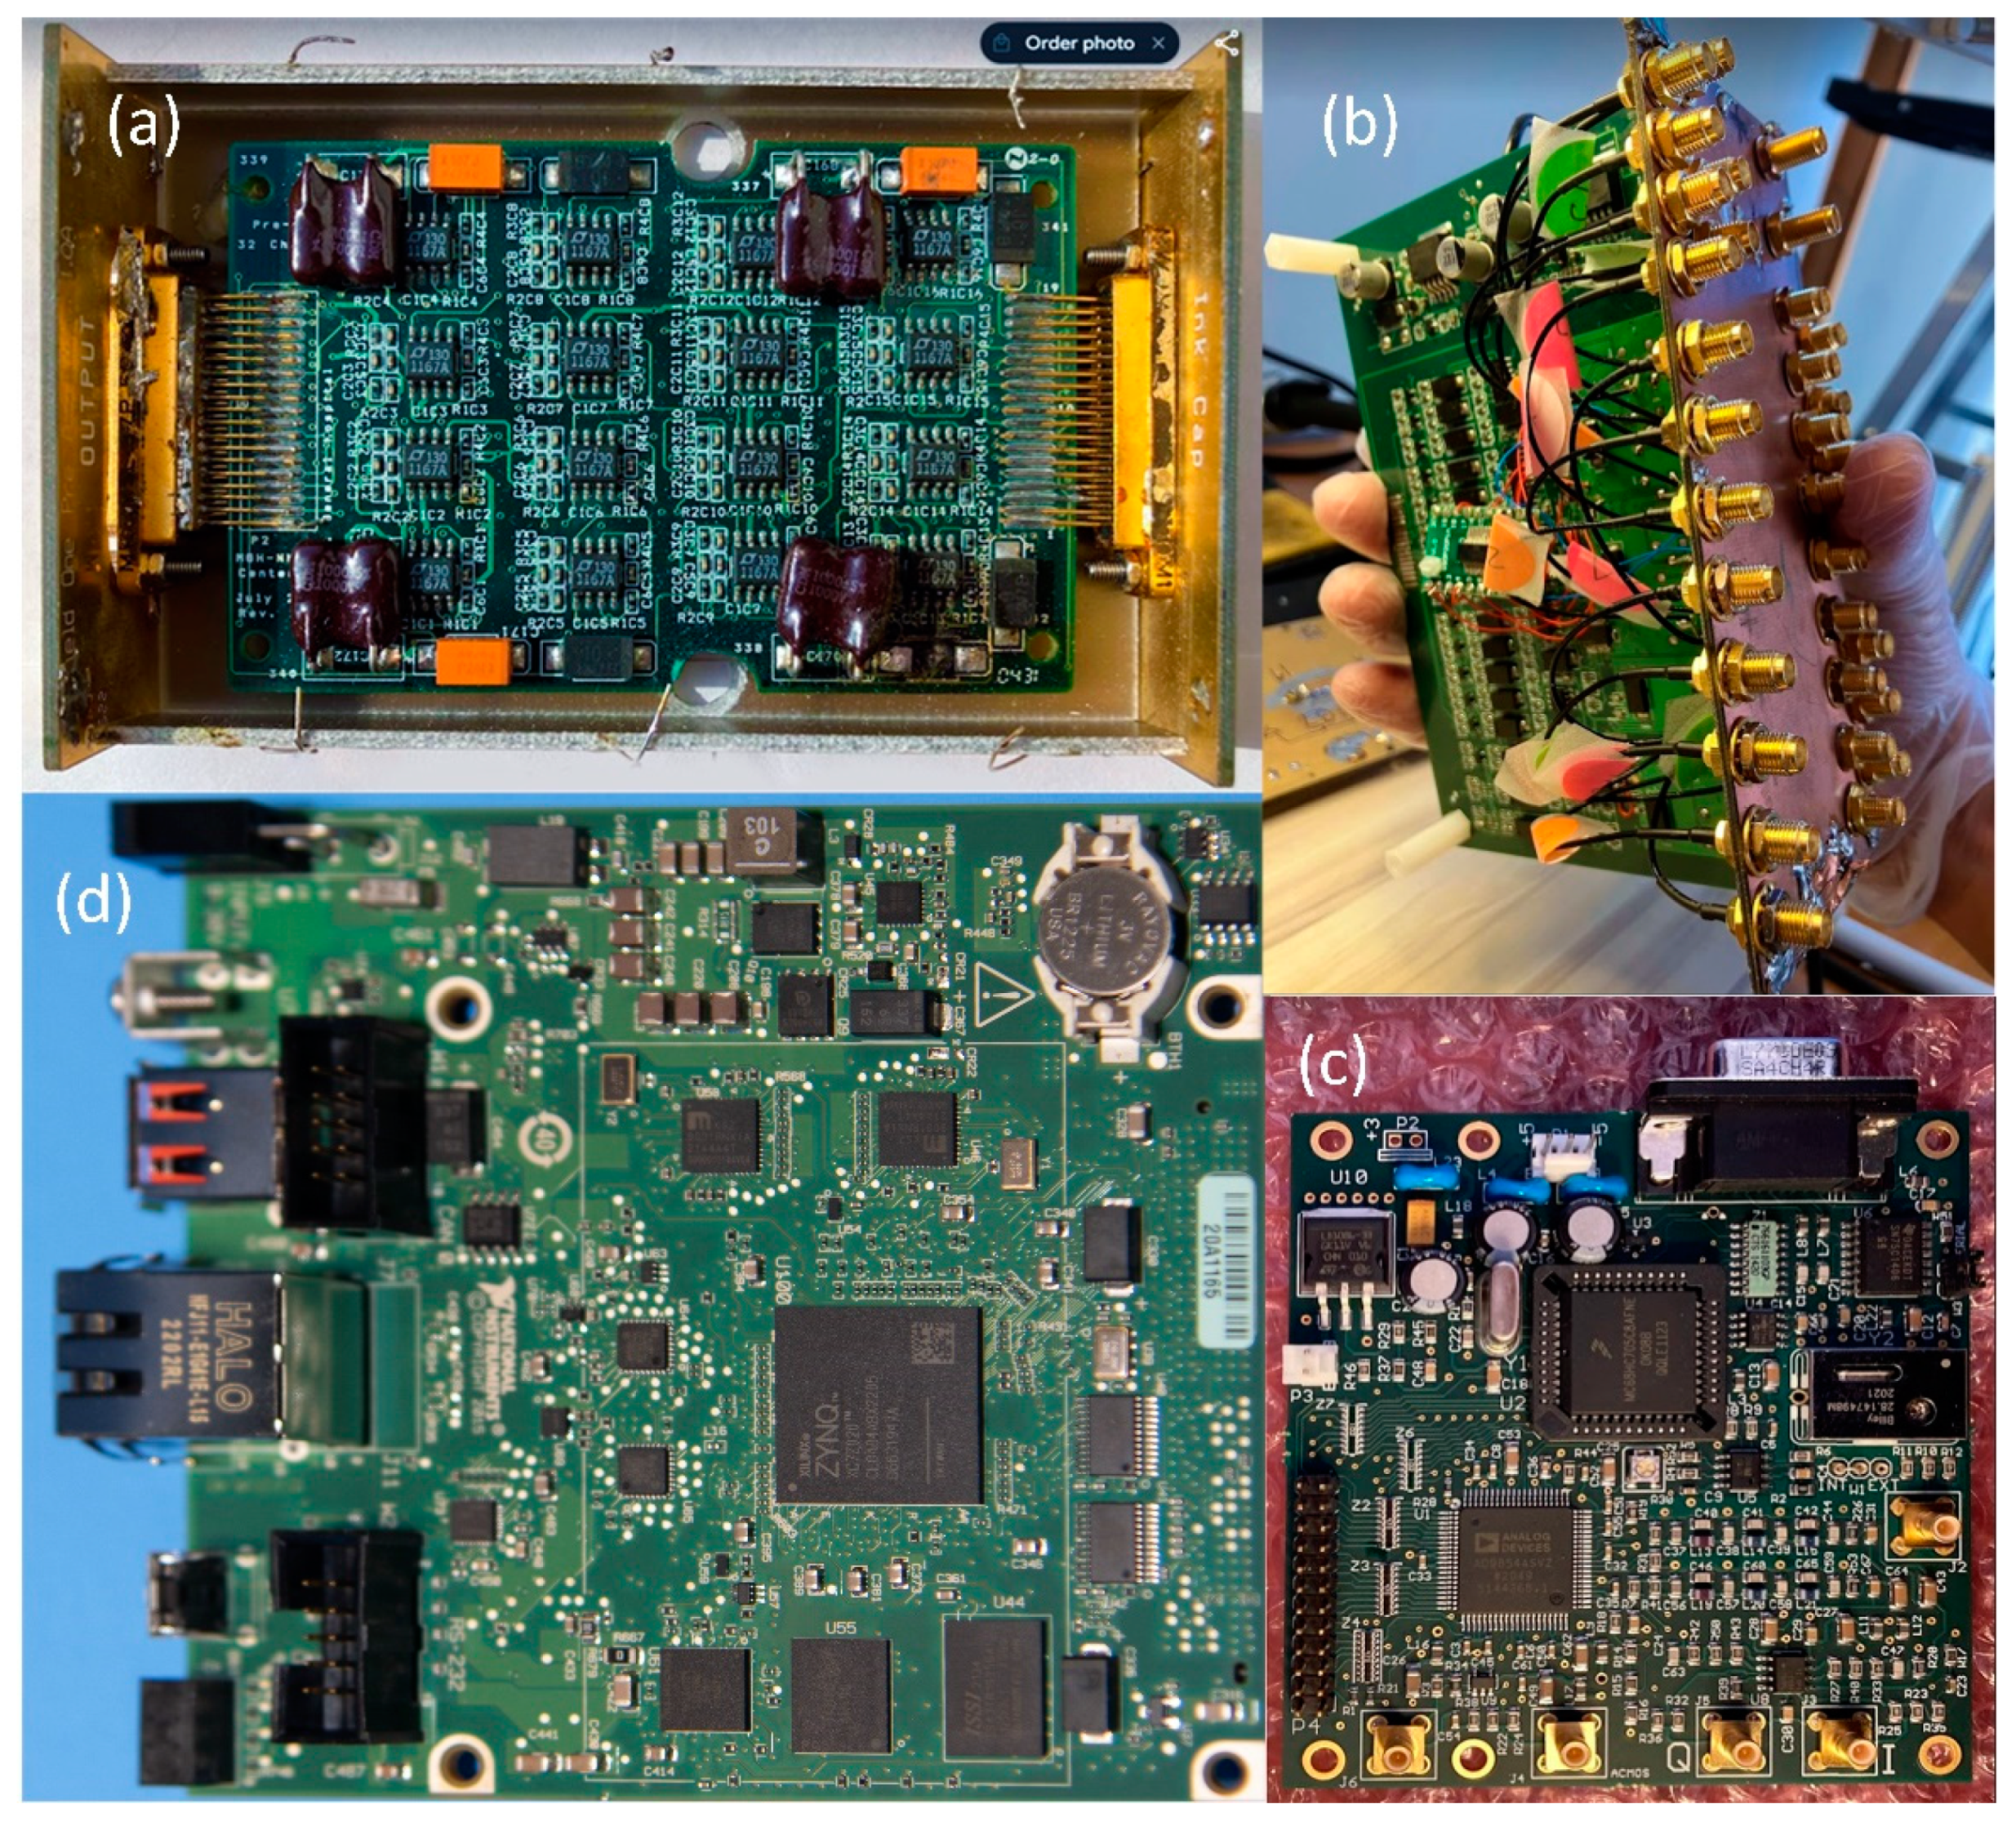
2.2. The HF-2 System
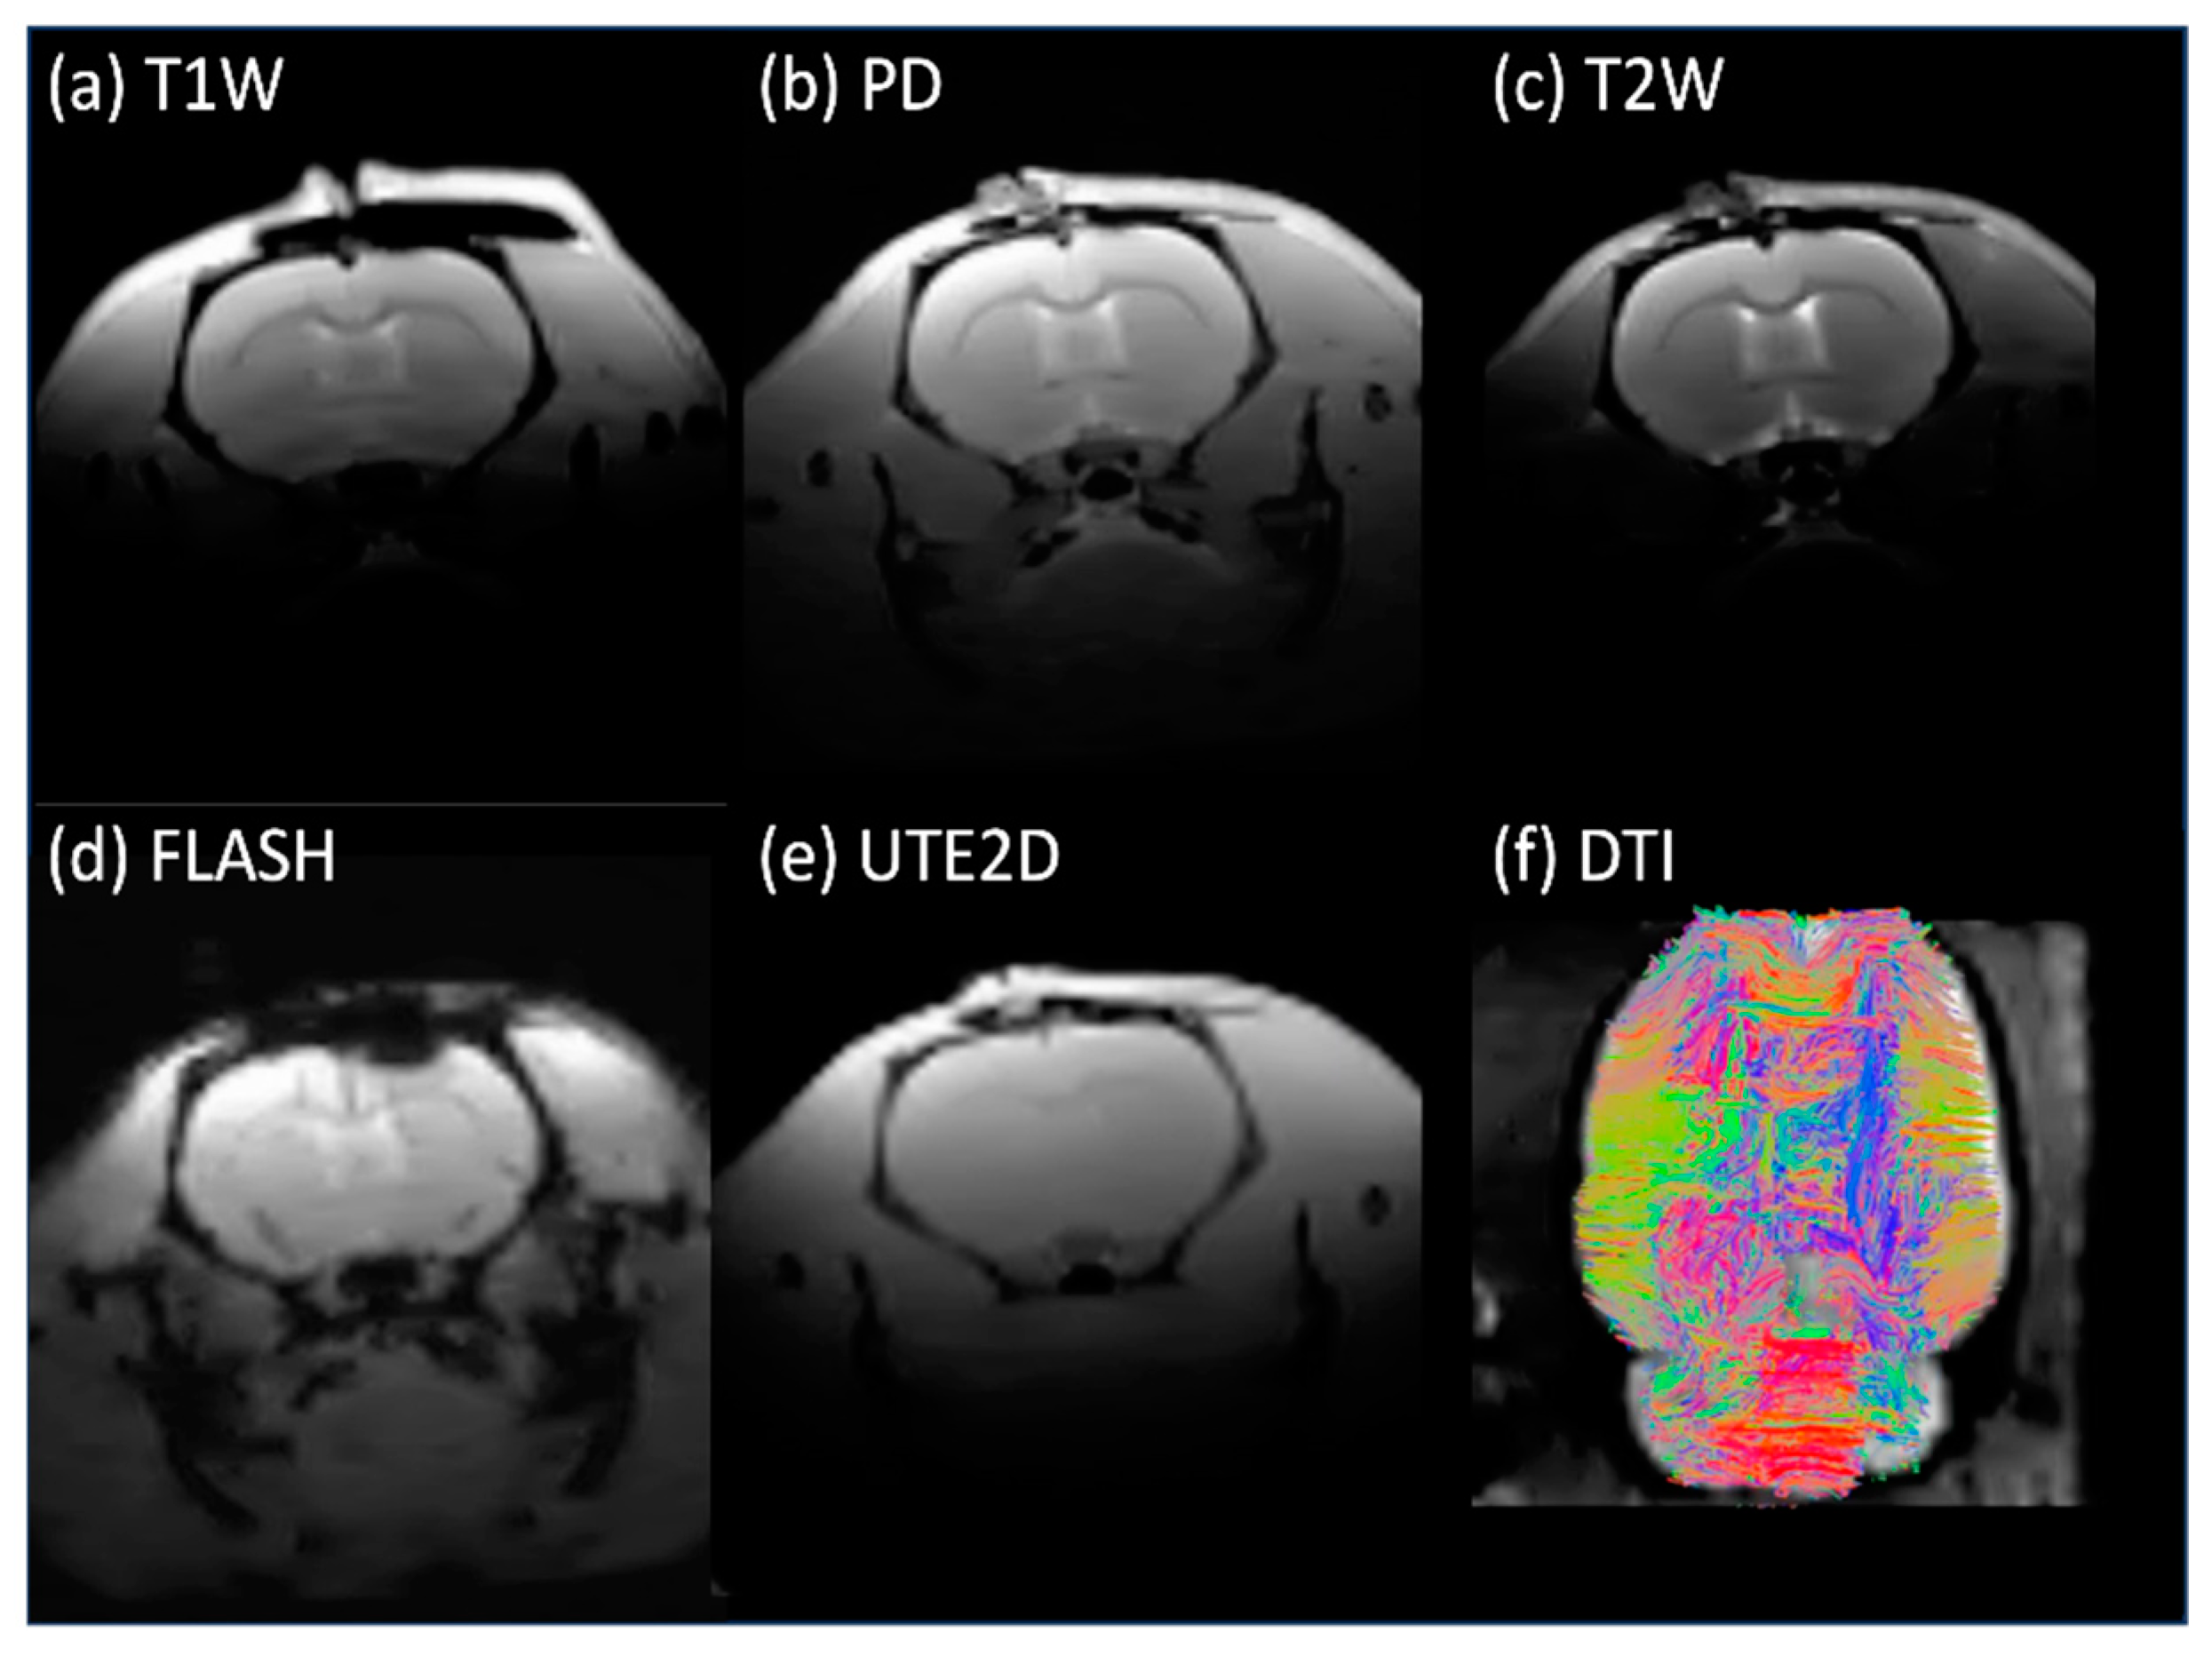
2.3. MRI Testing
2.4. In Vivo Studies
2.5. The HF-2 Software
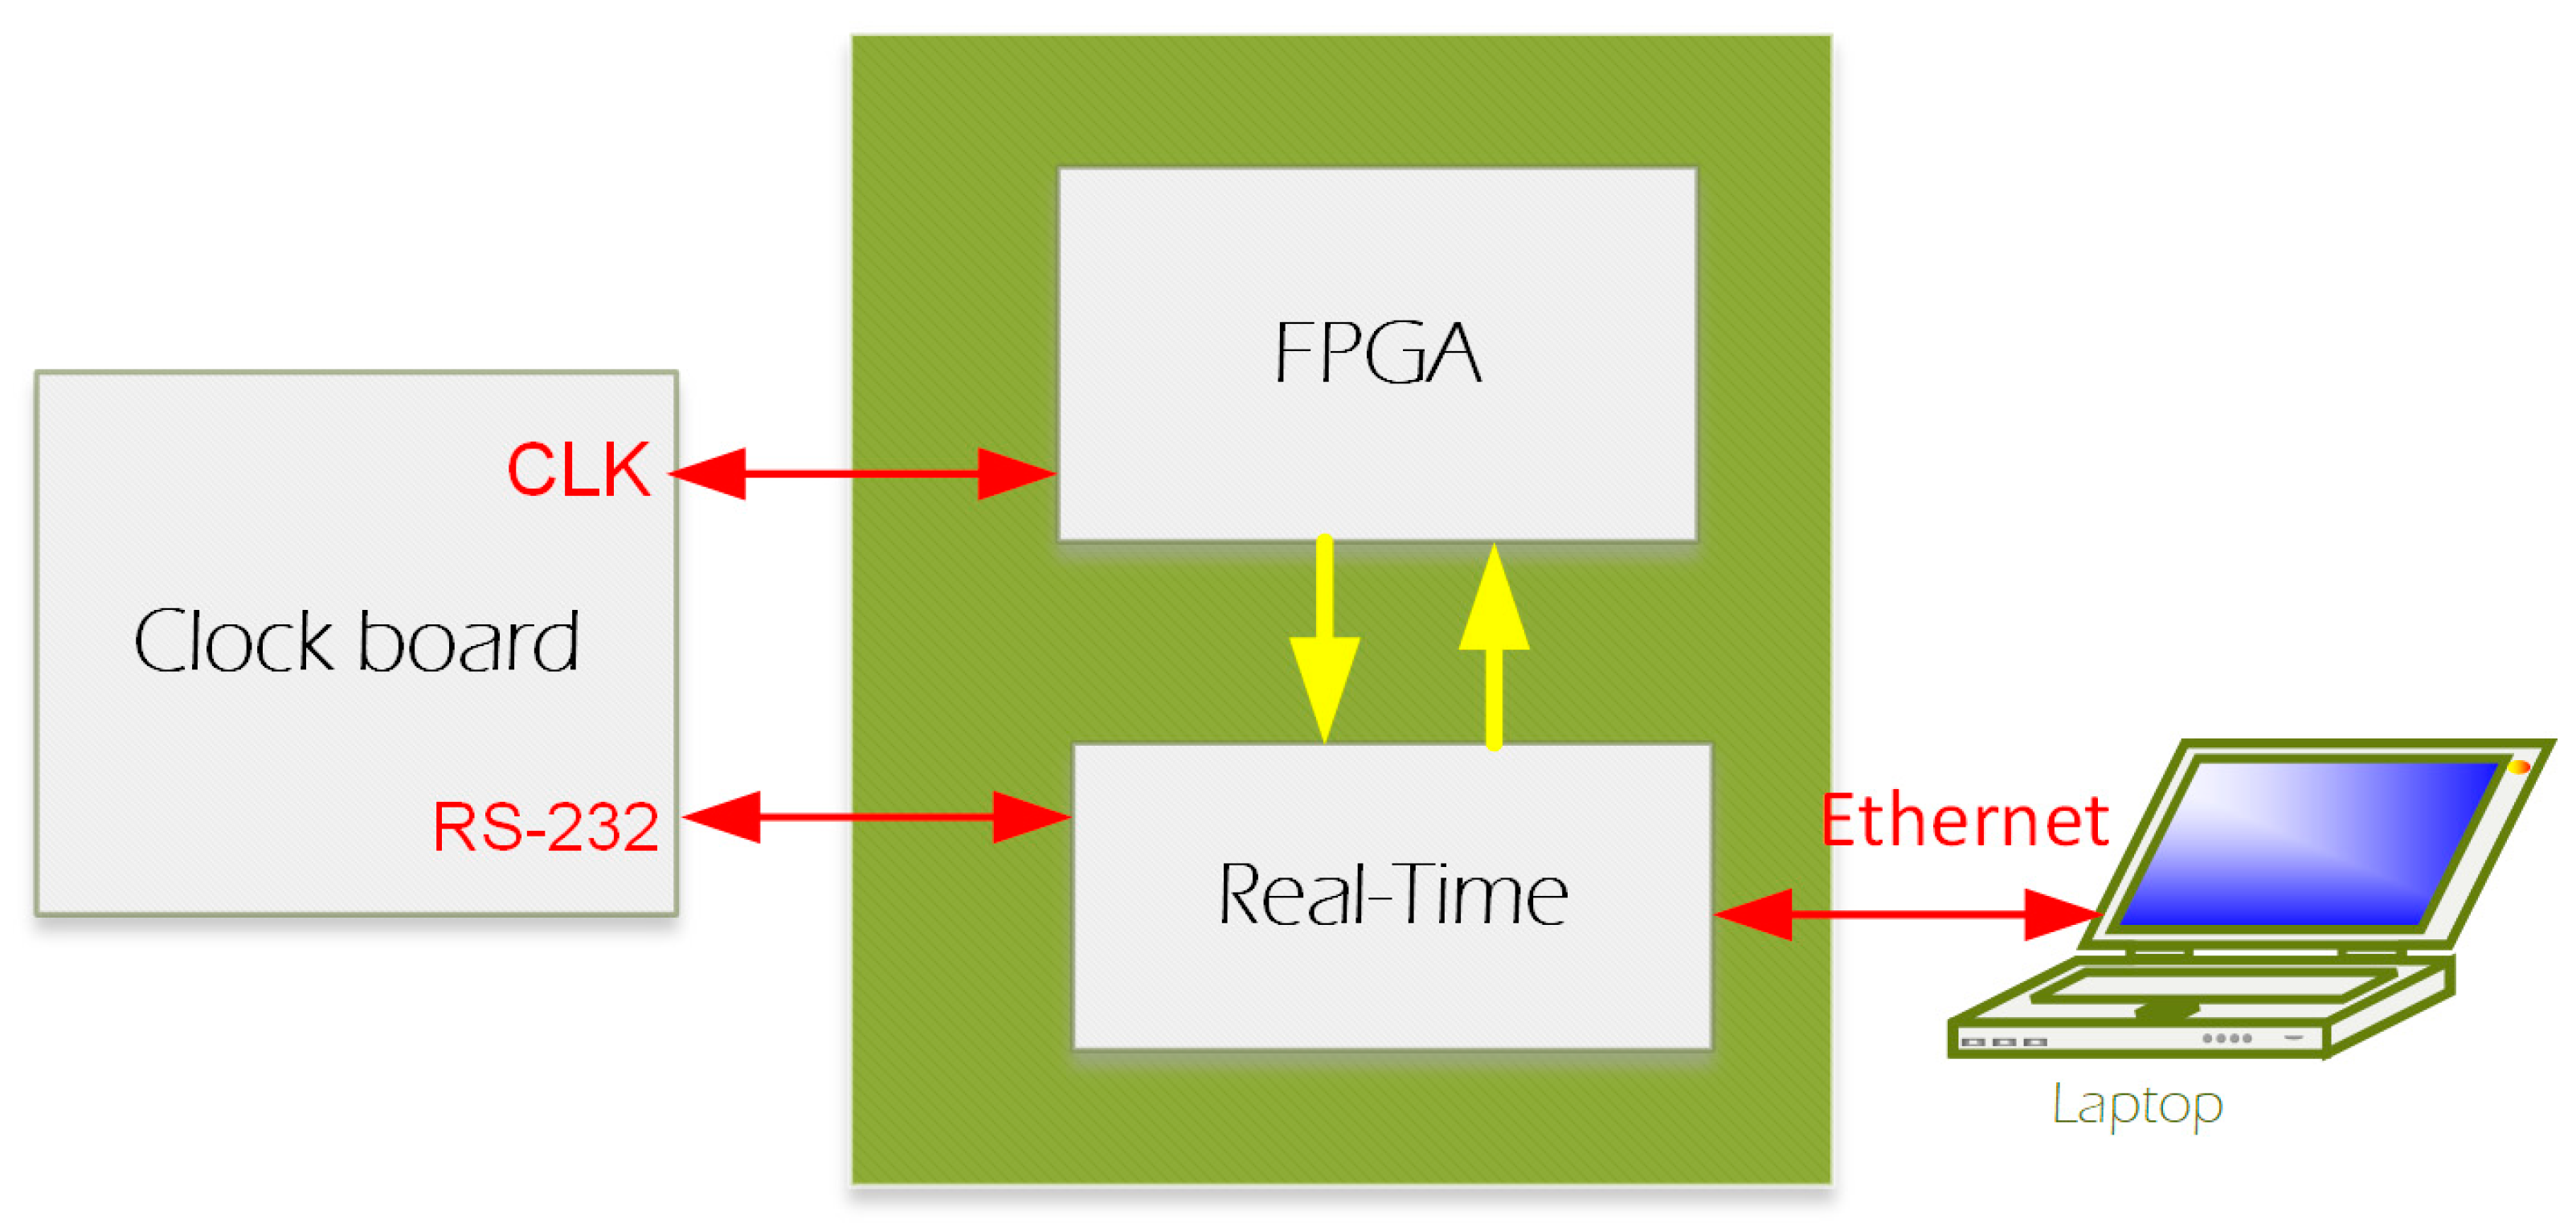
2.5.1. Field-Programmable Gate Array (FPGA) Firmware
2.5.2. Real-Time (RT) Software
2.5.3. Host Software
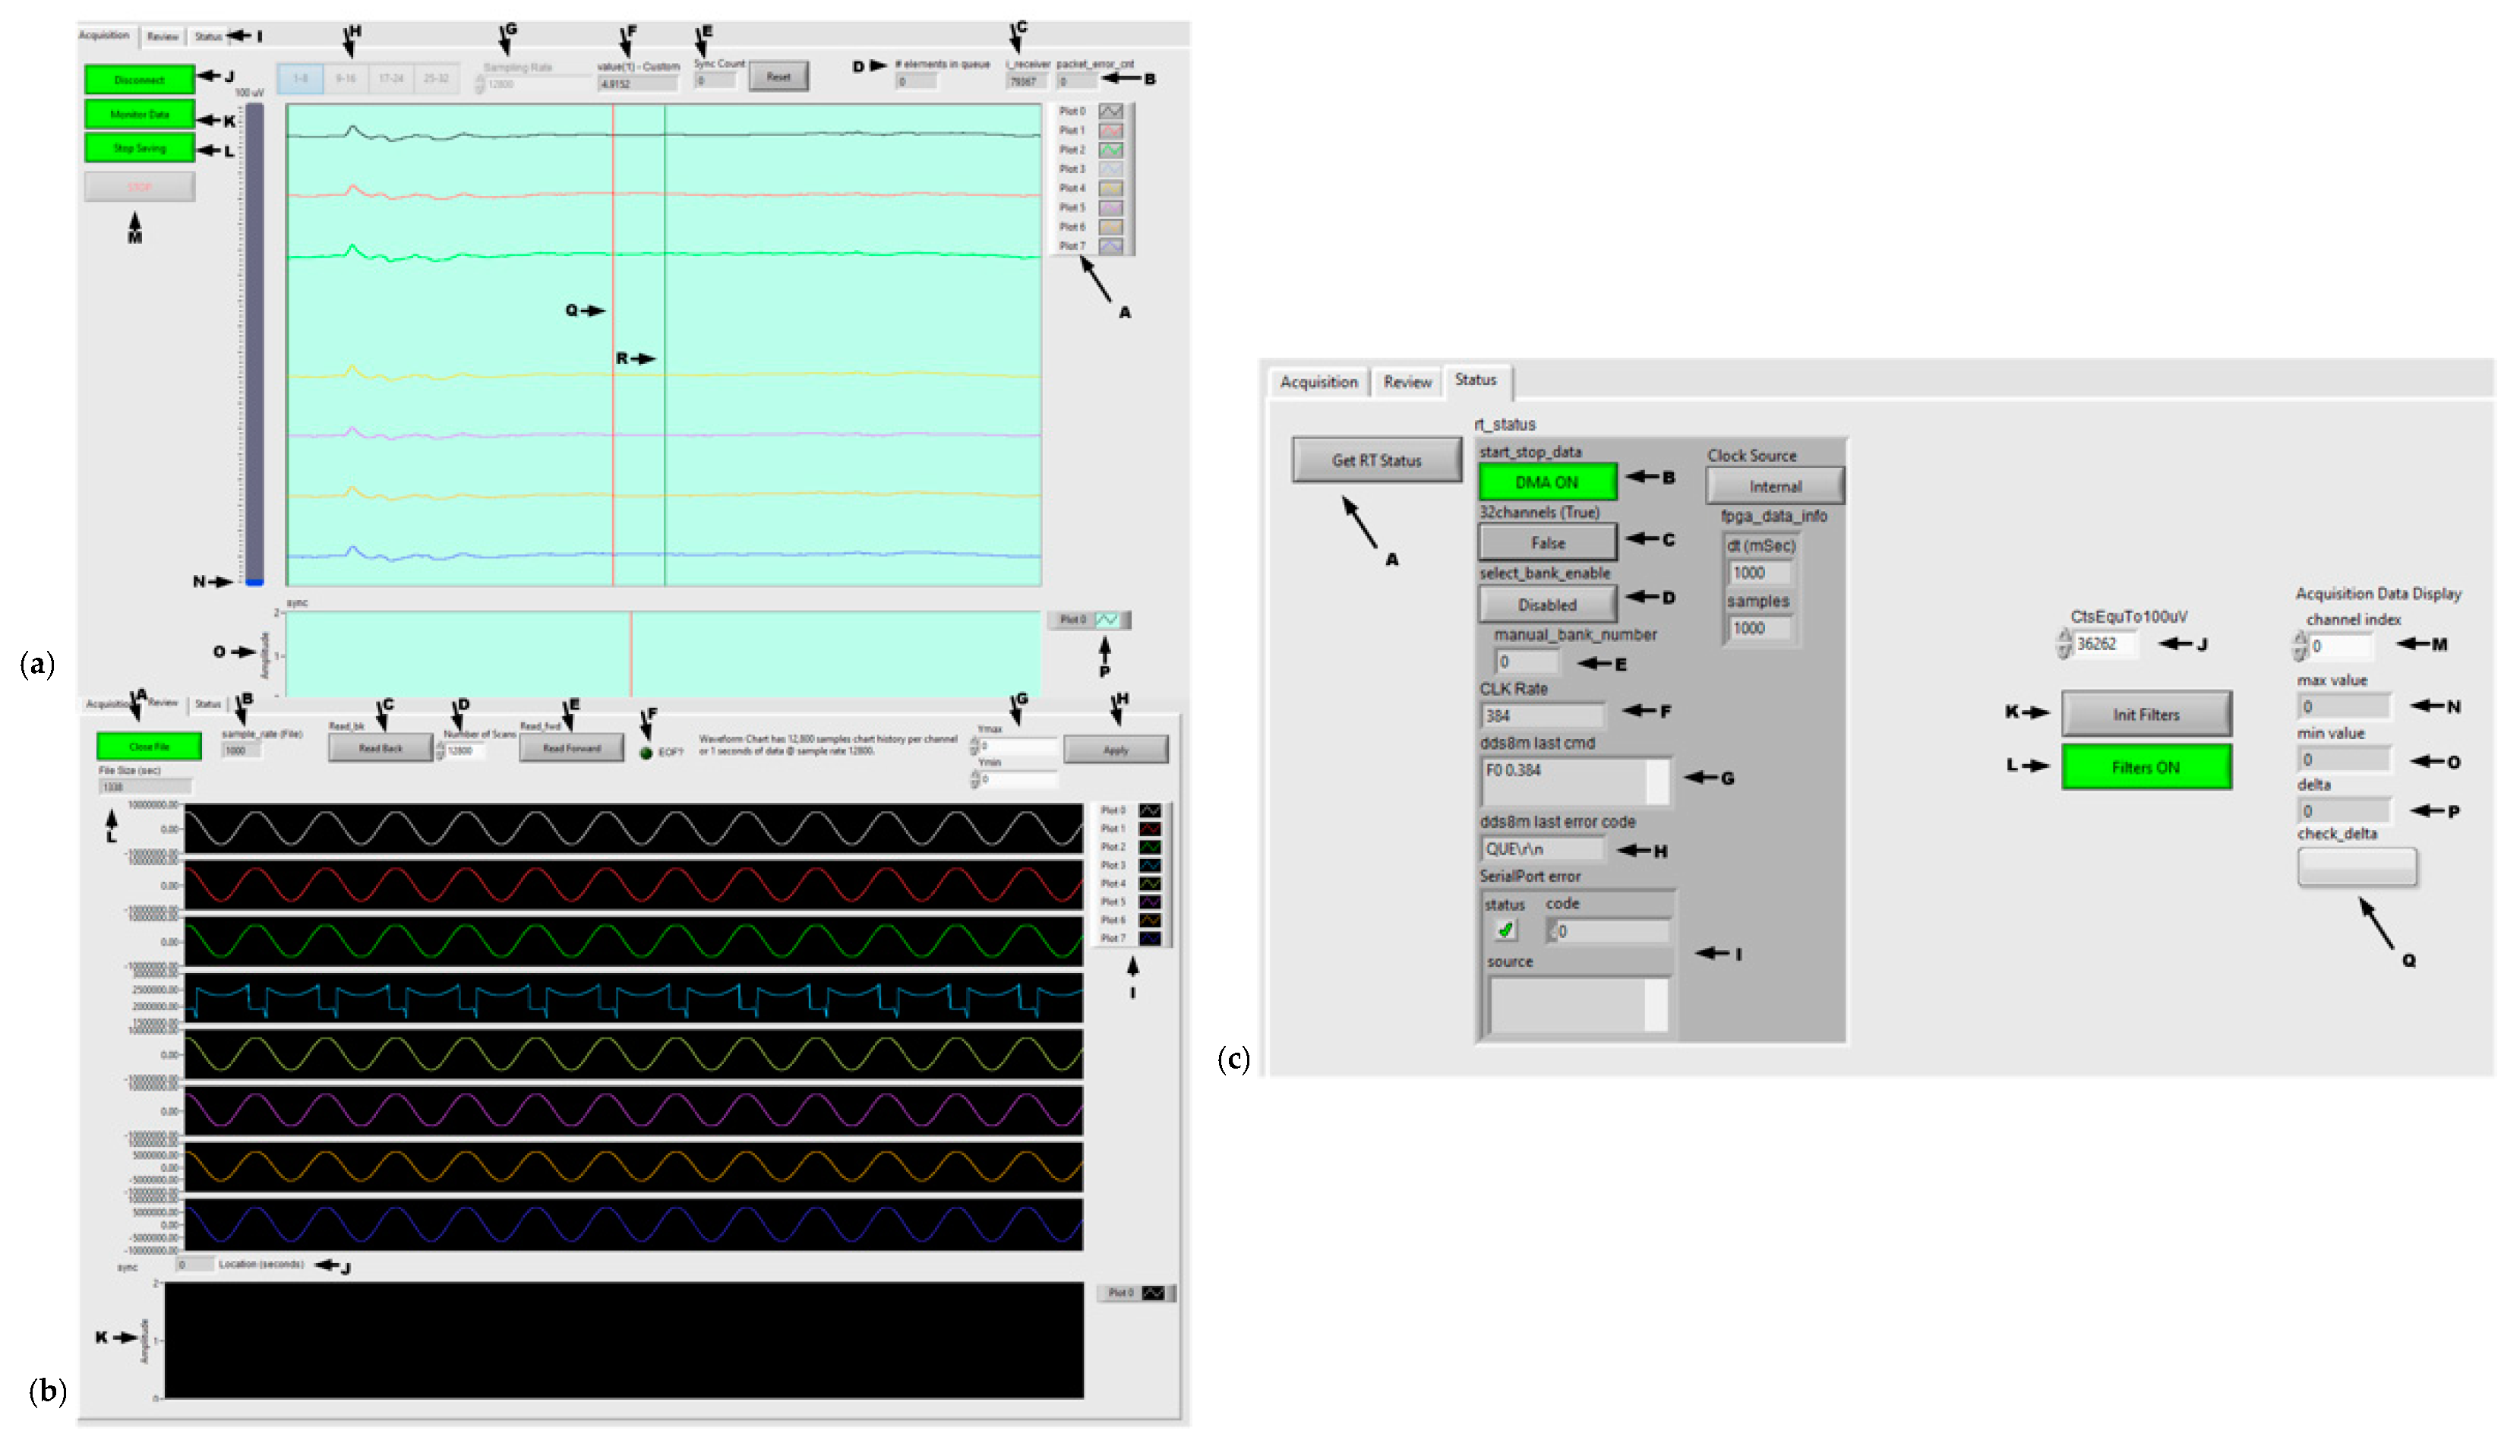
2.5.4. Windows LabVIEW
2.5.5. TCP/IP Packet
2.5.6. TCP/IP Message Format
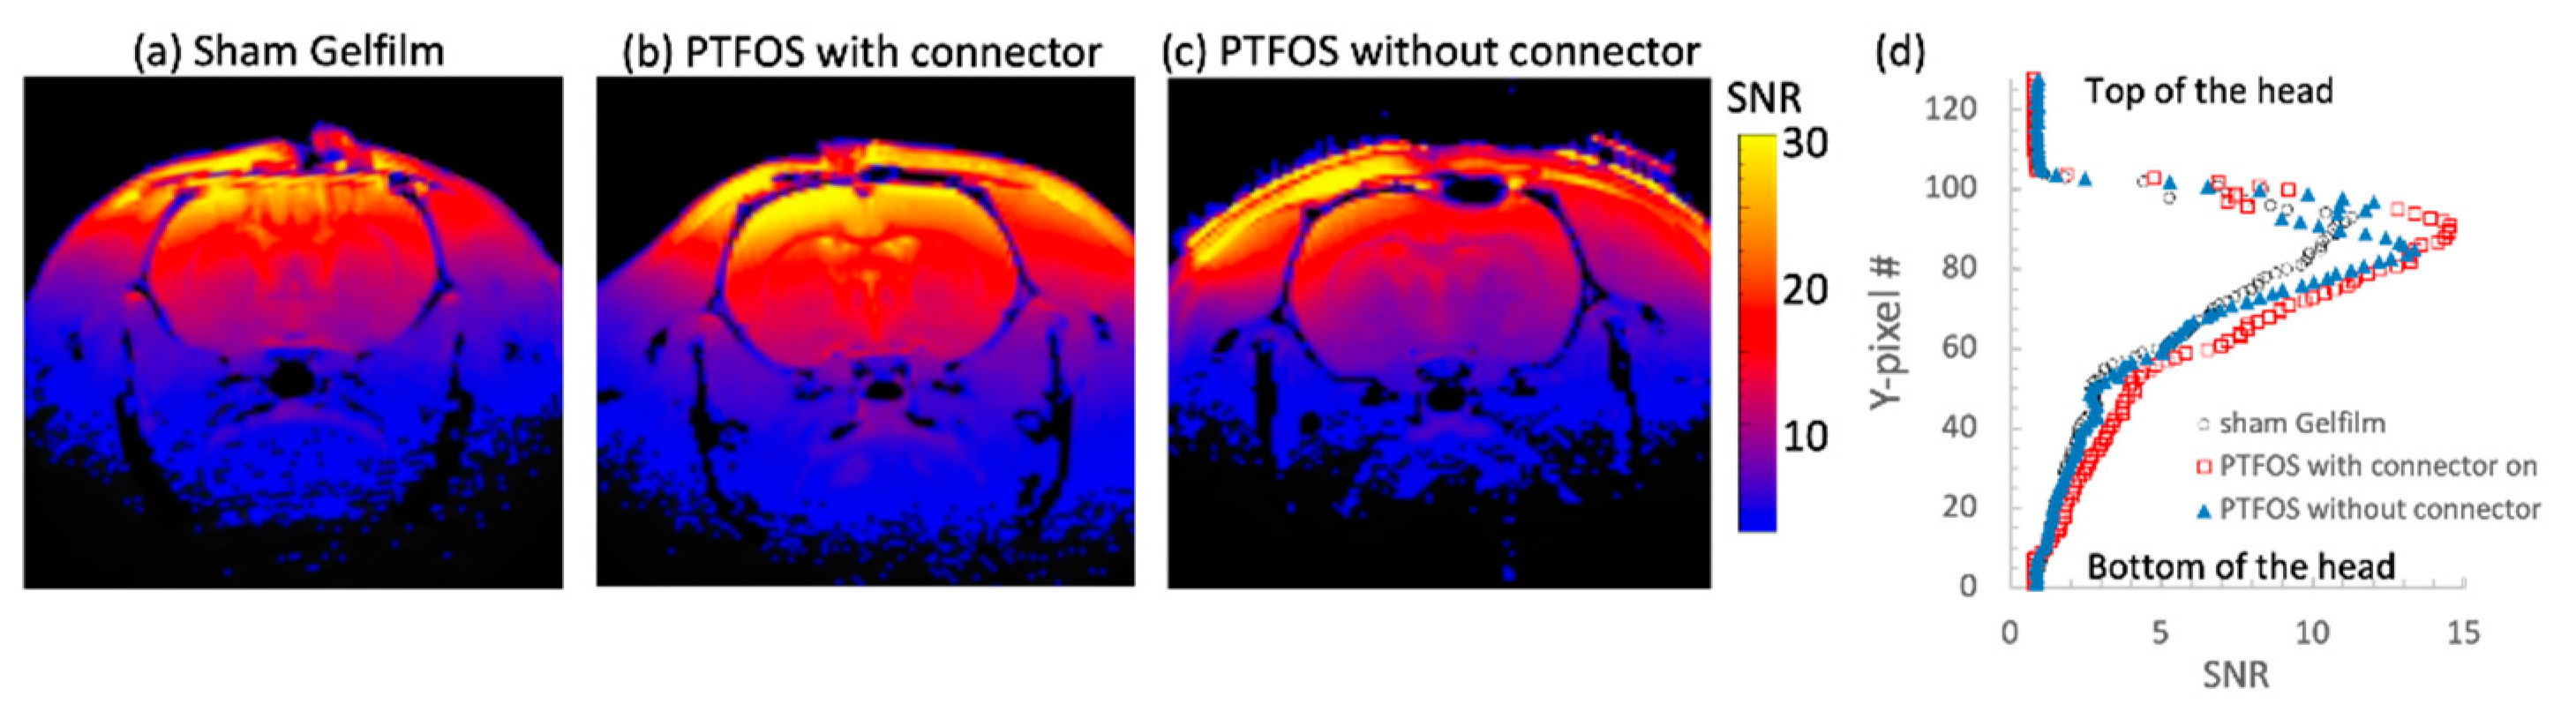
2.5.7. SNR Testing
3. Results
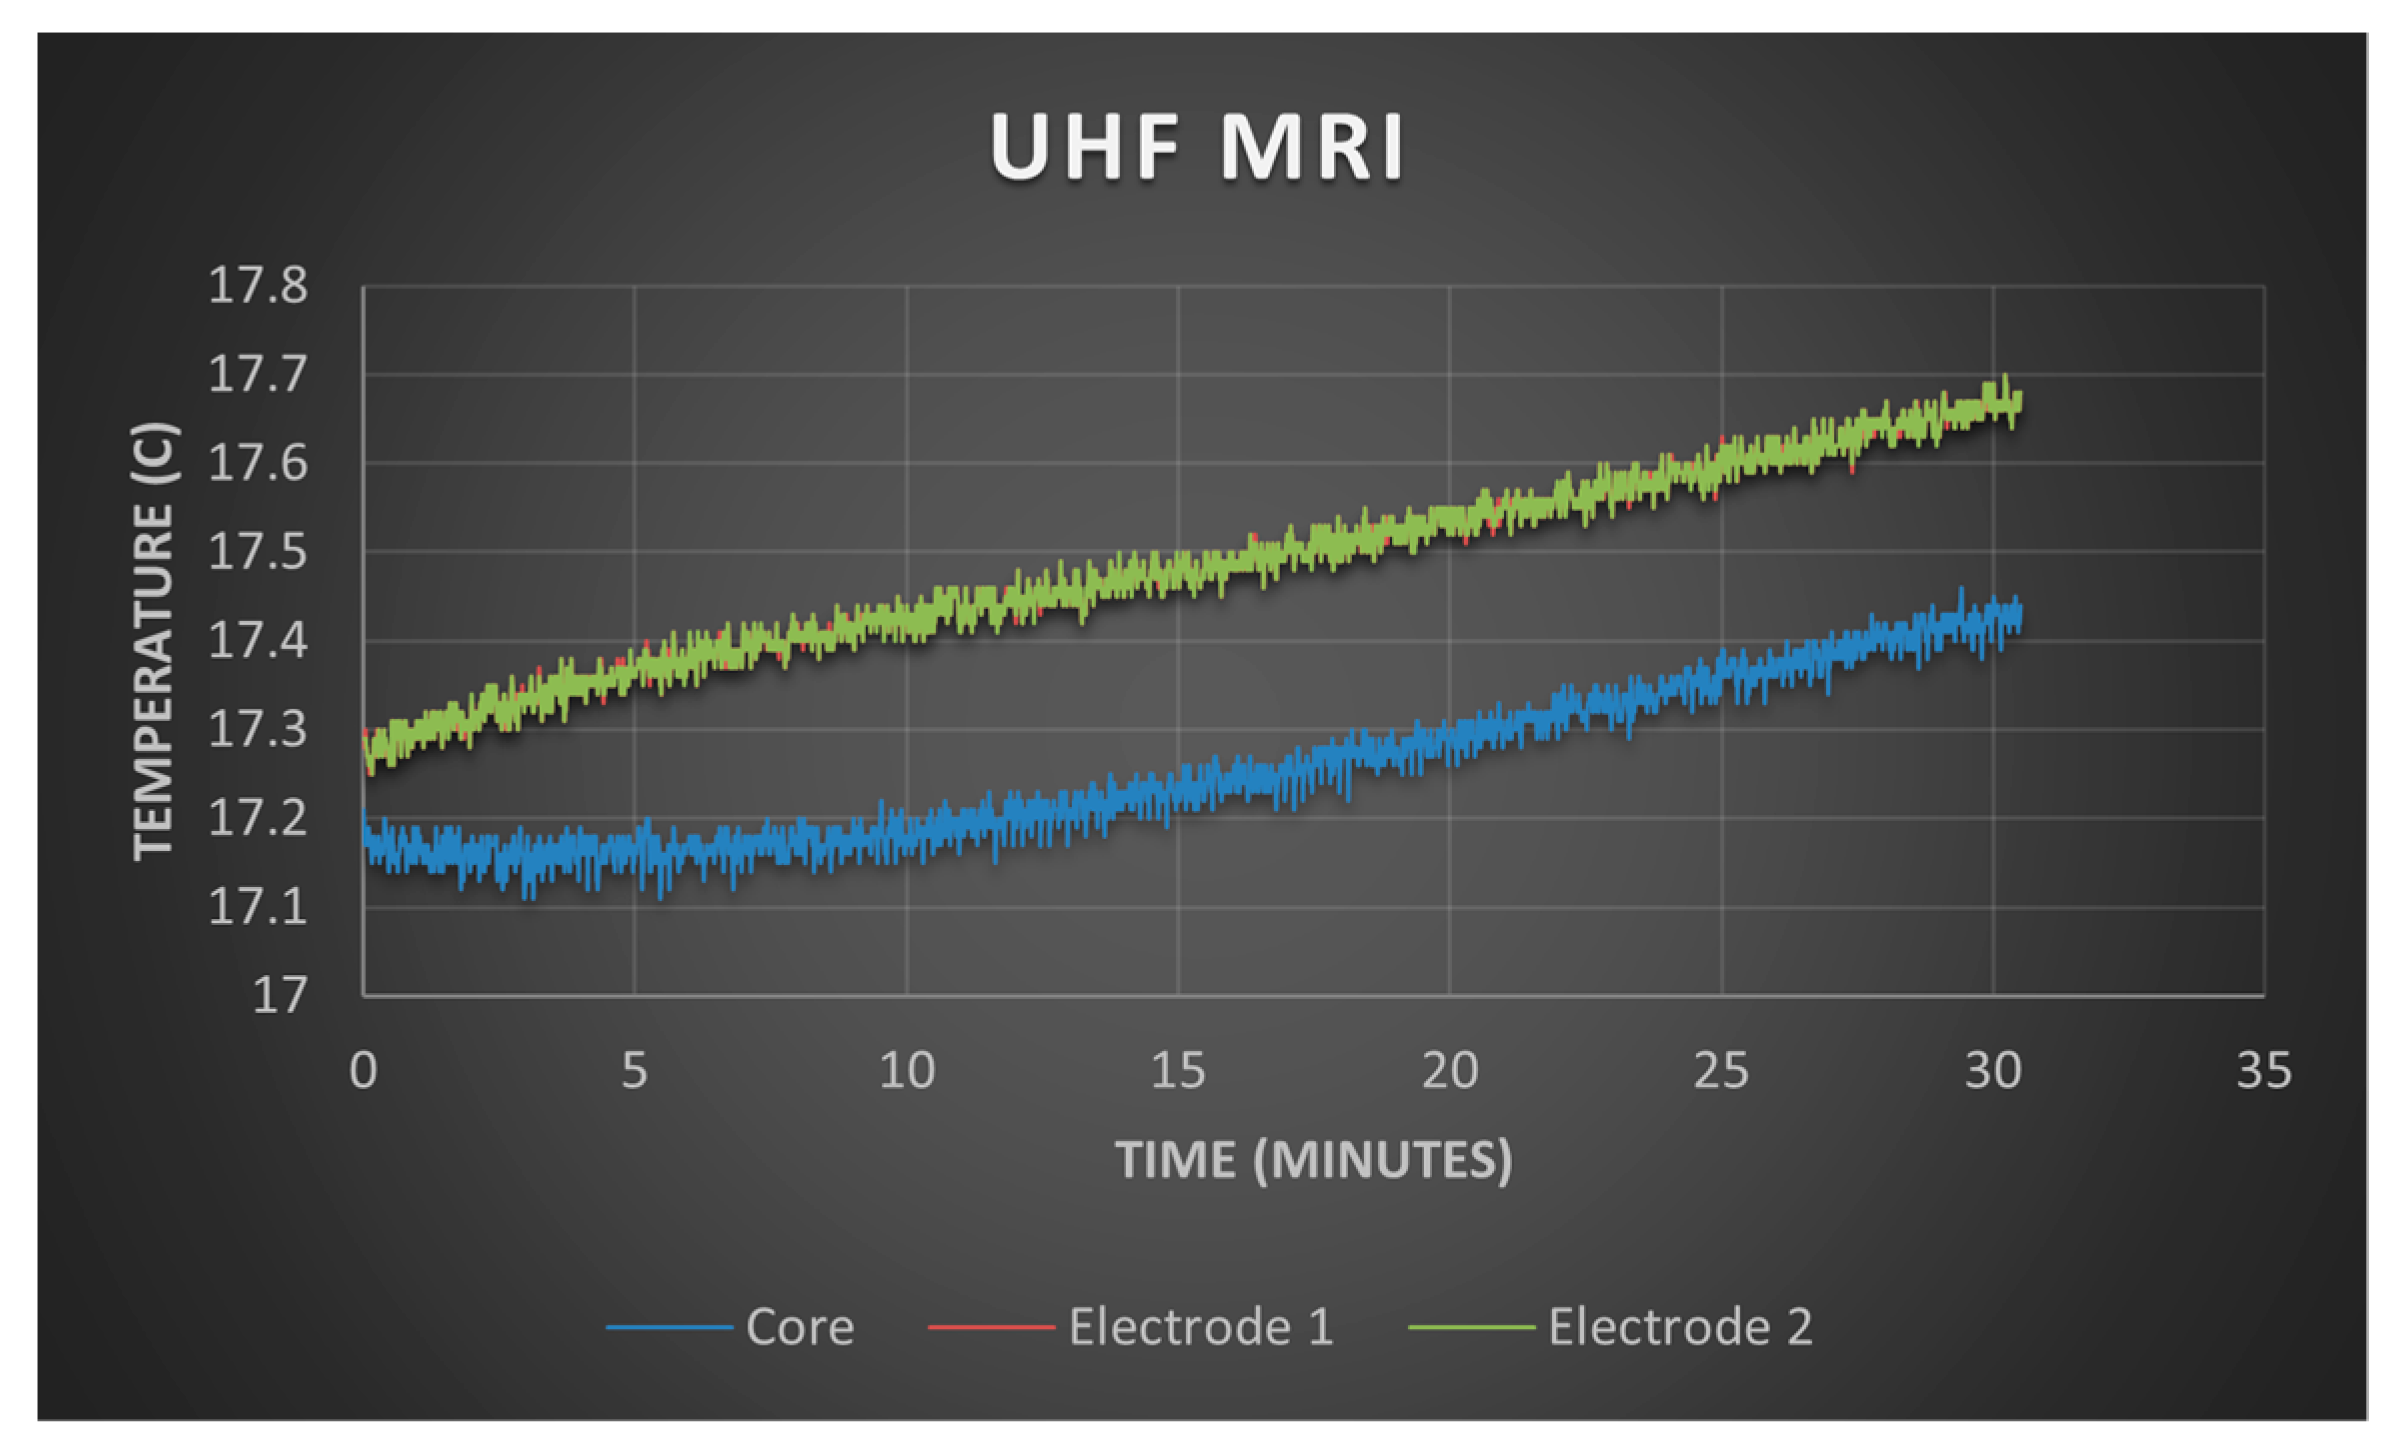
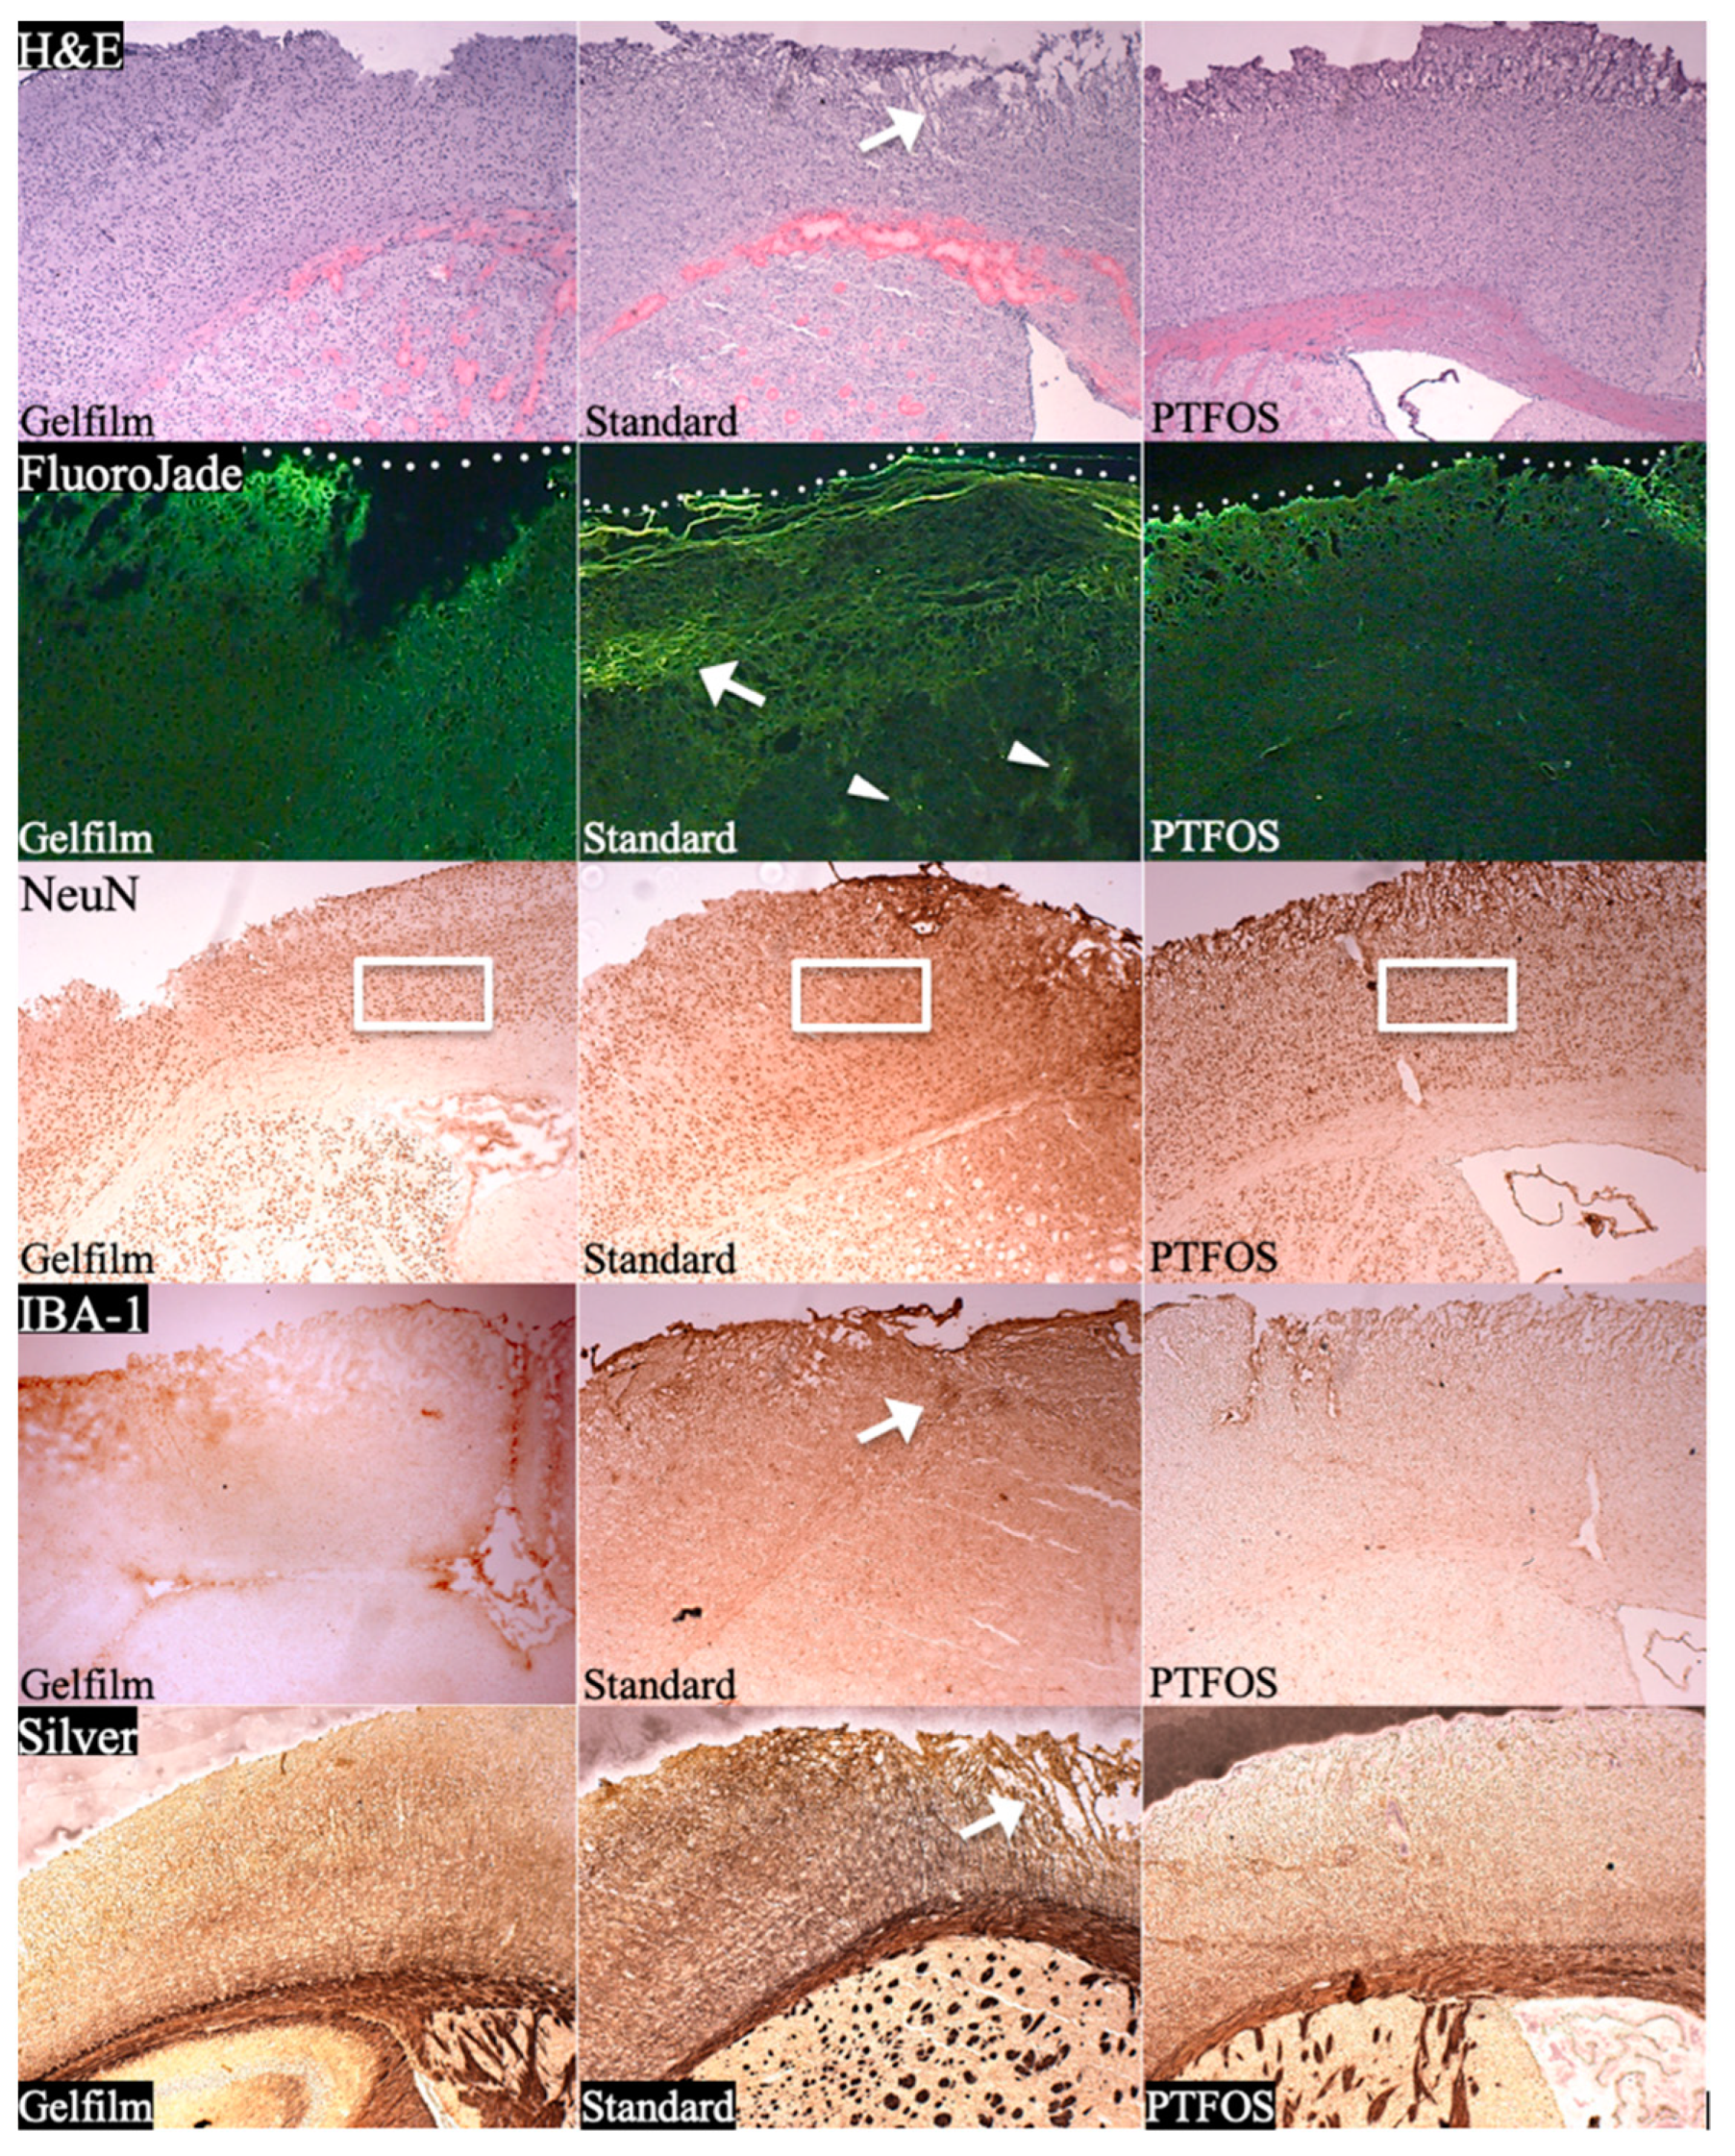
3.1. PTFOS Safety
3.2. In Vivo Studies
3.3. Shield Testing
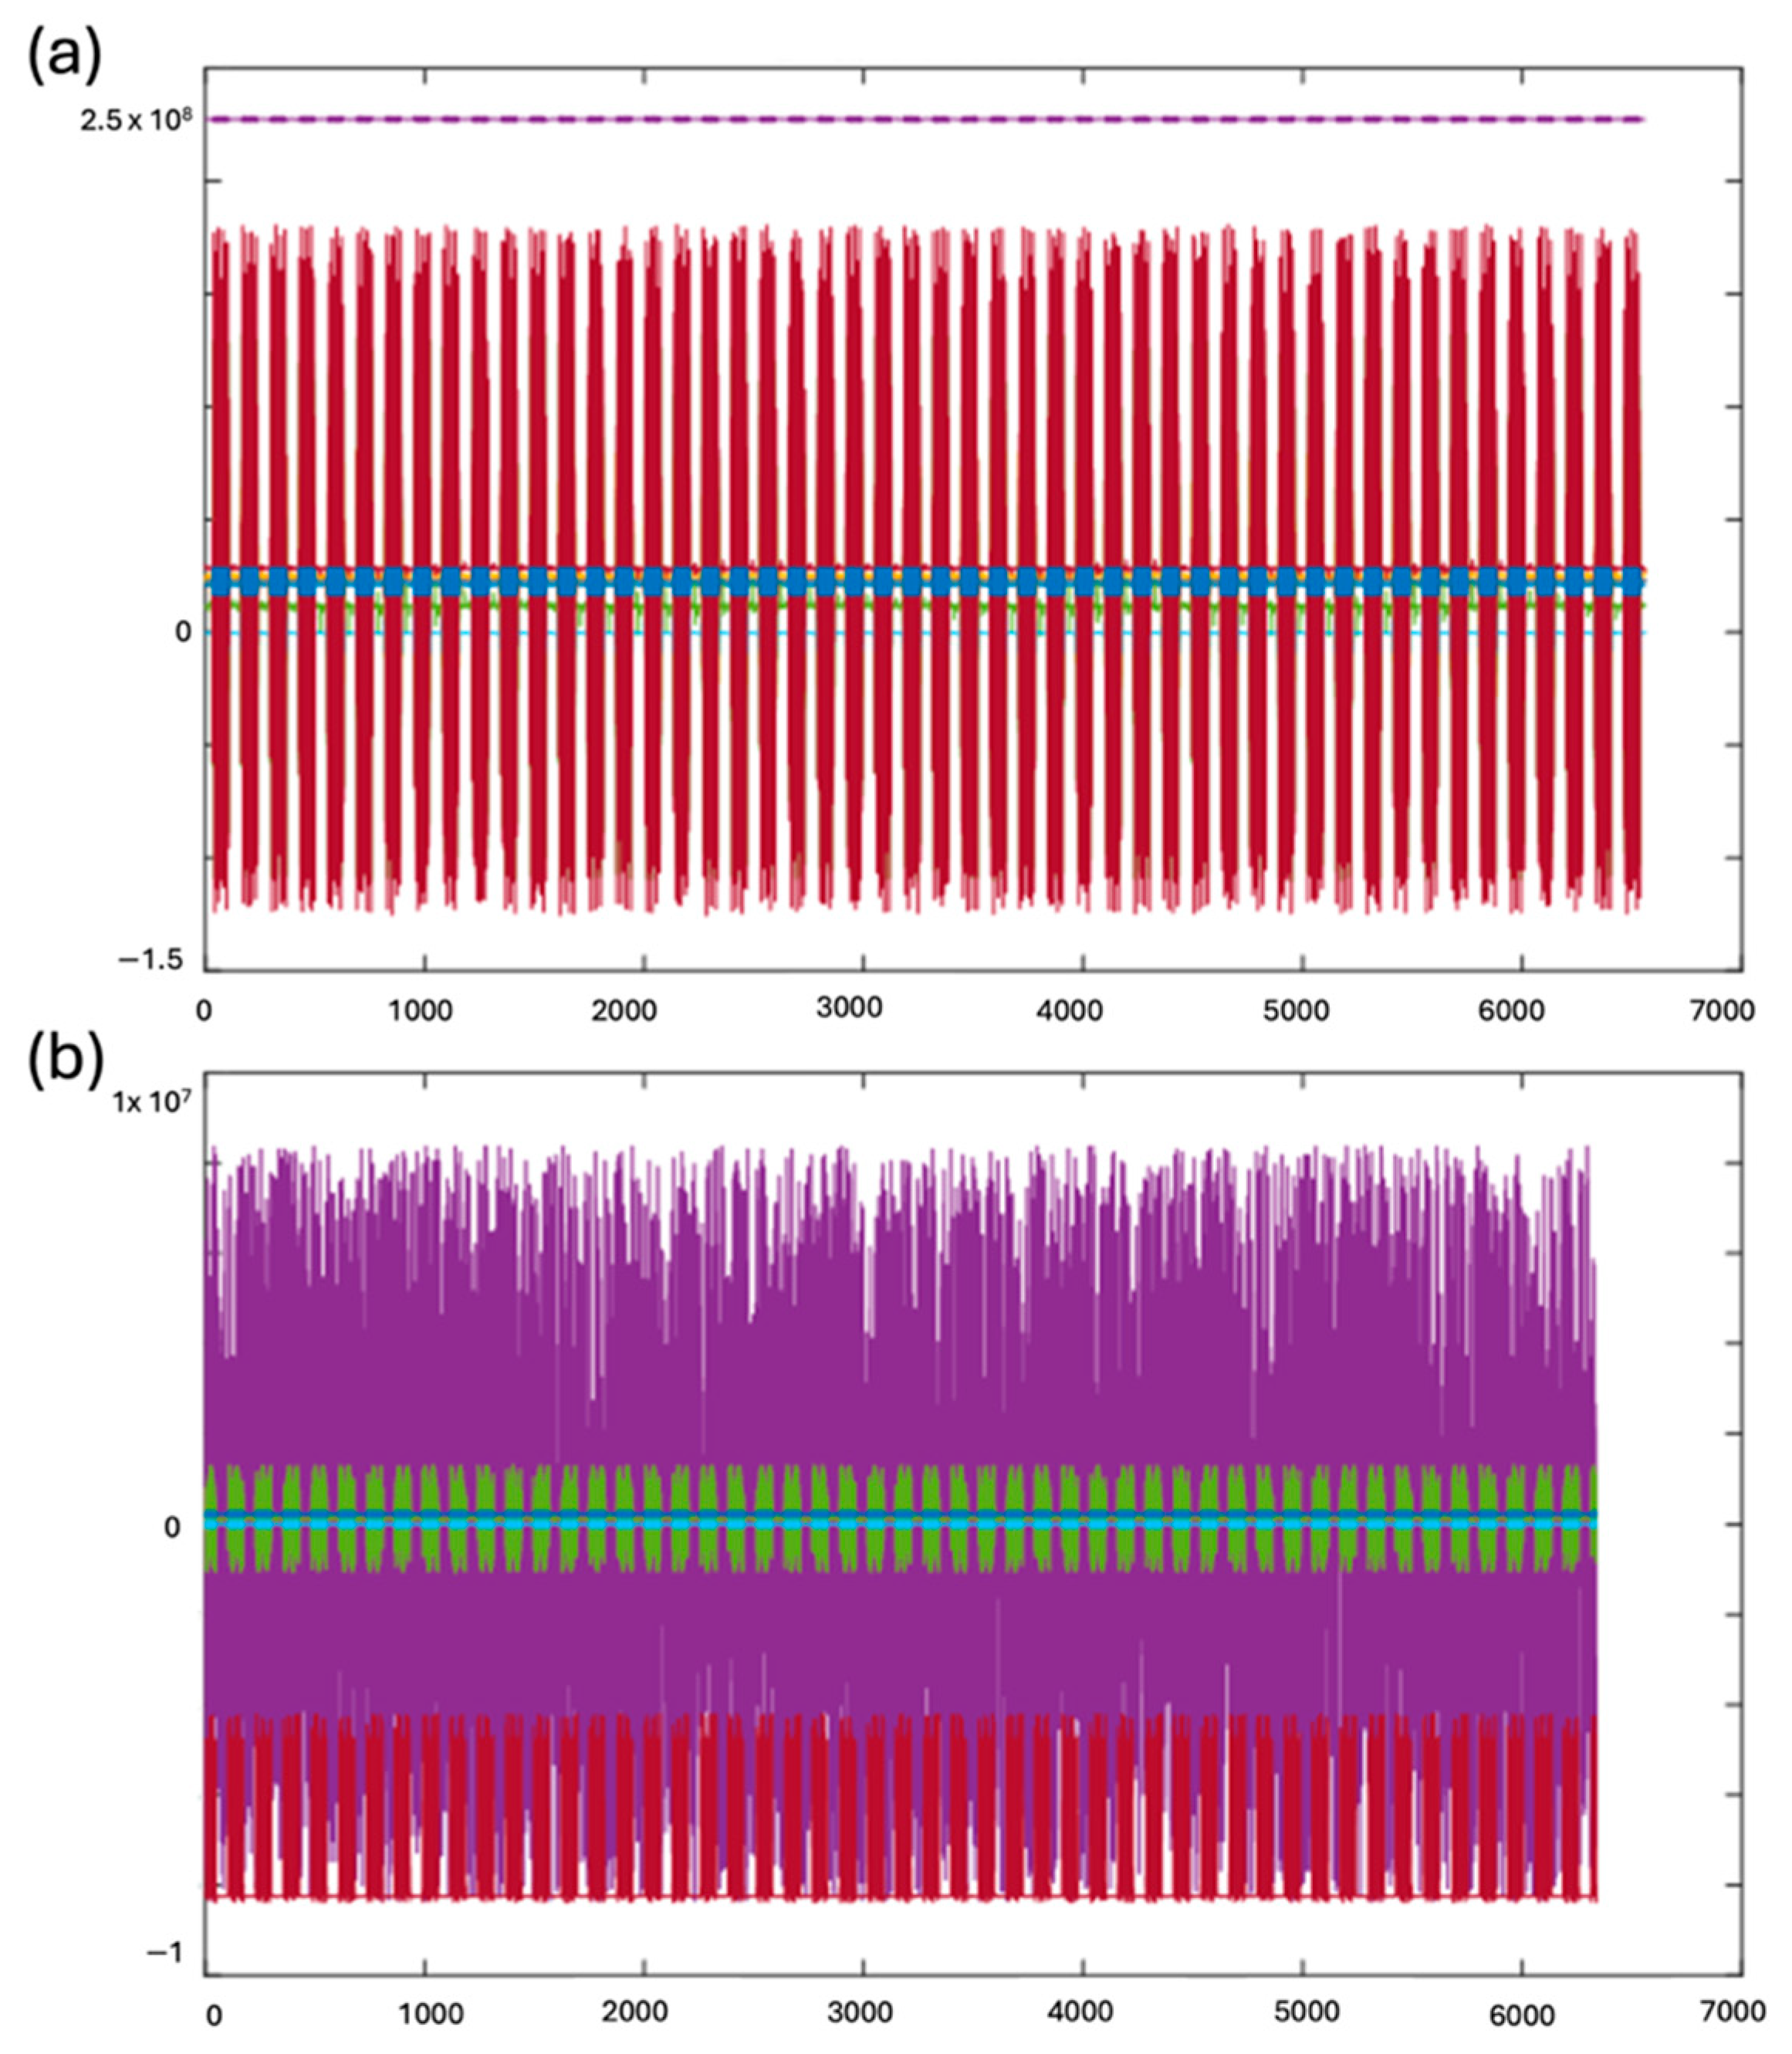
3.4. Synchronization Testing of HF-2
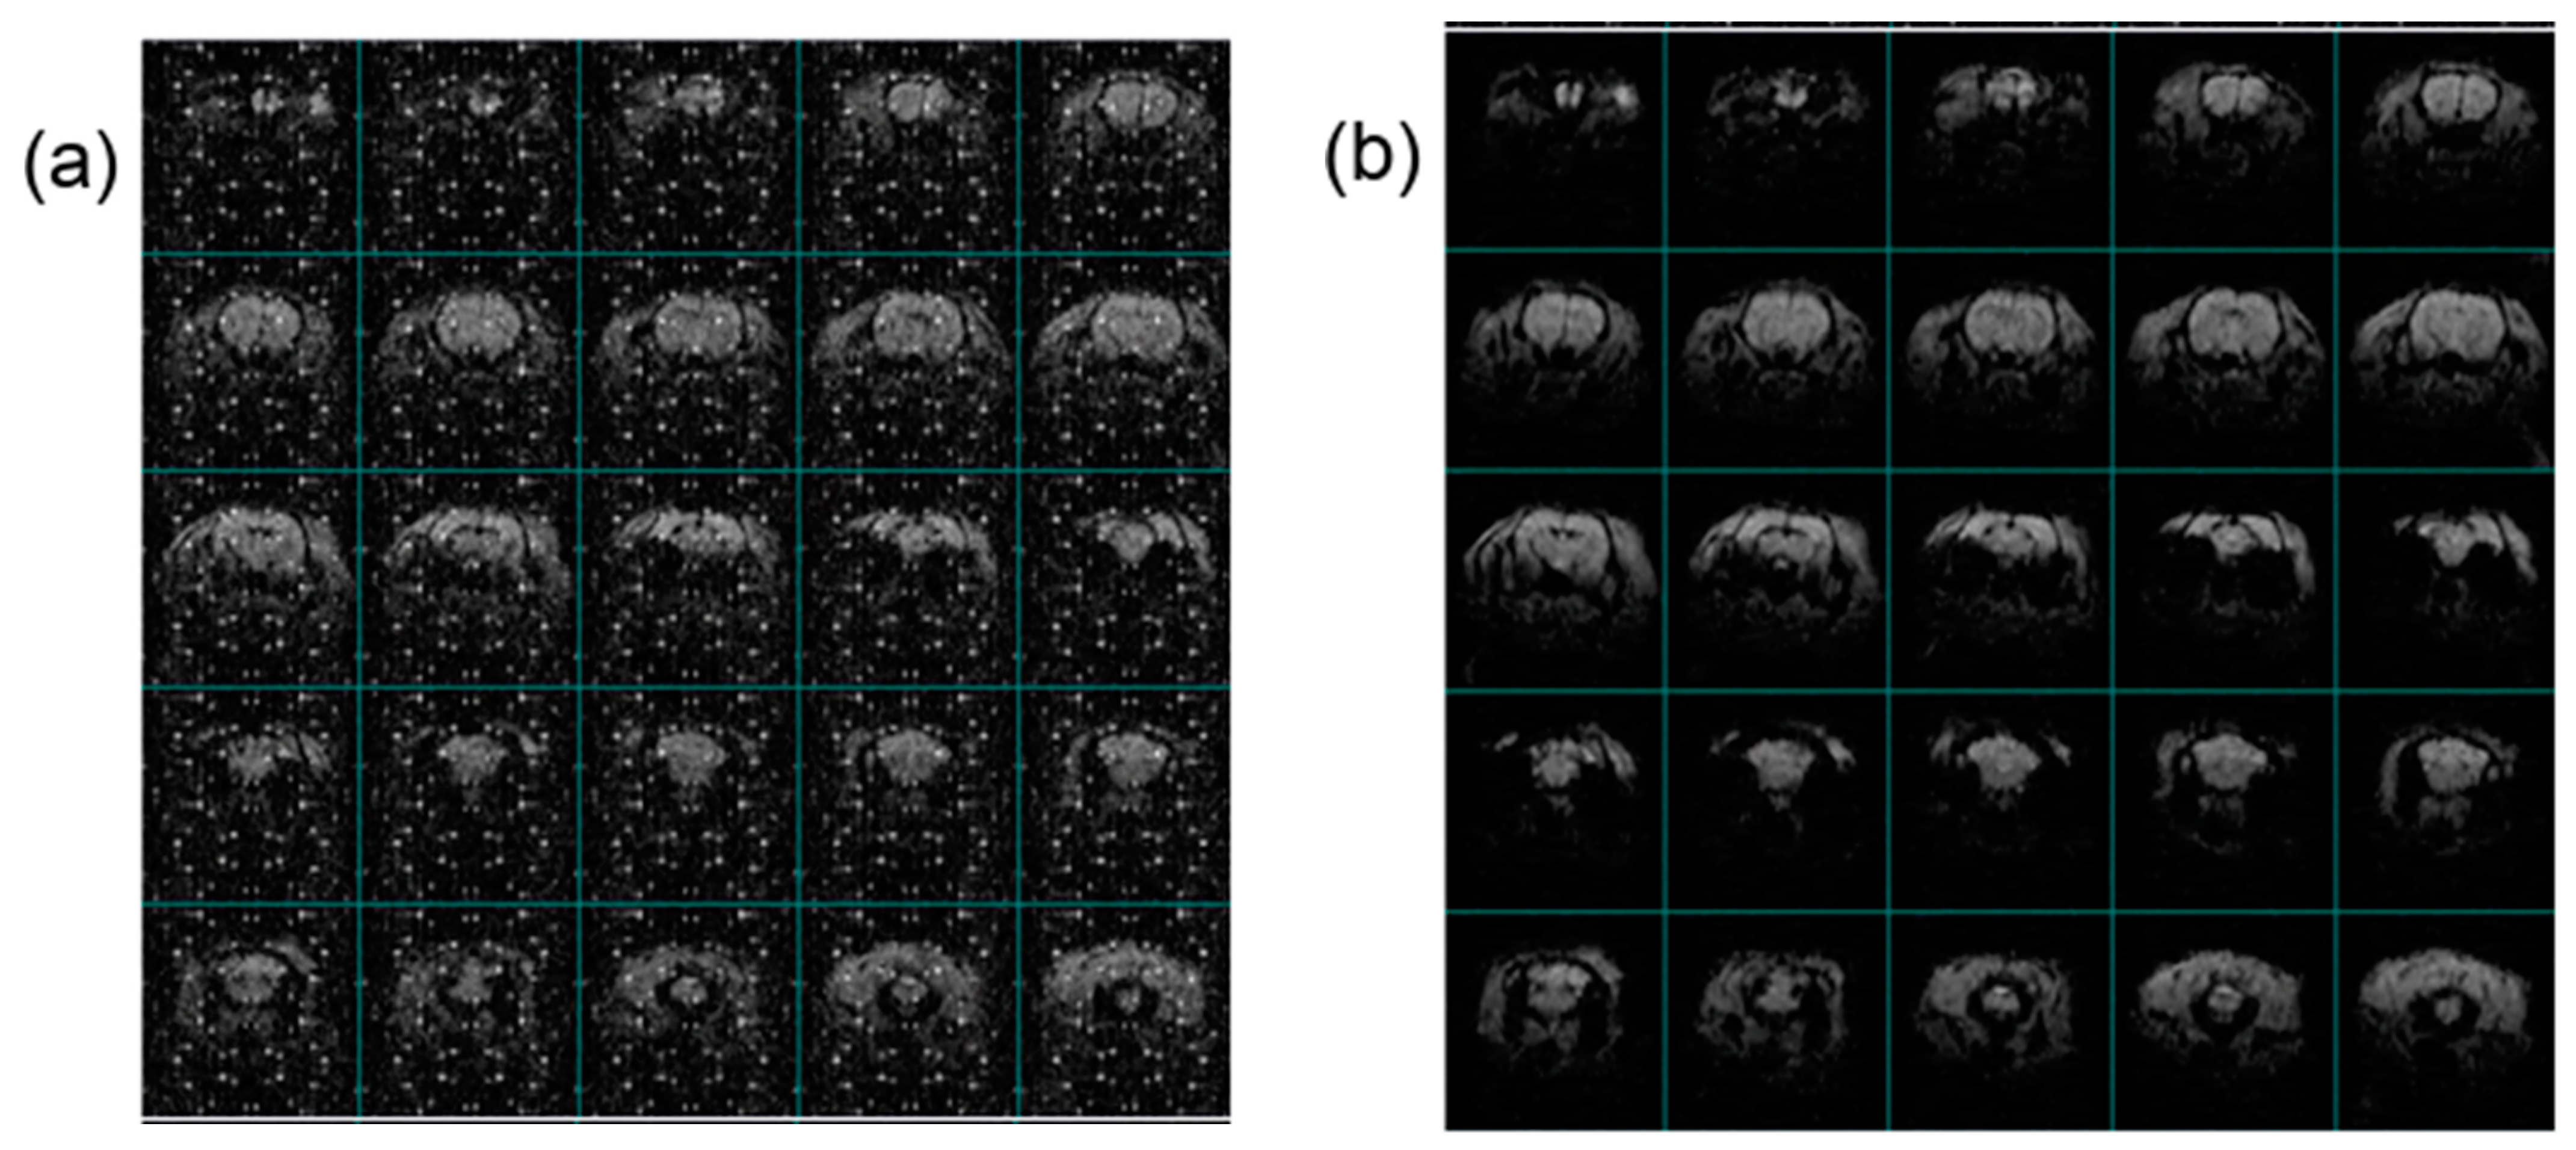
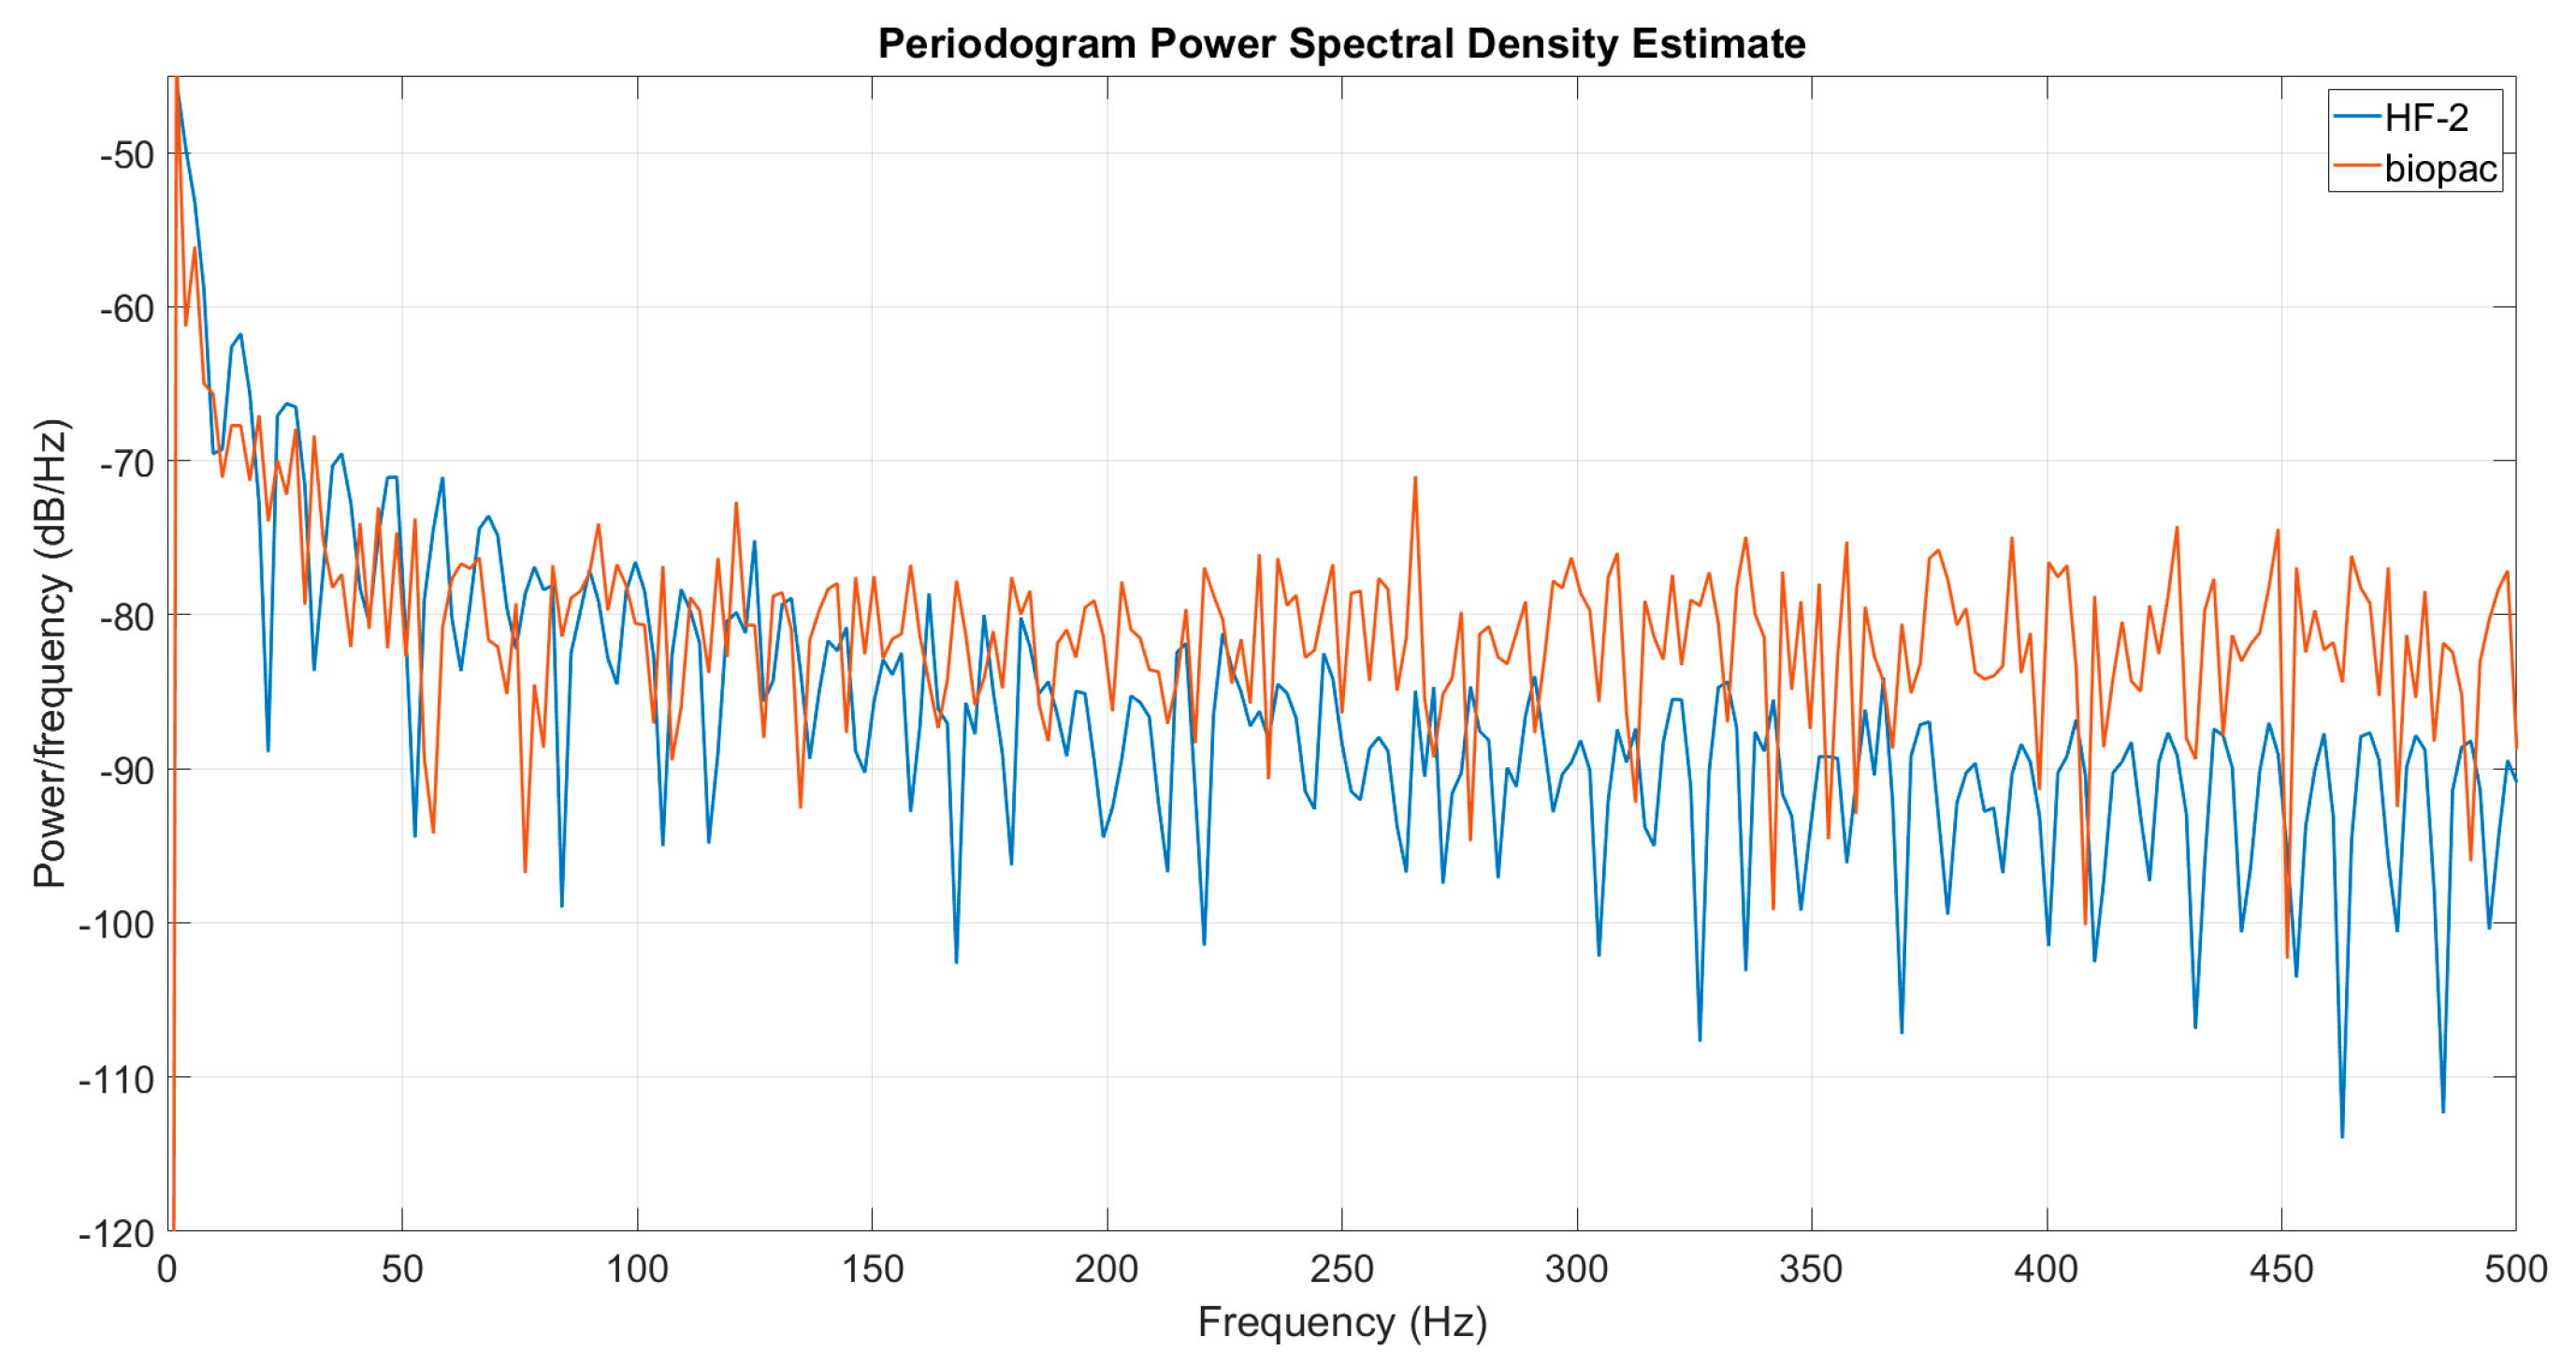
3.5. SNR Testing of HF-2
4. Discussion
4.1. PTFOS
4.2. HF-2
4.3. Limitations
4.4. Future Work
5. Conclusions
Author Contributions
Funding
Institutional Review Board Statement
Informed Consent Statement
Data Availability Statement
Conflicts of Interest
References
- Bonmassar, G.; Hadjikhani, N.; Ives, J.R.; Hinton, D.; Belliveau, J.W. Influence of EEG electrodes on the BOLD fMRI signal. Hum. Brain Mapp. 2001, 14, 108–115. [Google Scholar] [CrossRef] [PubMed]
- Ahmadi, E.; Katnani, H.A.; Besheli, L.D.; Gu, Q.; Atefi, R.; Villeneuve, M.Y.; Eskandar, E.; Lev, M.H.; Golby, A.J.; Gupta, R.; et al. An Electrocorticography Grid with Conductive Nanoparticles in a Polymer Thick Film on an Organic Substrate Improves CT and MR Imaging. Radiology 2016, 280, 595–601. [Google Scholar] [CrossRef] [PubMed]
- Levitt, J.; van der Kouwe, A.; Jeong, H.; Lewis, L.D.; Bonmassar, G. The MotoNet: A 3 Tesla MRI-Conditional EEG Net with Embedded Motion Sensors. Sensors 2023, 23, 3539. [Google Scholar] [CrossRef] [PubMed]
- Poulsen, C.; Wakeman, D.G.; Atefi, S.R.; Luu, P.; Konyn, A.; Bonmassar, G. Polymer thick film technology for improved simultaneous dEEG/MRI recording: Safety and MRI data quality. Magn. Reson. Med. 2017, 77, 895–903. [Google Scholar] [CrossRef] [PubMed]
- Vasios, C.E.; Angelone, L.M.; Purdon, P.L.; Ahveninen, J.; Belliveau, J.W.; Bonmassar, G. EEG/(f)MRI measurements at 7 Tesla using a new EEG cap (“InkCap”). Neuroimage 2006, 33, 1082–1092. [Google Scholar] [CrossRef] [PubMed]
- Hendrick, R.E.; Russ, P.D. MRI: Principles and Artifacts; Simon, H., Ed.; The Raven MRI Teaching File; Raven Press: New York, NY, USA, 1993; Volume XV, p. 304. [Google Scholar]
- Giorgio, B.; Hernan, M. An absorbable ECoG System Compatible to MRI. In Proceedings of the International Conference on Electromagnetics in Advanced Applications and IEEE Topical Conference on Antennas and Propagation in Wireless Communications (ICEAA-IEEE APWC), Lisbon, Portugal, 2–6 September 2024. [Google Scholar]
- Angelone, L.; Bonmassar, G.; Makris, N.; Wald, L.; Vasios, C. Effect of transmit array phase relationship on local Specific Absorption Rate (SAR). In Proceedings of the ISMRM Fourteenth Scientific Meeting, Seattle, WA, USA, 6–12 May 2024. [Google Scholar]
- Sun, F.T.; Morrell, M.J. Closed-loop neurostimulation: The clinical experience. Neurotherapeutics 2014, 11, 553–563. [Google Scholar] [CrossRef] [PubMed]
- DiLorenzo, D.J.; Mangubat, E.Z.; Rossi, M.A.; Byrne, R.W. Chronic unlimited recording electrocorticography-guided resective epilepsy surgery: Technology-enabled enhanced fidelity in seizure focus localization with improved surgical efficacy. J. Neurosurg. 2014, 120, 1402–1414. [Google Scholar] [CrossRef] [PubMed]
- Duncan, D.; Duckrow, R.B.; Pincus, S.M.; Goncharova, I.; Hirsch, L.J.; Spencer, D.D.; Coifman, R.R.; Zaveri, H.P. Intracranial EEG evaluation of relationship within a resting state network. Clin. Neurophysiol. 2013, 124, 1943–1951. [Google Scholar] [CrossRef] [PubMed]
- Schalk, G.; Leuthardt, E.C. Brain-computer interfaces using electrocorticographic signals. IEEE Rev. Biomed. Eng. 2011, 4, 140–154. [Google Scholar] [CrossRef] [PubMed]
- Allen, P.J.; Polizzi, G.; Krakow, K.; Fish, D.R.; Lemieux, L. Identification of EEG events in the MR scanner: The problem of pulse artifact and a method for its subtraction. Neuroimage 1998, 8, 229–239. [Google Scholar] [CrossRef] [PubMed]
- Garreffa, G.; Bianciardi, M.; Hagberg, G.E.; Macaluso, E.; Marciani, M.G.; Maraviglia, B.; Abbafati, M.; Carnì, M.; Bruni, I.; Bianchi, L. Simultaneous EEG-fMRI acquisition: How far is it from being a standardized technique? Magn. Reson. Imaging 2004, 22, 1445–1455. [Google Scholar] [CrossRef] [PubMed]
- I Goldman, R.; Stern, J.M.; Engel, J.; Cohen, M.S. Acquiring simultaneous EEG and functional MRI. Clin. Neurophysiol. 2000, 111, 1974–1980. [Google Scholar] [CrossRef] [PubMed]
- Mirsattari, S.M.; Ives, J.R.; Bihari, F.; Leung, L.S.; Menon, R.S.; Bartha, R. Real-time display of artifact-free electroencephalography during functional magnetic resonance imaging and magnetic resonance spectroscopy in an animal model of epilepsy. Magn. Reson. Med. 2005, 53, 456–464. [Google Scholar] [CrossRef] [PubMed]
- Logothetis, N.; Pauls, J.; Augath, M.; Trinath, T.; Oeltermann, A. Neurophysiological investigation of the basis of the fMRI signal. Nature 2001, 412, 150–157. [Google Scholar] [CrossRef] [PubMed]
- Cao, J.; Wang, X.; Lu, K.-H.; Tan, Z.; Phillips, R.; Jaffey, D.; Wo, J.; Mosier, K.; Powley, T.; Liu, Z. SPARC: Brain-stomach Synchrony Observed with Functional Magnetic Resonance Imaging and Electrogastrogram in Rats. FASEB J. 2020, 34 (Suppl. S1), 1. [Google Scholar] [CrossRef]
- RD-2000, I. Available online: http://intantech.com/files/Intan_RHD2000_series_datasheet.pdf (accessed on 1 August 2024).
- Customers, I.L.o. Available online: http://intantech.com/RHD_headstages.html (accessed on 1 August 2024).
- Purdon, P.L.; Millan, H.; Fuller, P.L.; Bonmassar, G. An open-source hardware and software system for acquisition and real-time processing of electrophysiology during high field MRI. J. Neurosci. Methods 2008, 175, 165–186. [Google Scholar] [CrossRef] [PubMed]
- Garreffa, G.; Carnì, M.; Gualniera, G.; Ricci, G.; Bozzao, L.; De Carli, D.; Morasso, P.; Pantano, P.; Colonnese, C.; Roma, V.; et al. Real-time MR artifacts filtering during continuous EEG/fMRI acquisition. Magn. Reson. Imaging 2003, 21, 1175–1189. [Google Scholar] [CrossRef] [PubMed]


| FOV (mm × mm) | Dimension | Resolution (mm × mm) | TR (ms) | TE (ms) | Slices | |
|---|---|---|---|---|---|---|
| Proton Density (PD) | 35 × 35 | 128 × 128 | 0.273 × 0.273 | 2192 | 8/52 | 22 |
| T2-Weighted (T2W) | 35 × 35 | 128 × 128 | 0.273 × 0.273 | 2192 | 8/52 | 22 |
| T1-Weighted TSE | 35 × 35 | 128 × 128 | 0.273 × 0.273 | 1500 | 7.5 | 22 |
| FLASH | 35 × 35 | 128 × 128 | 0.273 × 0.273 | 326 | 7.5 | 22 |
| UTE | 35 × 35 | 128 × 128 | 0.273 × 0.273 | 30 | 0.457 | 22 |
| DTI | 35 × 35 | 96 × 96 | 0.36 × 0.36 | 1416 | 23.9 | 44 |
| fMRI | 35 × 35 | 92 × 92 | 0.38 × 0.38 | 500 | 12.11 | 18 |
| Command | Description | Reply |
|---|---|---|
| Set Frequency | Sets the sampling rate for the data acquisition | Ack/Nak |
| Select Bank Num | Selects the bank of 8 channels to acquire | Ack/Nak |
| Reset Sync Cnt | Resets the sync pulse counter on the FPGA to 0 | Ack/Nak |
| Start/Stop | Start/Stop the TCP/IP data packet transfer from the RT to the Host | Ack/Nak |
| RT Status | Returns the status of the DMA FIFO (on/off), clock source (internal/external), CLK rate, serial port status | Status (see Figure 6c) |
| Bytes Indices | Description (message type 100 or command/response) |
| 0–3 | Fixed value of ‘100’ that identifies the message type |
| 4–7 | Length of payload |
| 8+ | Payload; command settings/data |
| Byte Indices | Description (Message type 101 or a data message) |
| 0–3 | Fixed value of ‘101’ that identifies the message type |
| 4–7 | Length of payload |
| 8–11 | Sequence Number |
| 12–15 | Sync Counter Value |
| 16+ | Payload, 600 or 1400 scans of long integer (4 bytes or 32 bits to send 24 bits) sending ADC 8 channels plus 1 trigger channel in a round-robin format (0, 1, 2, 3, 4, 5, 6, 7, 8, 0, 1, 2, 3, 4, 5, 6, 7, 8, etc.) |
| Brain | Whole Imaging Volume | |
|---|---|---|
| Sham (Gelfilm) | 15.25 ± 5.63 | 11.77 ± 5.28 |
| PTFOS w connector | 18.66 ± 6.42 | 15.08 ± 5.54 |
| PTFOS w/o connector | 13.46 ± 5.28 | 12.19 ± 4.89 |
| Manufacture/Product | # of Channels | Amplifier and A/D Chip | # of Bits (Resolution) | Synchronization with MRI Clock (10 MHz) | MRI Compatibility |
|---|---|---|---|---|---|
| Bmseed/ECoG Electrode Array | 65 | Intan | 16 | No | No |
| Cambridgeneurotech/Mini-Amp-64 | 64 | Intan | 16 | No | No |
| RippleNeuro/Nano-2 | 32 | Intan | 16 | No | No |
| atlasneuro/AtlasNeuro | 64 | Intan | 16 | No | No |
| NeuroNexus/MRI compatible | 64 | Intan | 16 | No | No, only the electrodes |
| plexon/OmniPlex System | 64 | Intan | 16 | No | No |
| microprobes/Micro-electrode | 32 | Intan | 16 | No | No |
| Blackrockmicro/MagRes headstage | 16 | Intan | 16 | No | Yes |
| TDT/Tucker-Davis Technologies | 64 | Intan | 22 | No | Yes (up to 14 T) |
| MGH HF-1 [21] | 32 | ADS1254 | 24 | Yes | Yes (up to 7 T) |
| eMRiSystems/HF-2 (benchmark) | 32 | ADS1298 | 24 | Yes | Yes (up to 9.4 T) |
Disclaimer/Publisher’s Note: The statements, opinions and data contained in all publications are solely those of the individual author(s) and contributor(s) and not of MDPI and/or the editor(s). MDPI and/or the editor(s) disclaim responsibility for any injury to people or property resulting from any ideas, methods, instructions or products referred to in the content. |
© 2024 by the authors. Licensee MDPI, Basel, Switzerland. This article is an open access article distributed under the terms and conditions of the Creative Commons Attribution (CC BY) license (https://creativecommons.org/licenses/by/4.0/).
Share and Cite
Chen, Y.I.; Ay, I.; Marturano, F.; Fuller, P.; Millan, H.; Bonmassar, G. A Polymer Thick Film on an Organic Substrate Grid Electrode and an Open-Source Recording System for UHF MRI: An Imaging Study. Sensors 2024, 24, 5214. https://doi.org/10.3390/s24165214
Chen YI, Ay I, Marturano F, Fuller P, Millan H, Bonmassar G. A Polymer Thick Film on an Organic Substrate Grid Electrode and an Open-Source Recording System for UHF MRI: An Imaging Study. Sensors. 2024; 24(16):5214. https://doi.org/10.3390/s24165214
Chicago/Turabian StyleChen, Yinching Iris, Ilknur Ay, Francesca Marturano, Peter Fuller, Hernan Millan, and Giorgio Bonmassar. 2024. "A Polymer Thick Film on an Organic Substrate Grid Electrode and an Open-Source Recording System for UHF MRI: An Imaging Study" Sensors 24, no. 16: 5214. https://doi.org/10.3390/s24165214
APA StyleChen, Y. I., Ay, I., Marturano, F., Fuller, P., Millan, H., & Bonmassar, G. (2024). A Polymer Thick Film on an Organic Substrate Grid Electrode and an Open-Source Recording System for UHF MRI: An Imaging Study. Sensors, 24(16), 5214. https://doi.org/10.3390/s24165214