2.1. Experimental Design
2.1.1. Subjects and Experimental Environment
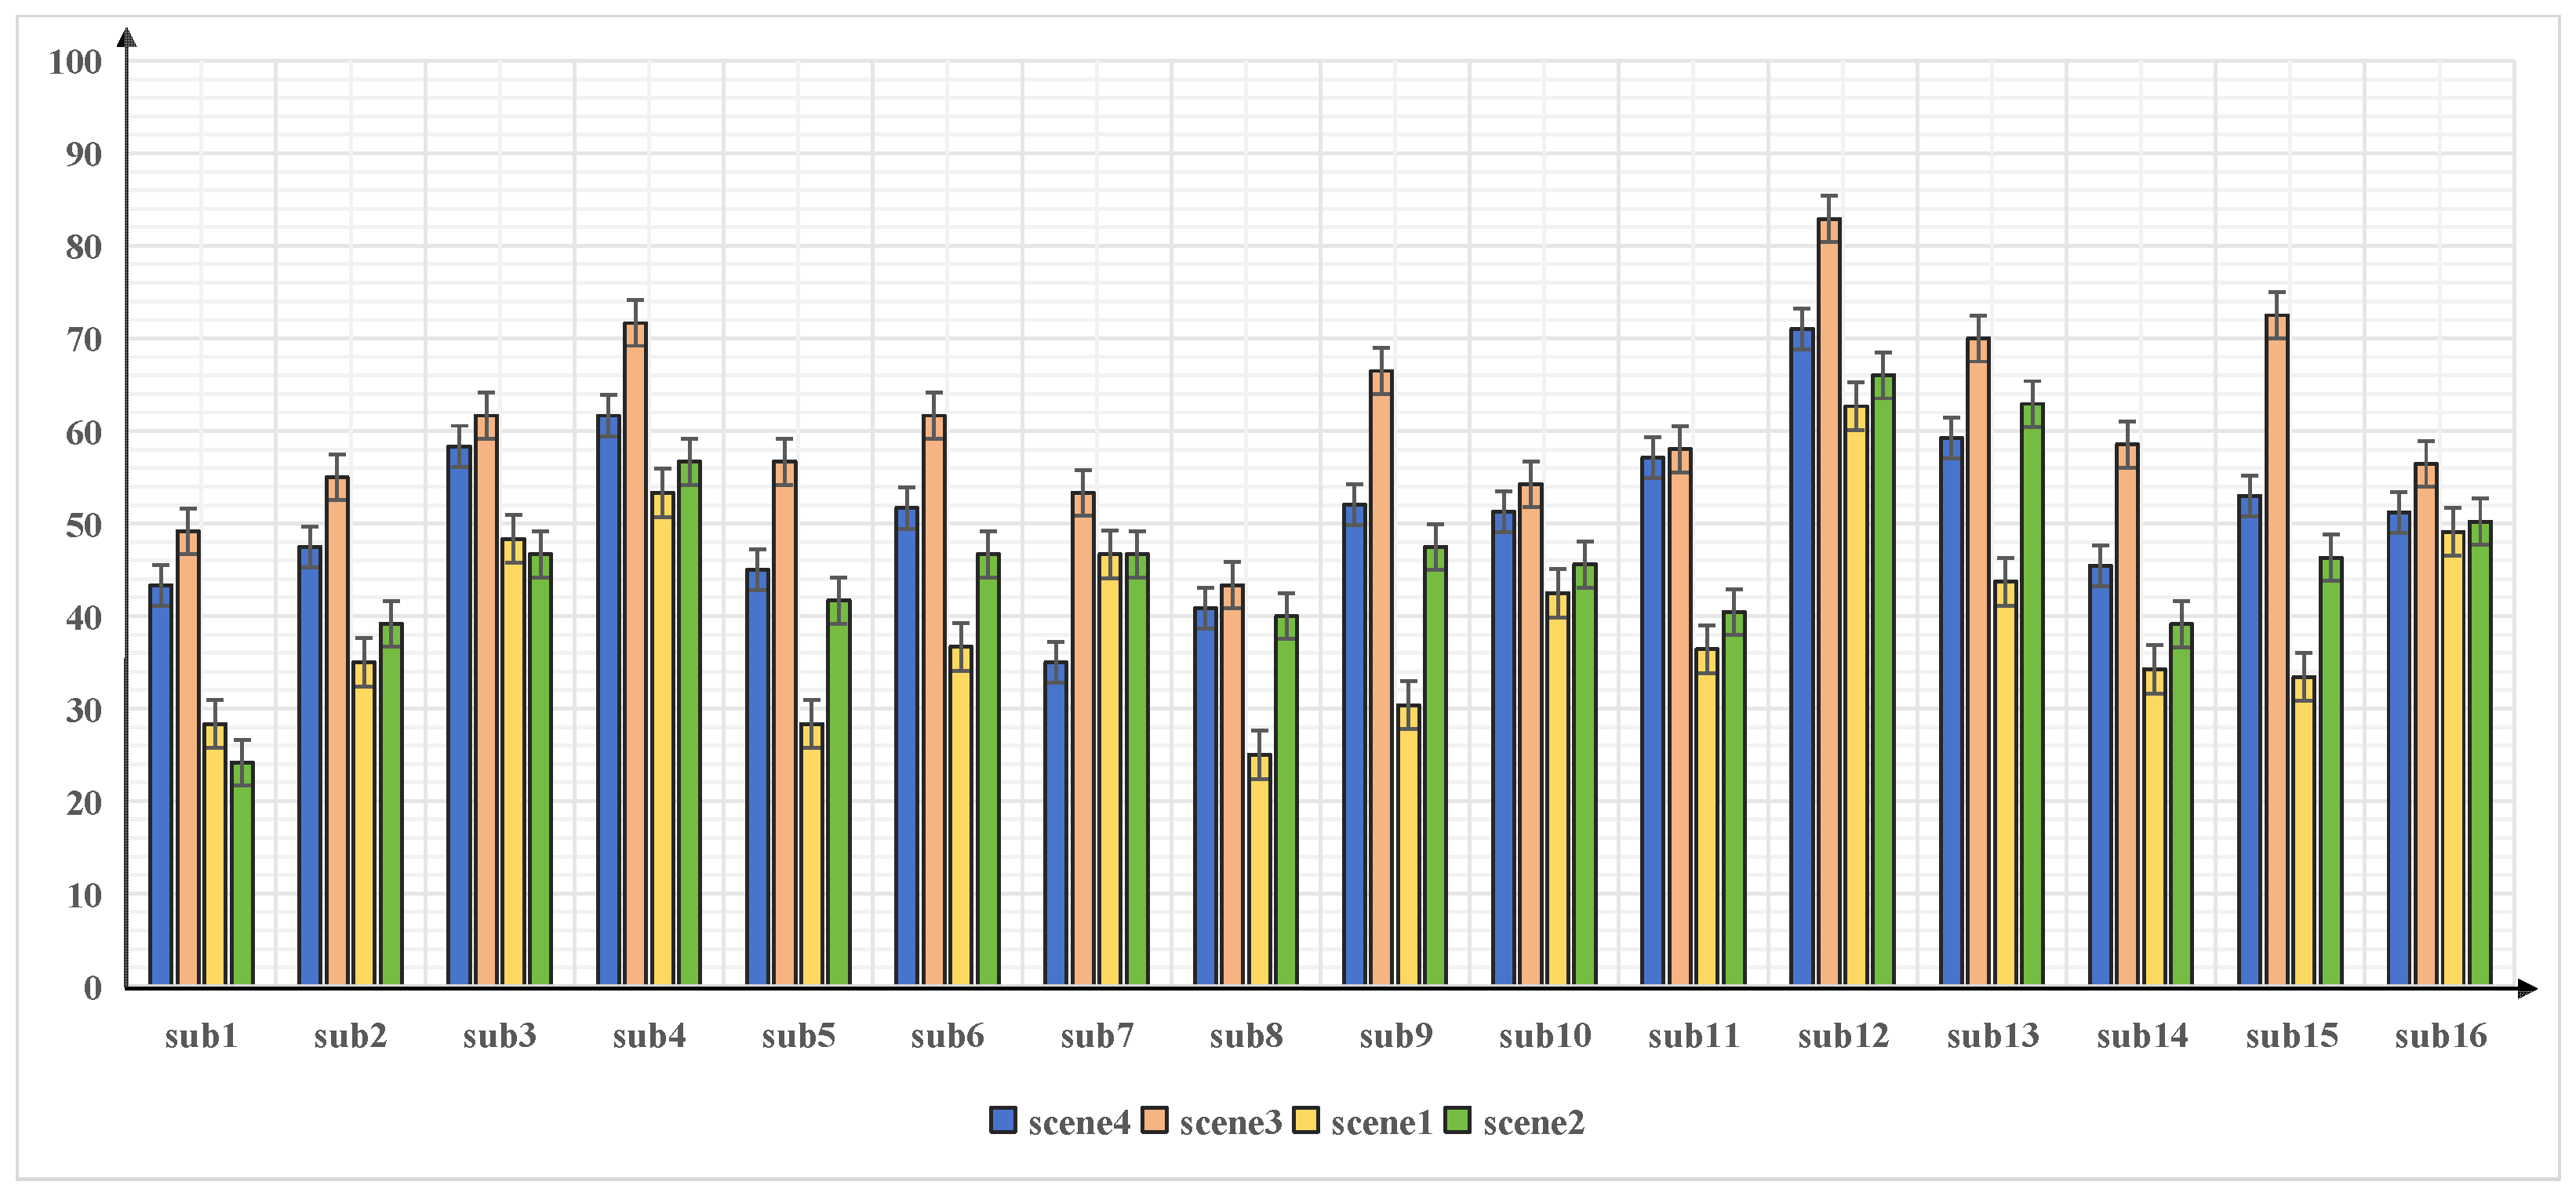
The study involved sixteen seasoned controllers, each possessing a minimum of three years of experience in control systems and ranging in age from 27 to 37. In the experiment, a control simulator was employed to manage workload. Participants were engaged in control activities within simulated environments featuring varying degrees of heavy traffic. To gather EEG data, a 64-electrode Borecon NeuSen W-series wireless EEG acquisition system was utilized.
2.1.2. Experimental Scene Selection
The mental workload of air traffic controllers is heavily influenced by the volume of traffic, which is measured by the number of aircraft requiring handling within a specific time frame, including both landings and take-offs. With increased traffic, controllers are tasked with managing a larger number of aircraft simultaneously to ensure their safe and efficient operation in the air and on the ground. This heightened workload entails a wide range of responsibilities, including assigning aircraft to appropriate routes and altitudes, coordinating and monitoring communications, and overseeing traffic flow. These responsibilities demand continuous vigilance over multiple aircraft and the ability to make timely and accurate decisions and instructions, all of which contribute to the mental workload and stress experienced by controllers.
In addition to managing traffic flow, various abnormal situations such as equipment malfunctions, foreign object debris on runways, specific operational demands of airports, and incident management can also significantly impact the workload of air traffic controllers. These diverse scenarios, collectively referred to as abnormal situations, require information processing, decision-making, and tailored guidance to ensure aviation safety, thereby placing additional strain on controllers and subjecting them to heightened psychological stress.
Given the aforementioned factors, a preliminary experiment was conducted to select four distinct and representative exercises on the control simulator before the main experiment. The workload for each exercise was categorized based on changes in traffic levels and the presence or absence of abnormal situations, resulting in classifications as lower load, higher load, overload, and abnormal situation scenes. Moreover, a resting state scene (labeled as Scene 0) was included to monitor the EEG data of controllers with their eyes closed. The specific scene settings are detailed in
Table 1. Furthermore, for the purposes of this study, an abnormal situation refers to the presence of foreign objects on the runway, and these labels will be utilized to classify the collected EEG data.
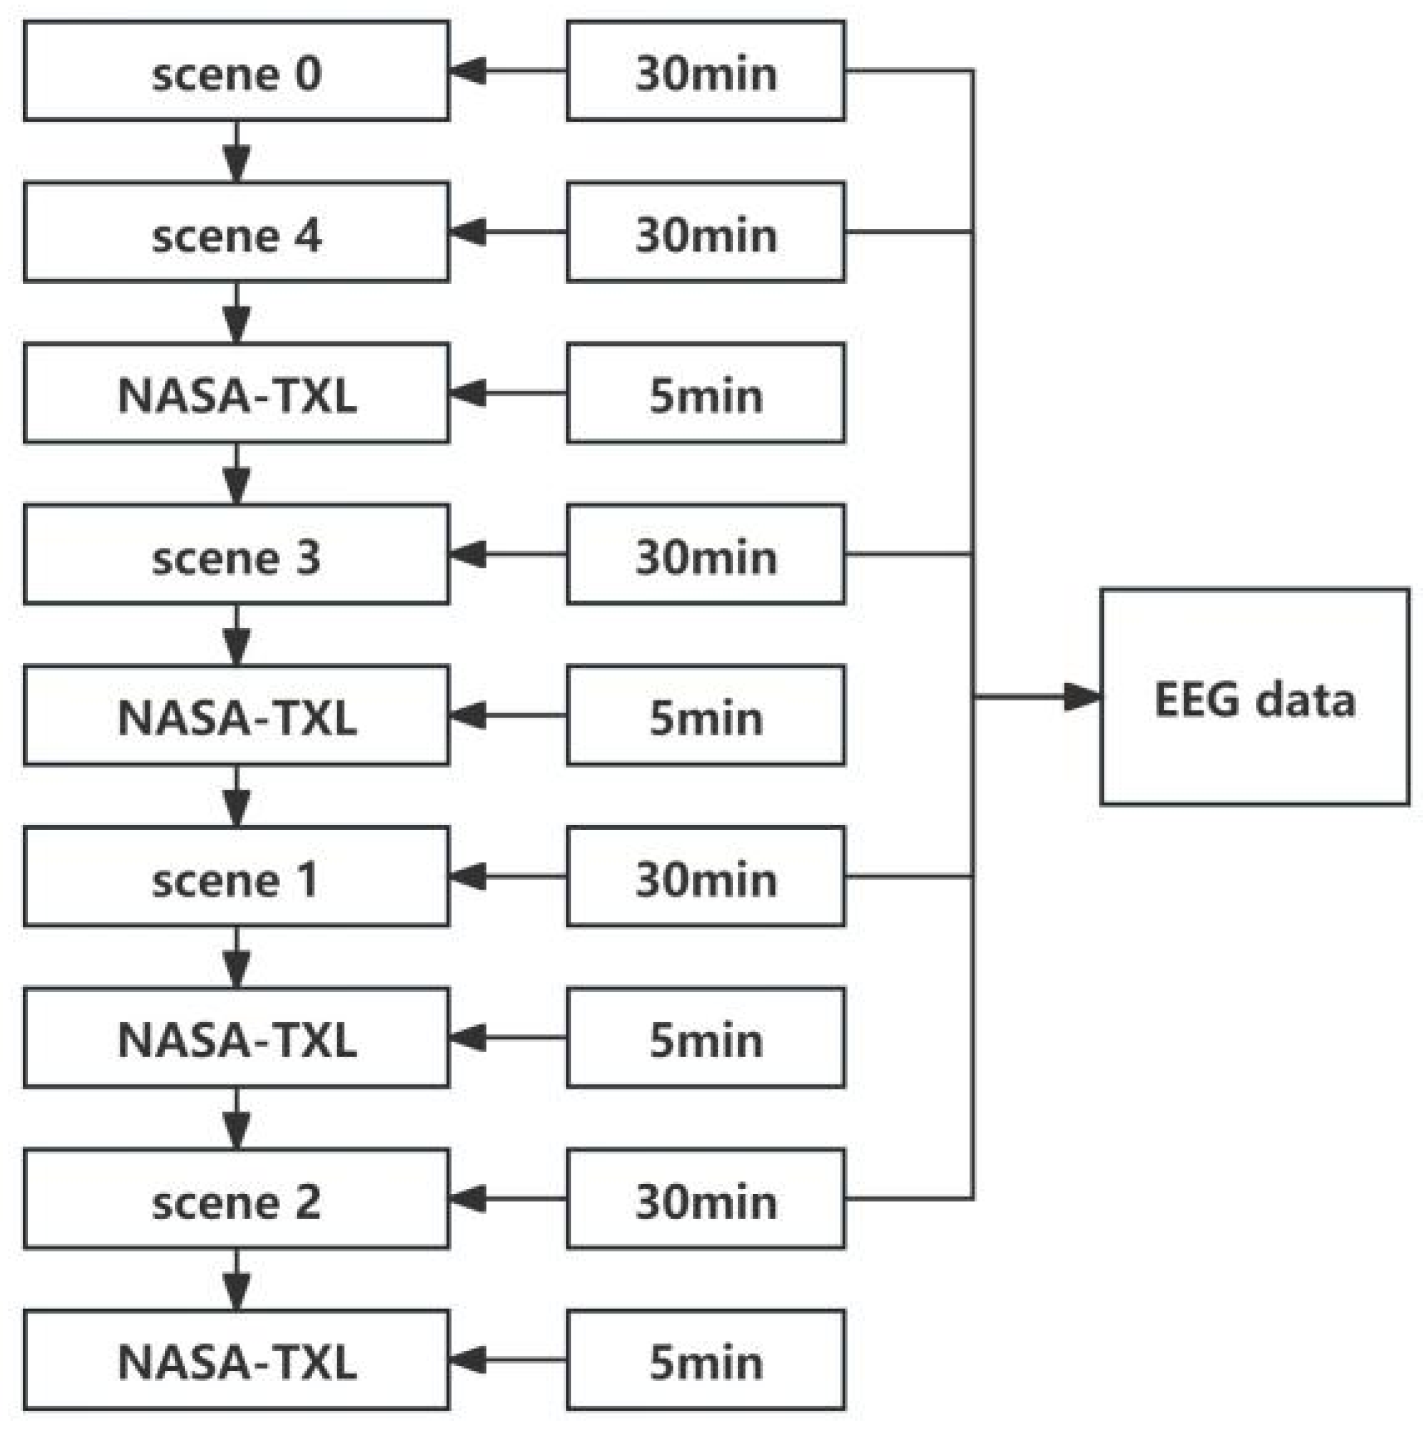
To determine the optimal sequence for each scene, preliminary experiments were conducted to compare the distinguishability of experimental data across different sequences, including “Scene 0–Scene 1–Scene 2–Scene 3–Scene 4”, “Scene 4–Scene 3–Scene 2–Scene 1–Scene 0”, and “Scene 0–Scene 3–Scene 2–Scene 1–Scene 4”. Upon analysis, it was found that the EEG data of the subjects exhibited the greatest distinguishability when presented in the order of “Scene 0–Scene 4–Scene 3–Scene 1–Scene 2”. As a result, subsequent experiments will be carried out in this specific order.
2.1.3. Experimental Procedure
During the experiments, EEG electrodes were positioned in accordance with the International 10–20 System, with a sampling frequency of 1000 Hz. Initially, the EEG data of each subject in the resting state with their eyes closed (scene 0) were collected before simulating the working state. After completing the NASA-TXL scale [
40] for this scene, the EEG data during the working state were then recorded. Each scene lasted for half an hour, and an additional five minutes were required to complete the NASA-TXL scale. Subjects were tasked with performing all exercises to ensure the comprehensive collection of intact EEG data and NASA-TXL subjective scale data. The detailed process is illustrated in
Figure 1.
2.2. Feature Extraction and Classification
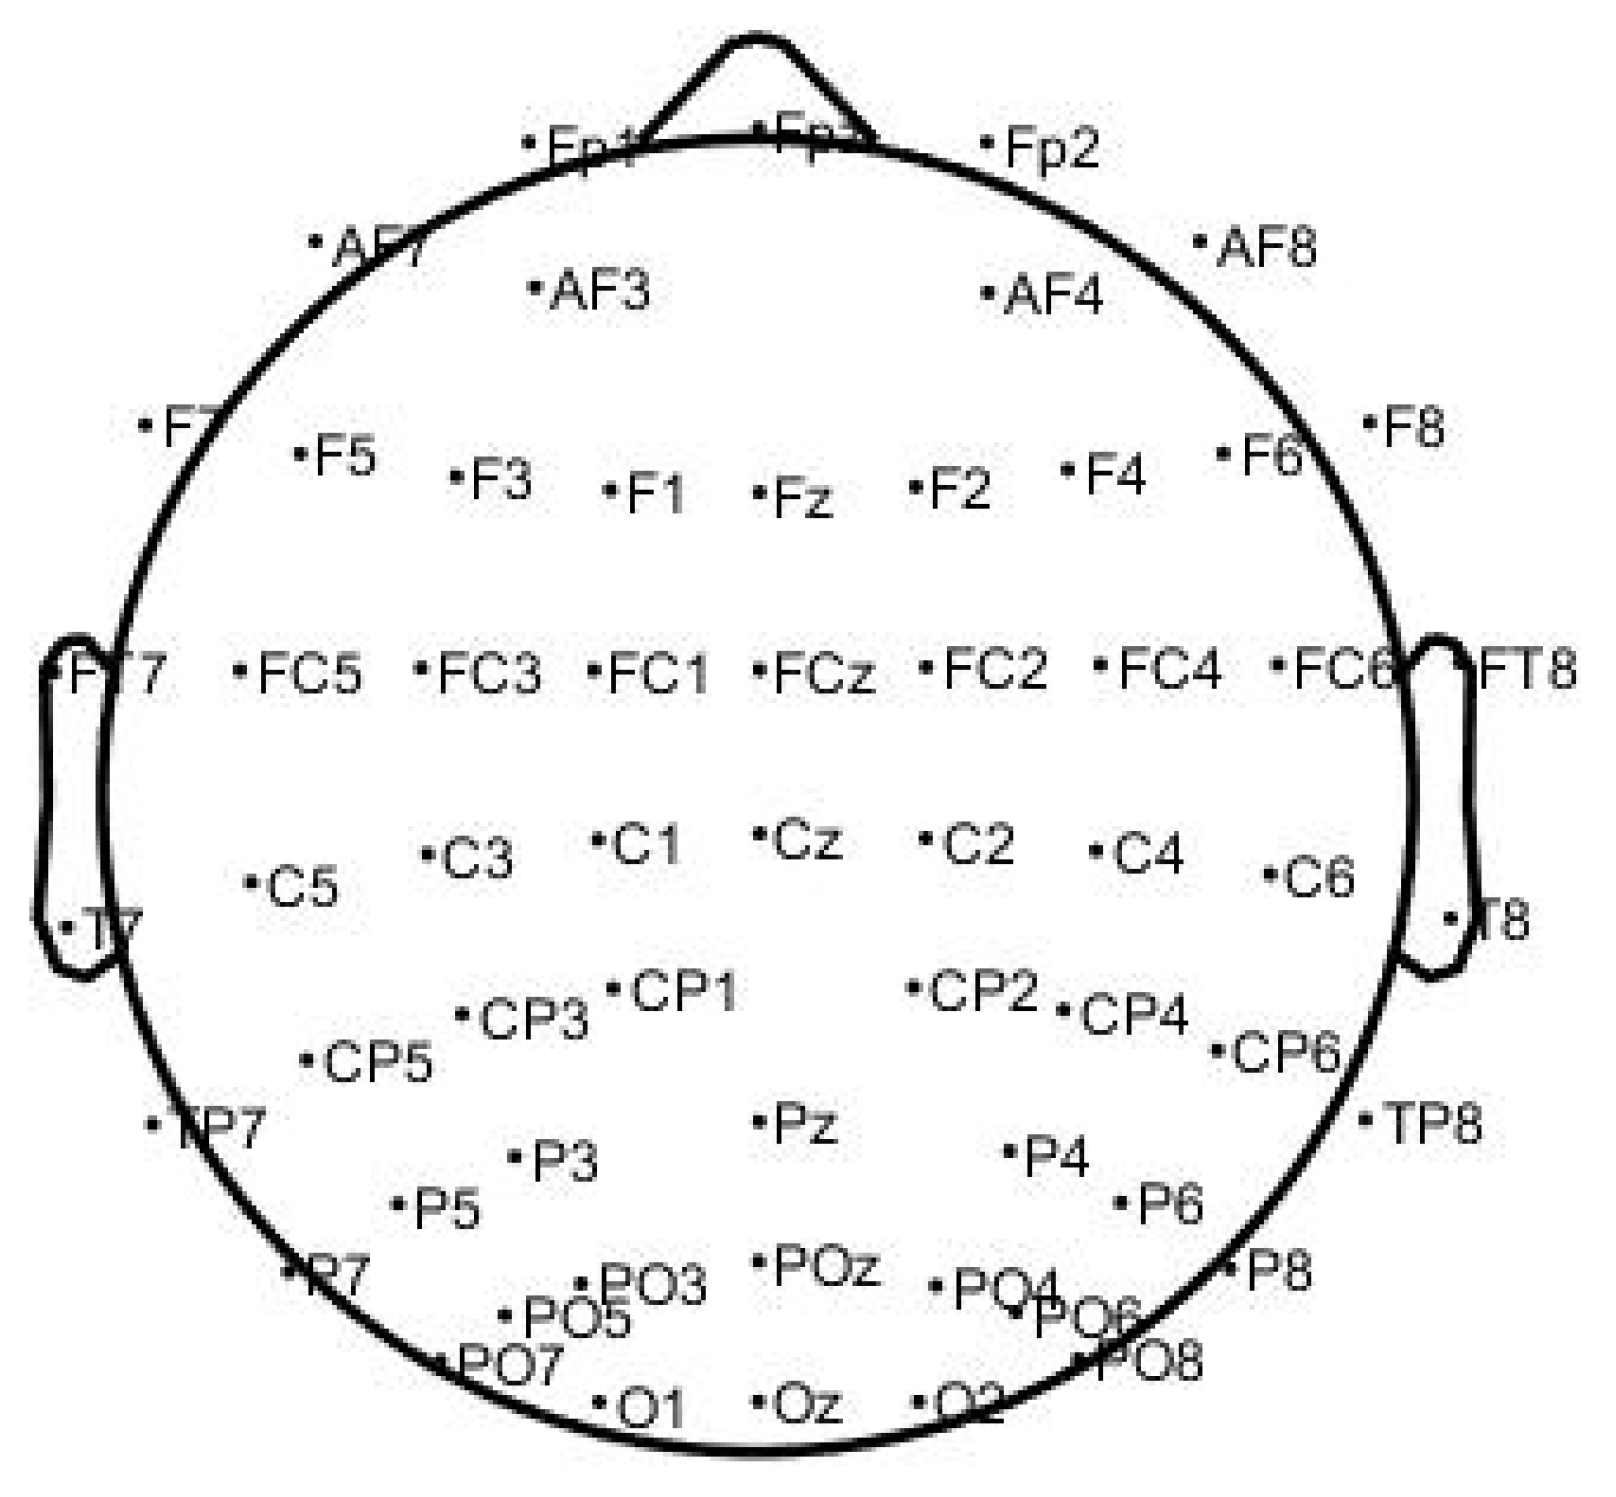
After completing the experiment, the NASA-TXL data and EEG data underwent processing for feature extraction and classification. Before analyzing the EEG data, several crucial preprocessing steps were conducted on the collected EEG data. First, unnecessary electrodes, such as ECG, HEOR, HROL, VEOU, etc., were removed, leaving 59 channels available for subsequent analysis.
After completing the experiment, the NASA-TXL data and EEG data underwent processing for feature extraction and classification. Prior to analyzing the EEG data, several essential preprocessing steps were taken to ensure data quality. This involved removing unnecessary electrodes, such as ECG, HEOR, HROL, and VEOU, leaving 59 channels available for subsequent analysis, as shown in
Figure 2.
To reduce noise and remove artifacts, a bandpass filter with a frequency range between 0.5 and 100 Hz was applied to each subject’s EEG signal. This filtering step aimed to retain relevant neural activity within desired frequency bands while attenuating noise and out-of-range frequencies.
Regarding re-referencing to the average, we added a zero-filled channel as the initial reference, calculated the average potential, and then subtracted it from all the channels [
41]. This way, the smallest eigenvalue of the data (after removing the ‘initial reference’) was about 10^0, which is very large compared with the limit of the effective rank, and ICA can work on full-ranked data. Subsequently, Independent Component Analysis (ICA) was used to decompose the EEG signal and identify and remove potential artifacts or noise components. The informax runica.m algorithm within MATLAB’s EEGLAB toolbox was used with default parameter settings.
Following ICA, additional artifact rejection steps were performed based on visual inspection and statistical criteria to ensure data quality. Any segments of the EEG signal contaminated by excessive noise, movement artifacts, or other disturbances were manually identified and removed from the analysis.
Upon completing these preprocessing steps, the clean EEG data were ready for feature extraction and subsequent classification analyses. The entire preprocessing pipeline was implemented using MATLAB’s EEGLAB, with careful monitoring and validation of all processing steps to ensure data reliability and validity.
Once the preprocessing was completed, the aim was to distinguish changes in brain activity of controllers under different workloads using the EEG power spectrum [
42,
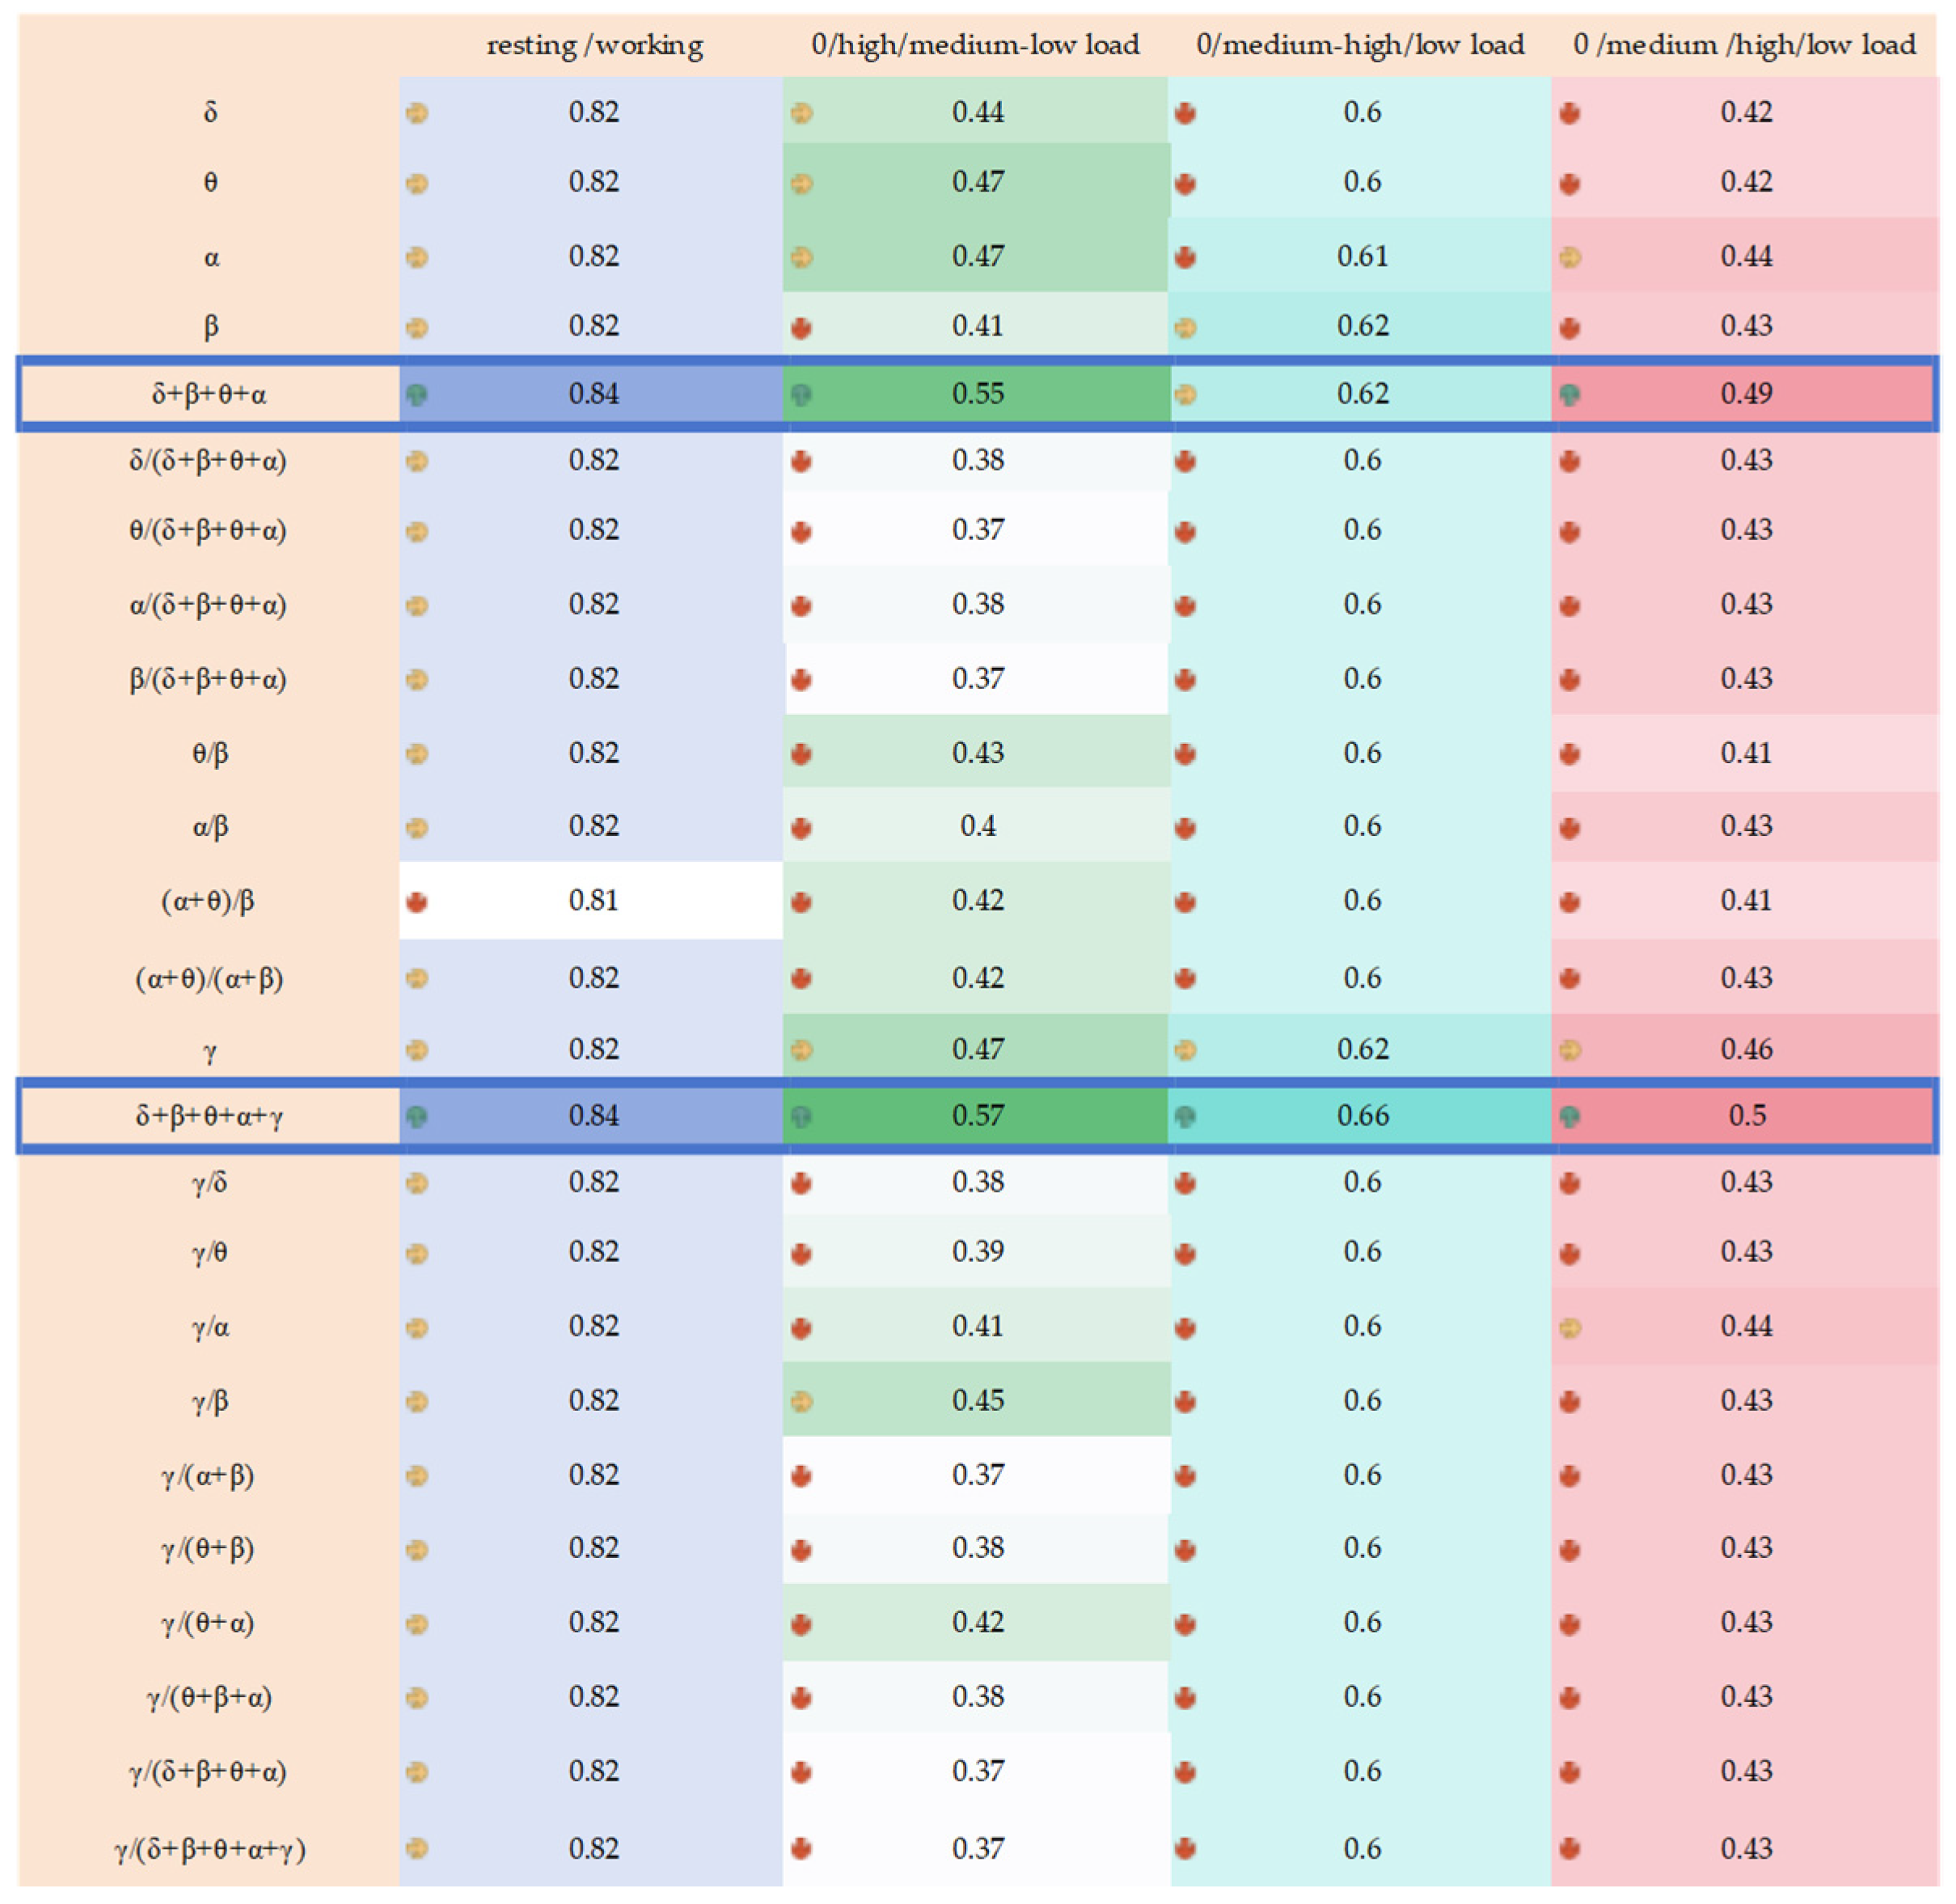
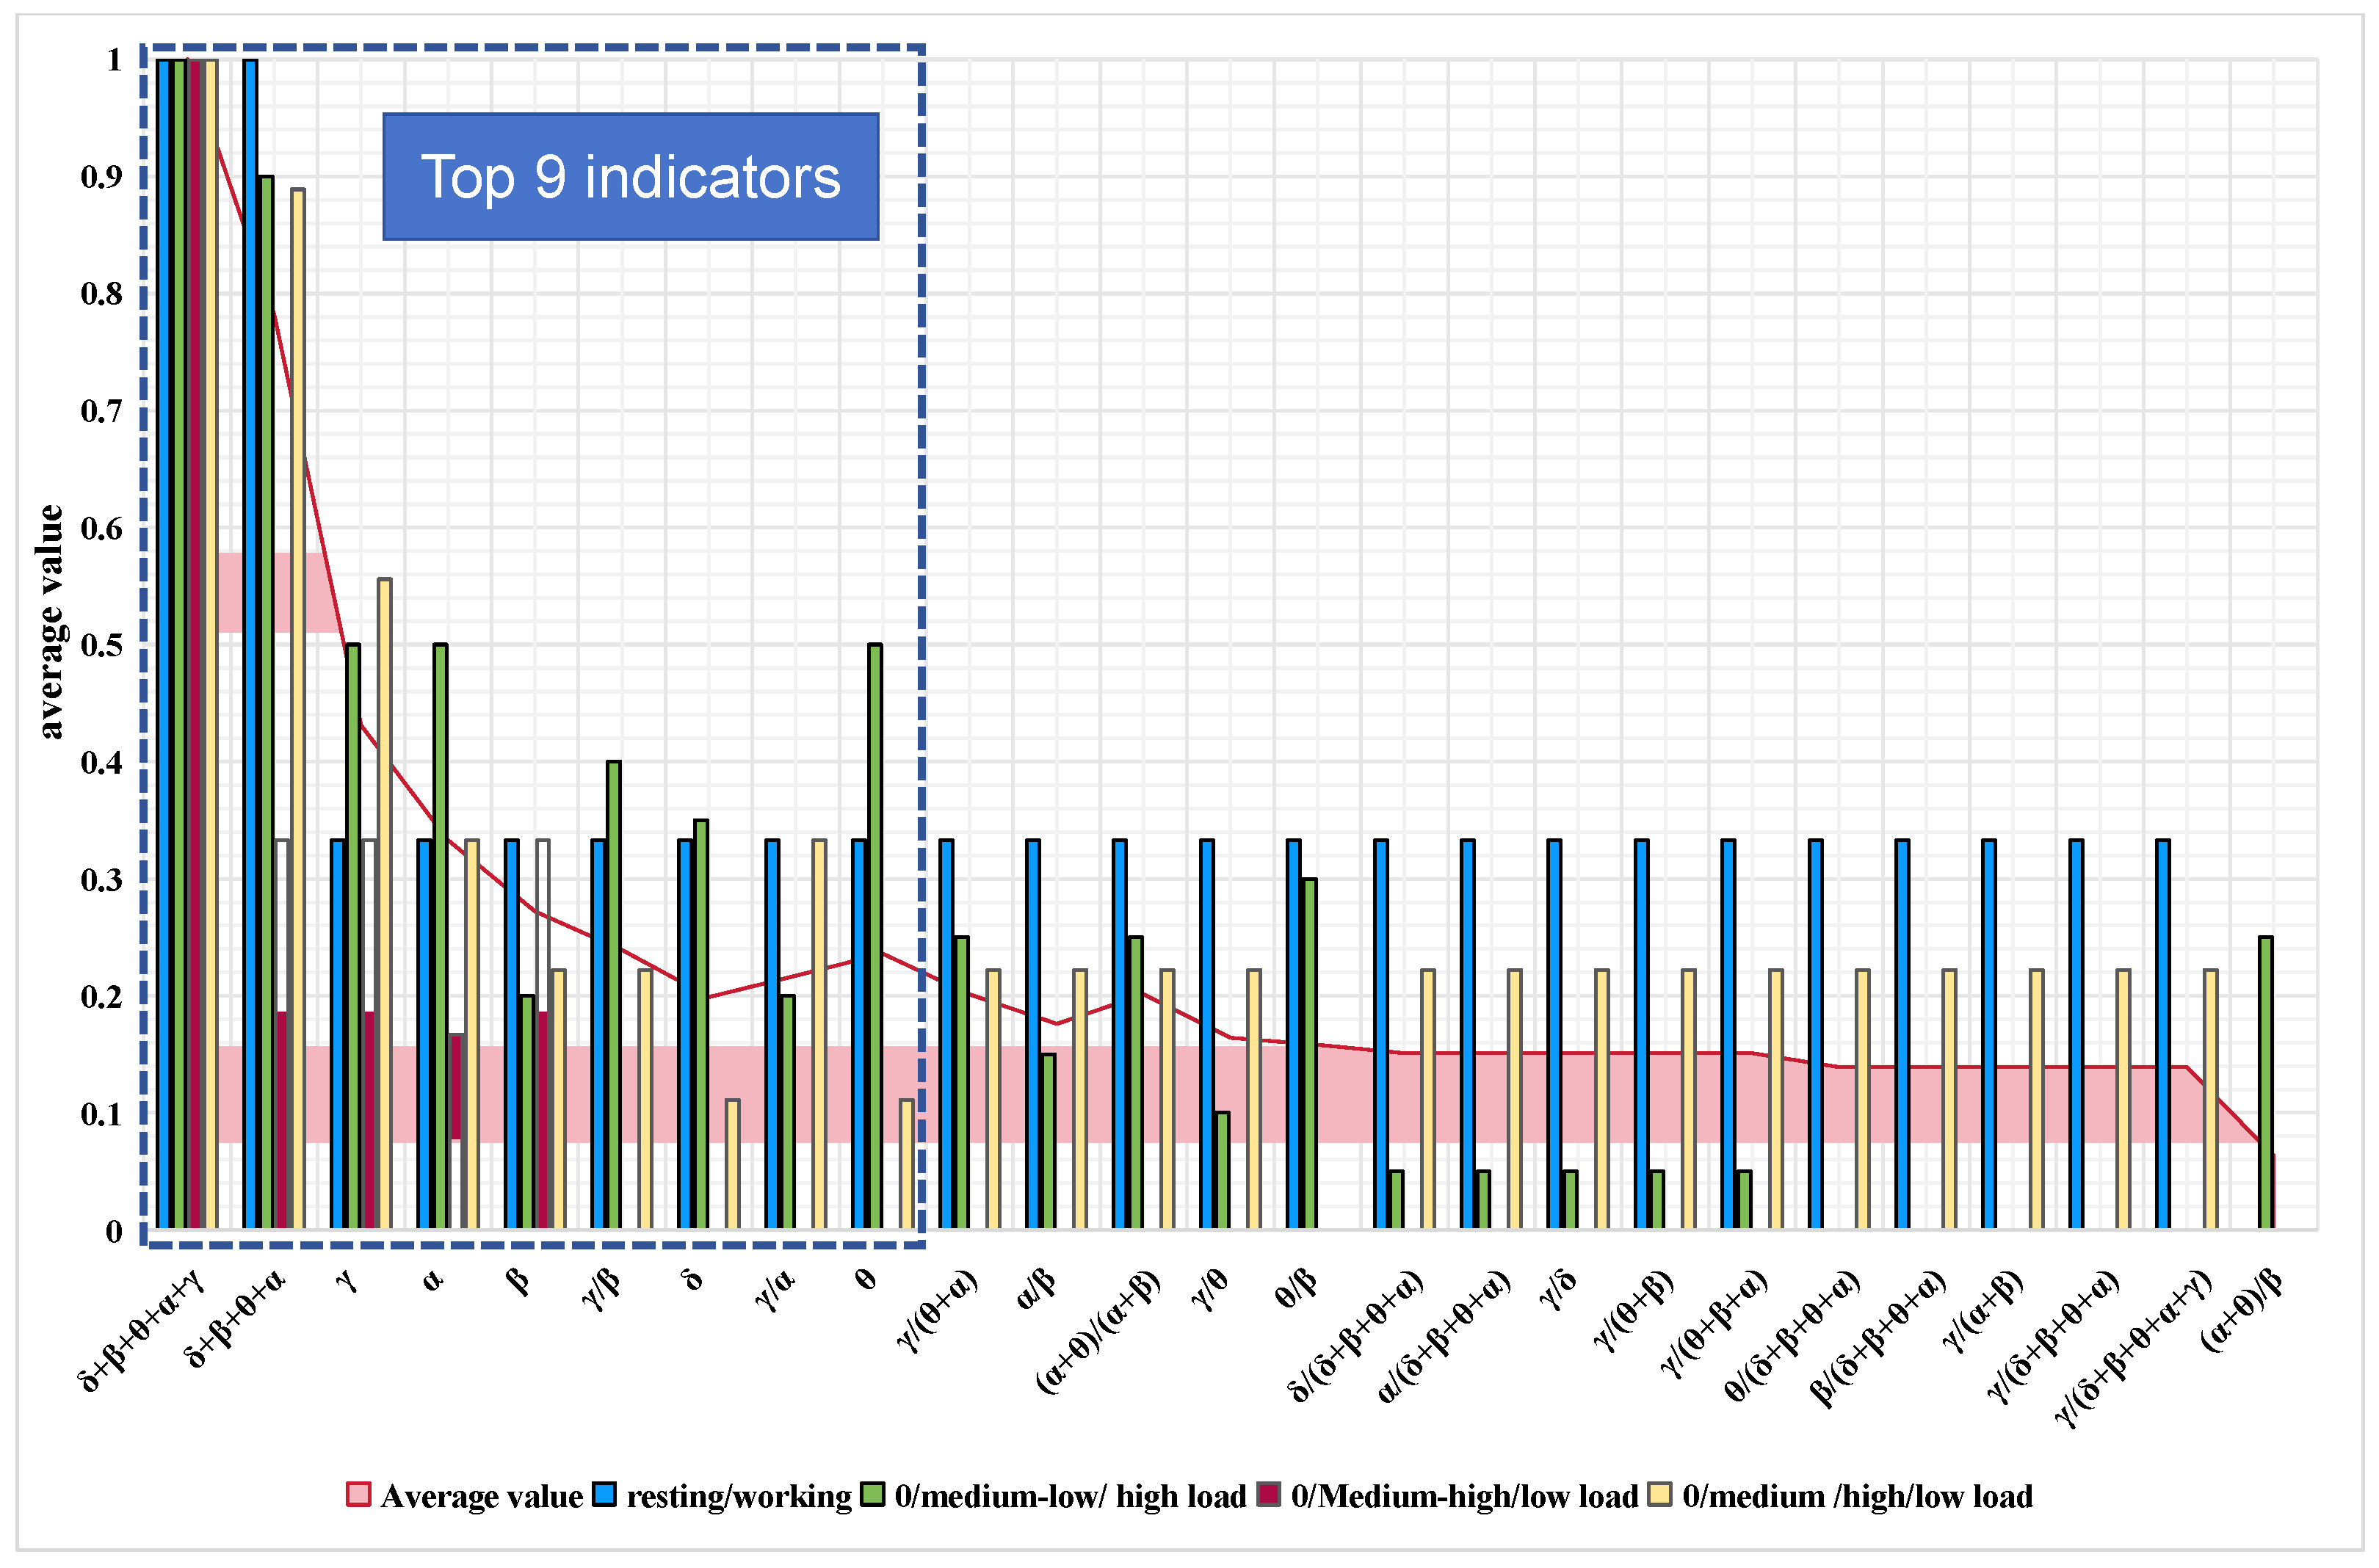
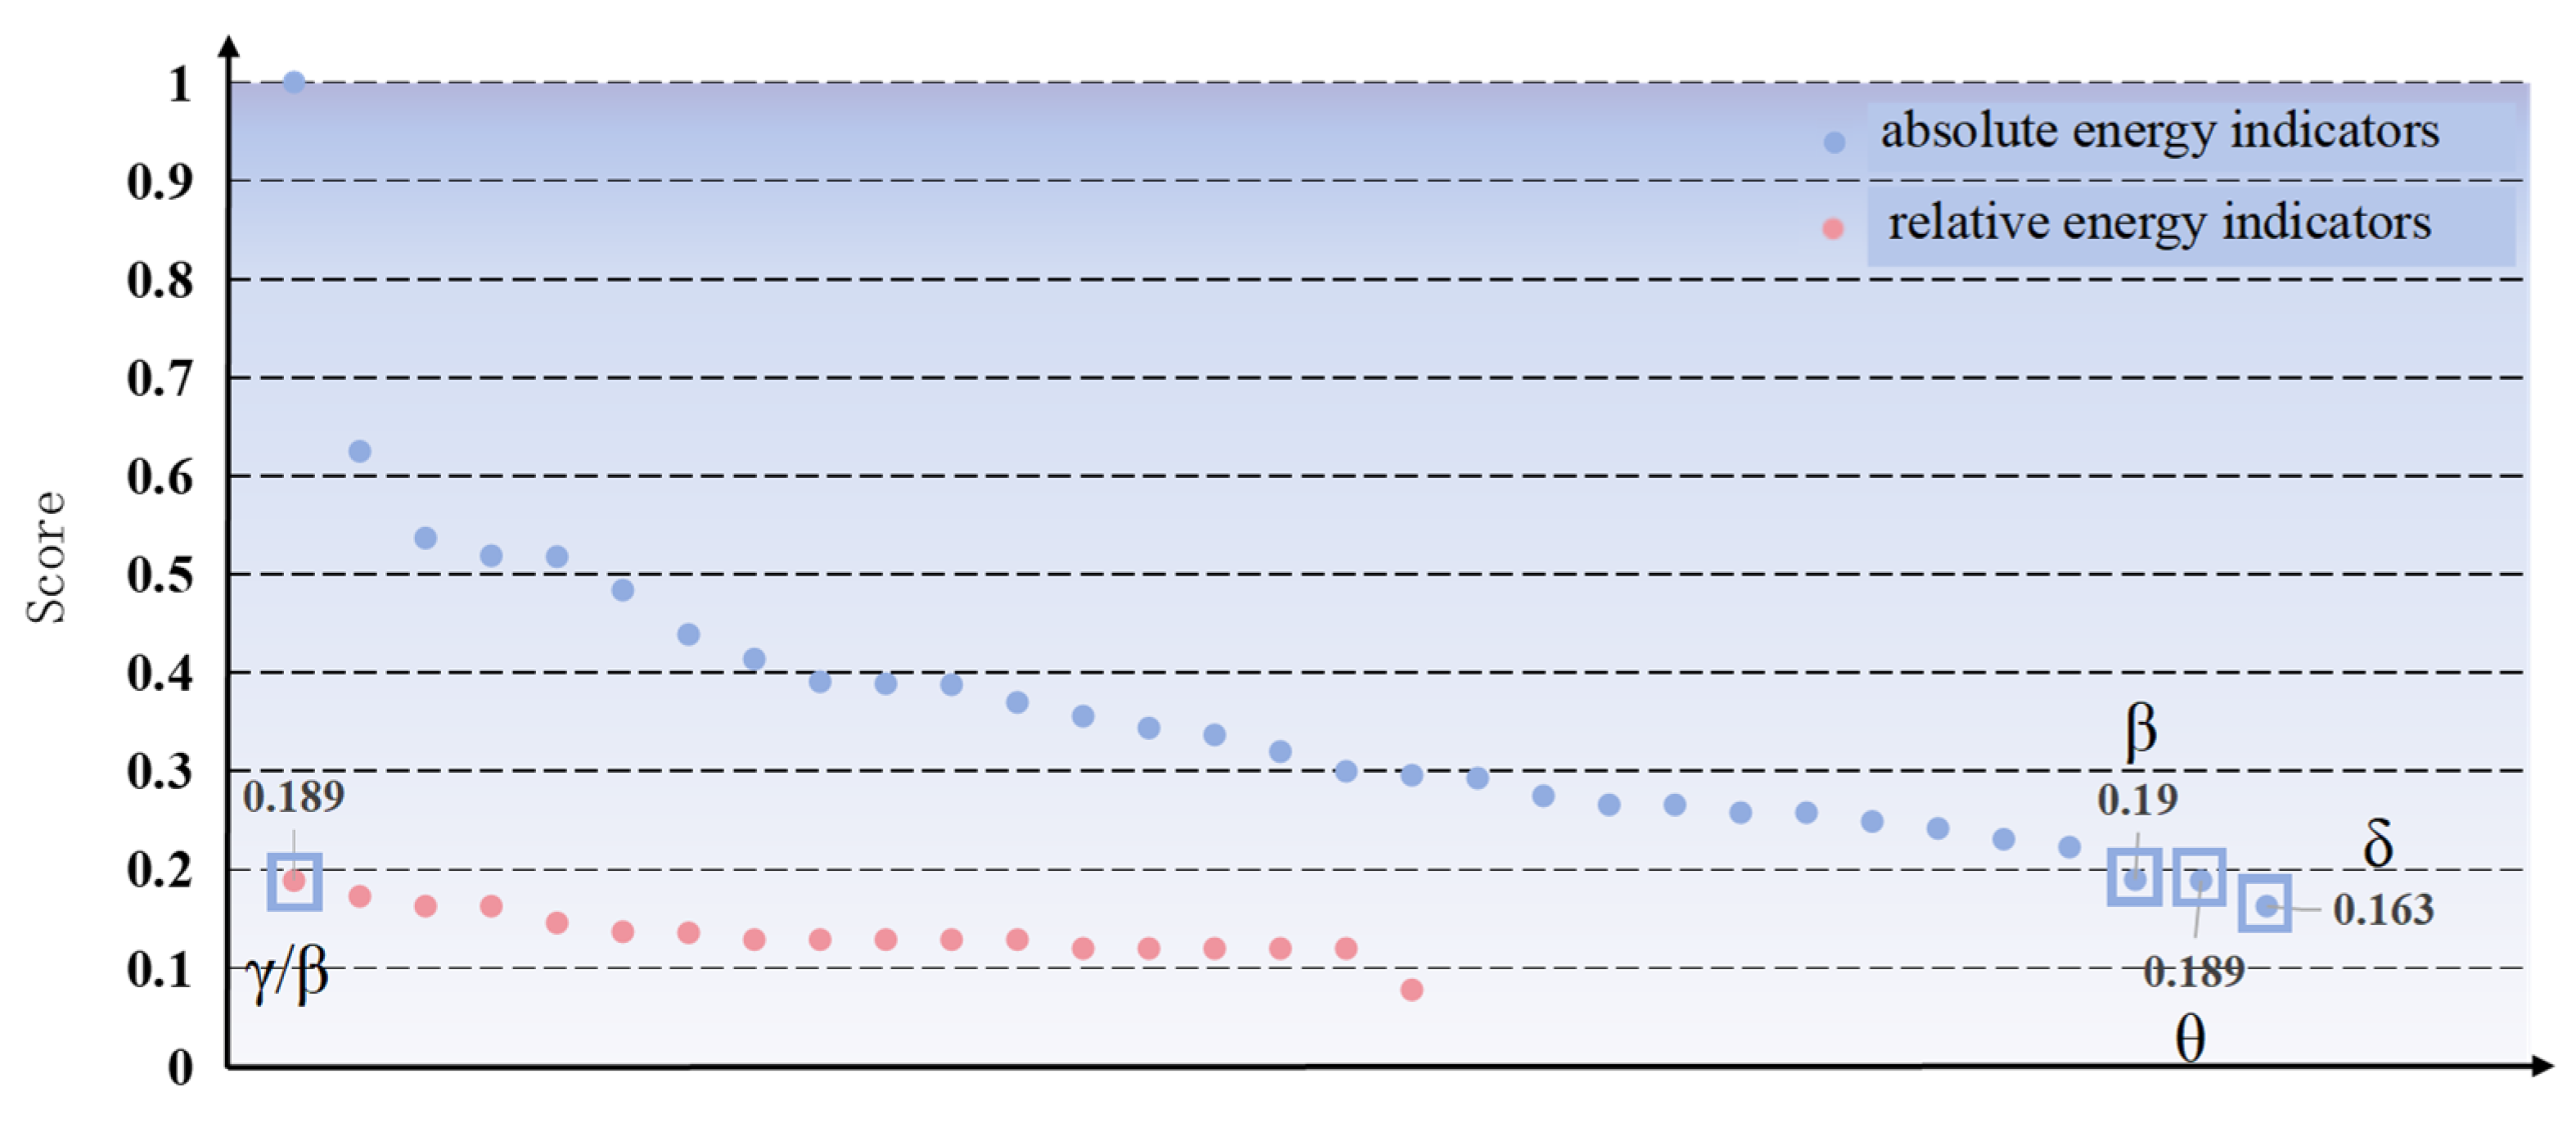
43]. To achieve this, relevant EEG indicators were extracted and then utilized for classification. Initially, the common traditional indicators were considered, such as α absolute energy, β absolute energy, δ absolute energy, θ absolute energy, α/(δ + β + θ + α), β/(δ + β + θ + α), θ/(δ + β + θ + α), (α + θ)/β, θ/β, α/β, and (α + θ)/(α + β) [
30,
44]. Additionally, new indicators related to gamma waves with a similar structure to these indicators were proposed for workload analysis, including γ absolute energy, γ/(δ + β + θ + α), γ/(δ + β + θ + α + γ), and so on. All indicators are shown in
Table 2, and the first 13 indicators are common working condition detection indicators, while indicators 14–25 related to gamma waves are newly introduced in this study for workload analysis.
After completing the feature extraction, a Pearson correlation analysis was conducted to investigate the relationship between the indicators and workload. The Pearson product–moment correlation coefficient, which measures the correlation between two variables X and Y and provides a value between −1 and 1, was utilized. The calculation formula is as follows:
Specifically, −1 indicates a perfect negative correlation, while +1 indicates a perfect correlation. The strength of a variable’s correlation is typically assessed based on the following range of values for the correlation coefficient: 0.8–1.0 indicates a very strong correlation, 0.6–0.8 indicates a strong correlation, 0.4–0.6 indicates a moderate correlation, 0.2–0.4 indicates a weak correlation, and 0.0–0.2 indicates an extremely weak correlation or no correlation [
45].
Following the Pearson correlation analysis, a Support Vector Machine (SVM) classifier was utilized to categorize the calculated indicators. SVM, a type of generalized linear classifier, performs binary classification through supervised learning, using a maximum-margin hyperplane as the decision boundary based on learned samples [
46,
47]. The dataset was randomly divided into a training set (70% of the total sample), testing set (15% of the total sample), and validation set (15% of the total sample) to ensure generalizability.
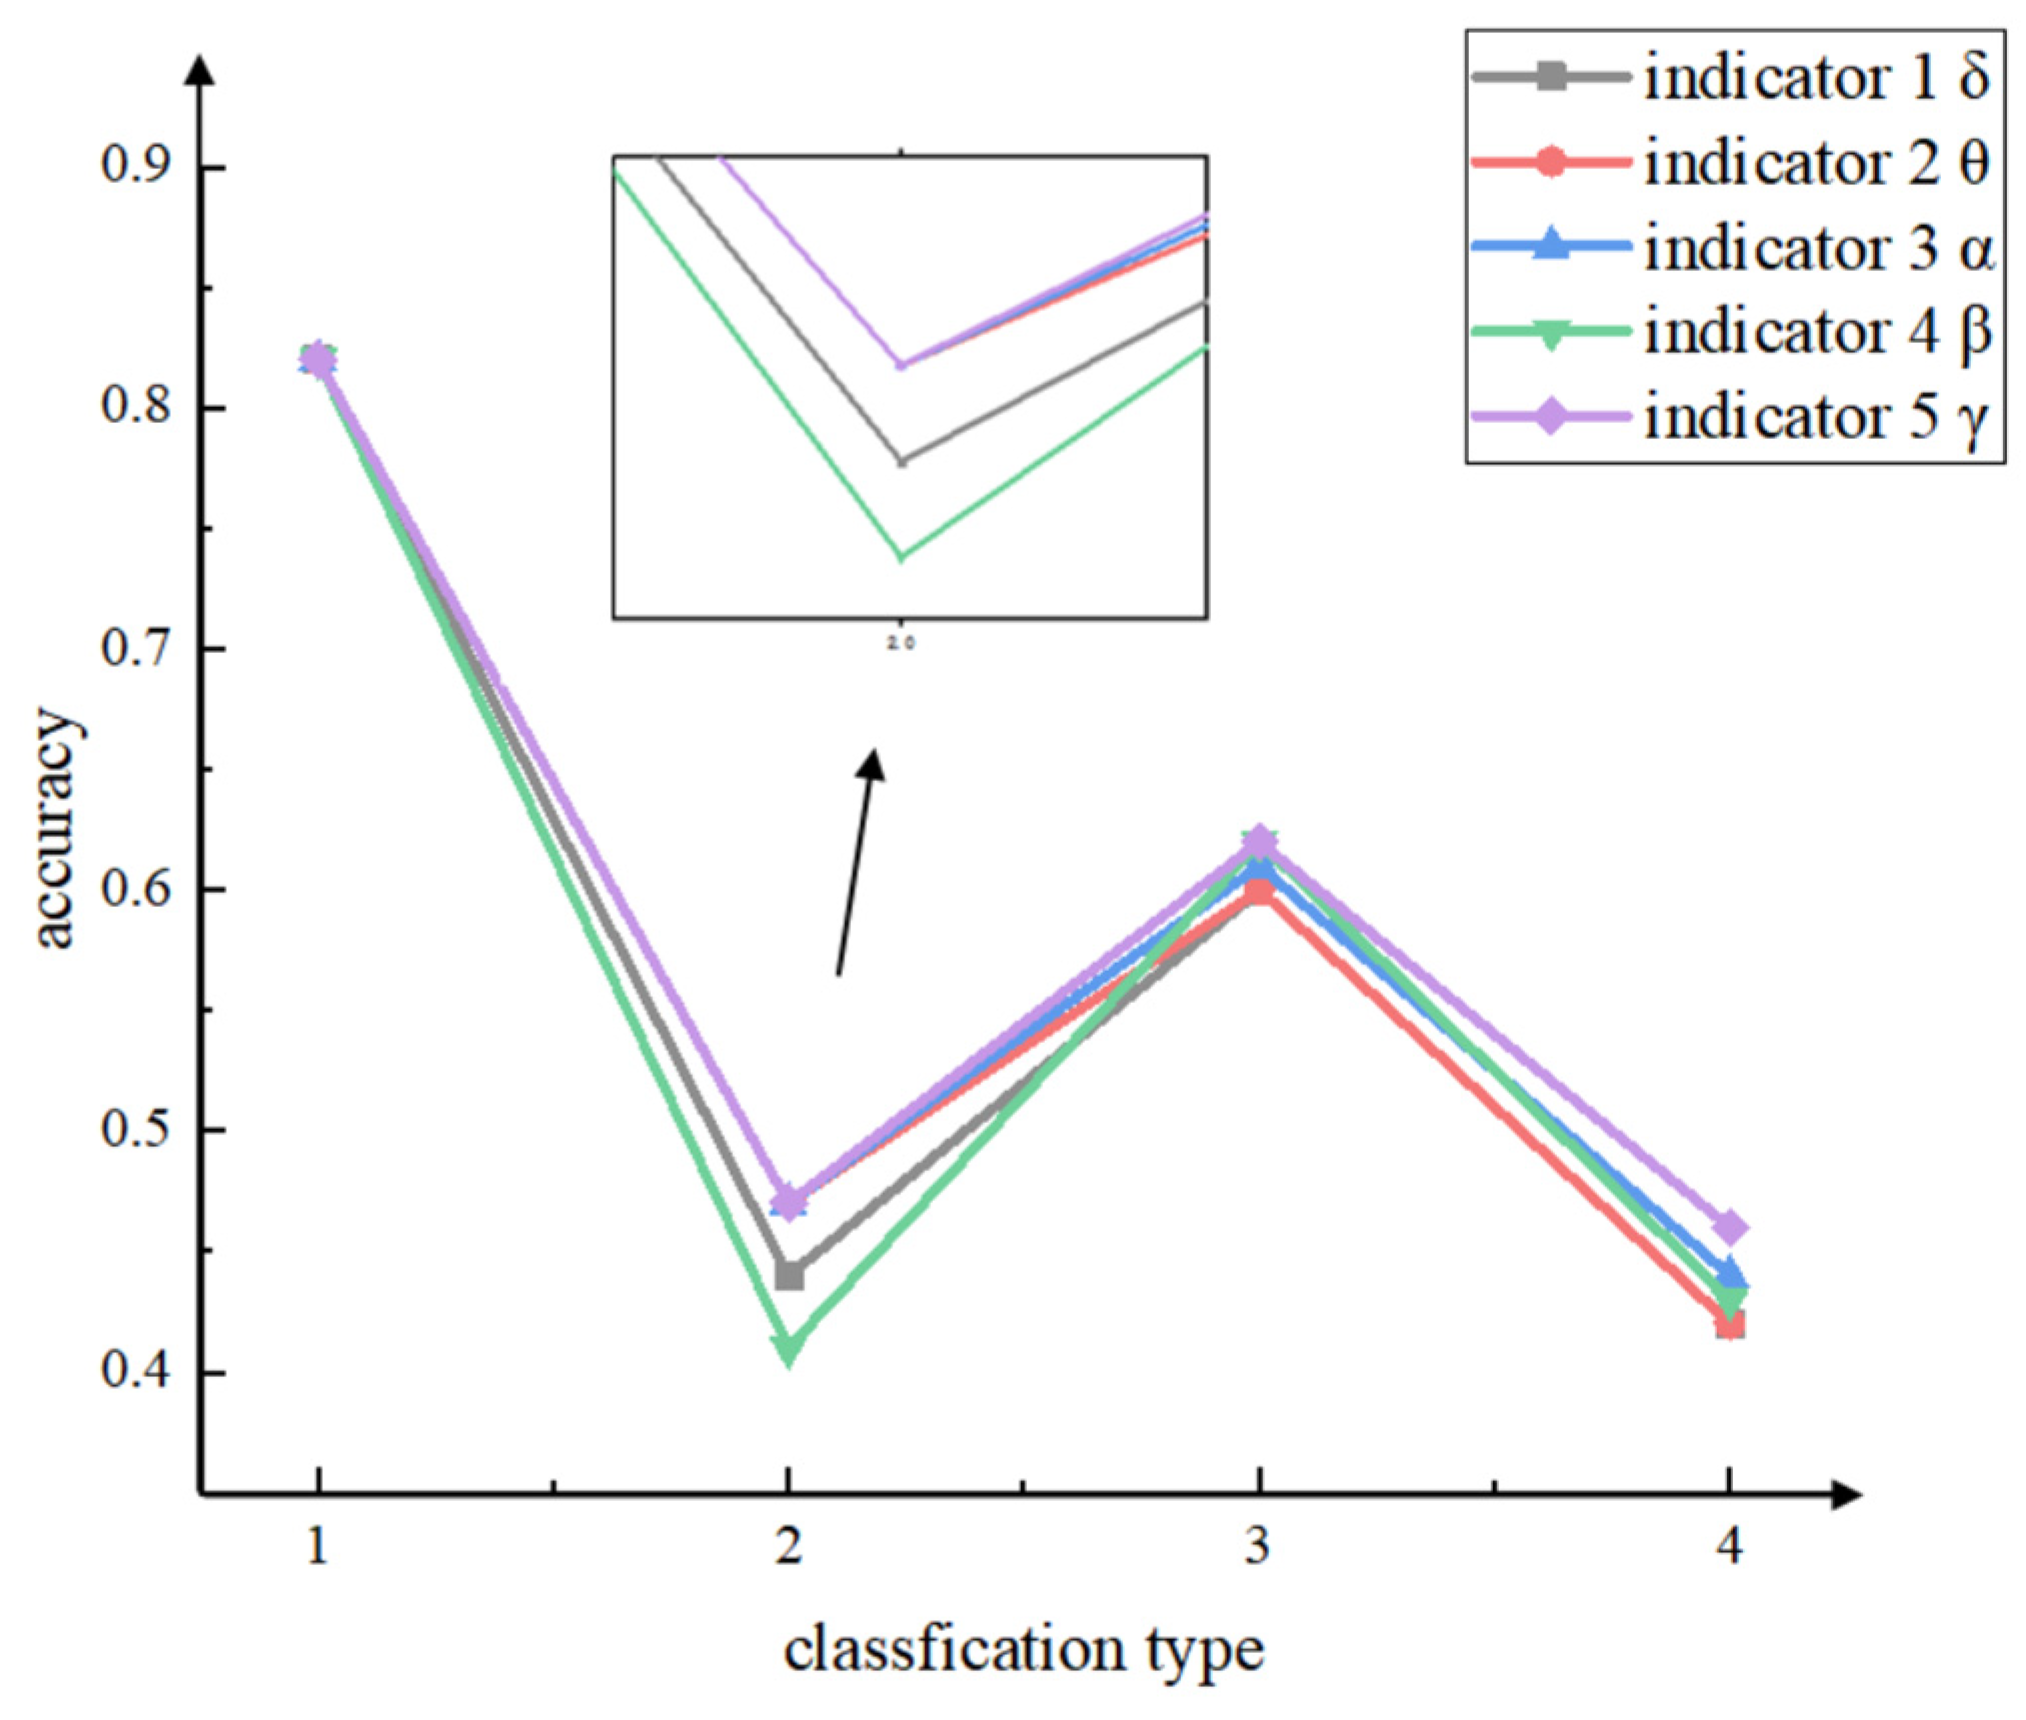
To enhance the generalizability of the results, the data were categorized in various ways and classified by the SVM classifier, including resting/working, 0/high/medium–low load, 0/low/medium–high load, and 0/low/medium/high load. For the classification method of resting/working, the EEG data of a controller at rest was labeled as “resting”, while the EEG data of a controller at work was labeled as “working”. To achieve a balanced distribution of sample data across the two labels, we conducted data sampling from Scene 1, Scene 2, Scene 3, and Scene 4. Specifically, we randomly selected one-fourth of the data from each work scene to represent the input data associated with the “working” label.
Each feature’s corresponding data were classified using the SVM classifier, and a grid search method was employed to optimize the classification results by identifying the best parameter combinations for each feature under different classification methods. Subsequently, the best-performing feature was chosen based on its classification accuracy across different mental workload categories for controller detection.
2.3. Application
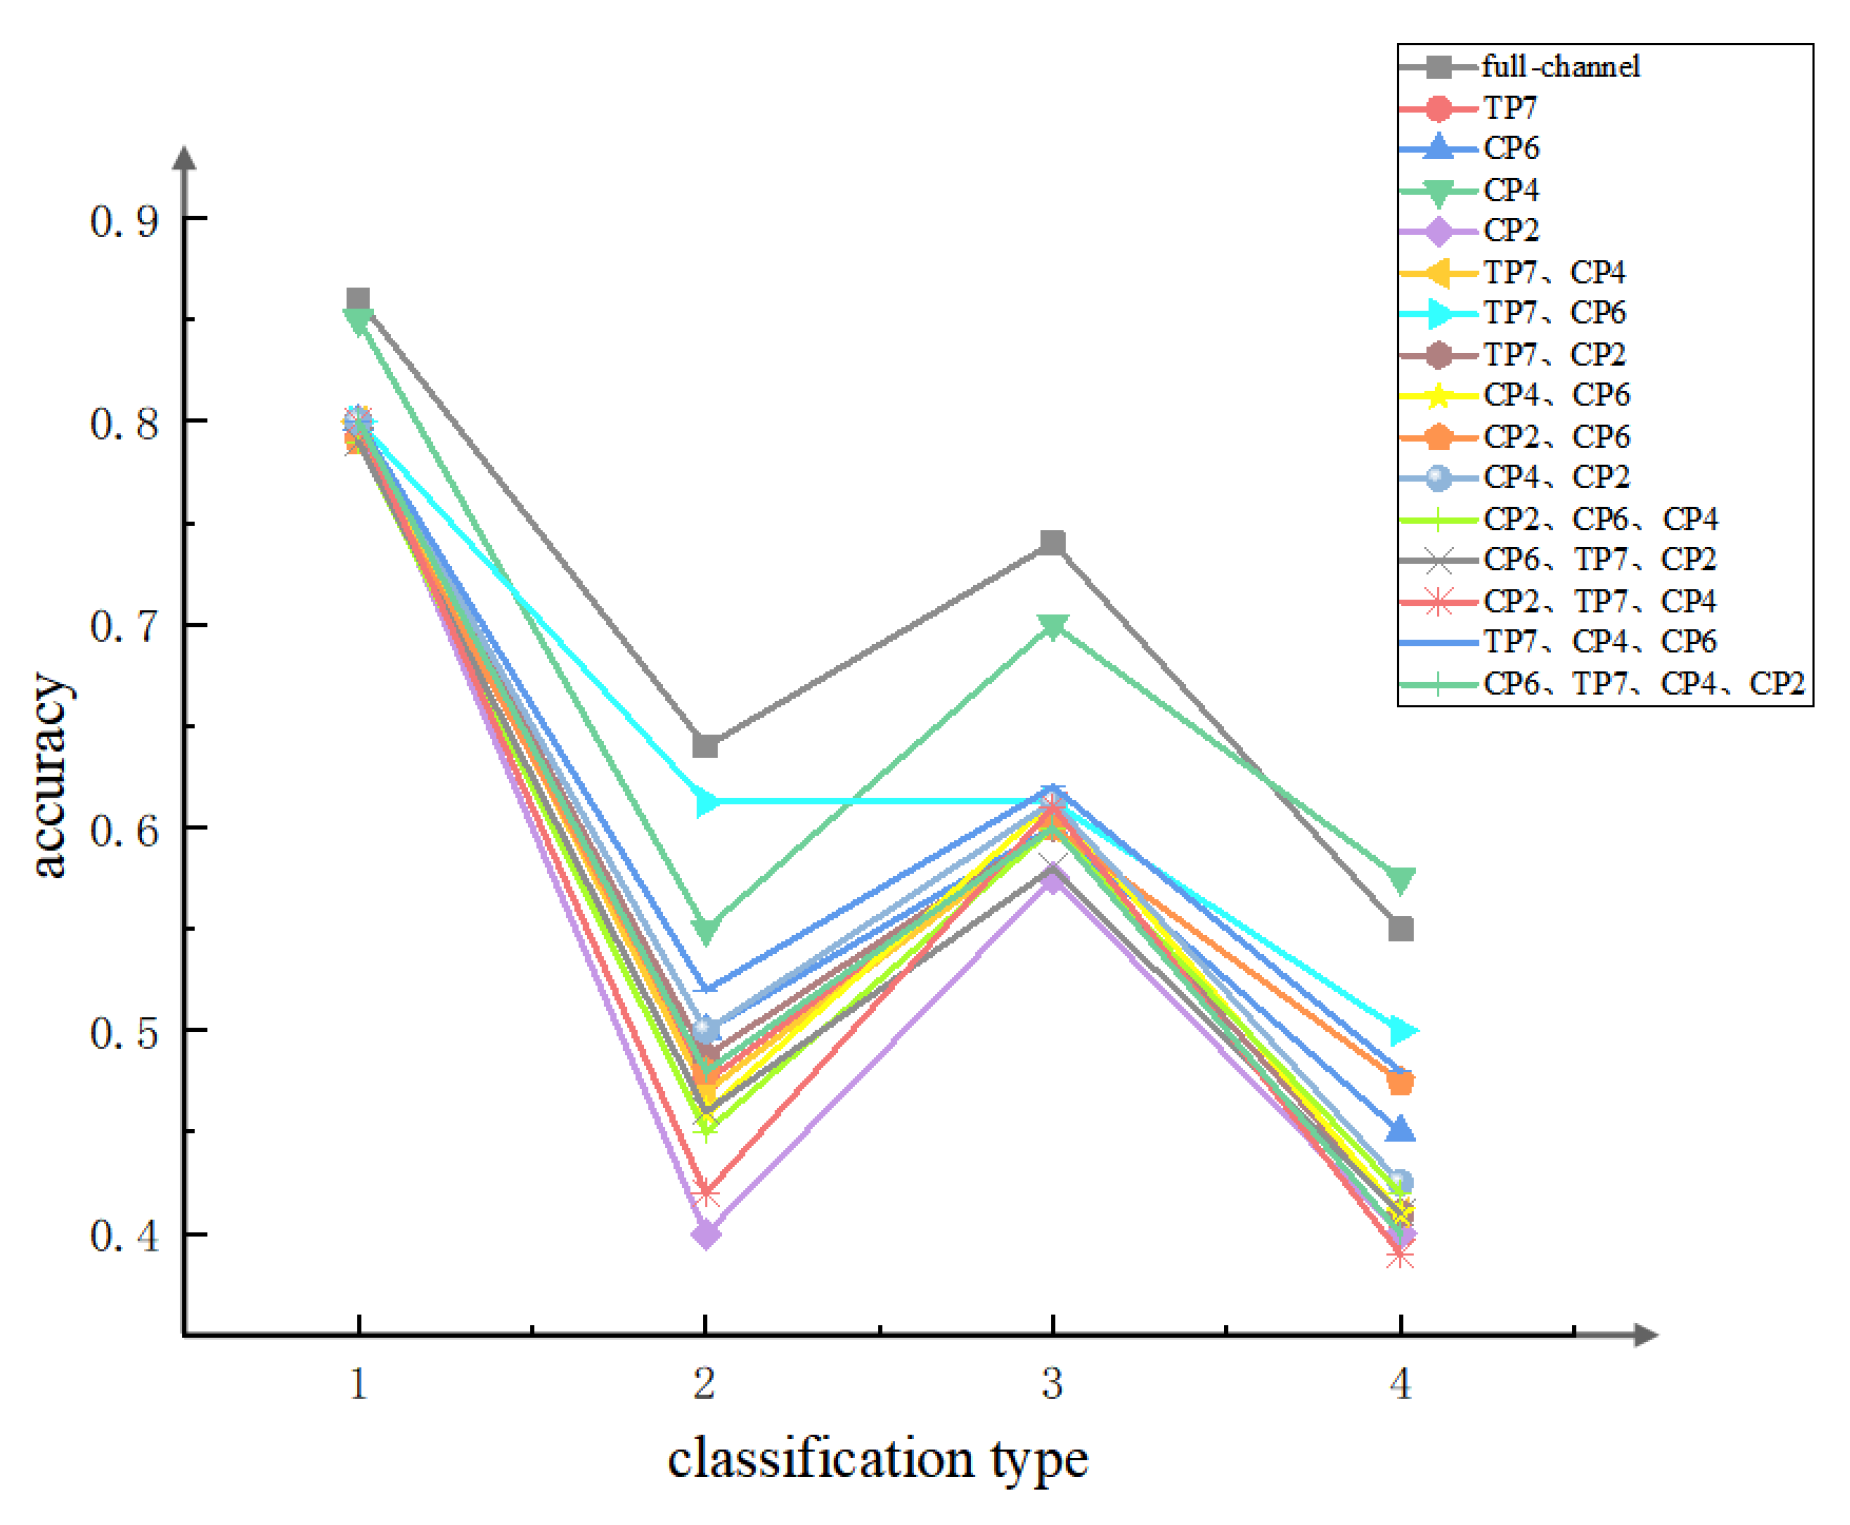
The preceding work has enabled the identification of the most suitable indicator for detecting the controller workload. Subsequently, the suitability of this indicator for controller workload detection was validated by assessing its detection accuracy in single-channel, multichannel, and full-channel applications.
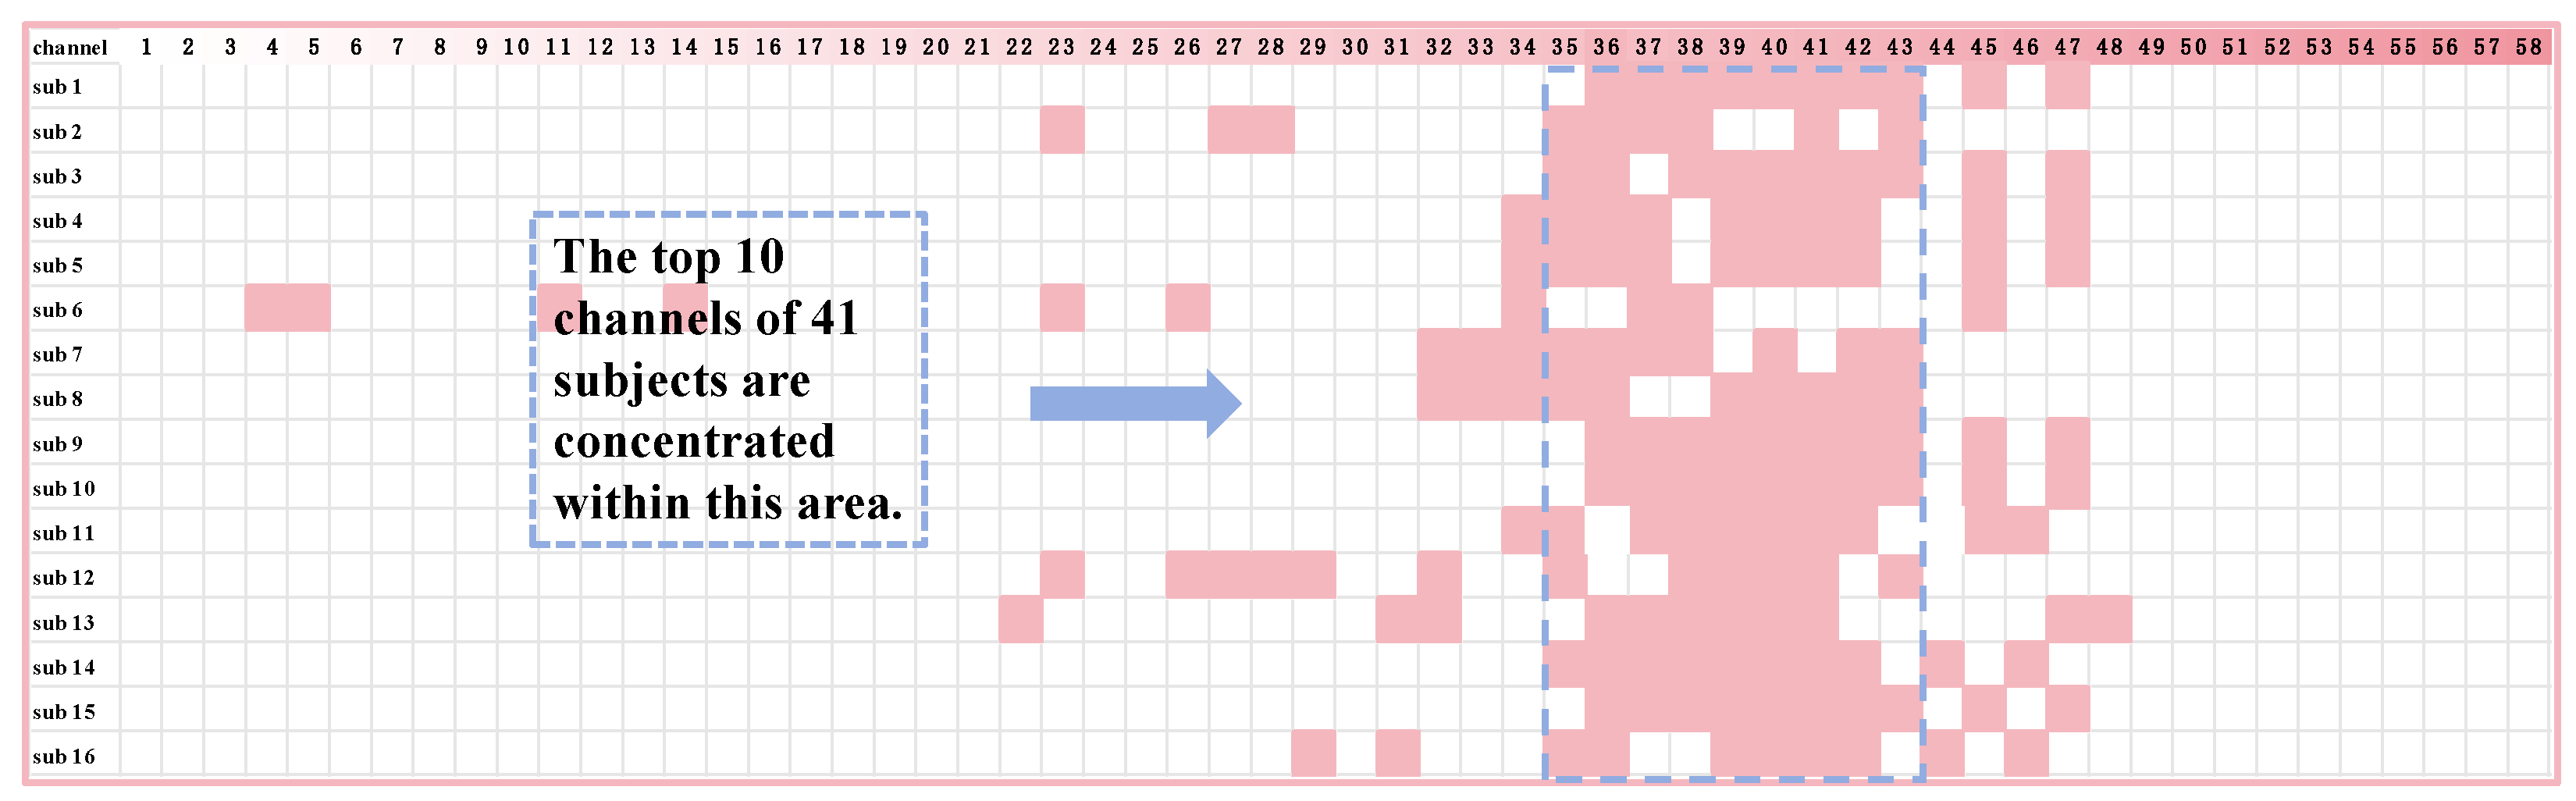
This paper utilizes the mRMR algorithm to select a single channel or a combination of channels for the indicator, aiming to enhance its applicability. The mRMR algorithm combines correlation and redundancy between features to identify the most relevant and minimally redundant features [
48].
This study employs the mRMR algorithm to select a single channel or a combination of channels for the indicator with the objective of enhancing its applicability. The mRMR algorithm integrates correlation and redundancy between features to identify the most relevant and minimally redundant features [
48]. The maximal relevance criterion is calculated as:
Here,
represents the set of channels, and
represents the target variable (mental workload), with
being one of the channels. The minimum redundancy criterion is as follows:
The redundancy between channels can be calculated by using this formula. The criterion that combines the above two constraints is called “minimal-redundancy–maximal-relevance” (mRMR).
According to this algorithm, the set of “minimal-redundancy–maximal-relevance” channels for each subject corresponding to the best-performing indicator can be selected. Furthermore, the applicability of the indicator can be analyzed based on the detection accuracy in different channels or combinations of channels.


