
Quality Assessment and Application Scenario Analysis of AGRI Land Aerosol Product from the Geostationary Satellite Fengyun-4B in China


Abstract
:1. Introduction
2. Data and Methods
2.1. FY-4B LDA
2.2. Evaluation Datasets
2.2.1. Himawari-9/AHI
2.2.2. MODIS
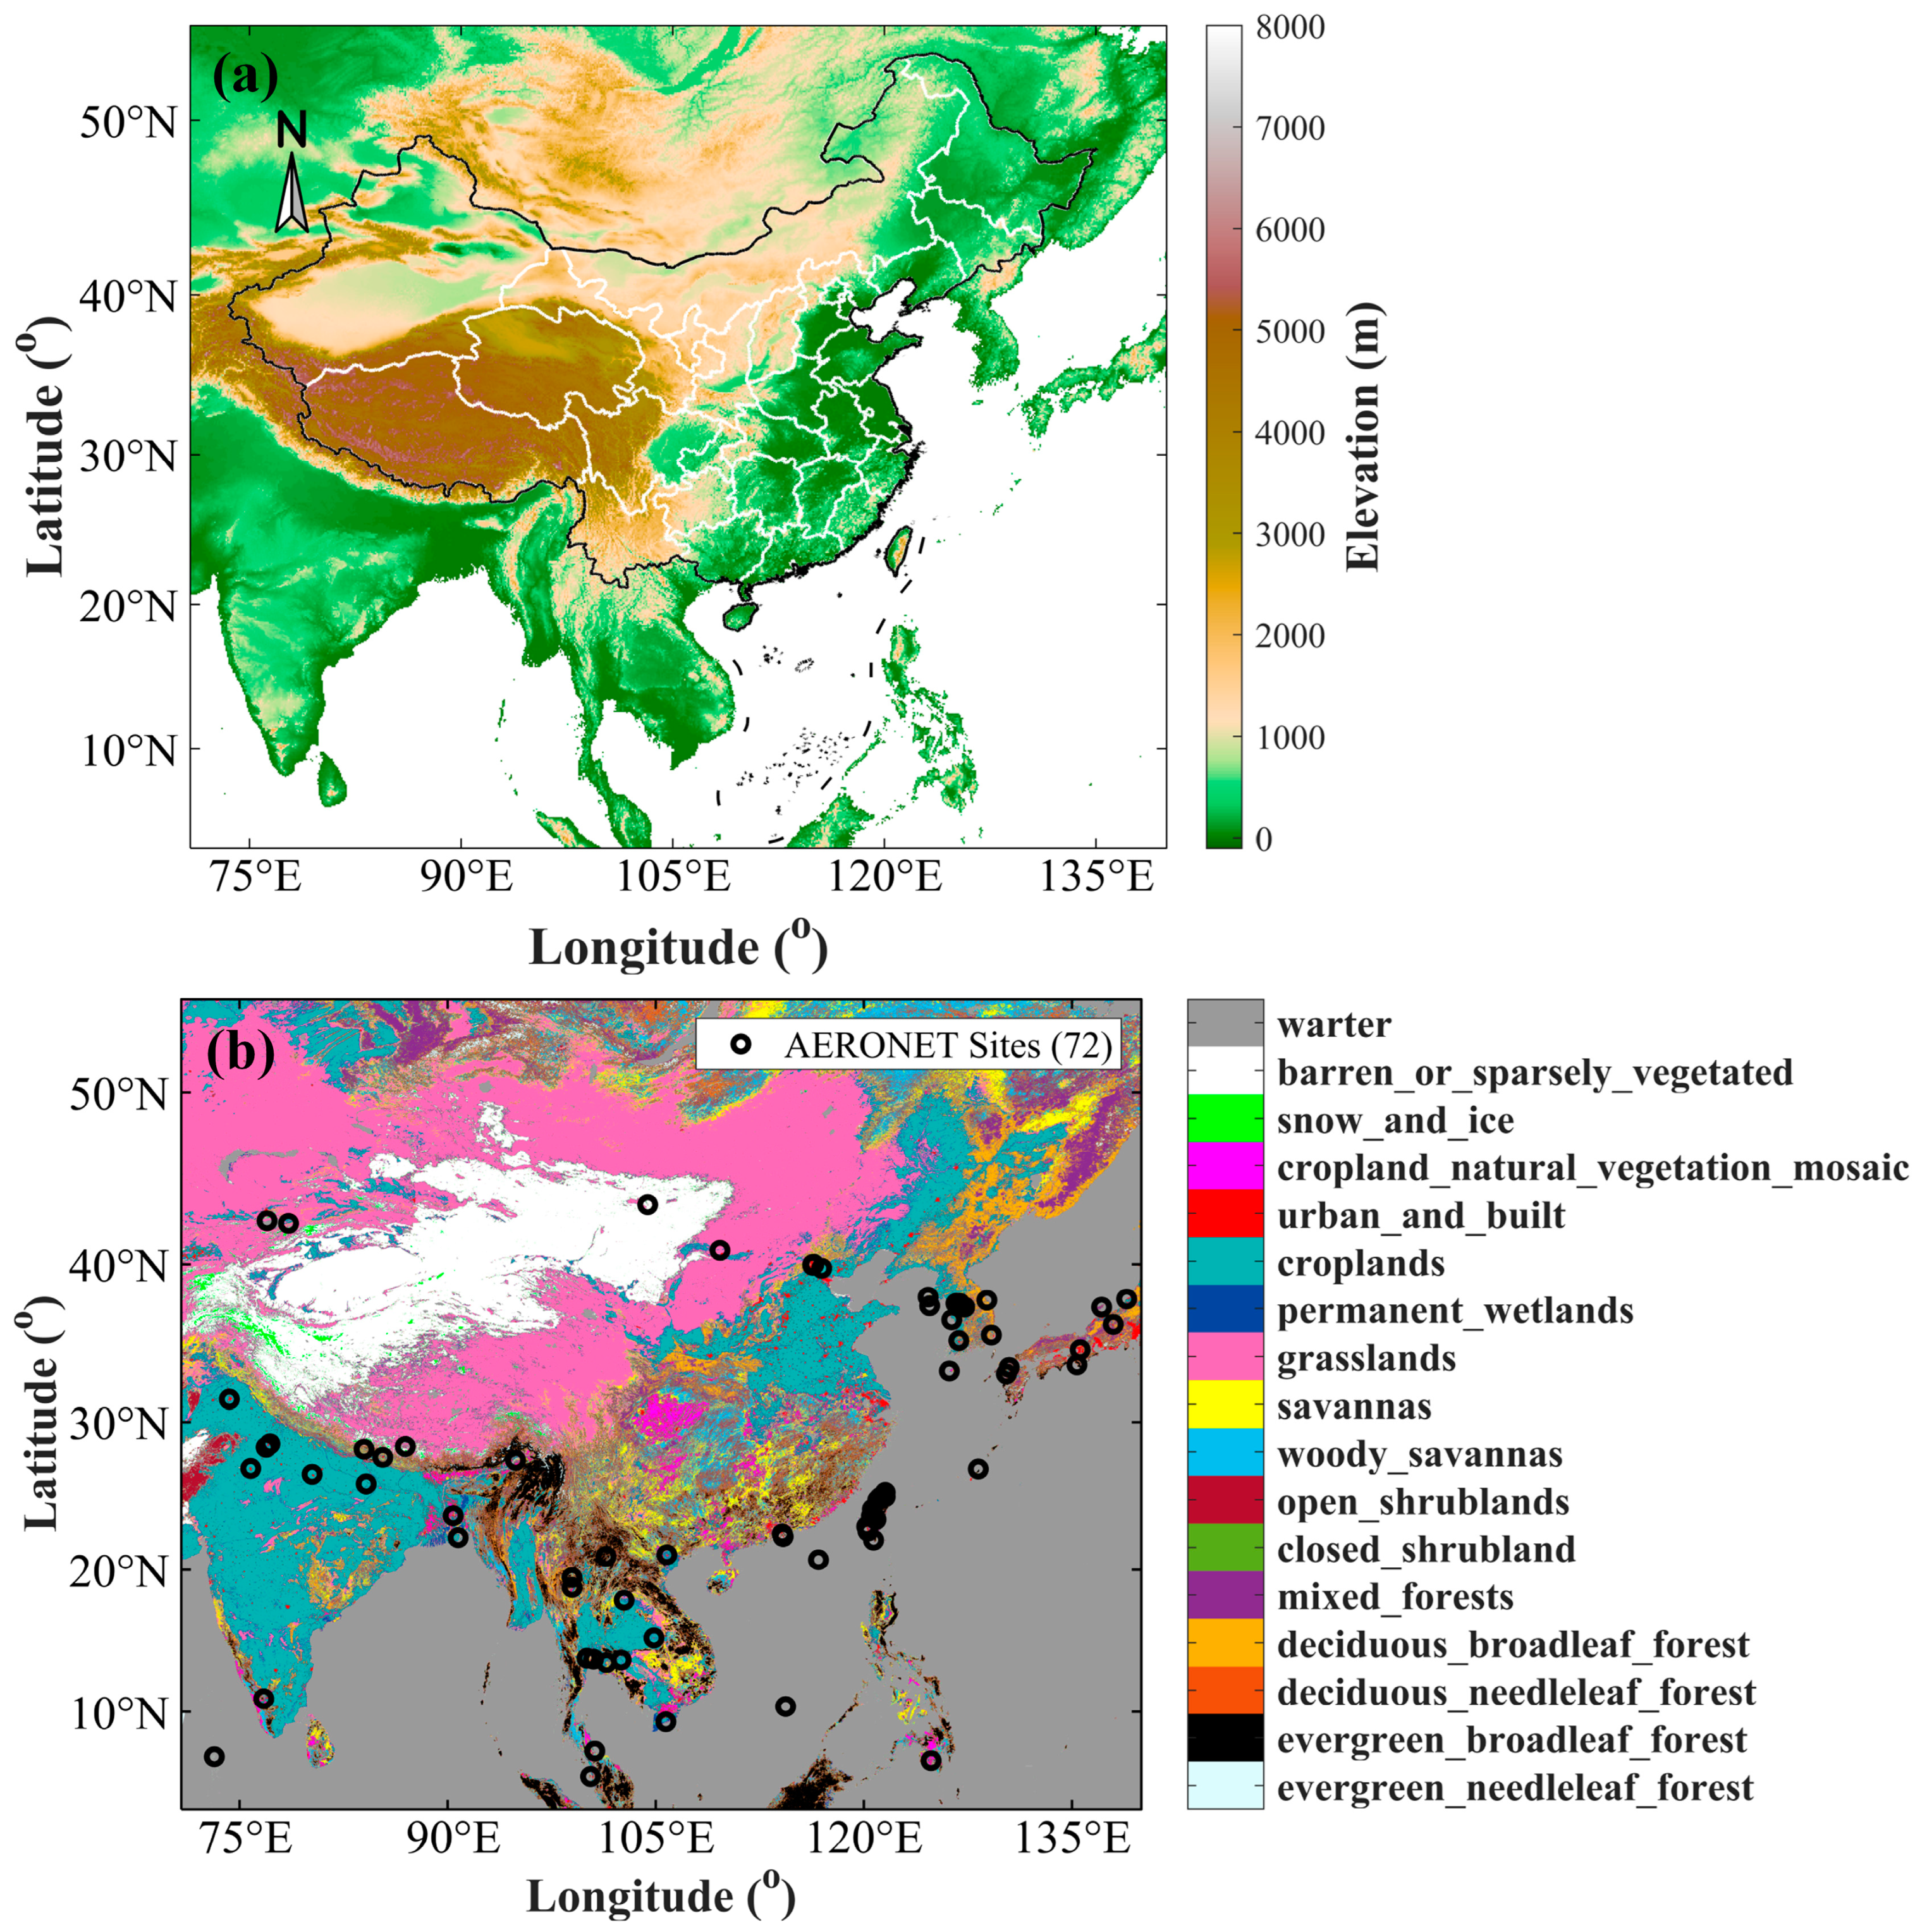
2.2.3. AERONET
2.3. Methods
- (1)
- N: The number of samples, i.e., the number of point pairs matched between the FY-4B LDA AOD and the AERONET ground-based data;
- (2)
- Correlation coefficient (R): The level of data correlation between the results to be validated and the ground-based data;where, is the total number of matchups, denotes the AOD value for the th sample of the AGRI, denotes the true value of the foundation measurement corresponding to .
- (3)
- Mean Error (ME, Bias): The average value of the difference between the data to be validated and the ground-based measurements. The mean error reflects the volatility of the data. A smaller ME indicates that the error is more evenly distributed across the entire dataset, indicating more reliable results;
- (4)
- Root Mean Square Error (RMSE): The degree of difference between the data to be validated and the measurements; the smaller the value of RMSE, the smaller the difference between the values to be validated and the measured values of the site;
- (5)
- Expected Error (EE15): EE15 is a widely used evaluation parameter to describe the overall performance of satellite aerosol versus ground-based measurements and stands for the degree of data correlation between the satellite datasets and the measurements [40]. Generally, the satellite retrieval results to be validated are considered to have a good match with the AERONET measurements when at least 67% of the satellite results fall within the range of (EE15) [41];
- (6)
- EA ± EP(EE): Expected Accuracy (EA) is the best linear fit of the ground-based measurements to the mean deviation, indicating the degree of fluctuation of the mean deviation of the values to be validated from the true values. Expected Precision (EP) indicates the best linear fit to the one-fold standard deviation of the deviation, indicating the degree of fluctuation of the deviation between the value to be validated and the true value. The Expected Error (EE), defined as EA ± EP, is a function of the AERONET measurements, expressed in the notation of Huang et al. [42]. It is considered to meet the accuracy requirement if at least 68% of the data to be validated falls within the EE envelope when the satellite retrieval results are validated against AERONET;
- (7)
- Global Climate Observing System Fraction (GCOSF): The Global Climate Observing System (GCOS) stipulates that the accuracy of satellite-retrieved AOD values should be better than 0.03 or 10% when compared to true values [43]. The GCOSF represents the overall percentage of AOD products that meet the requirements of GCOS [44]. The specific calculation principles are shown in the following formula.
3. Results and Analysis
3.1. Validation by AERONET
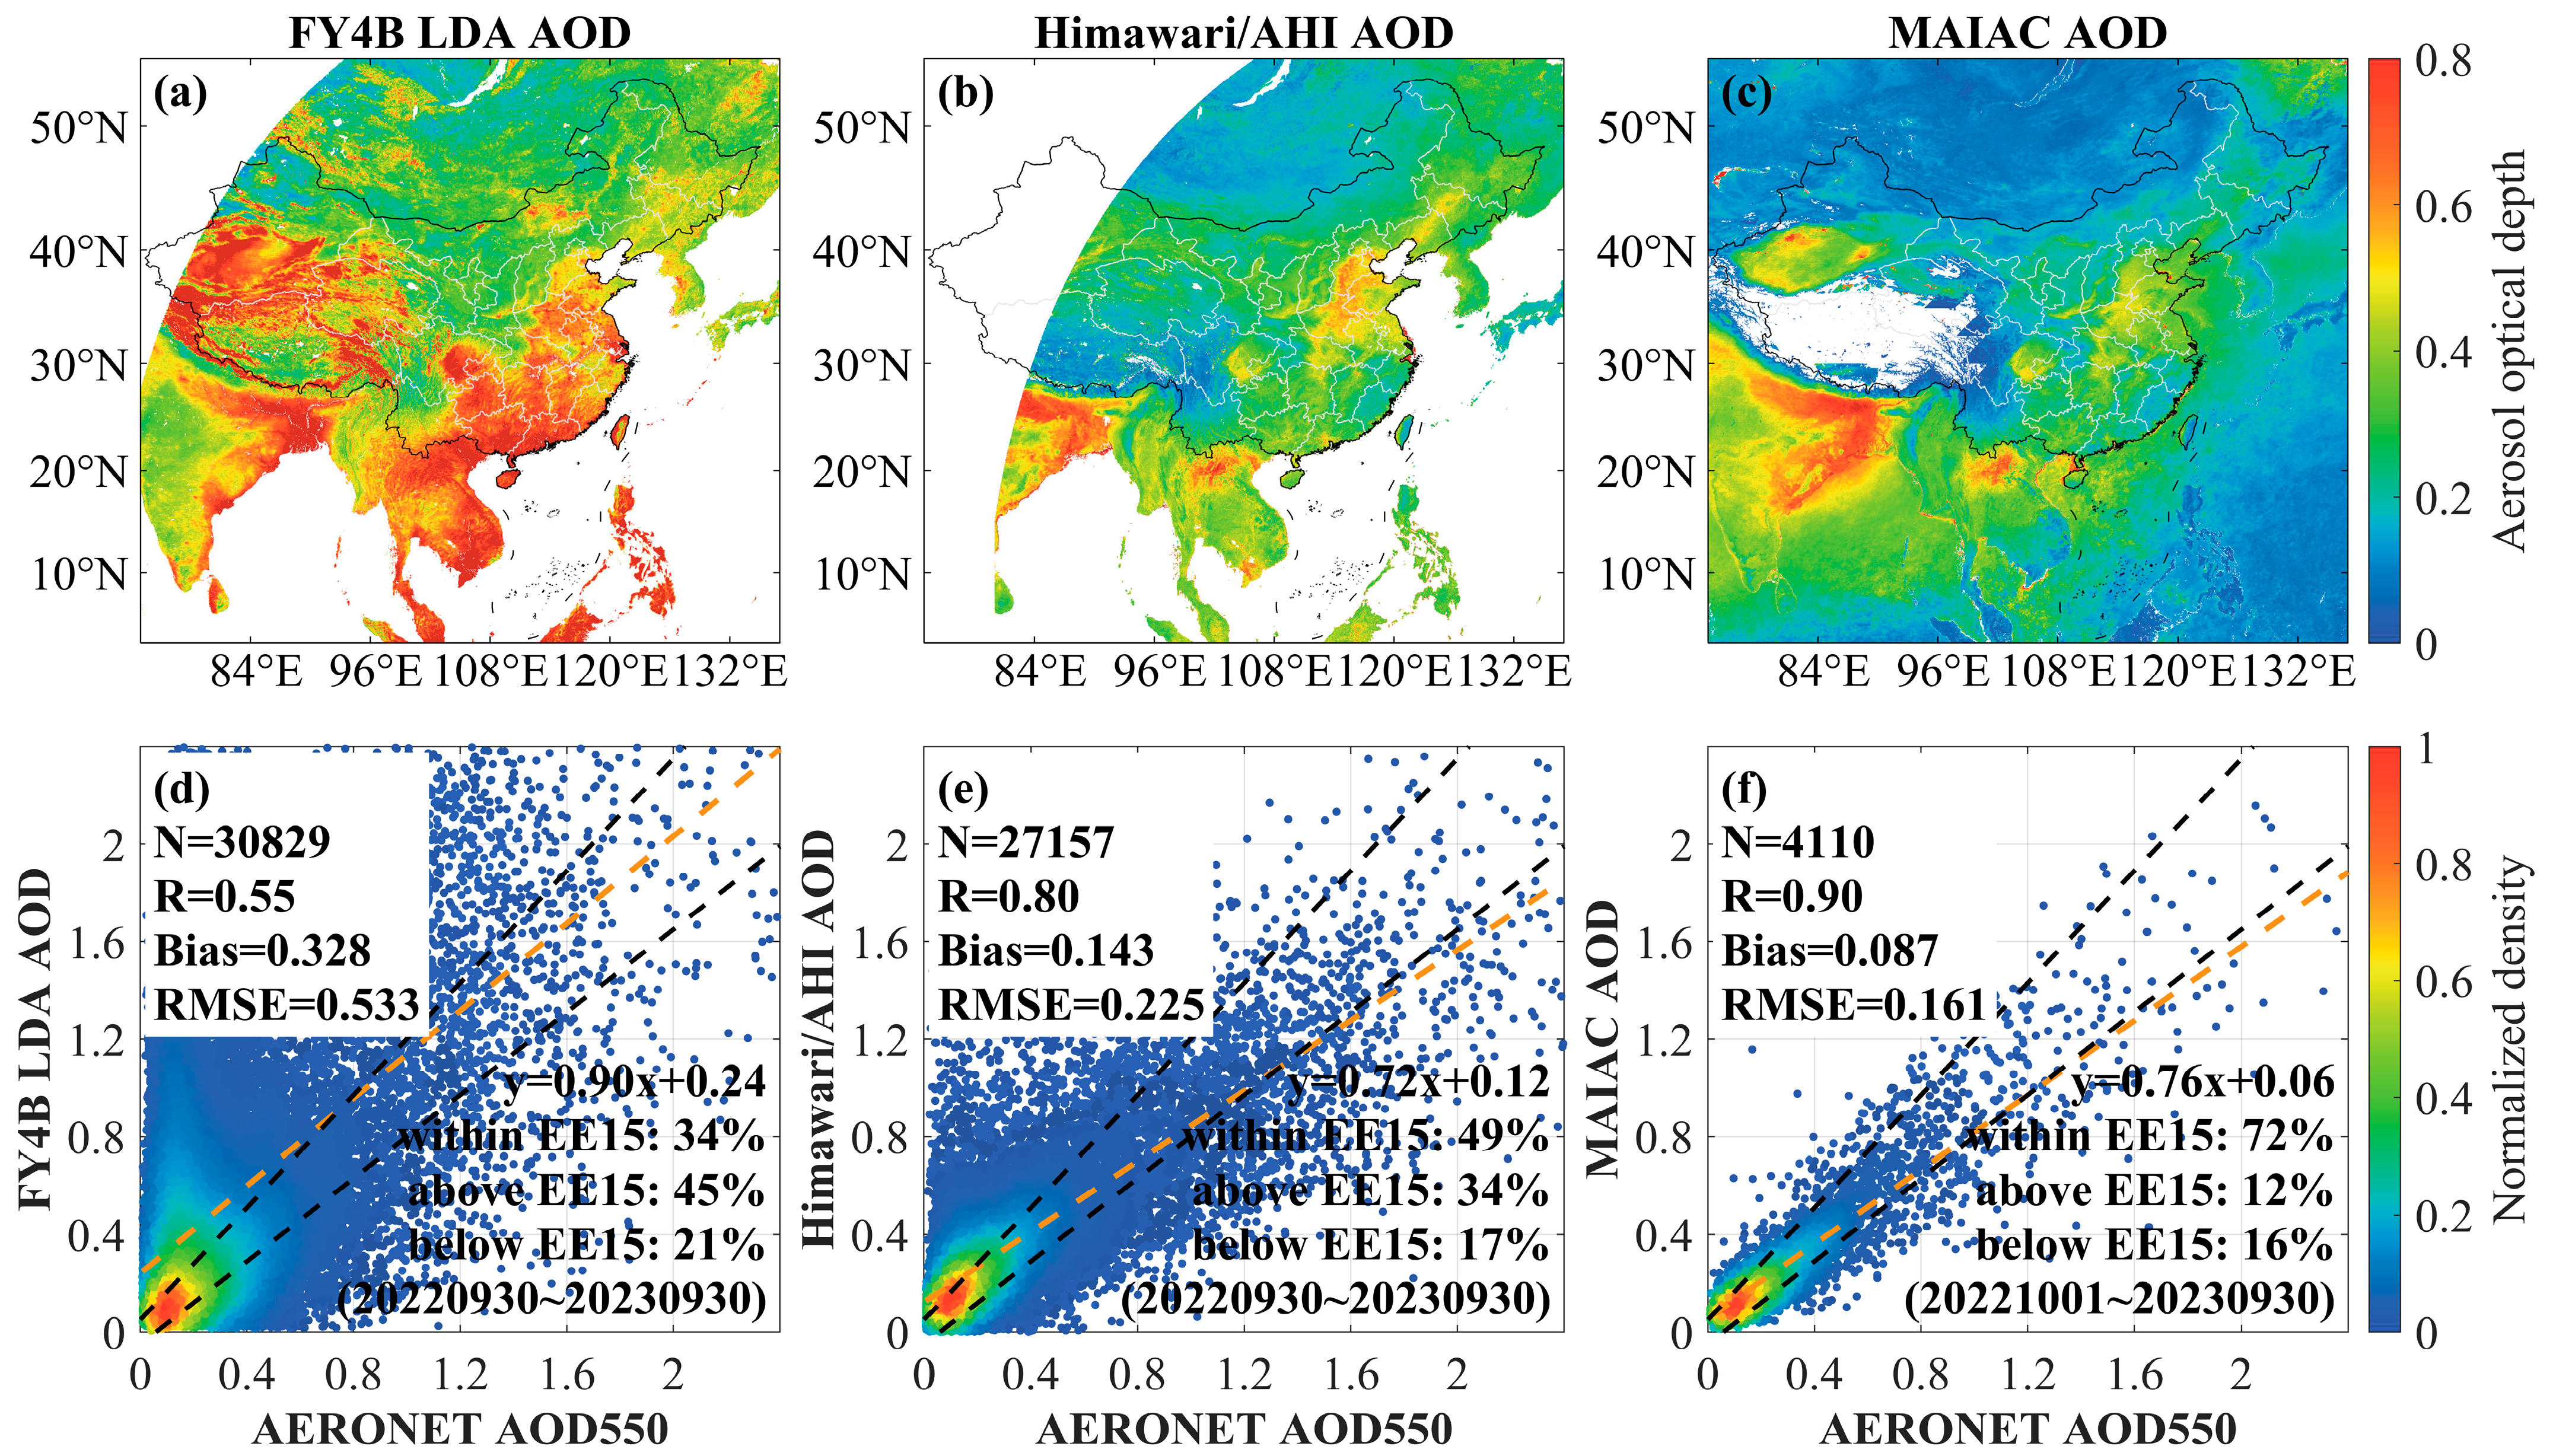
3.1.1. Overall Validation
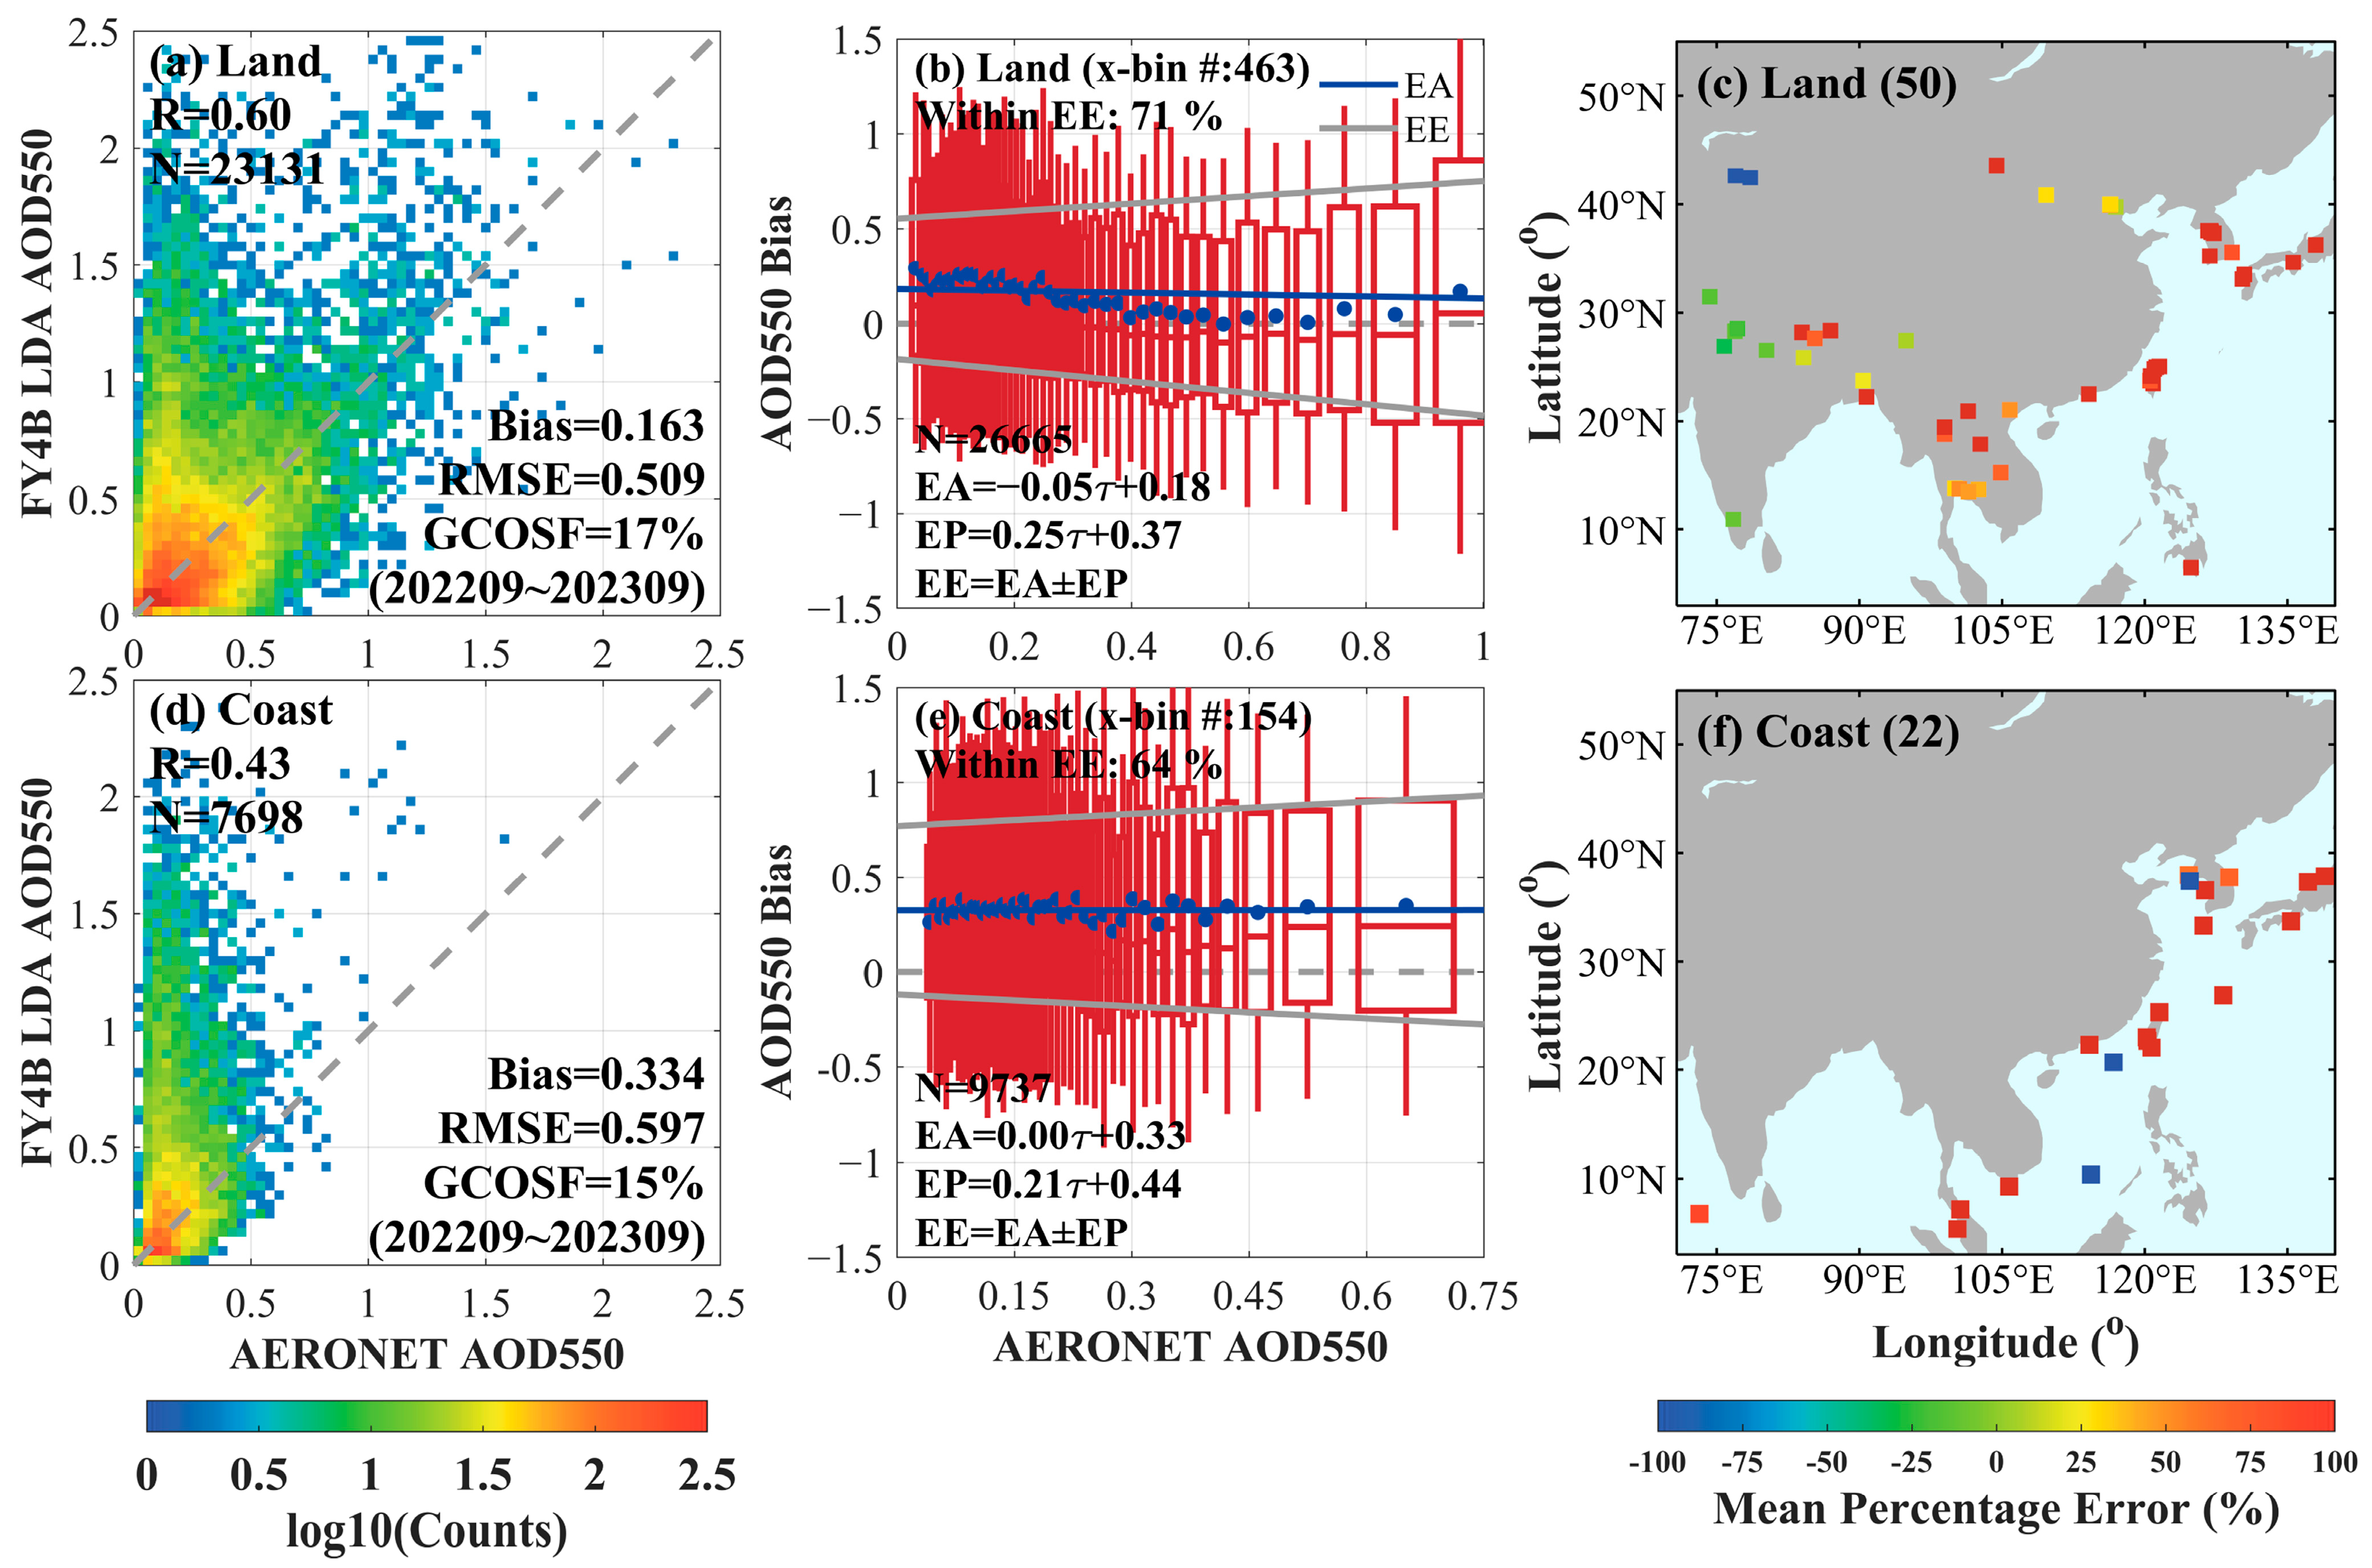
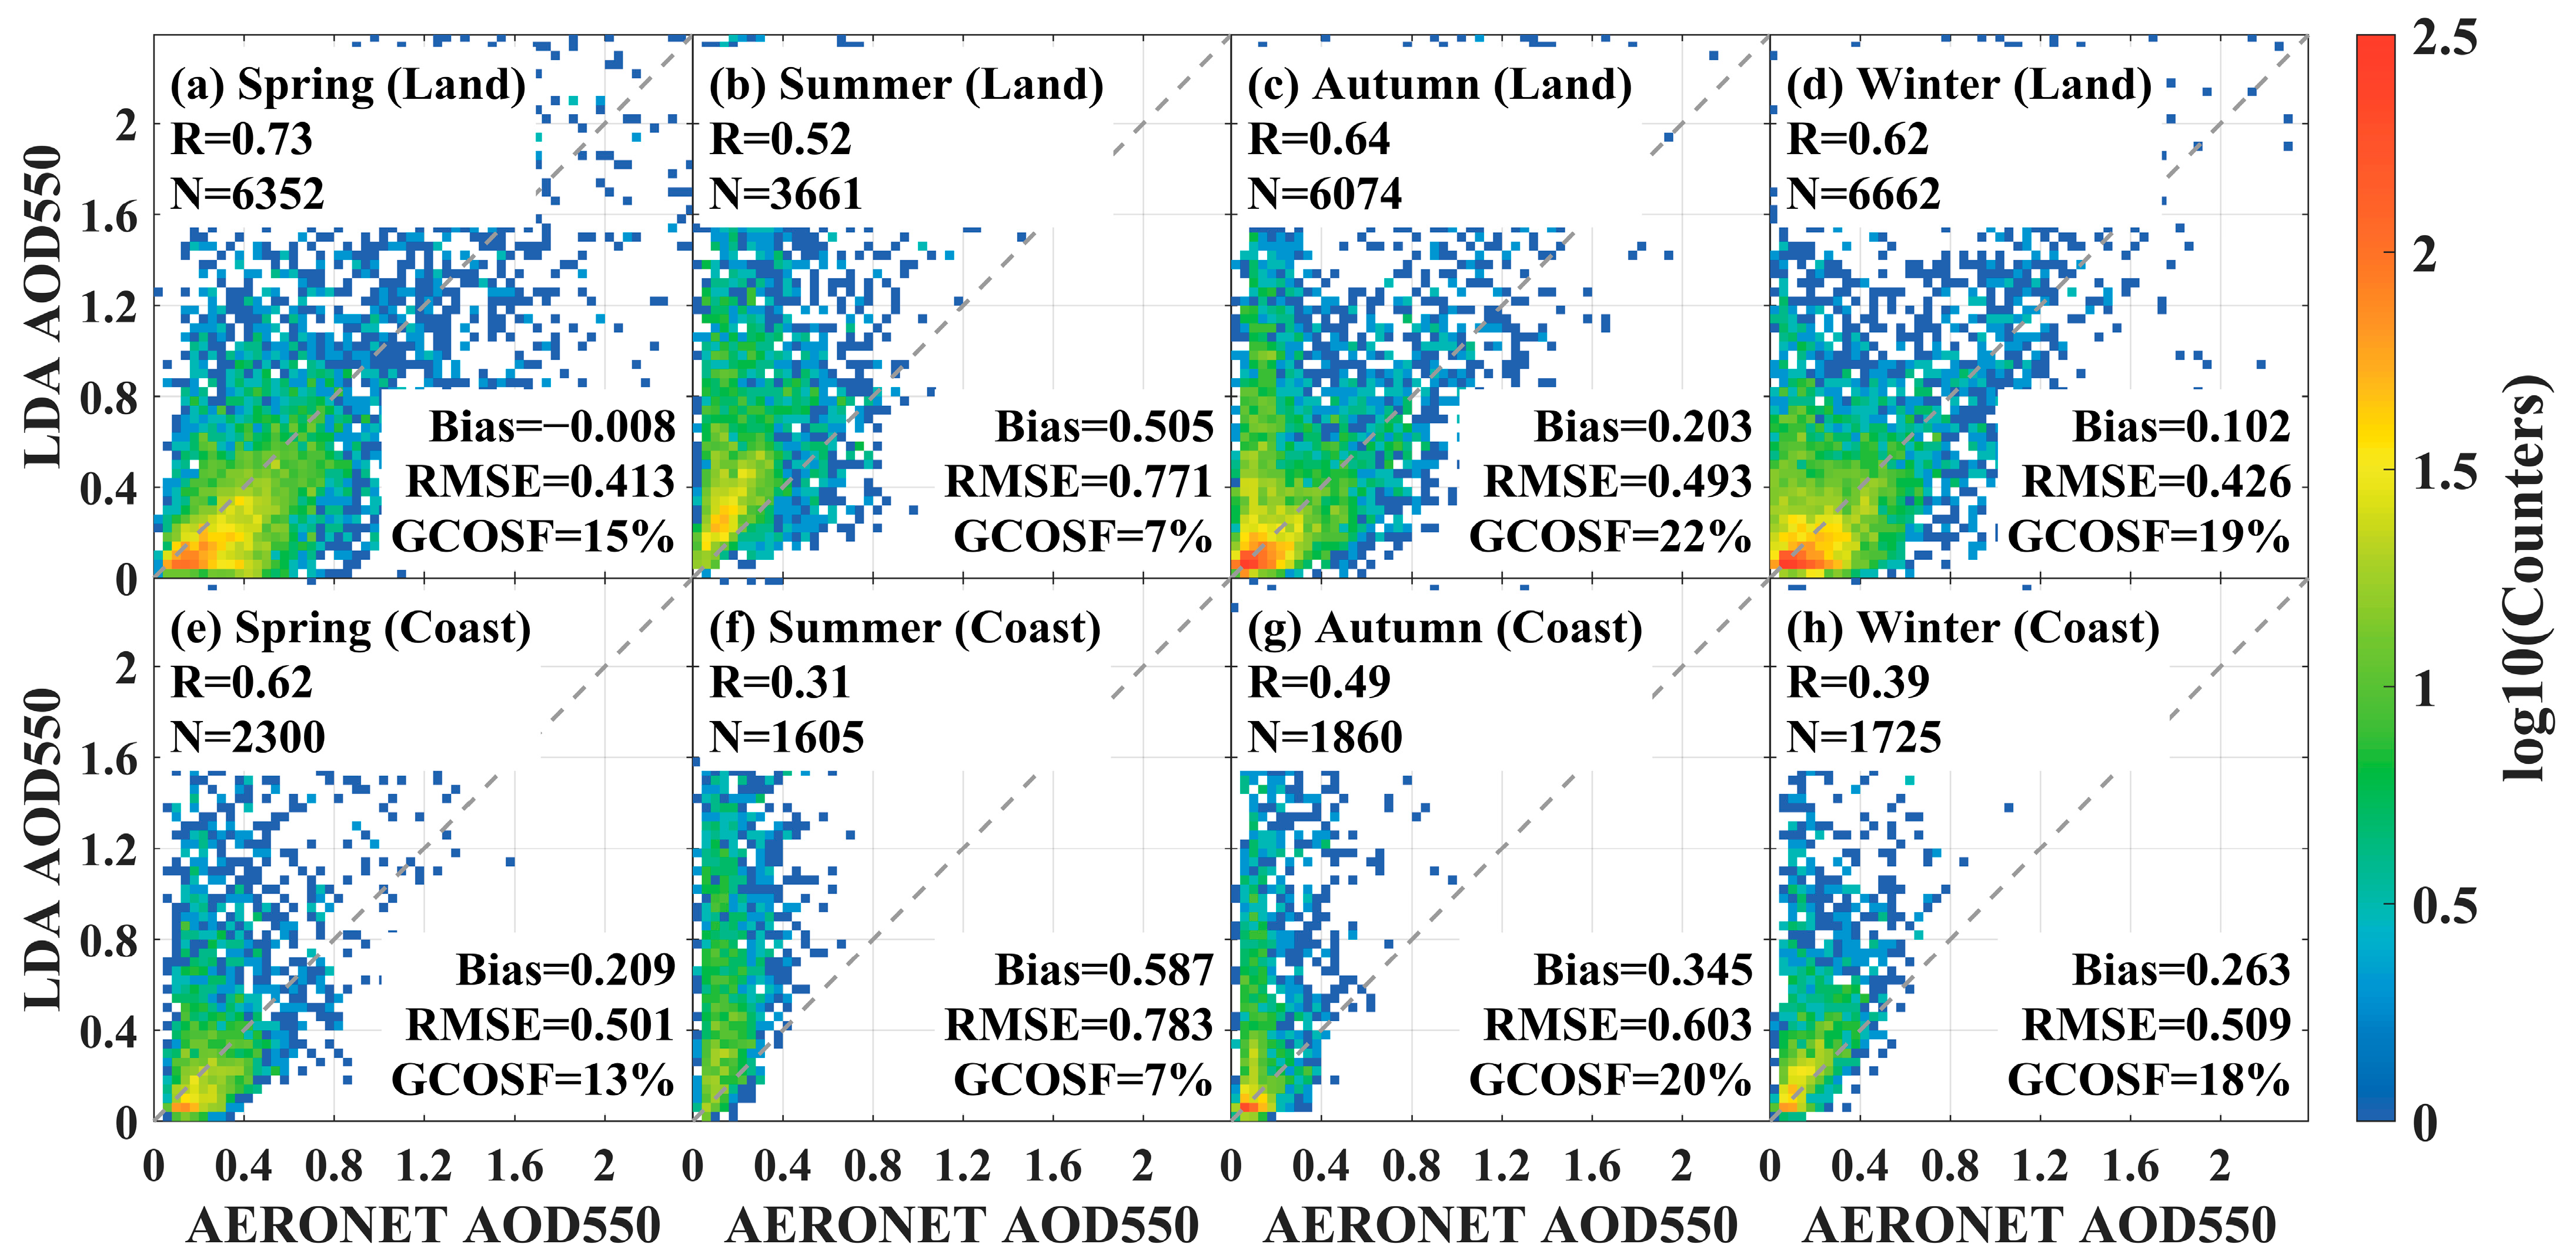
3.1.2. Regional Validation
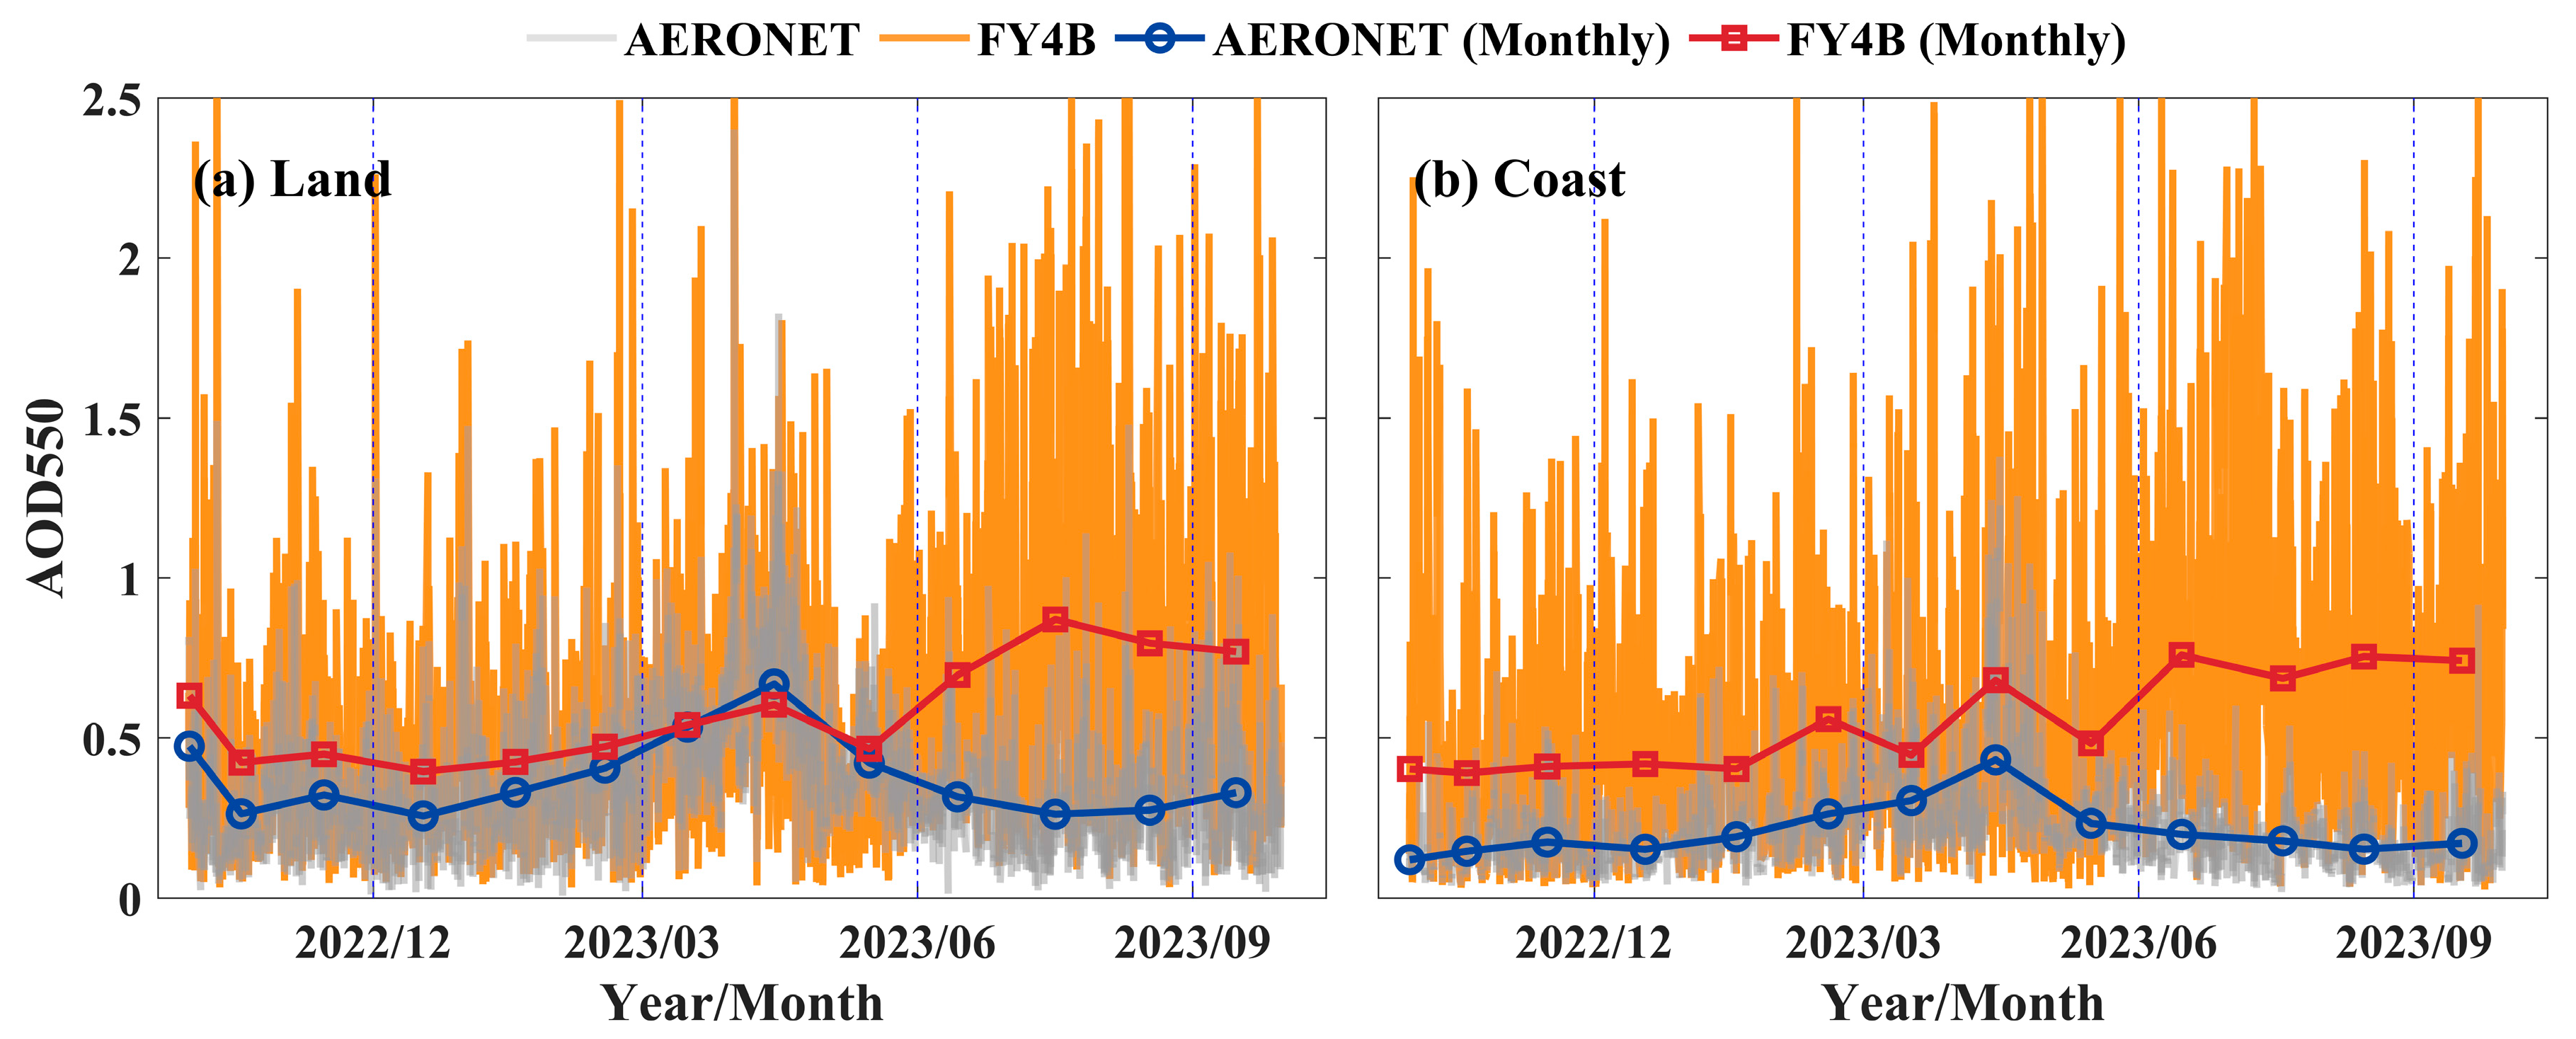
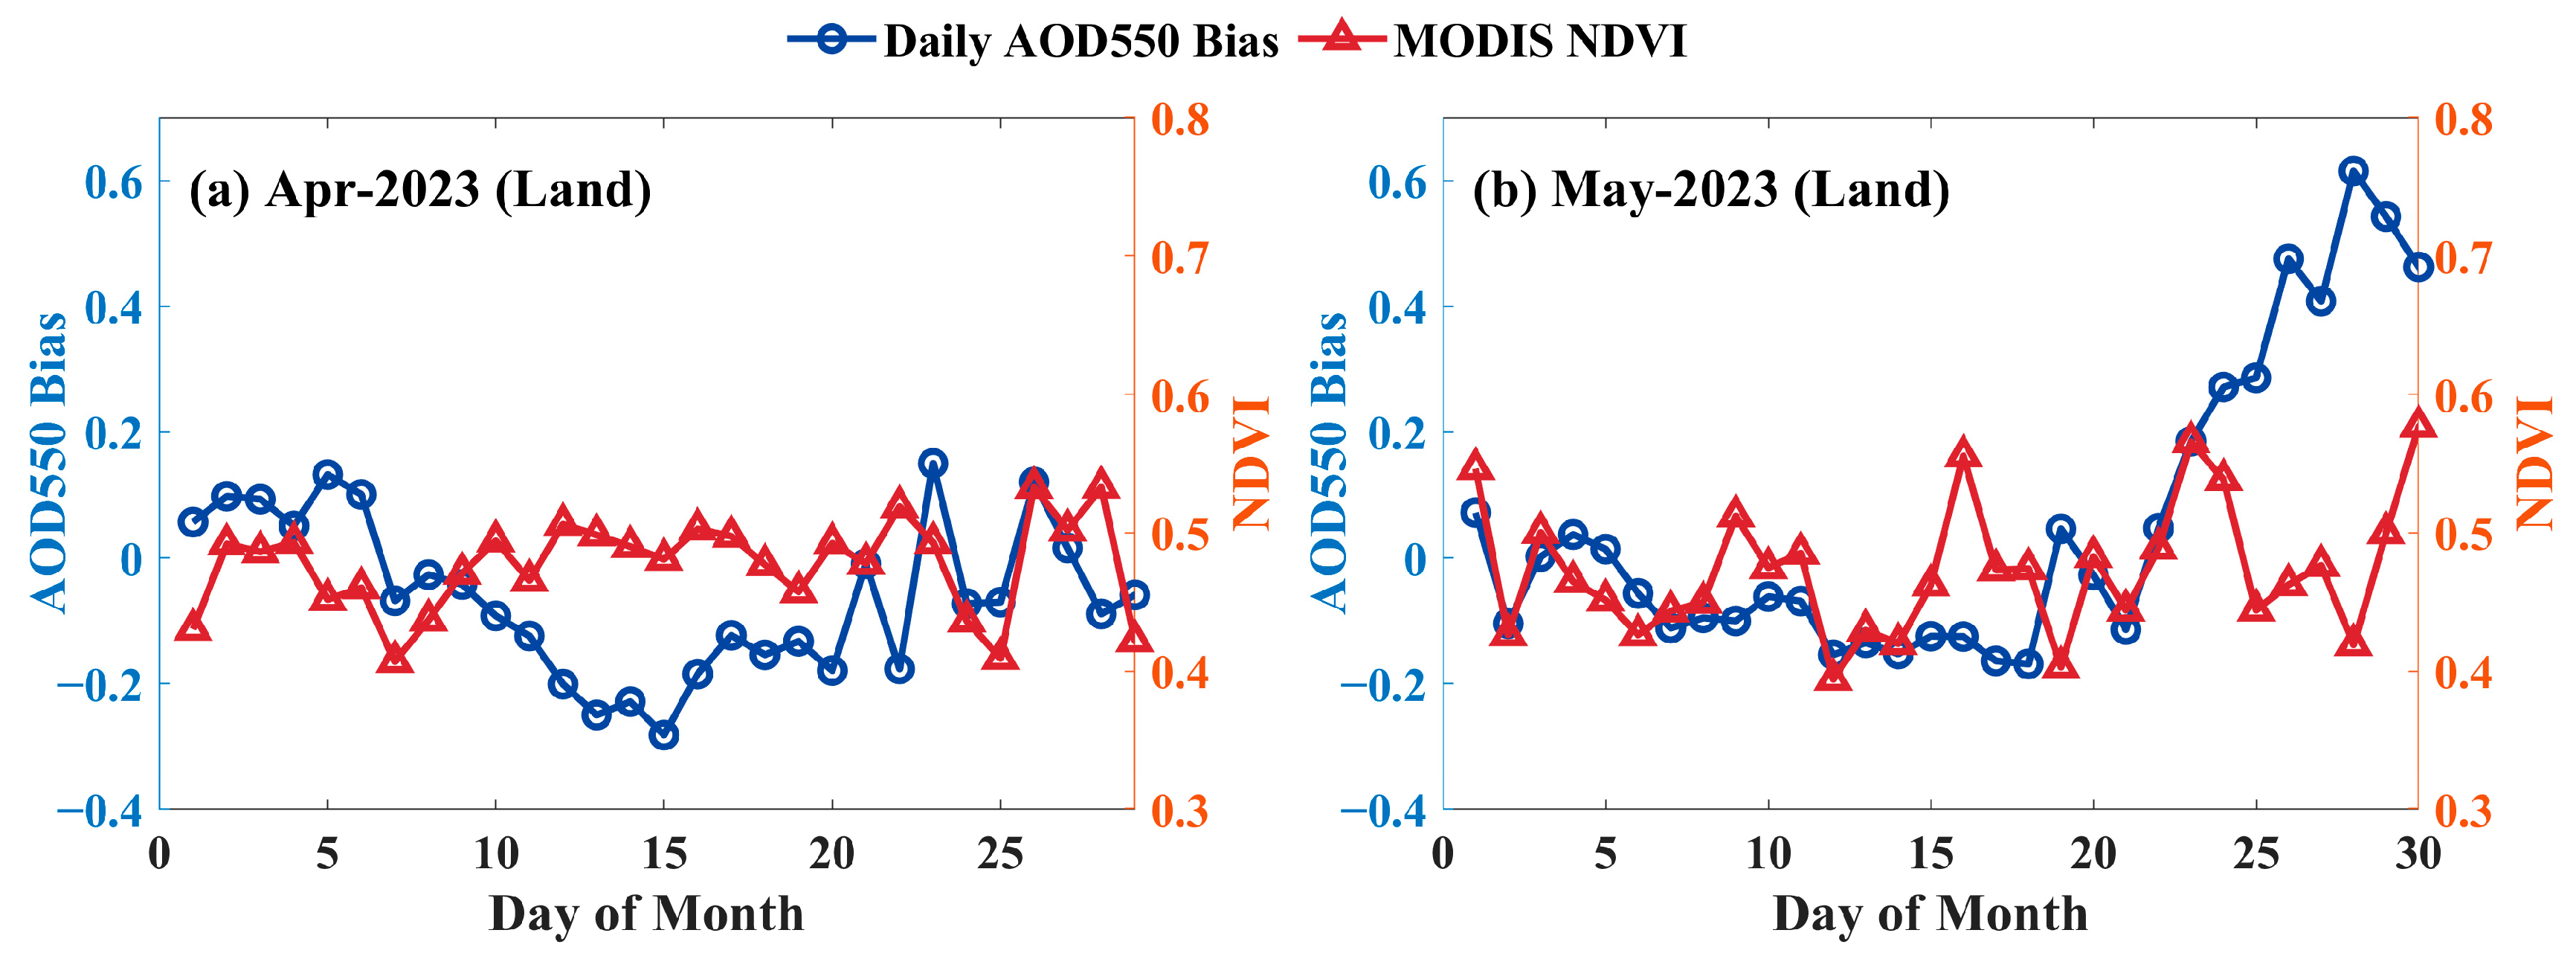
3.1.3. Temporal Validation
3.2. Dependence Analysis
3.2.1. Aerosol Type Dependence Analysis
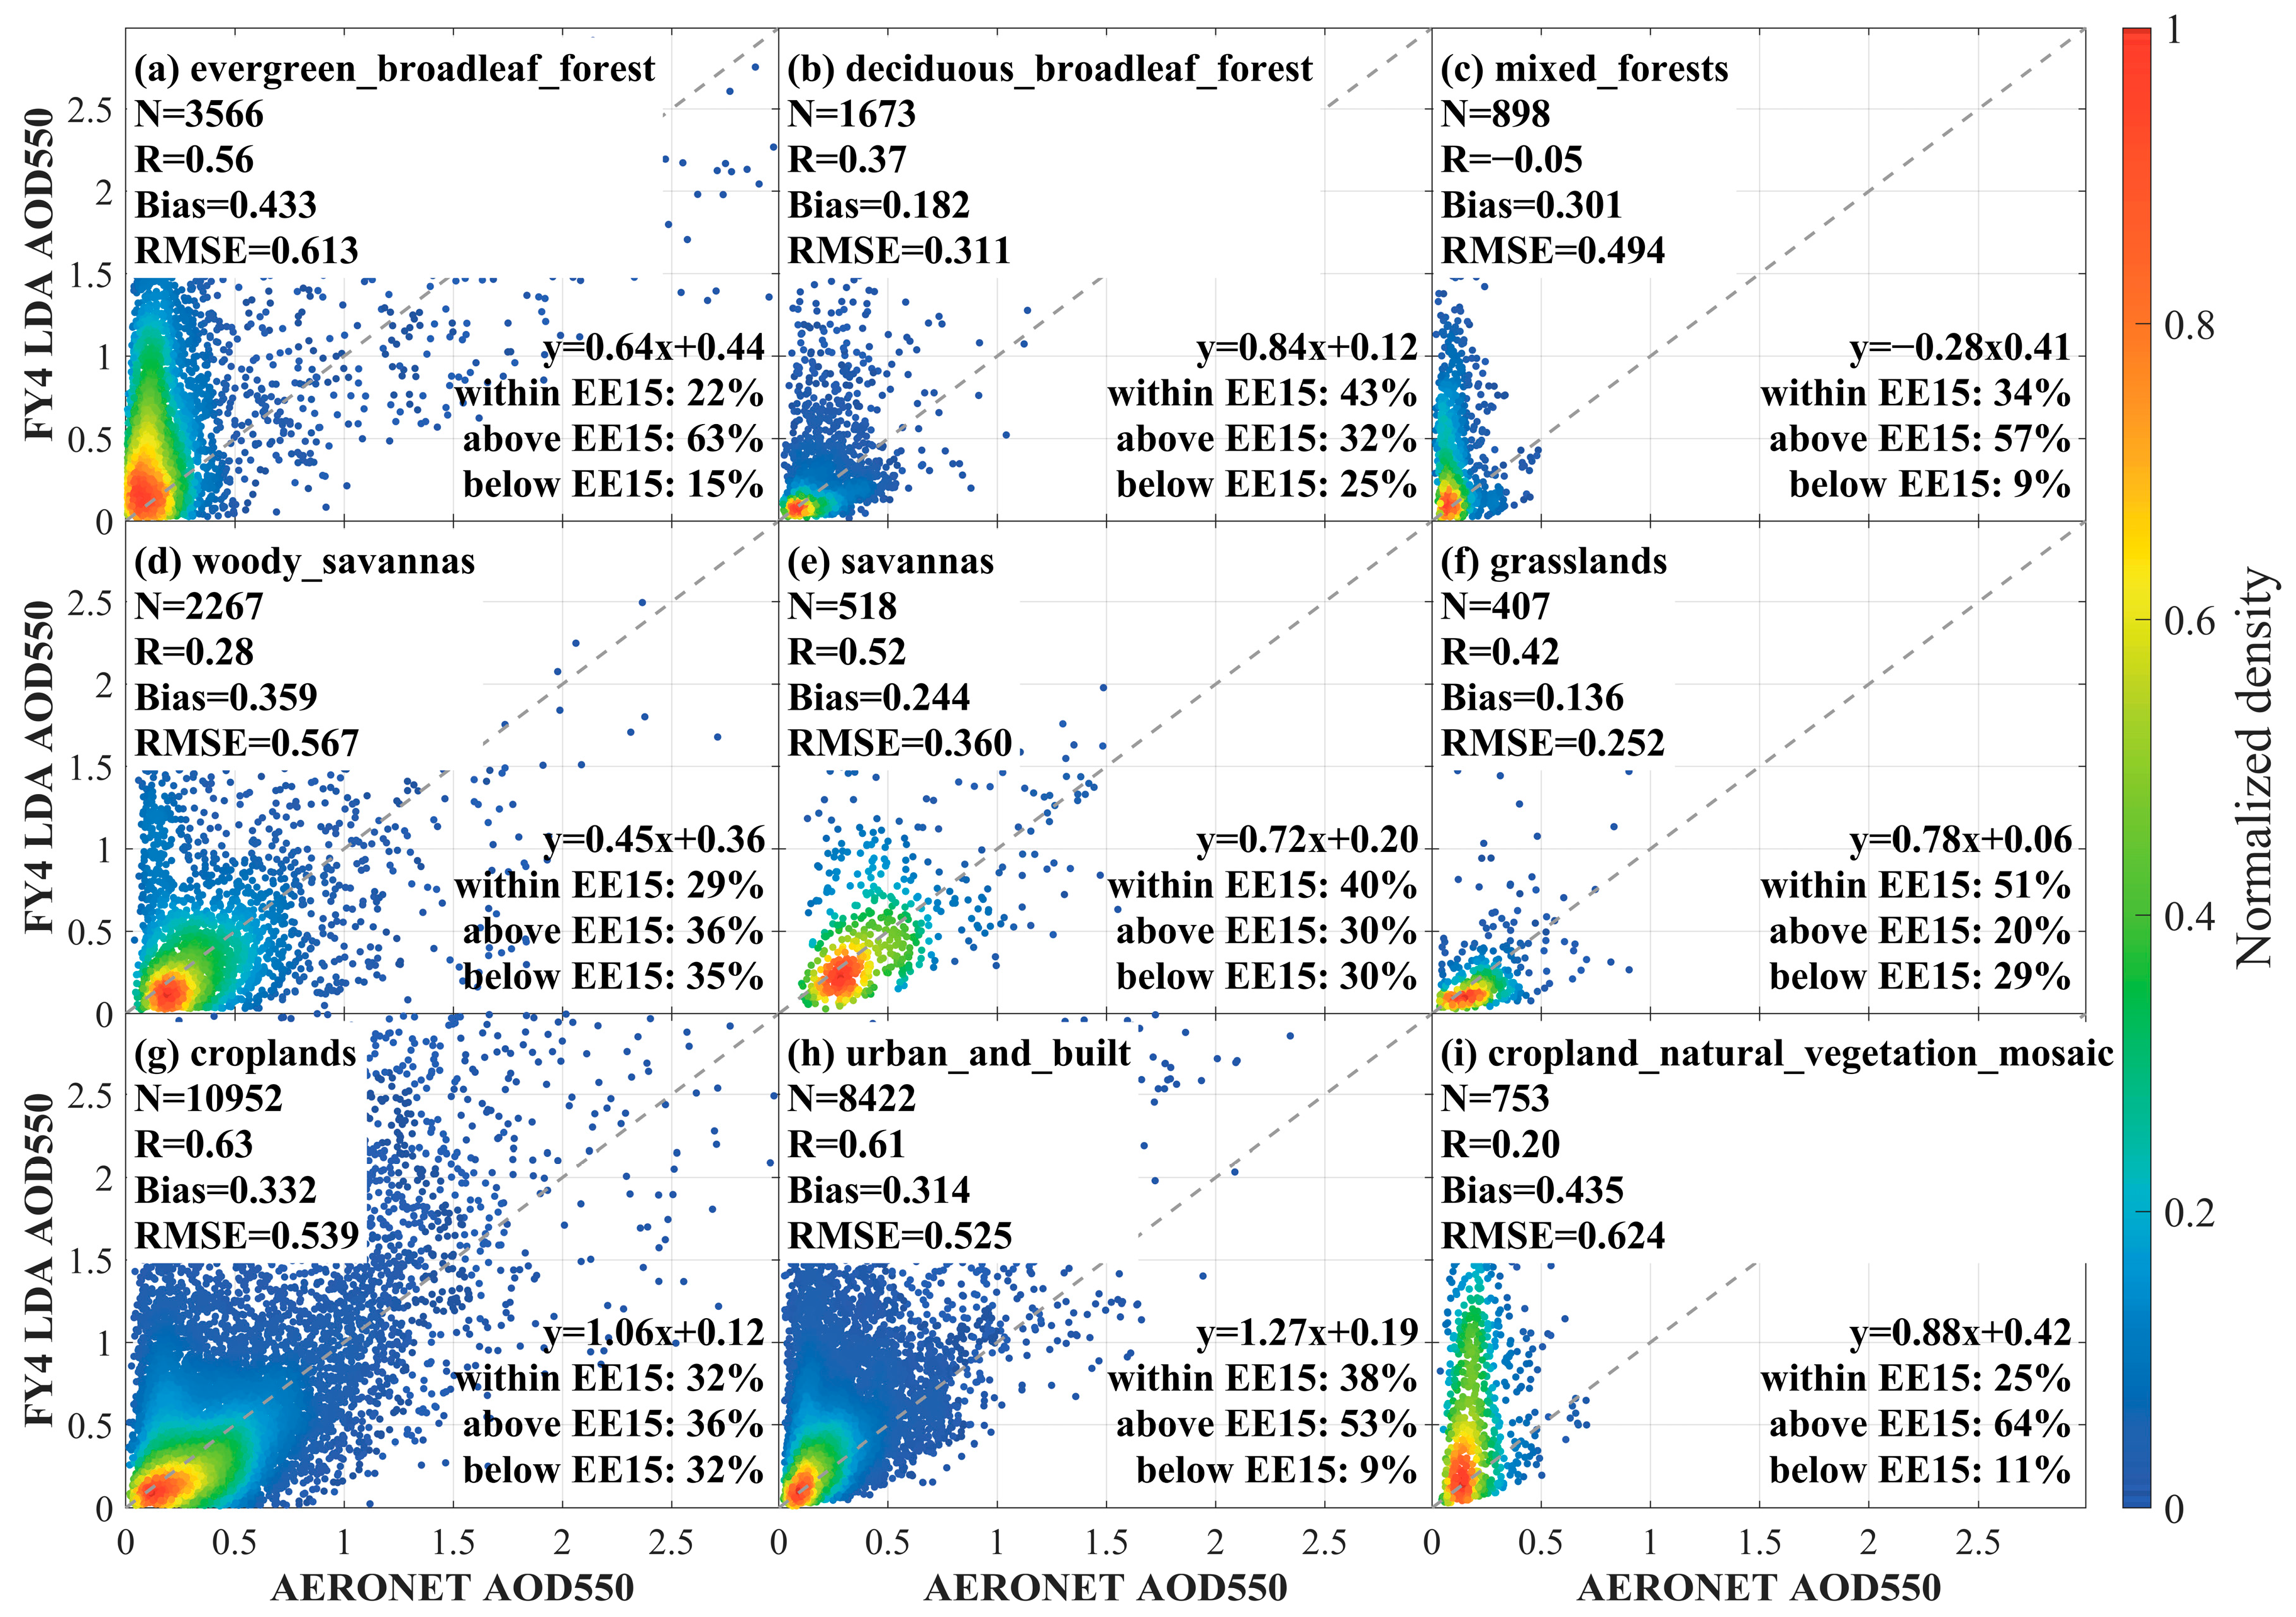
3.2.2. Surface Type Dependence Analysis
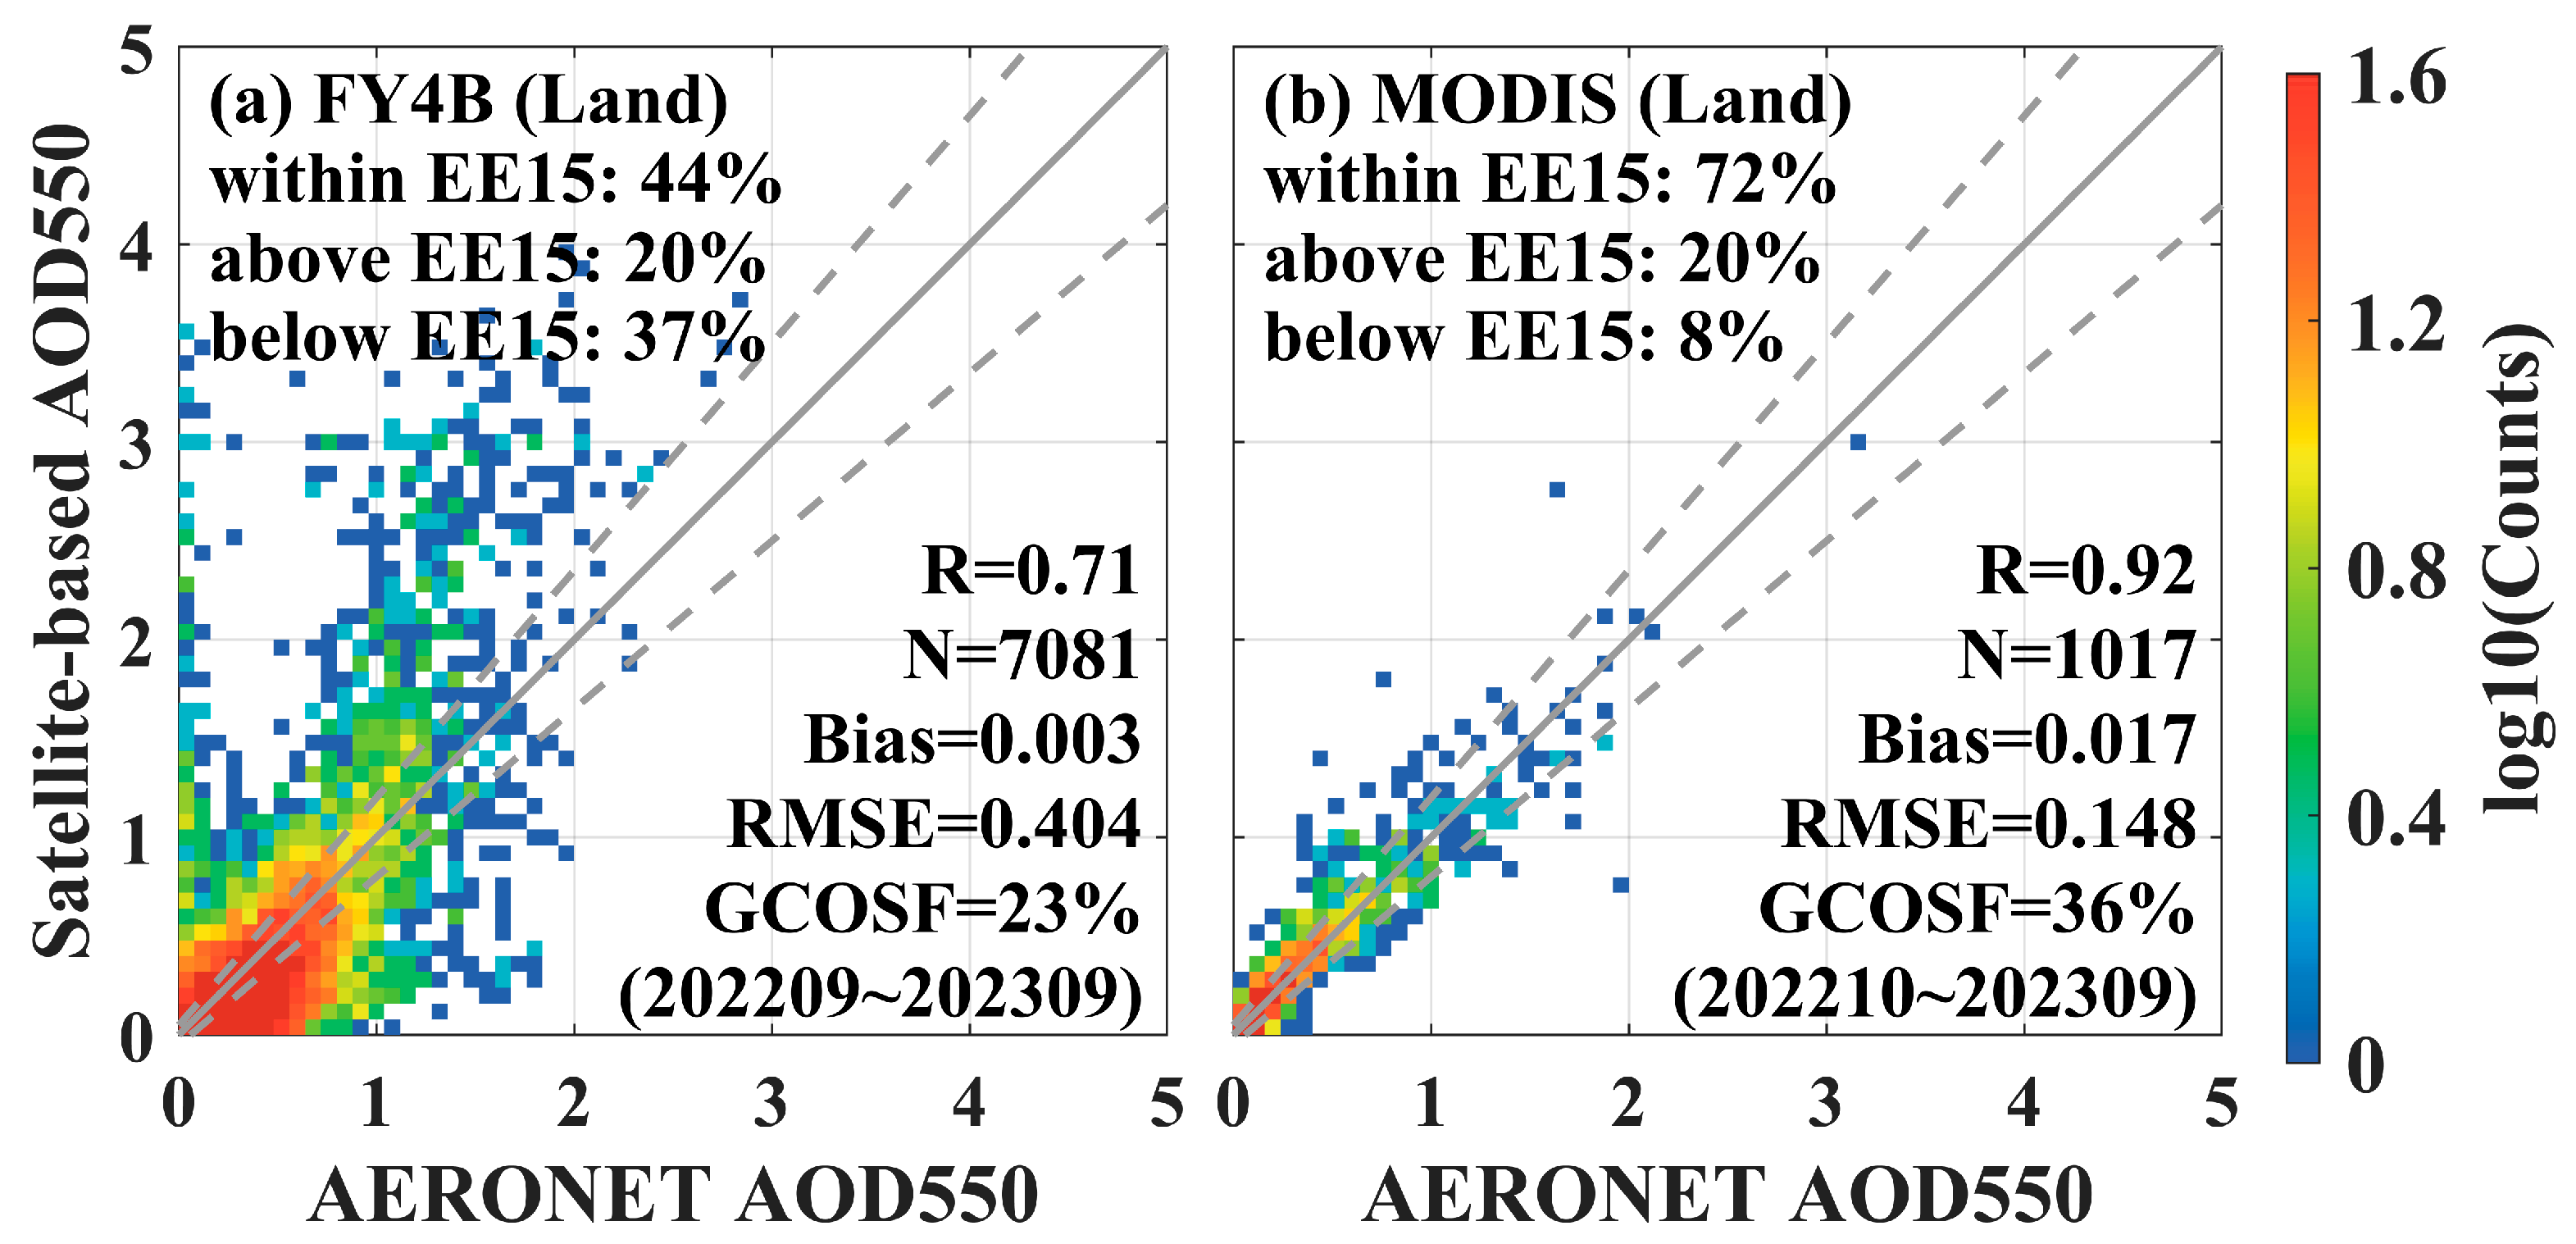
3.3. Comparison with Other Sensors
4. Discussion and Application Analysis
5. Conclusions
- (1)
- Validation results based on AERONET ground-based data indicated that LDA AOD is moderately consistent with ground-based measurements (R = 0.55, Bias = 0.328, RMSE = 0.533, within EE15 = 34%). The LDA AOD in the southern coastal and western plateau regions of China is easy to overestimate.
- (2)
- Analysis results in inland and coastal areas indicate that LDA AOD exhibits significant overestimation in coastal regions, and the algorithm’s retrieval performance in coastal (R = 0.43, Bias = 0.334, RMSE = 0.597, GCOSF = 15%) regions is inferior to that in inland areas (R = 0.60, Bias = 0.163, RMSE = 0.509, GCOSF = 17%).
- (3)
- Error analysis revealed that the retrieval bias of LDA AOD was highly dependent on the satellite zenith angle and solar zenith angle, especially in low-angle regions where the bias changed significantly with increasing angle. Additionally, the retrieval bias of LDA AOD was greatly influenced by water vapor content.
- (4)
- Analysis of aerosol type dependence indicated that LDA AOD was significantly affected by the absorption and scattering characteristics of aerosol particles. Moderately absorbing and strongly absorbing aerosols had a greater impact on the retrieval bias of LDA AOD, while non-absorbing and slightly absorbing aerosols had a smaller effect on the bias of LDA AOD.
- (5)
- The LDA AOD algorithm performs more reliably in inland areas, regions with stable NDVI, or conditions with lower water vapor content. Analysis results of aerosol type dependence indicate that the LDA AOD algorithm is more accurate when the proportion of fine particulate aerosols is lower or the aerosol absorption capacity is weaker. Additionally, during the spring or morning hours, LDA AOD shows greater consistency with AERONET measurements when atmospheric conditions are more stable.
Author Contributions
Funding
Institutional Review Board Statement
Informed Consent Statement
Data Availability Statement
Acknowledgments
Conflicts of Interest
References
- Liu, X.; Chen, Q.; Che, H.; Zhang, R.; Gui, K.; Zhang, H.; Zhao, T. Spatial distribution and temporal variation of aerosol optical depth in the Sichuan basin, China, the recent ten years. Atmos. Environ. 2016, 147, 434–445. [Google Scholar] [CrossRef]
- Rosenfeld, D.; Dai, J.; Yu, X.; Yao, Z.; Xu, X.; Yang, X.; Du, C. Inverse relations between amounts of air pollution and orographic precipitation. Science 2007, 315, 1396–1398. [Google Scholar] [CrossRef] [PubMed]
- Lin, C.; Liu, G.; Lau, A.K.H.; Li, Y.; Li, C.; Fung, J.C.H.; Lao, X.Q. High-resolution satellite remote sensing of provincial PM2. 5 trends in China from 2001 to 2015. Atmos. Environ. 2018, 180, 110–116. [Google Scholar] [CrossRef]
- Pope III, C.A.; Burnett, R.T.; Krewski, D.; Jerrett, M.; Shi, Y.; Calle, E.E.; Thun, M.J. Cardiovascular mortality and exposure to airborne fine particulate matter and cigarette smoke: Shape of the exposure-response relationship. Circulation 2009, 120, 941–948. [Google Scholar] [CrossRef] [PubMed]
- Twomey, S. Aerosols, clouds and radiation. Atmos. Environment. Part A Gen. Top. 1991, 25, 2435–2442. [Google Scholar] [CrossRef]
- Yu, L.; Zhang, M.; Wang, L.; Lu, Y.; Li, J. Effects of aerosols and water vapour on spatial-temporal variations of the clear-sky surface solar radiation in China. Atmos. Res. 2021, 248, 105162. [Google Scholar] [CrossRef]
- Li, Y.; Xue, Y.; Guang, J.; She, L.; Fan, C.; Chen, G. Ground-level PM2. 5 concentration estimation from satellite data in the Beijing area using a specific particle swarm extinction mass conversion algorithm. Remote Sens. 2018, 10, 1906. [Google Scholar] [CrossRef]
- Holben, B.N.; Eck, T.F.; Slutsker, I.a.; Tanré, D.; Buis, J.; Setzer, A.; Vermote, E.; Reagan, J.A.; Kaufman, Y.; Nakajima, T. AERONET—A federated instrument network and data archive for aerosol characterization. Remote Sens. Environ. 1998, 66, 1–16. [Google Scholar] [CrossRef]
- Holben, B.N.; Tanré, D.; Smirnov, A.; Eck, T.; Slutsker, I.; Abuhassan, N.; Newcomb, W.; Schafer, J.; Chatenet, B.; Lavenu, F. An emerging ground-based aerosol climatology: Aerosol optical depth from AERONET. J. Geophys. Res. Atmos. 2001, 106, 12067–12097. [Google Scholar] [CrossRef]
- Sun, X.; Sun, L.; Sun, Y.; Zhang, J.; Fan, X.; Ma, C. Inversion of Aerosol Optical Depth: Incorporating Multi-Model Approach. IEEE Trans. Geosci. Remote Sens. 2024, 62, 4104612. [Google Scholar]
- Bao, F.; Gu, X.; Cheng, T.; Wang, Y.; Guo, H.; Chen, H.; Wei, X.; Xiang, K.; Li, Y. High-spatial-resolution aerosol optical properties retrieval algorithm using Chinese high-resolution earth observation satellite I. IEEE Trans. Geosci. Remote Sens. 2016, 54, 5544–5552. [Google Scholar] [CrossRef]
- Jin, S.; Zhang, M.; Ma, Y.; Gong, W.; Chen, C.; Yang, L.; Hu, X.; Liu, B.; Chen, N.; Du, B. Adapting the dark target algorithm to advanced MERSI sensor on the FengYun-3-D satellite: Retrieval and validation of aerosol optical depth over land. IEEE Trans. Geosci. Remote Sens. 2021, 59, 8781–8797. [Google Scholar] [CrossRef]
- Fan, X.; Qu, Y. Retrieval of high spatial resolution aerosol optical depth from HJ-1 A/B CCD data. Remote Sens. 2019, 11, 832. [Google Scholar] [CrossRef]
- Sun, L.; Wei, J.; Bilal, M.; Tian, X.; Jia, C.; Guo, Y.; Mi, X. Aerosol optical depth retrieval over bright areas using Landsat 8 OLI images. Remote Sens. 2015, 8, 23. [Google Scholar] [CrossRef]
- Hsu, N.; Lee, J.; Sayer, A.; Kim, W.; Bettenhausen, C.; Tsay, S.C. VIIRS Deep Blue aerosol products over land: Extending the EOS long-term aerosol data records. J. Geophys. Res. Atmos. 2019, 124, 4026–4053. [Google Scholar] [CrossRef]
- Kaufman, Y.J.; Wald, A.E.; Remer, L.A.; Gao, B.-C.; Li, R.-R.; Flynn, L. The MODIS 2.1-/spl mu/m channel-correlation with visible reflectance for use in remote sensing of aerosol. IEEE Trans. Geosci. Remote Sens. 1997, 35, 1286–1298. [Google Scholar] [CrossRef]
- Li, L.; Franklin, M.; Girguis, M.; Lurmann, F.; Wu, J.; Pavlovic, N.; Breton, C.; Gilliland, F.; Habre, R. Spatiotemporal imputation of MAIAC AOD using deep learning with downscaling. Remote Sens. Environ. 2020, 237, 111584. [Google Scholar] [CrossRef] [PubMed]
- Xie, Y.; Li, Z.; Guang, J.; Hou, W.; Salam, A.; Ali, Z.; Fang, L. Aerosol optical depth retrieval over south Asia using FY-4A/AGRI data. IEEE Trans. Geosci. Remote Sens. 2021, 60, 4104814. [Google Scholar] [CrossRef]
- Su, X.; Wang, L.; Zhang, M.; Qin, W.; Bilal, M. A high-precision aerosol retrieval algorithm (HiPARA) for advanced Himawari imager (AHI) data: Development and verification. Remote Sens. Environ. 2021, 253, 112221. [Google Scholar] [CrossRef]
- Pope Iii, C.A.; Burnett, R.T.; Thun, M.J.; Calle, E.E.; Krewski, D.; Ito, K.; Thurston, G.D. Lung cancer, cardiopulmonary mortality, and long-term exposure to fine particulate air pollution. JAMA Netw. 2002, 287, 1132–1141. [Google Scholar] [CrossRef] [PubMed]
- Jiang, X.; Xue, Y.; Jin, C.; Bai, R.; Sun, Y.; Wu, S. A Simple Band Ratio Library (BRL) Algorithm for Retrieval of Hourly Aerosol Optical Depth Using FY-4A AGRI Geostationary Satellite Data. Remote Sens. 2022, 14, 4861. [Google Scholar] [CrossRef]
- Su, X.; Wang, L.; Cao, M.; Yang, L.; Zhang, M.; Qin, W.; Cao, Q.; Yang, Y.; Li, L. Fengyun 4A Land Aerosol Retrieval: Algorithm Development, Validation, and Comparison with other datasets. IEEE Trans. Geosci. Remote Sens. 2023, 61, 4107516. [Google Scholar] [CrossRef]
- Bessho, K.; Date, K.; Hayashi, M.; Ikeda, A.; Imai, T.; Inoue, H.; Kumagai, Y.; Miyakawa, T.; Murata, H.; Ohno, T. An introduction to Himawari-8/9—Japan’s new-generation geostationary meteorological satellites. J. Meteorol. Soc. Jpn. Ser. II 2016, 94, 151–183. [Google Scholar] [CrossRef]
- Wang, W.; Mao, F.; Pan, Z.; Gong, W.; Yoshida, M.; Zou, B.; Ma, H. Evaluating aerosol optical depth from Himawari-8 with sun photometer network. J. Geophys. Res. Atmos. 2019, 124, 5516–5538. [Google Scholar] [CrossRef]
- Xu, W.; Wang, W.; Wang, N.; Chen, B. A new algorithm for Himawari-8 aerosol optical depth retrieval by integrating regional PM2.5 concentrations. IEEE Trans. Geosci. Remote Sens. 2022, 60, 4106711. [Google Scholar]
- Fukuda, S.; Nakajima, T.; Takenaka, H.; Higurashi, A.; Kikuchi, N.; Nakajima, T.Y.; Ishida, H. New approaches to removing cloud shadows and evaluating the 380 nm surface reflectance for improved aerosol optical thickness retrievals from the GOSAT/TANSO-Cloud and Aerosol Imager. J. Geophys. Res. Atmos. 2013, 118, 13520–13531. [Google Scholar] [CrossRef]
- Higurashi, A.; Nakajima, T. Development of a two-channel aerosol retrieval algorithm on a global scale using NOAA AVHRR. J. Atmos. Sci. 1999, 56, 924–941. [Google Scholar] [CrossRef]
- Yoshida, M.; Kikuchi, M.; Nagao, T.M.; Murakami, H.; Nomaki, T.; Higurashi, A. Common retrieval of aerosol properties for imaging satellite sensors. J. Meteorol. Soc. Jpn. Ser. II 2018, 96B, 193–209. [Google Scholar] [CrossRef]
- Loveland, T.R.; Reed, B.C.; Brown, J.F.; Ohlen, D.O.; Zhu, Z.; Yang, L.; Merchant, J.W. Development of a global land cover characteristics database and IGBP DISCover from 1 km AVHRR data. Int. J. Remote Sens. 2000, 21, 1303–1330. [Google Scholar] [CrossRef]
- Friedl, M.A.; Sulla-Menashe, D.; Tan, B.; Schneider, A.; Ramankutty, N.; Sibley, A.; Huang, X. MODIS Collection 5 global land cover: Algorithm refinements and characterization of new datasets. Remote Sens. Environ. 2010, 114, 168–182. [Google Scholar] [CrossRef]
- Friedl, M.A.; McIver, D.K.; Hodges, J.C.; Zhang, X.Y.; Muchoney, D.; Strahler, A.H.; Woodcock, C.E.; Gopal, S.; Schneider, A.; Cooper, A. Global land cover mapping from MODIS: Algorithms and early results. Remote Sens. Environ. 2002, 83, 287–302. [Google Scholar] [CrossRef]
- Huete, A.; Didan, K.; Miura, T.; Rodriguez, E.P.; Gao, X.; Ferreira, L.G. Overview of the radiometric and biophysical performance of the MODIS vegetation indices. Remote Sens. Environ. 2002, 83, 195–213. [Google Scholar] [CrossRef]
- van Leeuwen, W.J.; Huete, A.R.; Laing, T.W. MODIS vegetation index compositing approach: A prototype with AVHRR data. Remote Sens. Environ. 1999, 69, 264–280. [Google Scholar] [CrossRef]
- Lyapustin, A.; Wang, Y.; Korkin, S.; Huang, D. MODIS collection 6 MAIAC algorithm. Atmos. Meas. Tech. 2018, 11, 5741–5765. [Google Scholar] [CrossRef]
- Lyapustin, A.; Wang, Y.; Laszlo, I.; Kahn, R.; Korkin, S.; Remer, L.; Levy, R.; Reid, J. Multiangle implementation of atmospheric correction (MAIAC): 2. Aerosol algorithm. J. Geophys. Res. Atmos. 2011, 116, D3. [Google Scholar] [CrossRef]
- Zhang, Z.; Wu, W.; Fan, M.; Wei, J.; Tan, Y.; Wang, Q. Evaluation of MAIAC aerosol retrievals over China. Atmos. Environ. 2019, 202, 8–16. [Google Scholar] [CrossRef]
- Ångström, A. On the atmospheric transmission of sun radiation and on dust in the air. Geogr. Ann. 1929, 11, 156–166. [Google Scholar]
- Lee, J.; Kim, J.; Song, C.; Kim, S.; Chun, Y.; Sohn, B.; Holben, B. Characteristics of aerosol types from AERONET sunphotometer measurements. Atmos. Environ. 2010, 44, 3110–3117. [Google Scholar] [CrossRef]
- Mielonen, T.; Arola, A.; Komppula, M.; Kukkonen, J.; Koskinen, J.; De Leeuw, G.; Lehtinen, K. Comparison of CALIOP level 2 aerosol subtypes to aerosol types derived from AERONET inversion data. Geophys. Res. Lett. 2009, 36, 18. [Google Scholar] [CrossRef]
- Levy, R.; Remer, L.; Kleidman, R.; Mattoo, S.; Ichoku, C.; Kahn, R.; Eck, T. Global evaluation of the Collection 5 MODIS dark-target aerosol products over land. Atmos. Chem. Phys. 2010, 10, 10399–10420. [Google Scholar] [CrossRef]
- Jiang, T.; Chen, B.; Chan, K.K.Y.; Xu, B. Himawari-8/AHI and MODIS aerosol optical depths in China: Evaluation and comparison. Remote Sens. 2019, 11, 1011. [Google Scholar] [CrossRef]
- Huang, J.; Kondragunta, S.; Laszlo, I.; Liu, H.; Remer, L.A.; Zhang, H.; Superczynski, S.; Ciren, P.; Holben, B.N.; Petrenko, M. Validation and expected error estimation of Suomi-NPP VIIRS aerosol optical thickness and Ångström exponent with AERONET. J. Geophys. Res. Atmos. 2016, 121, 7139–7160. [Google Scholar] [CrossRef]
- GCOS. Systematic Observation Requirements for Satellite-Based Products for Climate; 2011 Update, Supplemental Details to the Satellite Based Component of the “Implementation Plan for the Global Observing System for Climate in Support of the UNFCCC (2010 Update)”, GCOS-154; World Meteorological Organization: Geneva, Switzerland, 2011. [Google Scholar]
- Popp, T.; De Leeuw, G.; Bingen, C.; Brühl, C.; Capelle, V.; Chedin, A.; Clarisse, L.; Dubovik, O.; Grainger, R.; Griesfeller, J. Development, production and evaluation of aerosol climate data records from European satellite observations (Aerosol_cci). Remote Sens. 2016, 8, 421. [Google Scholar] [CrossRef]
- Levy, R.C.; Remer, L.A.; Mattoo, S.; Vermote, E.F.; Kaufman, Y.J. Second-generation operational algorithm: Retrieval of aerosol properties over land from inversion of Moderate Resolution Imaging Spectroradiometer spectral reflectance. J. Geophys. Res. Atmos. 2007, 112, D13211. [Google Scholar] [CrossRef]
- Sun, Z.; Wei, J.; Zhang, N.; He, Y.; Sun, Y.; Liu, X.; Yu, H.; Sun, L. Retrieving High-Resolution Aerosol Optical Depth from GF-4 PMS Imagery in Eastern China. Remote Sens. 2021, 13, 3752. [Google Scholar] [CrossRef]
- Ge, B.; Li, Z.; Chen, C.; Hou, W.; Xie, Y.; Zhu, S.; Qie, L.; Zhang, Y.; Li, K.; Xu, H. An improved aerosol optical depth retrieval algorithm for multiangle directional polarimetric camera (DPC). Remote Sens. 2022, 14, 4045. [Google Scholar] [CrossRef]
- Che, H.; Qi, B.; Zhao, H.; Xia, X.; Eck, T.F.; Goloub, P.; Dubovik, O.; Estelles, V.; Cuevas-Agulló, E.; Blarel, L. Aerosol optical properties and direct radiative forcing based on measurements from the China Aerosol Remote Sensing Network (CARSNET) in eastern China. Atmos. Chem. Phys. 2018, 18, 405–425. [Google Scholar] [CrossRef]
- Horowitz, H.M.; Garland, R.M.; Thatcher, M.; Landman, W.A.; Dedekind, Z.; Van der Merwe, J.; Engelbrecht, F.A. Evaluation of climate model aerosol seasonal and spatial variability over Africa using AERONET. Atmos. Chem. Phys. 2017, 17, 13999–14023. [Google Scholar] [CrossRef]
- Wu, Y.; Zhu, J.; Che, H.; Xia, X.; Zhang, R. Column-integrated aerosol optical properties and direct radiative forcing based on sun photometer measurements at a semi-arid rural site in Northeast China. Atmos. Res. 2015, 157, 56–65. [Google Scholar] [CrossRef]
- Dubovik, O.; Holben, B.; Eck, T.F.; Smirnov, A.; Kaufman, Y.J.; King, M.D.; Tanré, D.; Slutsker, I. Variability of absorption and optical properties of key aerosol types observed in worldwide locations. J. Atmos. Sci. 2002, 59, 590–608. [Google Scholar] [CrossRef]
- Wei, J.; Li, Z.; Sun, L.; Peng, Y.; Zhang, Z.; Li, Z.; Su, T.; Feng, L.; Cai, Z.; Wu, H. Evaluation and uncertainty estimate of next-generation geostationary meteorological Himawari-8/AHI aerosol products. Sci. Total Environ. 2019, 692, 879–891. [Google Scholar] [CrossRef] [PubMed]
- Fu, D.; Gueymard, C.A.; Xia, X. Validation of the improved GOES-16 aerosol optical depth product over North America. Atmos. Environ. 2023, 298, 119642. [Google Scholar] [CrossRef]


Disclaimer/Publisher’s Note: The statements, opinions and data contained in all publications are solely those of the individual author(s) and contributor(s) and not of MDPI and/or the editor(s). MDPI and/or the editor(s) disclaim responsibility for any injury to people or property resulting from any ideas, methods, instructions or products referred to in the content. |
© 2024 by the authors. Licensee MDPI, Basel, Switzerland. This article is an open access article distributed under the terms and conditions of the Creative Commons Attribution (CC BY) license (https://creativecommons.org/licenses/by/4.0/).
Share and Cite
Wang, N.; Li, B.; Jin, Z.; Wang, W. Quality Assessment and Application Scenario Analysis of AGRI Land Aerosol Product from the Geostationary Satellite Fengyun-4B in China. Sensors 2024, 24, 5309. https://doi.org/10.3390/s24165309
Wang N, Li B, Jin Z, Wang W. Quality Assessment and Application Scenario Analysis of AGRI Land Aerosol Product from the Geostationary Satellite Fengyun-4B in China. Sensors. 2024; 24(16):5309. https://doi.org/10.3390/s24165309
Chicago/Turabian StyleWang, Nan, Bingqian Li, Zhili Jin, and Wei Wang. 2024. "Quality Assessment and Application Scenario Analysis of AGRI Land Aerosol Product from the Geostationary Satellite Fengyun-4B in China" Sensors 24, no. 16: 5309. https://doi.org/10.3390/s24165309