

New Methodology to Evaluate and Optimize Indoor Ventilation Based on Rapid Response Sensors
 , , and
Abstract
:1. Introduction
2. Materials and Methods
2.1. Studied Spaces
2.2. Sensors
2.3. Methodology
2.3.1. Sampling Strategy of Pollutants Measurement
- Aerosol sprays such as deodorants or perfumes, disinfectant gels, and any other type of personal care products could not be used before handling the Flow 2.0 device. These substances cause important alterations in the measured values of pollutants, mainly VOCs, since they are important emission sources of them [11].
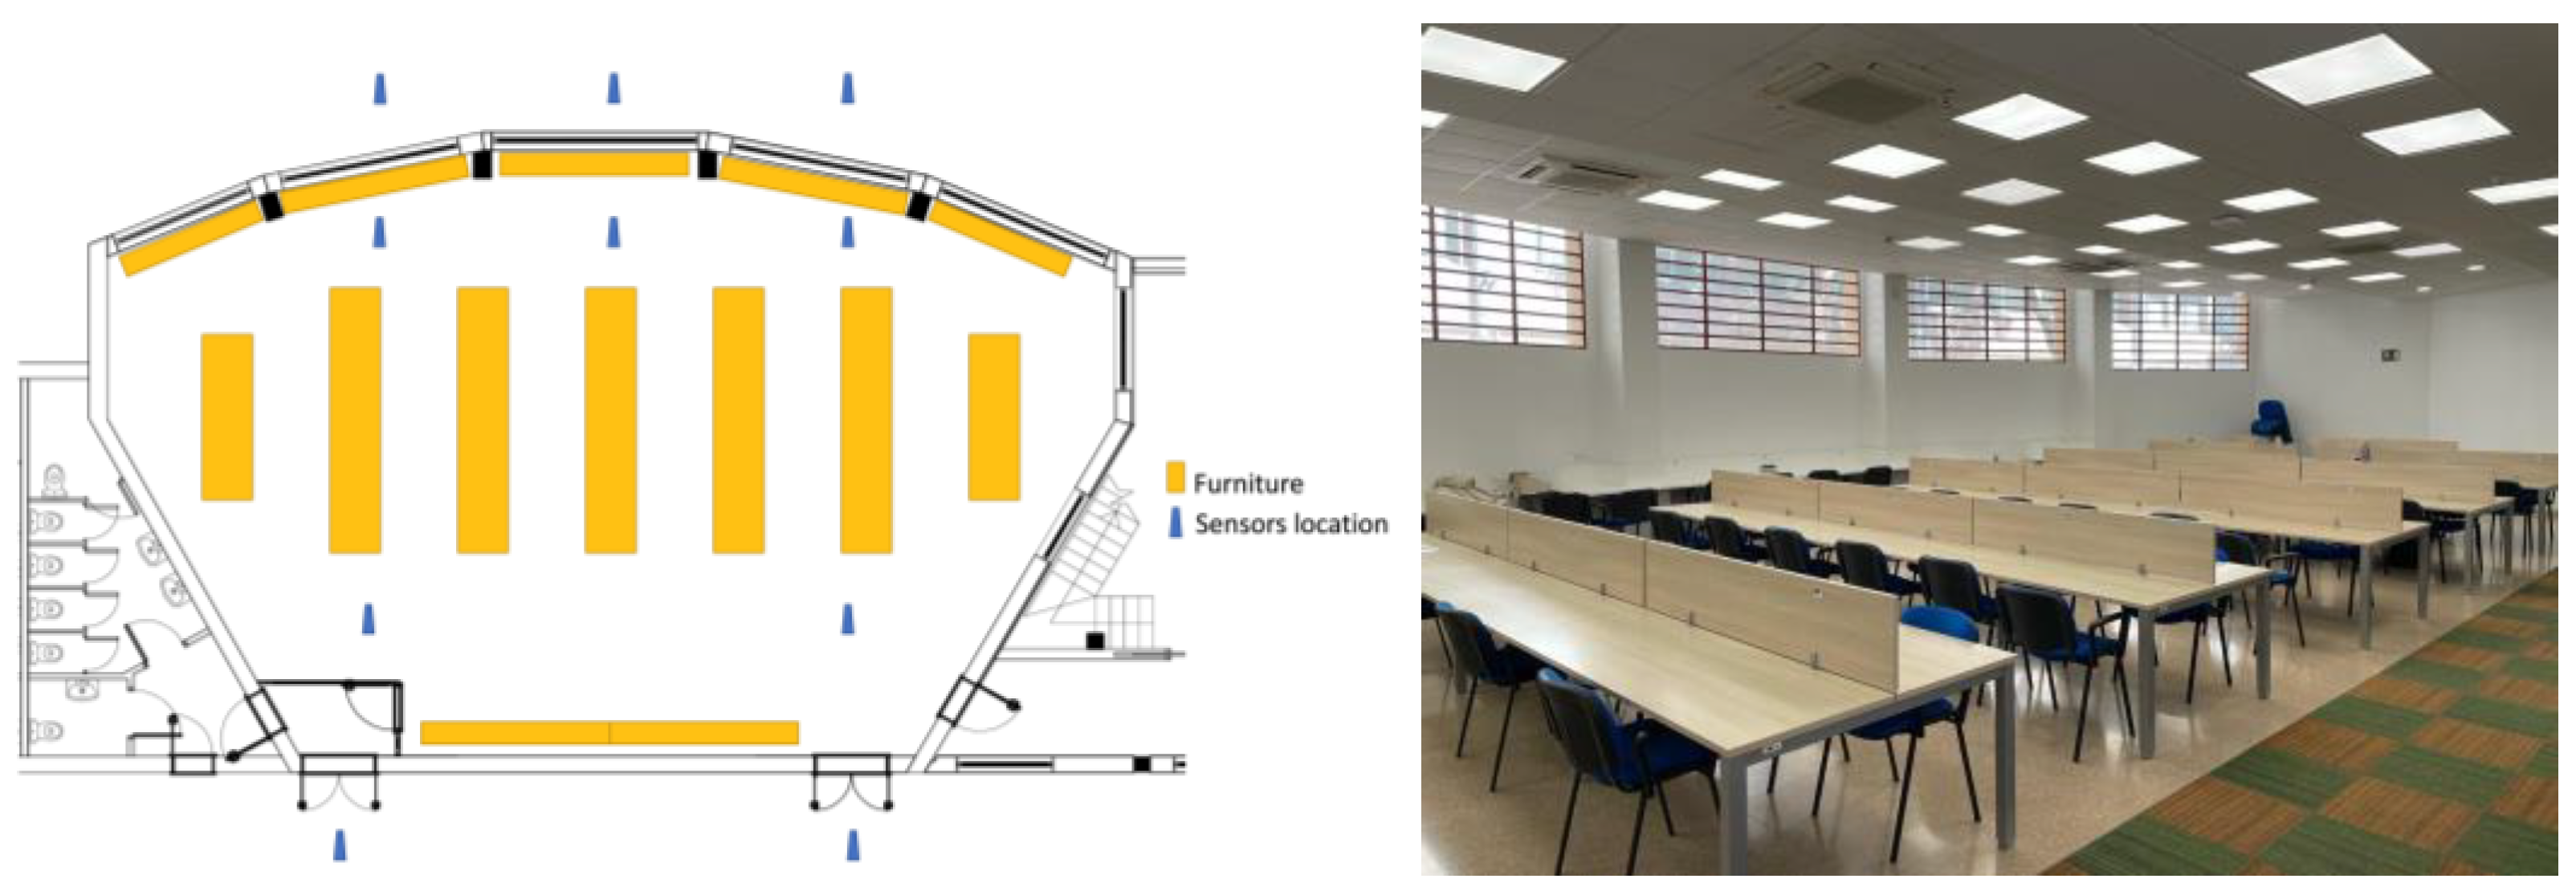
- In every space, there was enough ventilation to guarantee an even mixture of air. This was experimentally verified by measuring at different points of each space (see Figure 1 below). Measurements were always taken once the sensors stabilized to achieve a steady state.
- The devices were placed as far away from doors and windows as possible, in a central position in the space, at a minimum distance of 1 metre from people and at a height of 1 to 1.5 m from the floor. This placement was important in order to avoid external disturbance factors during sampling, such as emitting sources (i.e., human), the airflow from the HVAC system, or make-up air from windows, and to prevent misestimating the actual concentration [42].
- The number of people present in each place during the measurements was recorded.
- Measurements were taken both inside and outside the different studied spaces.
- When the measuring devices were switched on, it was necessary to wait for at least 10 min to ensure that the levels of pollutants monitored by the meters stabilized. After that, the concentration values were recorded for another 10 min. With the data obtained, the mean was calculated and taken as the pollutant concentration value in a stationary state for the calculations.
2.3.2. Ventilation Assessment
Estimation of the Concentration of CO2 in the Stationary State and the Real ACH
Accumulation of CO2 inside + Exit of air
- (i)
- To extract a certain flow of air from the space, it is necessary to introduce the same amount of air into it, ensuring a continuous mass flow. Therefore, the inlet and outlet air flow in the space will be equal: .
- (ii)
- The chemical agent is assumed to be perfectly diluted in the ambient air. Hence, the exhaust air will have the same composition as the air contained in the room: .
- (iii)
- The air volume of the space is constant, and its inlet air flow is typically caused by a constant flow rate, , of air coming directly from the outside. This in turn implies that , where is the measured CO2 concentration on the outside, which is also assumed to remain constant during the process.
- (a)
- in the absence of internal CO2 generation (that is, if , for all ), tends exponentially to the external CO2 concentration, (as one would expect);
- (b)
- if is non-zero, has an extra term which adds to the solution of case a).
Estimation of Average Internal CO2 Generation Rates
Guidelines for Ideal Air Changes per Hour

| Ventilation | Indoor Space | Fb Value (l s−1) |
|---|---|---|
| Prevent COVID-19 contagion | High aerosol generation by singing, loud speaking, aerobic exercise, or close social distance (cafes, restaurants, gyms, transports) | 15 [55] |
| Libraries, study rooms, and offices | 14 [43,56] | |
| Other ordinary workplaces or public spaces | 10 [55] | |
| Minimum required (low-quality air) | Any space | 5 [56] |
Assessment Procedure
- (a)
- Measure the studied space dimensions—width, length, and height—and calculate the air volume of the space, in ;
- (b)
- Use the information of occupancy, , and activity in the space, together with Table 2 and (8), to estimate the average CO2 generation rate due to human activity, ;
- (c)
- Measure the CO2 concentration (in ppm) outside, and inside, of each space for 10 min, once the levels remain relatively constant (stationary state);
- (d)
- Use (7) to estimate the actual ACH, denoted here as , taking place in the space;
- (e)
- Use the information of occupancy and activity in the space, Table 3, and (9) to set the target for air renewals to achieve each of the goals: and ;
- (f)
- The results of the last two computations are then compared, and the 700/1000 ppm limit is checked, to assess the ventilation of the space. If (which is, in turn, greater than ) and the measured , the ventilation of the space is considered adequate to avoid contagion and to maintain good air quality. If only maintaining air quality is considered, the criterion for adequate ventilation is then and . Any other situation would require the implementation of additional measures or the eviction of the space.
2.3.3. Air Quality Assessment
3. Results and Discussion
3.1. Ventilation Assessment
3.2. Air Quality Assessment
3.3. Improvement Proposals
4. Conclusions
Author Contributions
Funding
Institutional Review Board Statement
Informed Consent Statement
Data Availability Statement
Conflicts of Interest
References
- Agarwal, N.; Meena, C.S.; Raj, B.P.; Saini, L.; Kumar, A.; Gopalakrishnan, N.; Kumar, A.; Balam, N.B.; Alam, T.; Kapoor, N.R.; et al. Indoor air quality improvement in COVID-19 pandemic: Review. Sustain. Cities Soc. 2021, 70, 102942. [Google Scholar] [CrossRef]
- WHO (World Health Organization). Health and Environment: Health Impact from Air Pollution; WHO: Geneva, Switzerland, 2016; Available online: https://apps.who.int/gb/ebwha/pdf_files/WHA68/A68_R8-sp.pdf (accessed on 26 January 2023).
- Cesaroni, G.; Badaloni, C.; Gariazzo, C.; Stafoggia, M.; Sozzi, R.; Davoli, M.; Forastiere, F. Long-term exposure to urban air pollution and mortality in a cohort of more than a million adults in Rome. Environ. Health Perspect. 2013, 121, 324–331. [Google Scholar] [CrossRef]
- Tham, K.W. Indoor air quality and its effects on humans—A review of challenges and developments in the last 30 years. Energy Build. 2016, 130, 637–650. [Google Scholar] [CrossRef]
- USEPA (US Environmental Protection Agency). Report of the Environment Indoor Air Quality; USEPA: Washington, DC, USA, 2018. [Google Scholar]
- Cincinelli, A.; Martellini, T.; Amore, A.; Dei, L.; Marrazza, G.; Carretti, E.; Belosi, F.; Ravegnani, F.; Leva, P. Measurement of volatile organic compounds (VOCs) in libraries and archives in Florence (Italy). Sci. Total Environ. 2016, 572, 333–339. [Google Scholar] [CrossRef]
- Baloch, R.M.; Maesano, C.N.; Christoffersen, J.; Banerjee, S.; Gabriel, M.; Csobod, É.; de Oliveira Fernandes, E.; Annesi-Maesano, I.; Csobod, É.; Szuppinger, P.; et al. Indoor air pollution, physical and comfort parameters related to schoolchildren’s health: Data from the European SINPHONIE study. Sci. Total Environ. 2020, 739, 139870. [Google Scholar] [CrossRef]
- Grineski, S.E.; Clark-Reyna, S.E.; Collins, T.W. School-based exposure to hazardous air pollutants and grade point average: A multi-level study. Environ. Res. 2016, 147, 164–171. [Google Scholar] [CrossRef]
- Lewis, A.C.; Jenkins, D.; Whitty, C.J.M. Indoor air pollution: Five ways to fight the hidden harms. Nature 2023, 614, 220–223. [Google Scholar] [CrossRef]
- Tian, X.; Zhang, S.; Awbi, H.B.; Liao, C.; Cheng, Y.; Lin, Z. Multi-indicator evaluation on ventilation effectiveness of three ventilation methods: An experimental study. Build. Environ. 2020, 180, 107015. [Google Scholar] [CrossRef]
- González-Martín, J.; Kraakman, N.J.R.; Pérez, C.; Lebrero, R.; Muñoz, R. A state–of–the-art review on indoor air pollution and strategies for indoor air pollution control. Chemosphere 2021, 262, 128376. [Google Scholar] [CrossRef] [PubMed]
- Yin, H.; Zhai, X.; Ning, Y.; Li, Z.; Ma, Z.; Wang, X.; Li, A. Online monitoring of PM2.5 and CO2 in residential buildings under different ventilation modes in Xi’an city. Build. Environ. 2022, 207, 108453. [Google Scholar] [CrossRef]
- Szczepanik-Scislo, N.; Scislo, L. Dynamic Real-Time Measurements and a Comparison of Gas and Wood Furnaces in a Dual-Fuel Heating System in Order to Evaluate the Occupants’ Safety and Indoor Air Quality. Buildings 2023, 13, 2125. [Google Scholar] [CrossRef]
- Broderick, Á.; Byrne, M.; Armstrong, S.; Sheahan, J.; Coggins, A.M. A pre and post evaluation of indoor air quality, ventilation, and thermal comfort in retrofitted co-operative social housing. Build. Environ. 2017, 122, 126–133. [Google Scholar] [CrossRef]
- Mikola, A.; Hamburg, A.; Kuusk, K.; Kalamees, T.; Voll, H.; Kurnitski, J. The impact of the technical requirements of the renovation grant on the ventilation and indoor air quality in apartment buildings. Build. Environ. 2022, 210, 108698. [Google Scholar] [CrossRef]
- Szczepanik-Scislo, N. Improving Household safety via a dynamic air terminal device in order to decrease carbon monoxide migration from a gas furnace. Int. J. Environ. Res. Public Health 2022, 19, 1676. [Google Scholar] [CrossRef] [PubMed]
- Palm, J.; Reindl, K. Understanding energy efficiency in Swedish residential building renovation: A practice theory approach. Energy Res. Soc. Sci. 2016, 11, 247–255. [Google Scholar] [CrossRef]
- DIN 1946; Ventilation and Air Conditioning; Technical Health Requirements (VDI Ventilation Rules). AENOR: Madrid, Spain, 2005.
- CASALS. Cómo Calcular las Renovaciones por Hora Según la Actividad de un Local—Tablas de Cálculo para Una Correcta Ventilación de un Local con Actividad. 2021. Available online: https://www.casals.com/assets/uploads/editor/file/renovacion_de_aire_en_locales_tipicos_casals.pdf (accessed on 1 February 2022).
- Allen, J.G.; Marr, L.C. Recognizing and controlling airborne transmission of SARS-CoV-2 in indoor environments. Indoor Air 2020, 30, 557–558. [Google Scholar] [CrossRef] [PubMed]
- Miller, S.L.; Nazaroff, W.W.; Jimenez, J.L.; Boerstra, A.; Buonanno, G.; Dancer, S.J.; Kurnitski, J.; Marr, L.C.; Morawska, L.; Noakes, C. Transmission of SARS-CoV-2 by inhalation of respiratory aerosol in the Skagit Valley Chorale superspreading event. Indoor Air 2021, 31, 314–323. [Google Scholar] [CrossRef] [PubMed]
- Zhang, R.; Li, Y.; Zhang, A.L.; Wang, Y.; Molina, M.J. Identifying airborne transmission as the dominant route for the spread of COVID-19. Proc. Natl. Acad. Sci. USA 2020, 117, 14857–14863. [Google Scholar] [CrossRef] [PubMed]
- Domingo, J.L.; Rovira, J. Effects of air pollutants on the transmission and severity of respiratory viral infections. Environ. Res. 2020, 187, 109650. [Google Scholar] [CrossRef] [PubMed]
- Copat, C.; Cristaldi, A.; Fiore, M.; Grasso, A.; Zuccarello, P.; Signorelli, S.S.; Conti, G.O.; Ferrante, M. The role of air pollution (PM and NO2) in COVID-19 spread and lethality: A systematic review. Environ. Res. 2020, 191, 110129. [Google Scholar] [CrossRef] [PubMed]
- Bashir, M.F.; Ma, B.J.; Bilal; Komal, B.; Bashir, M.A.; Farooq, T.H.; Iqbal, N.; Bashir, M. Correlation between environmental pollution indicators and COVID-19 pandemic: A brief study in Californian context. Environ. Res. 2020, 187, 109652. [Google Scholar] [CrossRef]
- Pozzer, A.; Dominici, F.; Haines, A.; Witt, C.; Münzel, T.; Lelieveld, J. Regional and global contributions of air pollution to risk of death from COVID-19. Cardiovasc. Res. 2020, 116, 2247–2253. [Google Scholar] [CrossRef]
- Pegas, P.N.; Nunes, T.; Alves, C.A.; Silva, J.R.; Vieira, S.L.A.; Caseiro, A.; Pio, C.A. Indoor and outdoor characterisation of organic and inorganic compounds in city centre and suburban elementary schools of Aveiro, Portugal. Atmos. Environ. 2012, 55, 80–89. [Google Scholar] [CrossRef]
- Ren, J.; He, J.; Kong, X.; Xu, W.; Kang, Y.; Yu, Z.; Li, H. A field study of CO2 and particulate matter characteristics during the transition season in the subway system in Tianjin, China. Energy Build. 2022, 254, 111620. [Google Scholar] [CrossRef]
- ASTM E741-11; Standard Test Method for Determining Air Change in a Single Zone by Means of a Tracer Gas Dilution. ASTM International: West Conshohocken, PA, USA, 2017. [CrossRef]
- Kuswandi, B.; Hidayat, M.A.; Noviana, E. Paper-based sensors for rapid important biomarkers detection. Biosens. Bioelectron. X 2022, 12, 100246. [Google Scholar] [CrossRef]
- Mo, L.; Ma, X.; Fan, L.; Xin, J.H.; Yu, H. Weavable, large-scaled, rapid response, long-term stable electrochemical fabric sensor integrated into clothing for monitoring potassium ions in sweat. Chem. Eng. J. 2023, 454, 140473. [Google Scholar] [CrossRef]
- Xue, J.; Mao, K.; Cao, H.; Feng, R.; Chen, Z.; Du, W.; Zhang, H. Portable sensors equipped with smartphones for organophosphorus pesticides detection. Food Chem. 2023, 434, 137456. [Google Scholar] [CrossRef] [PubMed]
- Leclerc, Q.J.; Fuller, N.M.; Knight, L.E.; Funk, S.; Knight, G.M. What settings have been linked to SARS-CoV-2 transmission clusters? Wellcome Open Res. 2020, 5, 83. [Google Scholar] [CrossRef] [PubMed]
- Plume Labs. Flow 2.0, by Plume Labs: The First Smart Air Quality Tracker. Available online: https://plumelabs.com/en/flow/ (accessed on 5 May 2021).
- Plume Labs. How Can I Make Sure My Flow Is Accurate? Available online: https://plumelabs.zendesk.com/hc/en-us/articles/360010791514-How-can-I-make-sure-my-Flow-is-accurate (accessed on 5 May 2021).
- Doval Miñarro, M. Evaluación de la Norma UNE EN 14211:2006 para la Medida de Óxidos de Nitrógeno en Aire: Propuestas de Modificaciones. Ph.D. Thesis, Department of Chemical Engineering, Faculty of Chemistry, University of Murcia, Murcia, Spain, 2009. Available online: http://hdl.handle.net/10201/10061 (accessed on 28 September 2021).
- Miñarro, M.D.; Ferradás, E.G. Performance evaluation of two commercial chemiluminescence NOx analysers according to European Standard EN 14211. J. Environ. Monit. 2012, 14, 383–390. [Google Scholar] [CrossRef]
- Miñarro, M.D.; Ballesta, P.D.; Rico, J.B.; Ferradás, E.G. Uncertainty models and influence of the calibration span on ambient air measurements of NO2 by chemiluminescence. Environ. Sci. Process. Impacts 2013, 15, 512–523. [Google Scholar] [CrossRef] [PubMed]
- Romero Trigueros, C. Evaluación de la Norma UNE EN 14662-3:2006 para la Medida de Benceno en Aire Ambiente: Propuestas de Modificaciones. Ph.D. Thesis, Department of Chemical Engineering, Faculty of Chemistry, University of Murcia, Murcia, Spain, 2015. Available online: http://hdl.handle.net/10201/45948 (accessed on 29 September 2021).
- VISLONE. 5 in 1 Multifunctional CO2 Meter. Digital Meter for Humidity, Temperature, Carbon Dioxide, TVOC and HCHO, and Air Quality Detector. 2021. Available online: https://esp.grandado.com/products/dector-de-aire-multifuncional-co2-formaldehido-hcho-tpv-interior-del-aire-ppm-medidor-pantalla-digital-lcd?variant=UHJvZHVjdFZhcmlhbnQ6Nzc1NTQ2ODA&gad_source=1 (accessed on 20 July 2021).
- STANLEY. TLM 165 Model Laser Distance Meter. 2021. Available online: https://www.stanley.eu/uploads/eu/downloads/manuals/laser-tools/TLM/tlm165/stanley_stht1-77139_gb.pdf (accessed on 7 July 2021).
- Chen, C.Y.; Chen, P.H.; Chen, J.K.; Su, T.C. Recommendations for ventilation of indoor spaces to reduce COVID-19 transmission. J. Formos. Med. Assoc. 2021, 120, 2055–2060. [Google Scholar] [CrossRef]
- Minguillón, M.C.; Querol, X.; Felisi, J.M.; Garrido, T. Guía para Ventilación en Aulas; Consejo Superior de Investigaciones Científicas: Madrid, Spain, 2020; Available online: http://hdl.handle.net/10261/221538 (accessed on 27 April 2022).
- Rivas, E.; Santiago, J.L.; Martín, F.; Martilli, A. Impact of natural ventilation on exposure to SARS-CoV 2 in indoor/semi-indoor terraces using CO2 concentrations as a proxy. J. Build. Eng. 2022, 46, 103725. [Google Scholar] [CrossRef]
- Trilles, S.; Juan, P.; Chaudhuri, S.; Fortea, A.B.V. Data on CO2, temperature and air humidity records in Spanish classrooms during the reopening of schools in the COVID-19 pandemic. Data Brief 2021, 39, 107489. [Google Scholar] [CrossRef]
- Bhagat, R.K.; Davies Wykes, M.S.; Dalziel, S.B.; Linden, P.F. Effects of ventilation on the indoor spread of COVID-19. J. Fluid Mech. 2020, 903, F1. [Google Scholar] [CrossRef]
- Di Gilio, A.; Palmisani, J.; Pulimeno, M.; Cerino, F.; Cacace, M.; Miani, A.; de Gennaro, G. CO2 concentration monitoring inside educational buildings as a strategic tool to reduce the risk of Sars-CoV-2 airborne transmission. Environ. Res. 2021, 202, 111560. [Google Scholar] [CrossRef]
- Zivelonghi, A.; Lai, M. Mitigating aerosol infection risk in school buildings: The role of natural ventilation, volume, occupancy and CO2 monitoring. Build. Environ. 2021, 204, 108139. [Google Scholar] [CrossRef]
- ACGIH. Industrial Ventilation: A Manual of Recommended Practice for Design, 28th ed.; ACGIH: Cincinnati, OH, USA, 2013. [Google Scholar]
- Cavallé Oller, N.; Hernández Calleja, A. NTP 741: Ventilación General por Dilución; Instituto Nacional de Seguridad y Salud en el Trabajo: Madrid, Spain, 2006; Available online: https://www.insst.es/documents/94886/327446/ntp_741.pdf/6e87a3f1-0c81-4323-9be5-772e2e593a18 (accessed on 27 April 2022).
- Batterman, S. Review and Extension of CO2-Based Methods to Determine Ventilation Rates with Application to School Classrooms. Int. J. Environ. Res. Public Health 2017, 14, 145. [Google Scholar] [CrossRef] [PubMed]
- Persily, A.; de Jonge, L. Carbon dioxide generation rates for building occupants. Indoor Air 2017, 27, 868–879. [Google Scholar] [CrossRef]
- Zhuang, H.; Zou, Z.; Wang, L.; Zhao, Z.; Ge, X.; Cai, J.; Liu, W. Investigation of Air Change Rate in a Single Room Using Multiple Carbon Dioxide Breathing Models in China: Verification by Field Measurement. Buildings 2023, 13, 459. [Google Scholar] [CrossRef]
- LIFTEC; CSIC. Ventilación Natural en las Aulas; LIFTEC: Zaragoza, Spain, 2020; Available online: http://www.isna.info/wp-content/uploads/2020/12/Guia-Practica-Ventilacion.pdf (accessed on 3 March 2022).
- WHO (World Health Organization). Roadmap to Improve and Ensure Good Indoor Ventilation in the Context of COVID-19; WHO: Geneva, Switzerland, 2021; Available online: https://apps.who.int/iris/rest/bitstreams/1333991/retrieve (accessed on 10 May 2022).
- BOE. Real Decreto 1027/2007, de 20 de Julio, por el que se Aprueba el Reglamento de Instalaciones Térmicas en los Edificios; BOE: Madrid, Spain, 2007; pp. 35931–35984. Available online: https://www.boe.es/buscar/doc.php?id=BOE-A-2007-15820 (accessed on 13 May 2022).
- BOE. Real Decreto 102/2011, de 28 de Enero, Relativo a la Mejora de la Calidad del Aire; BOE: Madrid, Spain, 2011; pp. 9574–9626. Available online: https://www.boe.es/boe/dias/2011/01/29/pdfs/BOE-A-2011-1645.pdf (accessed on 3 June 2022).
- International Well Building Institute. Air Quality Standards. Intent: To Ensure a Basic Level of High Indoor Air Quality. 2020. Available online: https://standard.wellcertified.com/air/air-quality-standards (accessed on 3 June 2022).
- Pacitto, A.; Amato, F.; Moreno, T.; Pandolfi, M.; Fonseca, A.; Mazaheri, M.; Stabile, L.; Buonanno, G.; Querol, X. Effect of ventilation strategies and air purifiers on the children’s exposure to airborne particles and gaseous pollutants in school gyms. Sci. Total Environ. 2020, 712, 135673. [Google Scholar] [CrossRef]
- Ruggieri, S.; Longo, V.; Perrino, C.; Canepari, S.; Drago, G.; L’Abbate, L.; Balzan, M.; Cuttitta, G.; Scaccianoce, G.; Minardi, R.; et al. Indoor air quality in schools of a highly polluted south Mediterranean area. Indoor Air 2019, 29, 276–290. [Google Scholar] [CrossRef] [PubMed]
- Campagnolo, D.; Saraga, D.E.; Cattaneo, A.; Spinazzè, A.; Mandin, C.; Mabilia, R.; Perreca, E.; Sakellaris, I.; Canha, N.; Mihucz, V.G.; et al. VOCs and aldehydes source identification in European office buildings—The OFFICAIR study. Build. Environ. 2017, 115, 18–24. [Google Scholar] [CrossRef]
- Carazo Fernández, L.; Fernández Alvarez, R.; González-Barcala, F.J.; Rodríguez Portal, J.A. Indoor Air Contaminants and Their Impact on Respiratory Pathologies. Arch. Bronconeumol. (Engl. Ed.) 2013, 49, 22–27. [Google Scholar] [CrossRef]
- Leung, D.Y.C. Outdoor-indoor air pollution in urban environment: Challenges and opportunity. Front. Environ. Sci. 2015, 2, 69. [Google Scholar] [CrossRef]
- Singh, D.; Kumar, A.; Kumar, K.; Singh, B.; Mina, U.; Singh, B.B.; Jain, V.K. Statistical modeling of O3, NOx, CO, PM2.5, VOCs and noise levels in commercial complex and associated health risk assessment in an academic institution. Sci. Total Environ. 2016, 572, 586–594. [Google Scholar] [CrossRef]
- Rivas, I.; Viana, M.; Moreno, T.; Pandolfi, M.; Amato, F.; Reche, C.; Bouso, L.; Àlvarez-Pedrerol, M.; Alastuey, A.; Sunyer, J.; et al. Child exposure to indoor and outdoor air pollutants in schools in Barcelona, Spain. Environ. Int. 2014, 69, 200–212. [Google Scholar] [CrossRef] [PubMed]
- Hu, Y.; Zhao, B. Relationship between indoor and outdoor NO2: A review. Build. Environ. 2020, 180, 106909. [Google Scholar] [CrossRef]

| SPACE | ACH | SPACE | ACH | SPACE | ACH | SPACE | ACH |
|---|---|---|---|---|---|---|---|
| Auditorium | 6–8 | Library | 4–5 | Restaurant | 8–12 | Gyms | 4–6 |
| Lecture room | 5–7 | Office | 4–8 | Cinema room | 5–8 |
| Activity | Rest | Walking | Physical Activity | ||||
|---|---|---|---|---|---|---|---|
| Gender | Men | Women | Men | Women | Men | Women | |
| Age Groups | |||||||
| 11–15 years | 0.0041 l s−1 | 0.0035 l s−1 | 0.0068 l s−1 | 0.0058 l s−1 | 0.0136 l s−1 | 0.0117 l s−1 | |
| 16–20 years | 0.0045 l s−1 | 0.0036 l s−1 | 0.0075 l s−1 | 0.0059 l s−1 | 0.0150 l s−1 | 0.0119 l s−1 | |
| 21–29 years | 0.0048 l s−1 | 0.0038 l s−1 | 0.0080 l s−1 | 0.0063 l s−1 | 0.0160 l s−1 | 0.0126 l s−1 | |
| 30–39 years | 0.0046 l s−1 | 0.0035 l s−1 | 0.0076 l s−1 | 0.0059 l s−1 | 0.0152 l s−1 | 0.0118 l s−1 | |
| 40–49 years | 0.0046 l s−1 | 0.0036 l s−1 | 0.0077 l s−1 | 0.0060 l s−1 | 0.0155 l s−1 | 0.0119 l s−1 | |
| Between 11 and 49 years | 0.0042 l s−1 | 0.0036 l s−1 | 0.00752 l s−1 | 0.00598 l s−1 | 0.01506 l s−1 | 0.01198 l s−1 | |
| Average person | 0.00390 l s−1 | 0.00675 l s−1 | 0.01352 l s−1 | ||||
| PM2.5 (µg m−3) | PM10 (µg m−3) | VOCs (ppb v/v) | NO2 (ppb v/v) | |
|---|---|---|---|---|
| Outdoor | 20 a | 50 a | 80 d | 106 (200 µg/m3) a |
| Indoor | 15 c | 50 c | 142 c (500 µg/m3) | 74 (140 µg/m3) b |
| SPACE | Experimental Data | Avoid COVID-19 Contagion (ac) | Ensure Minimum Ventilation (mv) | Type of Ventilation | ||||||||||
|---|---|---|---|---|---|---|---|---|---|---|---|---|---|---|
(ppm) | (ppm) | Fb | Fb | |||||||||||
| City study room | 77.4 | 2 | 0.0039 1 | 0.02808 | 628 | 447 | 2.004 | 14 | 1.30 | 2 | 5 | 0.47 | 1 | Natural ventilation (main door open, windows closed) |
| University study room | 742.2 | 18 | 0.0039 1 | 0.25272 | 529 | 489 | 8.513 | 14 | 1.22 | 2 | 5 | 0.44 | 1 | Natural ventilation (doors open, windows 25% open) |
| Coffee shop | 255.5 | 9 | 0.00447 2 | 0.144828 | 558 | 507 | 11.115 | 15 | 1.90 | 2 | 5 | 0.63 | 1 | Natural ventilation (door open, roof 50% open) |
| Restaurant | 509.2 | 17 | 0.00447 2 | 0.273564 | 624 | 374 | 2.149 | 15 | 1.80 | 2 | 5 | 0.60 | 1 | Natural ventilation (doors open, windows 50% open) |
| Cinema room | 2155.9 | 20 | 0.0039 1 | 0.2808 | 697 | 474 | 0.584 | 10 | 0.33 | 1 | 5 | 0.17 | 1 | Natural (main door open, no windows) and forced (Off) ventilation |
| Gym | 2543.1 | 6 | 0.01352 3 | 0.292032 | 502 | 475 | 4.253 | 15 | 0.13 | 1 | 5 | 0.04 | 1 | Natural (doors and windows open) and forced (Off) ventilation |
| Office | 64.9 | 2 | 0.0039 1 | 0.02808 | 548 | 545 | 144.222 | 14 | 1.55 | 2 | 5 | 0.55 | 1 | Purifier and forced ventilation (On) |
| Maximum Occupancy to Avoid COVID-19 Contagion (ac) | Maximum Occupancy to Ensure Minimum Ventilation (mv) | ||||||||||||
|---|---|---|---|---|---|---|---|---|---|---|---|---|---|
| ppm | ppm | ||||||||||||
| SPACE | n | (ppm) | n | (ppm) | n | (ppm) | n | (ppm) | |||||
| City study room | 2.004 | 3 | 0.04 | 718.50 | 2 | 0.03 | 628.00 | 8 | 0.11 | 1171.00 | 6 | 0.08 | 990.00 |
| University study room | 8.513 | 117 | 1.64 | 749.00 | 94 | 1.32 | 697.89 | 329 | 4.62 | 1220.11 | 229 | 3.22 | 997.89 |
| Coffee shop | 11.115 | 52 | 0.84 | 801.67 | 34 | 0.55 | 699.67 | 156 | 2.51 | 1391.00 | 87 | 1.40 | 1000.00 |
| Restaurant | 2.149 | 18 | 0.29 | 638.71 | 22 | 0.35 | 697.53 | 56 | 0.90 | 1197.53 | 42 | 0.68 | 991.65 |
| Cinema room | 0.584 | 0 | 0.00 | 474.00 | 20 | 0.28 | 697.00 | 0 | 0.00 | 474.00 | 47 | 0.66 | 998.05 |
| Gym | 4.253 | 188 | 9.15 | 1321.00 | 50 | 2.43 | 700.00 | 565 | 27.50 | 3017.50 | 116 | 5.65 | 997.00 |
| Office | 144.222 | 185 | 2.60 | 822.50 | 103 | 1.45 | 699.50 | 519 | 7.29 | 1323.50 | 303 | 4.25 | 999.50 |
| Maximum Occupancy to Avoid COVID-19 Contagion (ac) | Maximum Occupancy to Avoid COVID-19 Contagion (ac) | |||||||||||||
|---|---|---|---|---|---|---|---|---|---|---|---|---|---|---|
| ppm | ppm | |||||||||||||
| SPACE | n | ) | (ppm) | n | ) | (ppm) | n | ) | (ppm) | n | ) | (ppm) | ||
| City study room | 4 | 6 | 0.08 | 719.09 | 5 | 0.07 | 673.74 | 5 | 7 | 0.10 | 700.95 | 6 | 0.08 | 664.67 |
| University study room | 4 | 58 | 0.81 | 763.29 | 44 | 0.62 | 697.08 | 5 | 73 | 1.02 | 765.18 | 55 | 0.77 | 697.08 |
| Coffee shop | 10 | 47 | 0.76 | 803.02 | 30 | 0.48 | 695.95 | 12 | 56 | 0.90 | 800.92 | 36 | 0.58 | 695.95 |
| Restaurant | 8 | 75 | 1.21 | 670.27 | 82 | 1.32 | 697.93 | 12 | 113 | 1.82 | 671.59 | 123 | 1.98 | 697.93 |
| Cinema room | 5 | 299 | 4.20 | 863.44 | 173 | 2.43 | 699.33 | 8 | 479 | 6.73 | 863.93 | 277 | 3.89 | 699.49 |
| Gym | 4 | 188 | 9.15 | 1374.53 | 47 | 2.29 | 699.88 | 6 | 282 | 13.73 | 1374.53 | 70 | 3.41 | 698.29 |
| Office | 4 | 5 | 0.07 | 815.42 | 2 | 0.03 | 653.17 | 8 | 10 | 0.14 | 815.42 | 5 | 0.07 | 680.21 |
| Maximum Occupancy to Ensure Minimum Ventilation (mv) | Maximum Occupancy to Ensure Minimum Ventilation (mv) | |||||||||||||
|---|---|---|---|---|---|---|---|---|---|---|---|---|---|---|
| ppm | ppm | |||||||||||||
| SPACE | n | ) | (ppm) | n | ) | (ppm) | n | ) | (ppm) | n | ) | |||
| City study room | 4 | 17 | 0.24 | 1217.93 | 12 | 0.17 | 991.19 | 5 | 21 | 0.29 | 1208.86 | 15 | 0.21 | 991.19 |
| University study room | 4 | 164 | 2.30 | 1264.59 | 108 | 1.52 | 999.75 | 5 | 206 | 2.89 | 1268.37 | 135 | 1.90 | 999.75 |
| Coffee shop | 10 | 141 | 2.27 | 1395.05 | 78 | 1.26 | 998.26 | 12 | 170 | 2.74 | 1399.25 | 93 | 1.50 | 995.11 |
| Restaurant | 8 | 226 | 3.64 | 1266.77 | 158 | 2.54 | 998.15 | 12 | 339 | 5.46 | 1266.77 | 237 | 3.81 | 998.15 |
| Cinema room | 5 | 598 | 8.40 | 1252.88 | 403 | 5.66 | 998.90 | 8 | 958 | 13.45 | 1253.86 | 646 | 9.07 | 999.87 |
| Gym | 4 | 565 | 27.50 | 3178.36 | 109 | 5.31 | 996.53 | 6 | 847 | 41.23 | 3176.77 | 164 | 7.98 | 998.13 |
| Office | 4 | 14 | 0.20 | 1302.16 | 8 | 0.11 | 977.67 | 8 | 28 | 0.39 | 1302.16 | 16 | 0.22 | 977.67 |
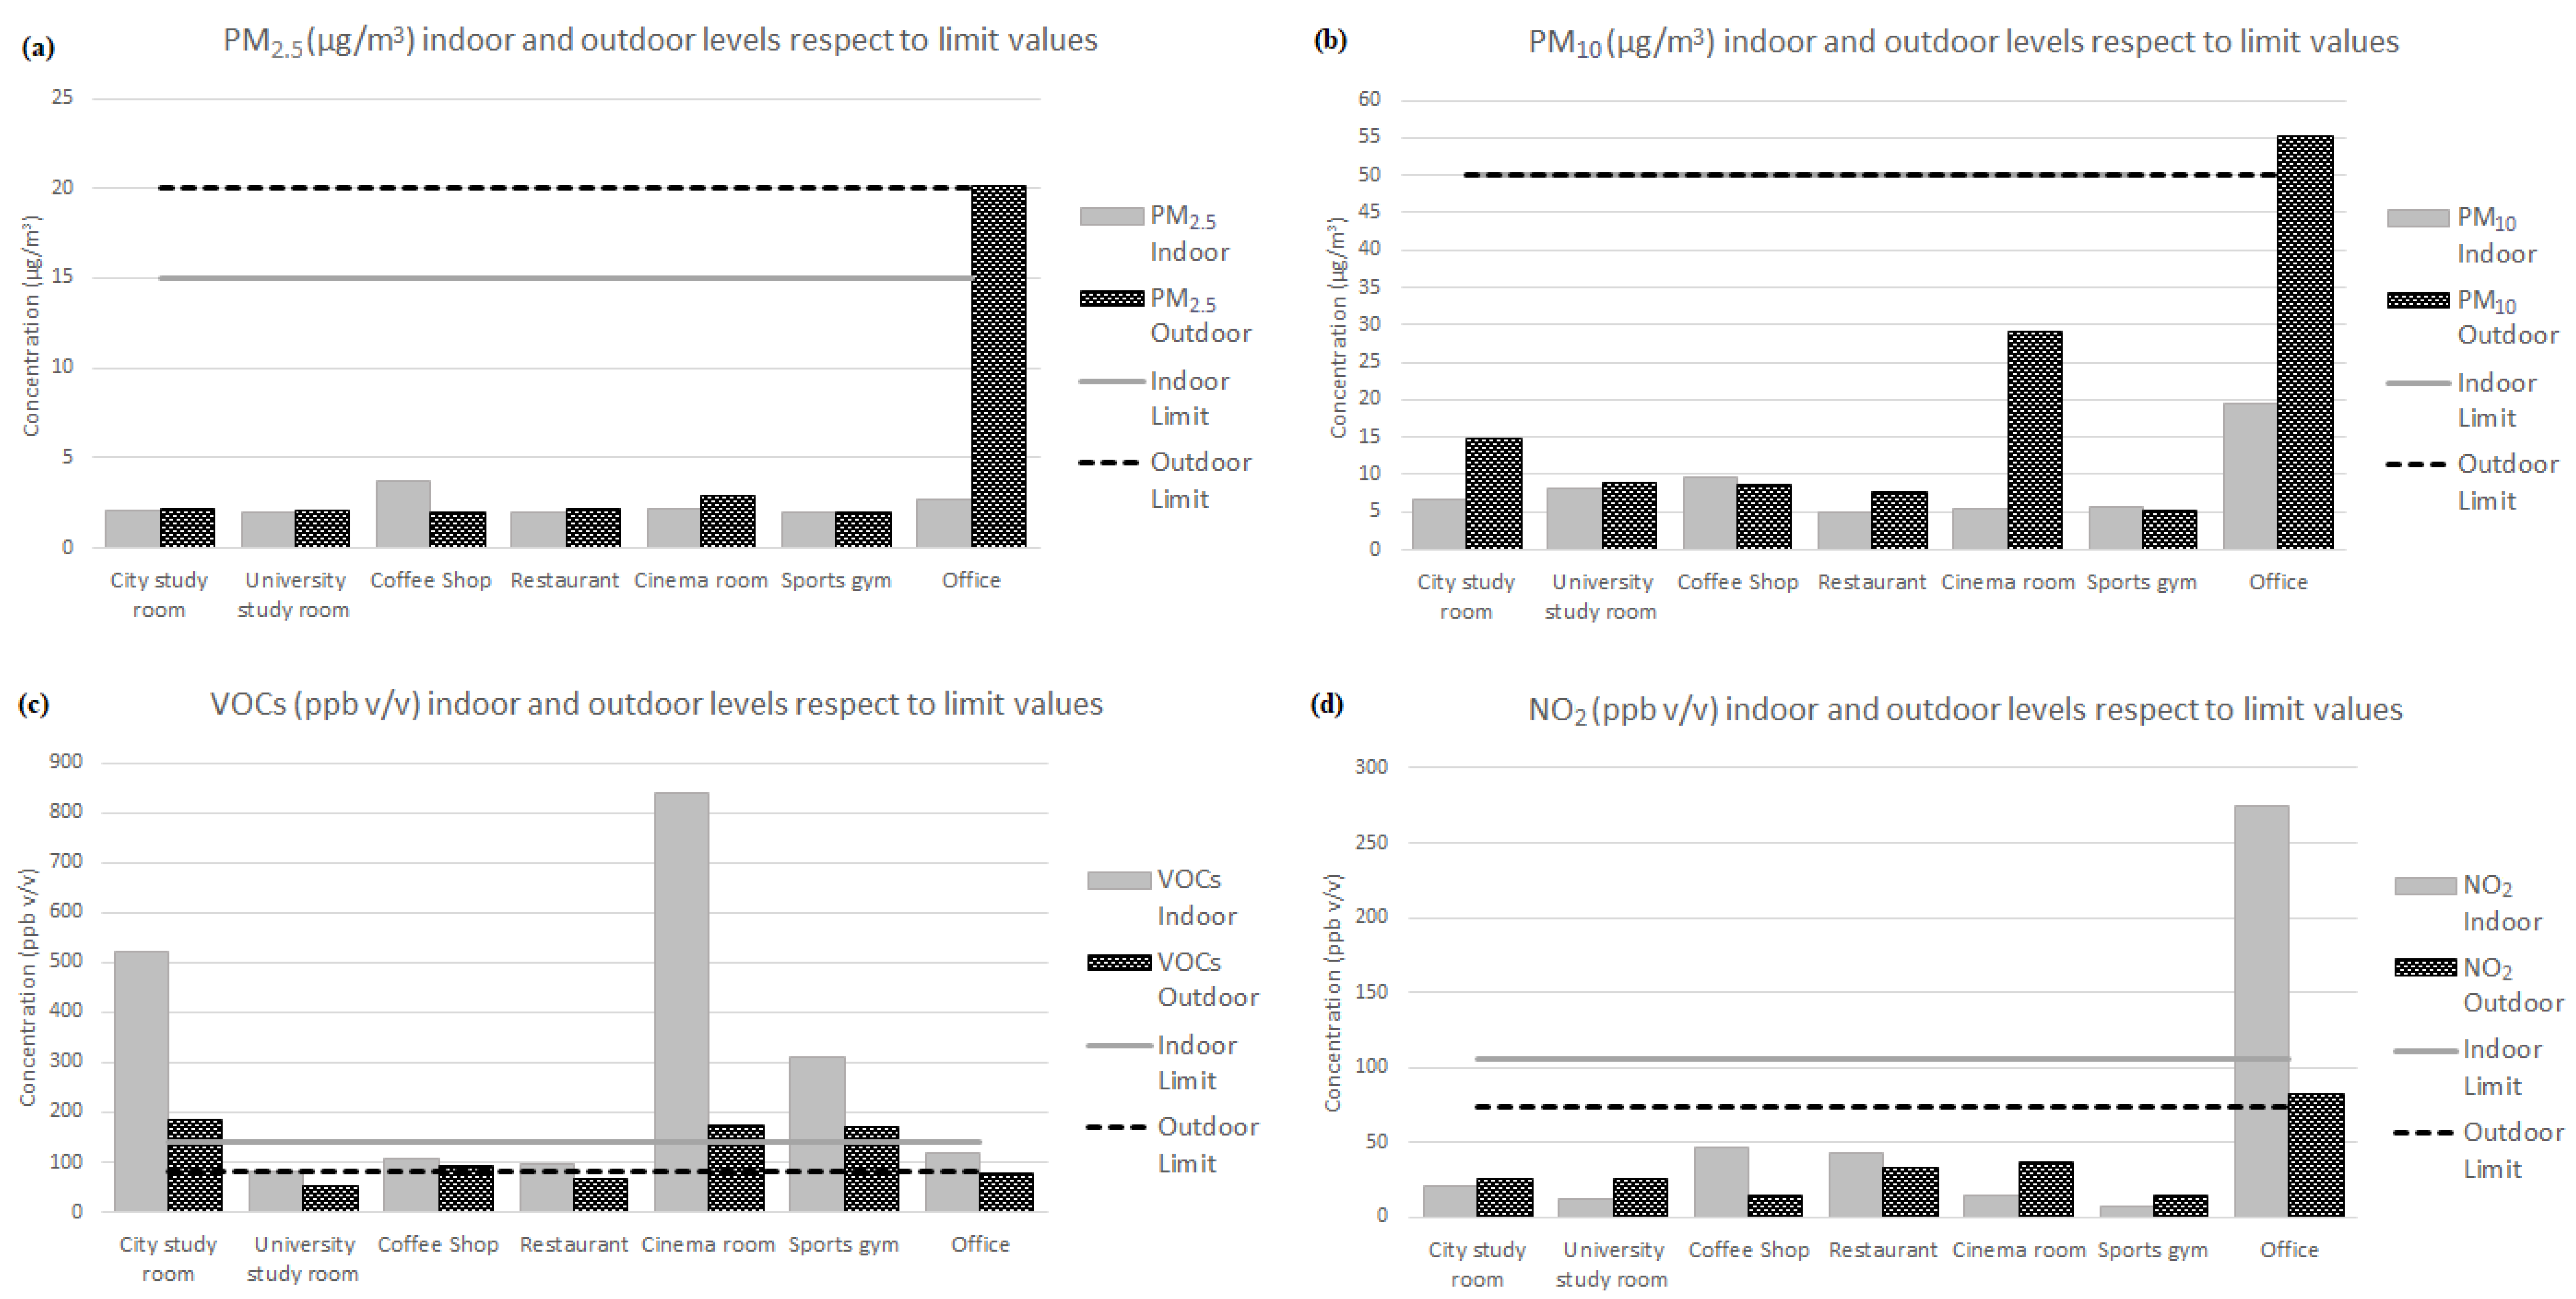
| SPACE | PM2.5 (µg m−3) | PM10 (µg m−3) | VOCs (ppb v/v) | NO2 (ppb v/v) | Location | Outdoor Pollution Source(s) | Indoor Pollution Source(s) | ||||||||
|---|---|---|---|---|---|---|---|---|---|---|---|---|---|---|---|
| I | O | I/O | I | O | I/O | I | O | I/O | I | O | I/O | ||||
| City study room | 2.04 | 2.12 | 0.96 | 6.71 | 14.75 | 0.45 | 519.7 | 183.3 | 2.84 | 20.6 | 25.6 | 0.80 | In the city centre next to a main avenue and road | Traffic and street | VOCs |
| University study room | 2 | 2.02 | 0.990 | 8.25 | 8.76 | 0.94 | 81.33 | 50.75 | 1.60 | 12.56 | 26.13 | 0.48 | Inside the university campus, which is located next to a dual motorway | Traffic (intercity road) | VOCs |
| Coffee shop | 3.65 | 2 | 1.82 | 9.52 | 8.6 | 1.11 | 106.11 | 93.78 | 1.13 | 46.78 | 14.33 | 3.26 | In the city centre next to a main avenue | Traffic and street, tobacco smoke | PM, VOCs, NO2 |
| Restaurant | 2 | 2.11 | 0.95 | 4.84 | 7.74 | 0.63 | 96.21 | 68 | 1.41 | 42.71 | 32.67 | 1.31 | In the city centre | Street, tobacco smoke | PM, VOCs, NO2 |
| Cinema room | 2.19 | 2.86 | 0.77 | 5.37 | 29.07 | 0.18 | 839.55 | 174.18 | 4.82 | 14.73 | 37.18 | 0.40 | Far from the city centre, next to a parking lot and two restaurants | Traffic (main ring road), restaurants, and parking | VOCs |
| Gym | 2 | 2 | 1.00 | 5.69 | 5.1 | 1.12 | 311.11 | 170 | 1.83 | 7.44 | 15 | 0.50 | In an urban polygon, next to two car repair services | Traffic | PM, VOCs |
| Office | 2.62 | 20.17 | 0.13 | 19.46 | 55.16 | 0.35 | 118.5 | 78.38 | 1.51 | 274.5 | 82.75 | 3.32 | Inside a car repair service | Repair works | - |
| Ventilation | PM2.5 | PM10 | VOCs | NO2 | ||||||
|---|---|---|---|---|---|---|---|---|---|---|
| SPACE | Low Occupancy | Normal Occupancy | In | Out | In | Out | In | Out | In | Out |
| City study room | X | X | X | |||||||
| University study room | ||||||||||
| Coffee shop | X | |||||||||
| Restaurant | X | X | ||||||||
| Cinema room | X | X | X | X | ||||||
| Gym | X | X | X | |||||||
| Office | X | X | X | X | ||||||
Disclaimer/Publisher’s Note: The statements, opinions and data contained in all publications are solely those of the individual author(s) and contributor(s) and not of MDPI and/or the editor(s). MDPI and/or the editor(s) disclaim responsibility for any injury to people or property resulting from any ideas, methods, instructions or products referred to in the content. |
© 2024 by the authors. Licensee MDPI, Basel, Switzerland. This article is an open access article distributed under the terms and conditions of the Creative Commons Attribution (CC BY) license (https://creativecommons.org/licenses/by/4.0/).
Share and Cite
Durán del Amor, M.d.M.; Baeza Caracena, A.; Esquembre, F.; Llorens Pascual del Riquelme, M. New Methodology to Evaluate and Optimize Indoor Ventilation Based on Rapid Response Sensors. Sensors 2024, 24, 1657. https://doi.org/10.3390/s24051657
Durán del Amor MdM, Baeza Caracena A, Esquembre F, Llorens Pascual del Riquelme M. New Methodology to Evaluate and Optimize Indoor Ventilation Based on Rapid Response Sensors. Sensors. 2024; 24(5):1657. https://doi.org/10.3390/s24051657
Chicago/Turabian StyleDurán del Amor, María del Mar, Antonia Baeza Caracena, Francisco Esquembre, and Mercedes Llorens Pascual del Riquelme. 2024. "New Methodology to Evaluate and Optimize Indoor Ventilation Based on Rapid Response Sensors" Sensors 24, no. 5: 1657. https://doi.org/10.3390/s24051657