
Targeted FT-NIR and SERS Detection of Breast Cancer HER-II Biomarkers in Blood Serum Using PCB-Based Plasmonic Active Nanostructured Thin Film Label-Free Immunosensor Immobilized with Directional GNU-Conjugated Antibody

Abstract
:1. Introduction
2. Materials and Methods
2.1. Preparation of PCB Substrate
2.1.1. Initial Rinsing
2.1.2. Channel Enclosure
2.1.3. Final Sonication
3. Fabrication of PCB Sensor
3.1. Functionalization of PCB
3.1.1. Preparation of 15 pM GNU
3.1.2. Preparation of HDT
3.1.3. Preparation of 5 mM PEG Linker Solution
3.1.4. Functionalization of PCB with HDT and GNU
3.1.5. Functionalization with PEG
3.1.6. Functionalization with ADH
3.2. Conjugation of mAb
3.2.1. Preparation of Coupling Buffer
3.2.2. mAb Activation and Purification
3.2.3. Reaction Incubation
3.2.4. Hydrazone Bond Stabilization
3.2.5. Blocking
3.2.6. Healthy Blood Serum (HBS)
4. Interaction of mAb-BCS
4.1. Serum Dilution
4.2. Incubation
5. Characterization
6. Results and Discussion
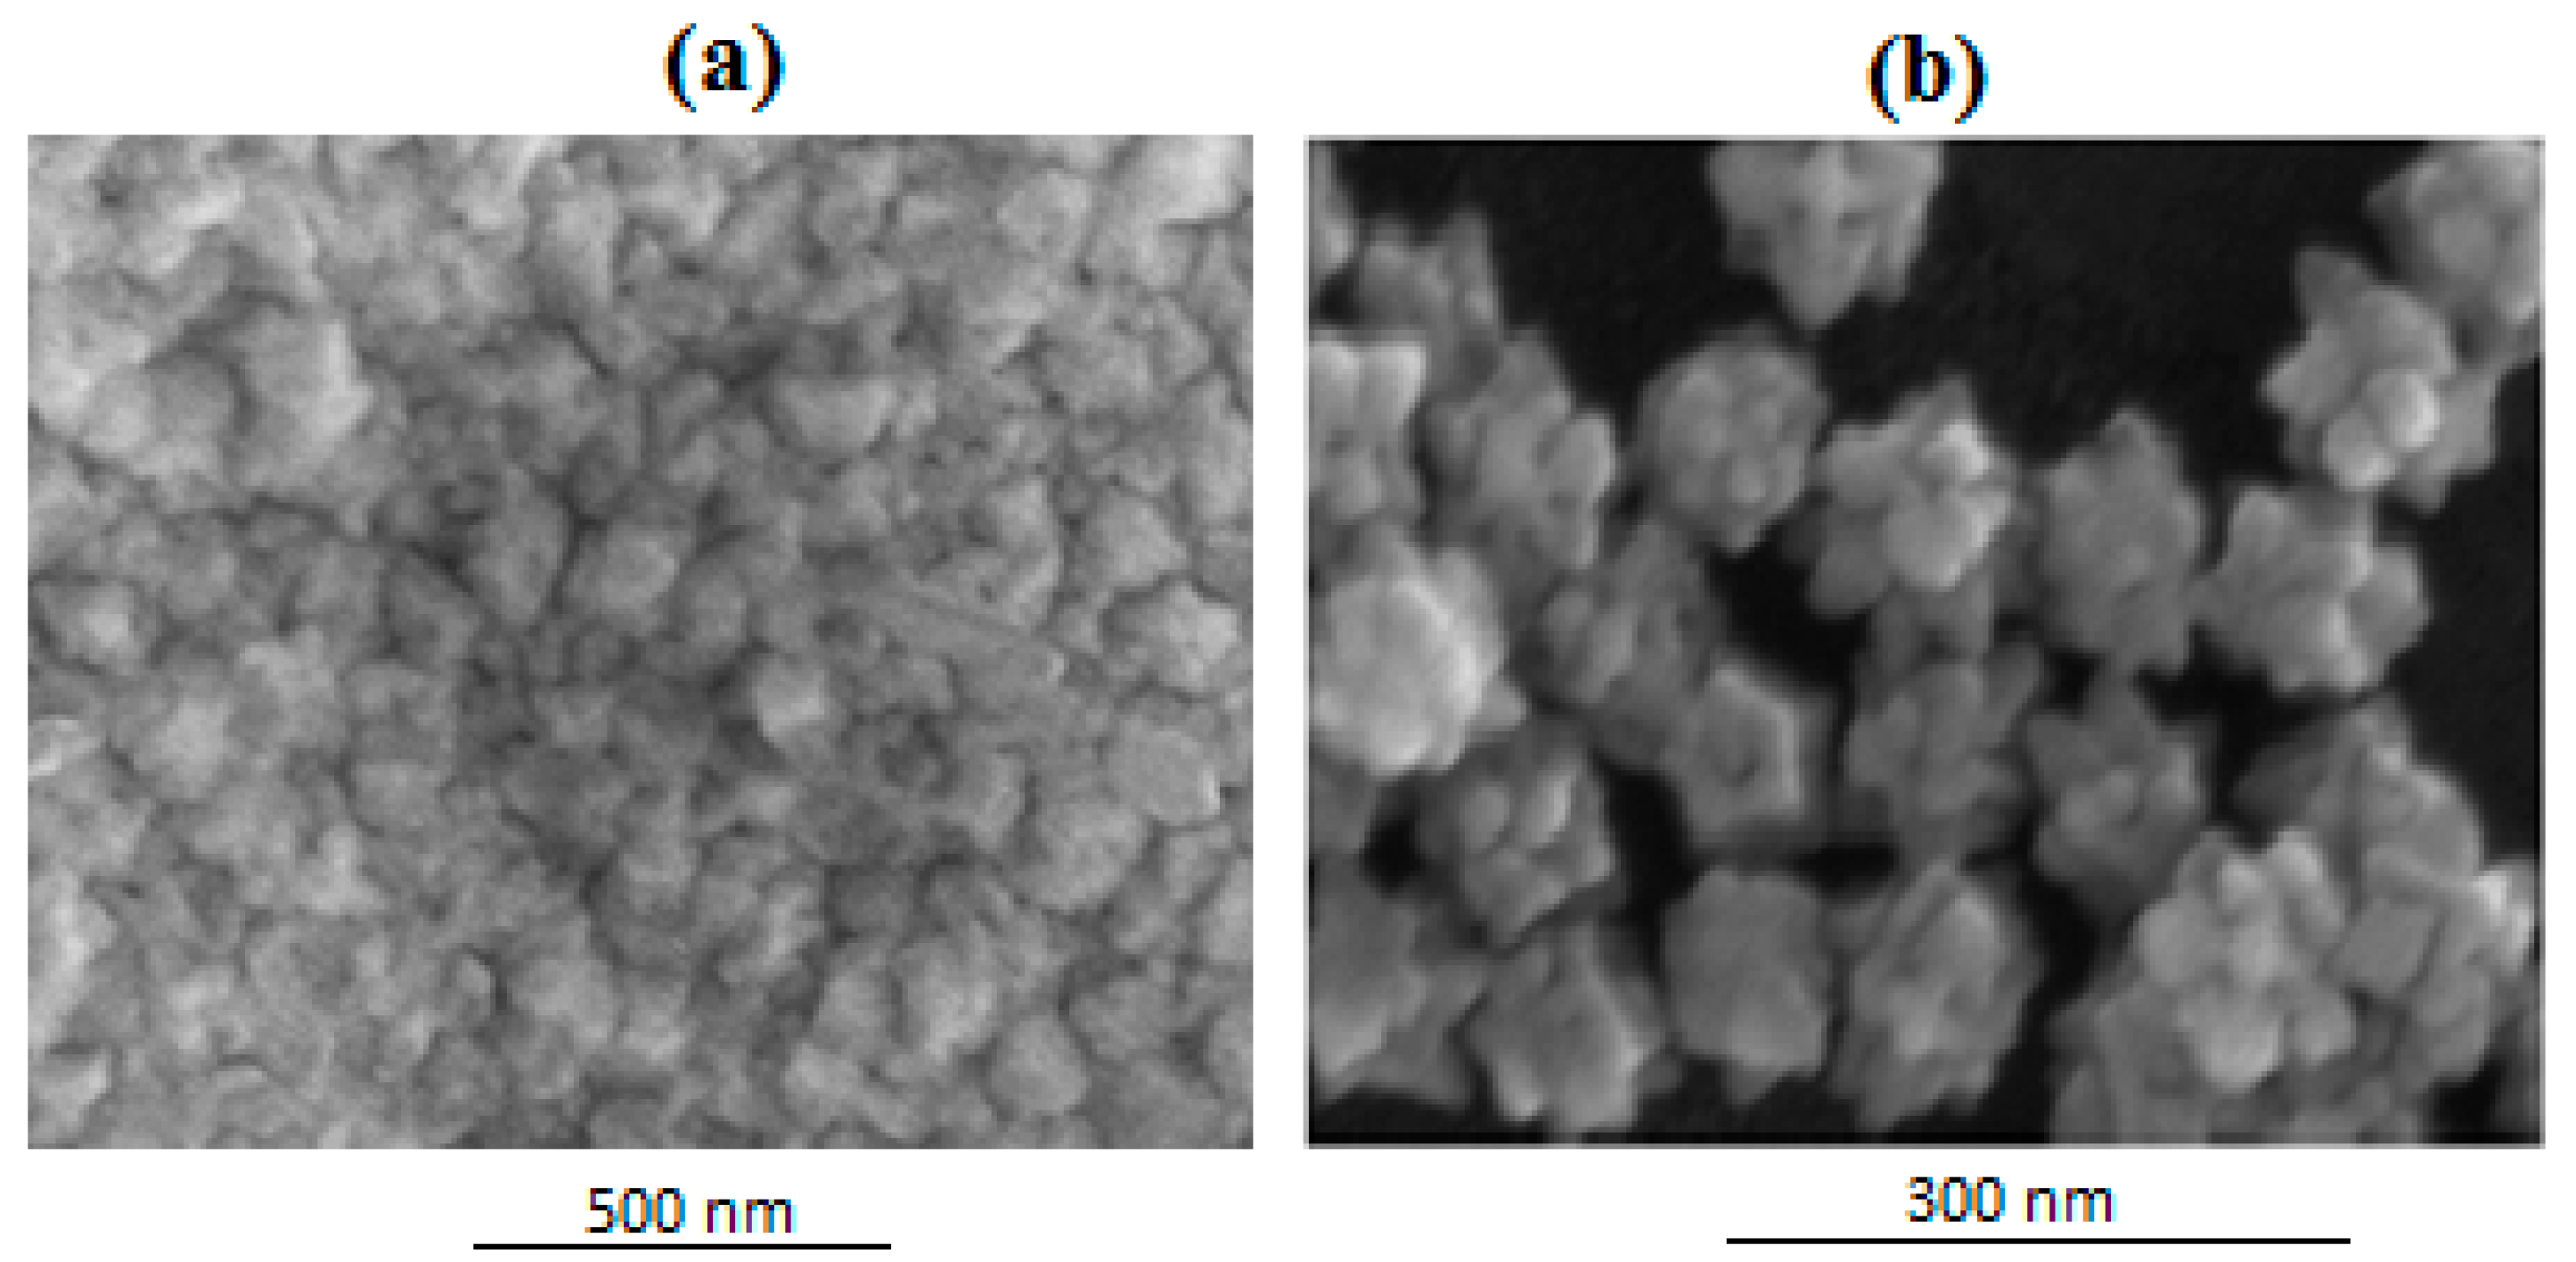
6.1. SEM
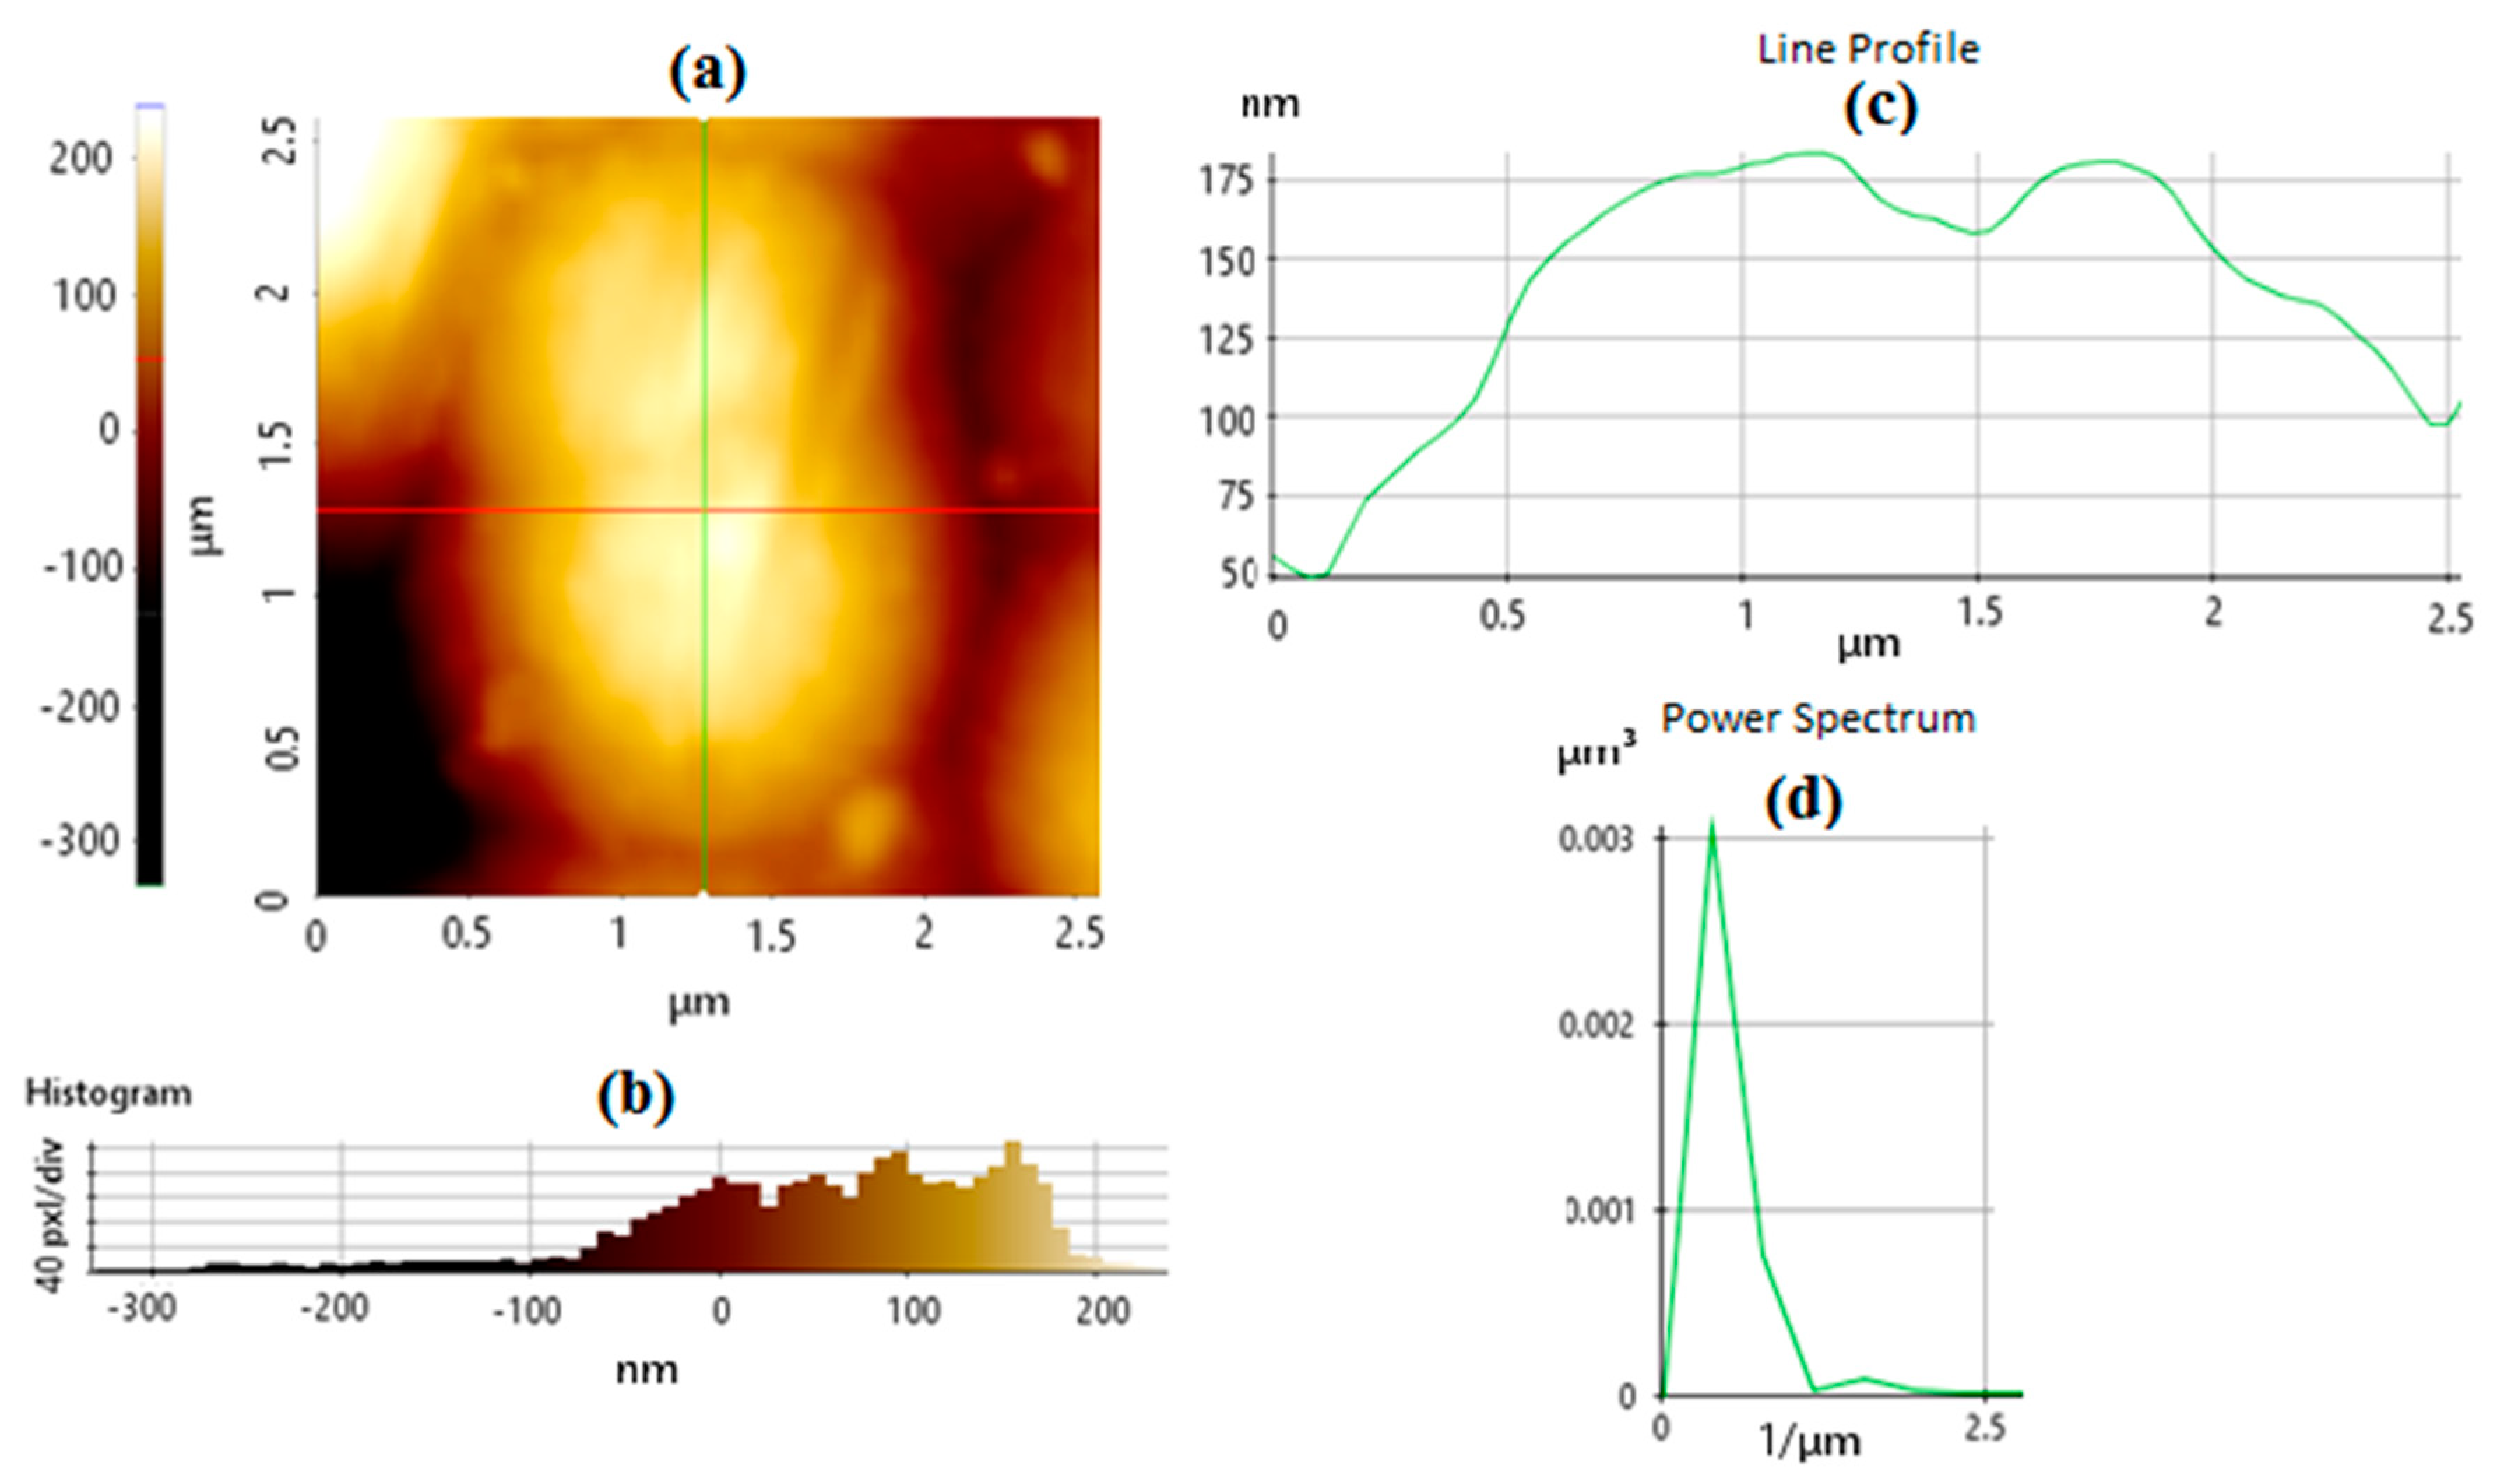
6.2. AFM
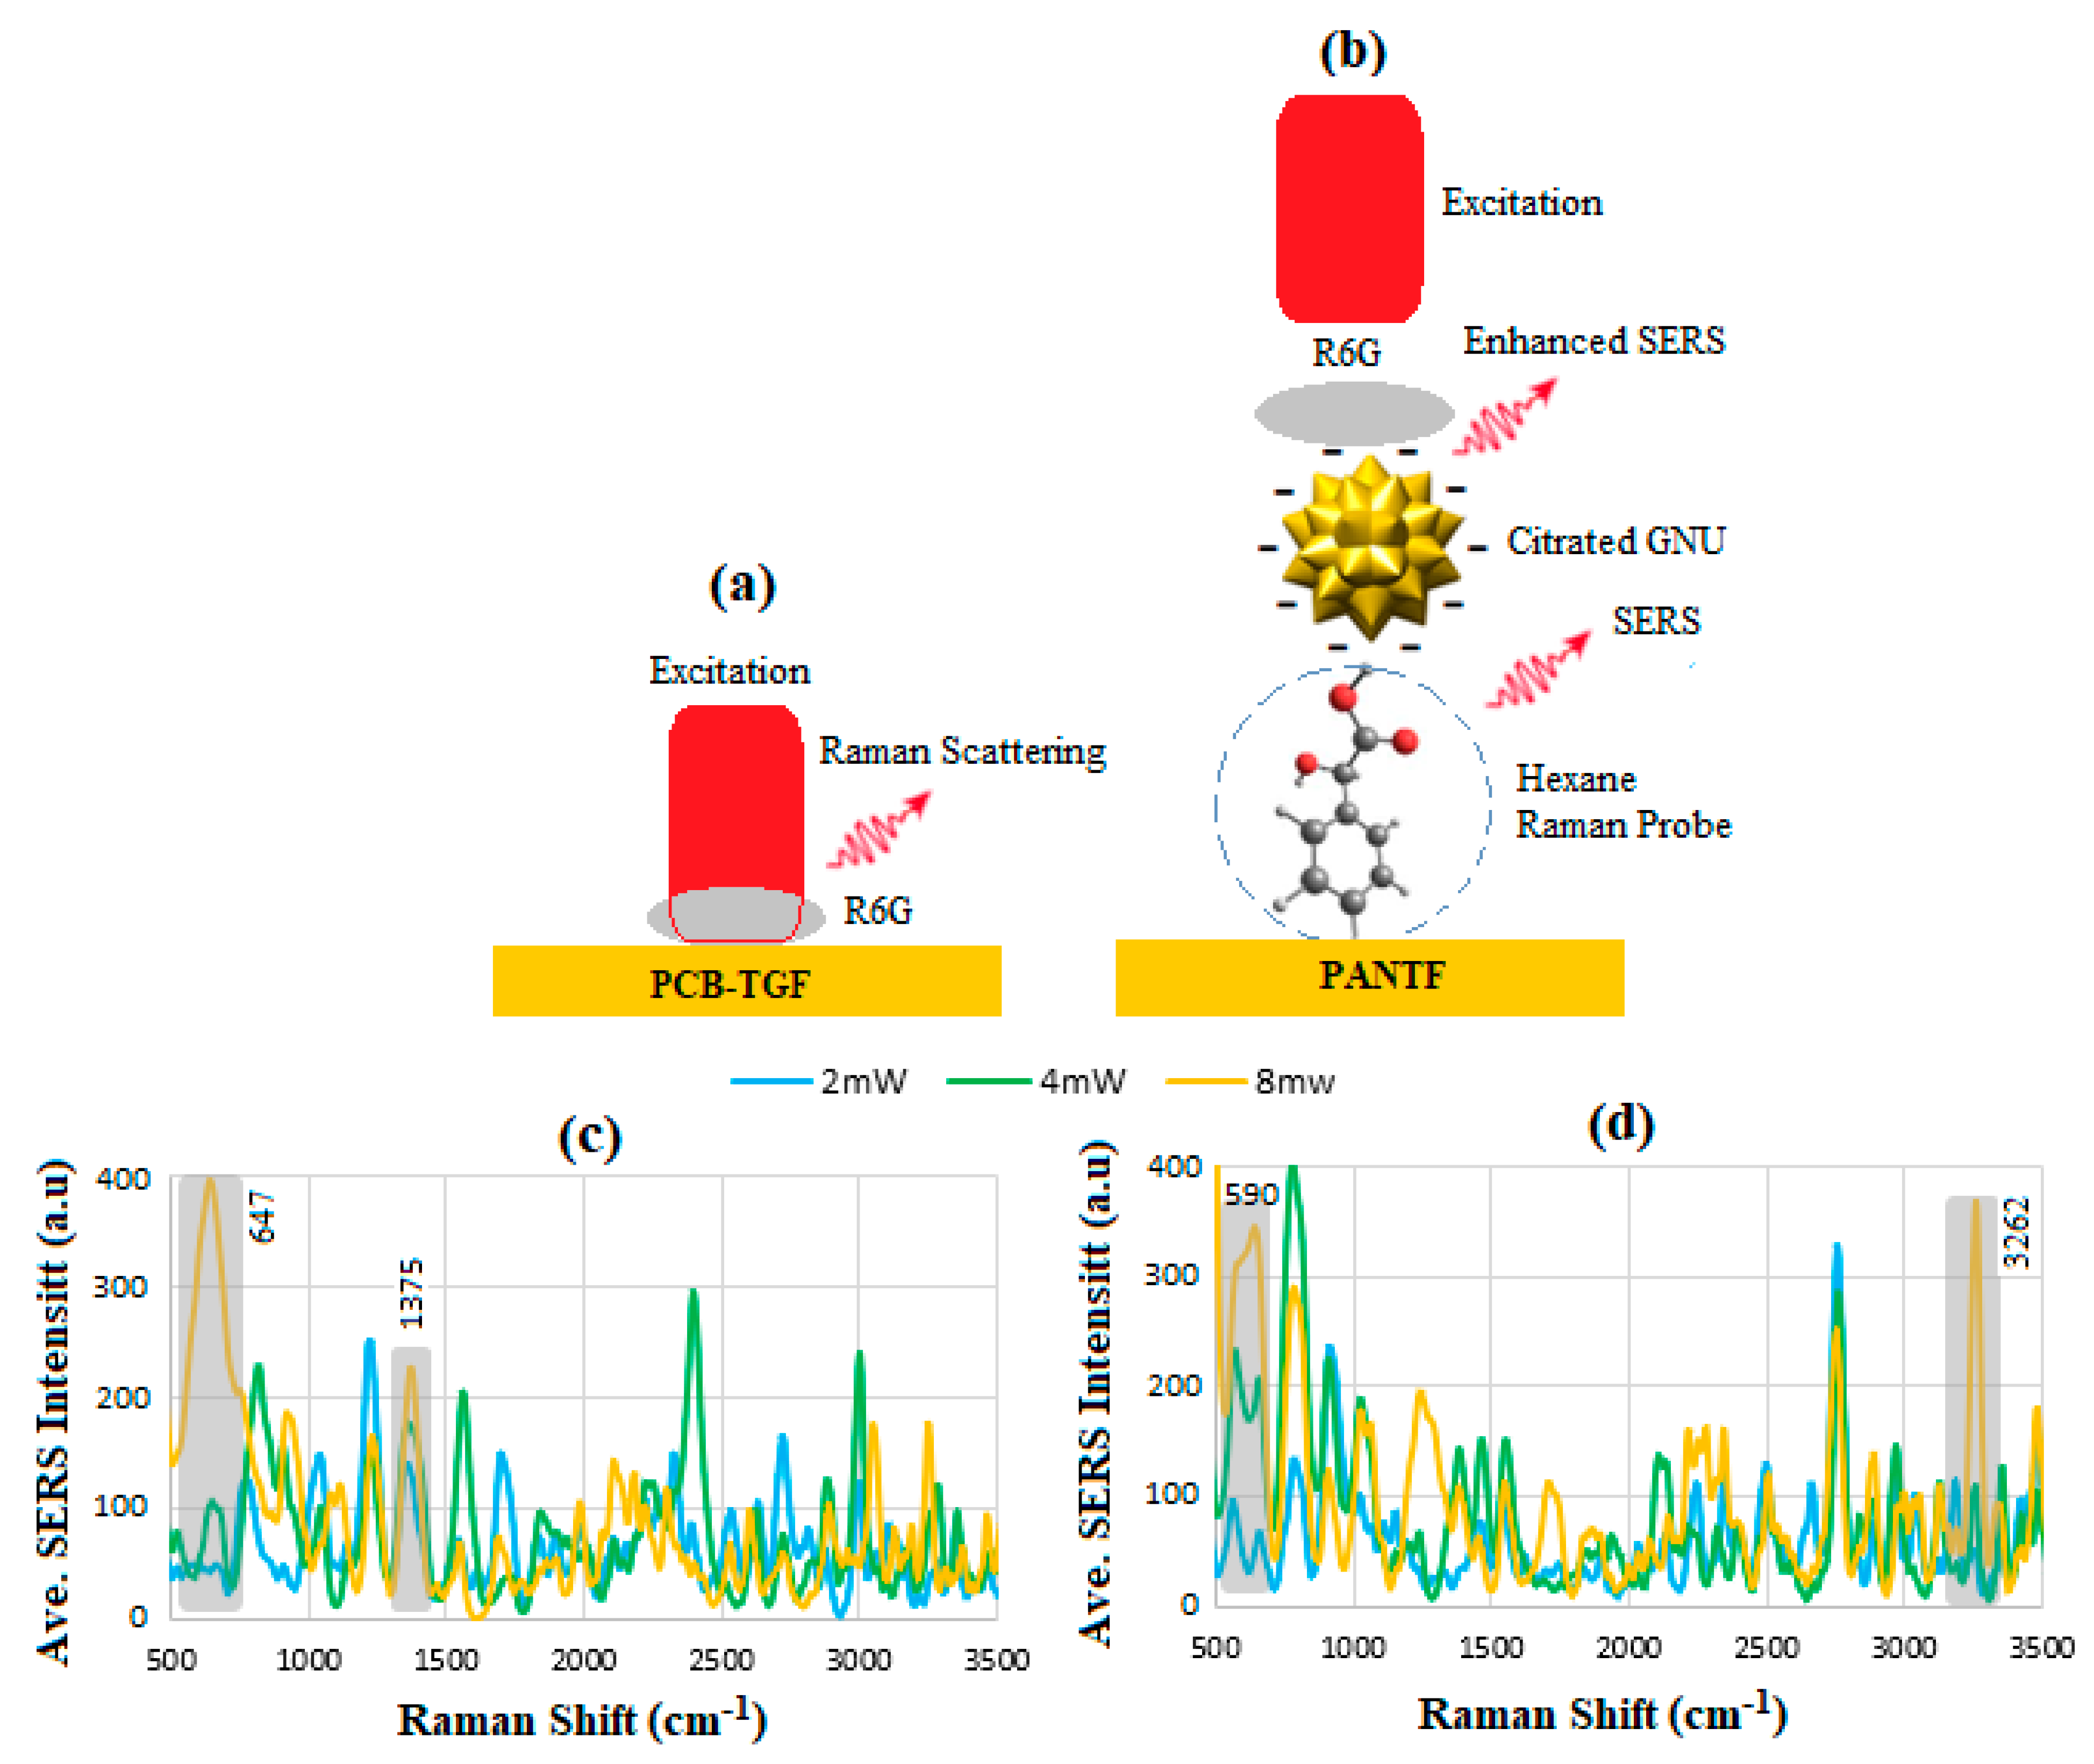
6.3. Enhancement Factor
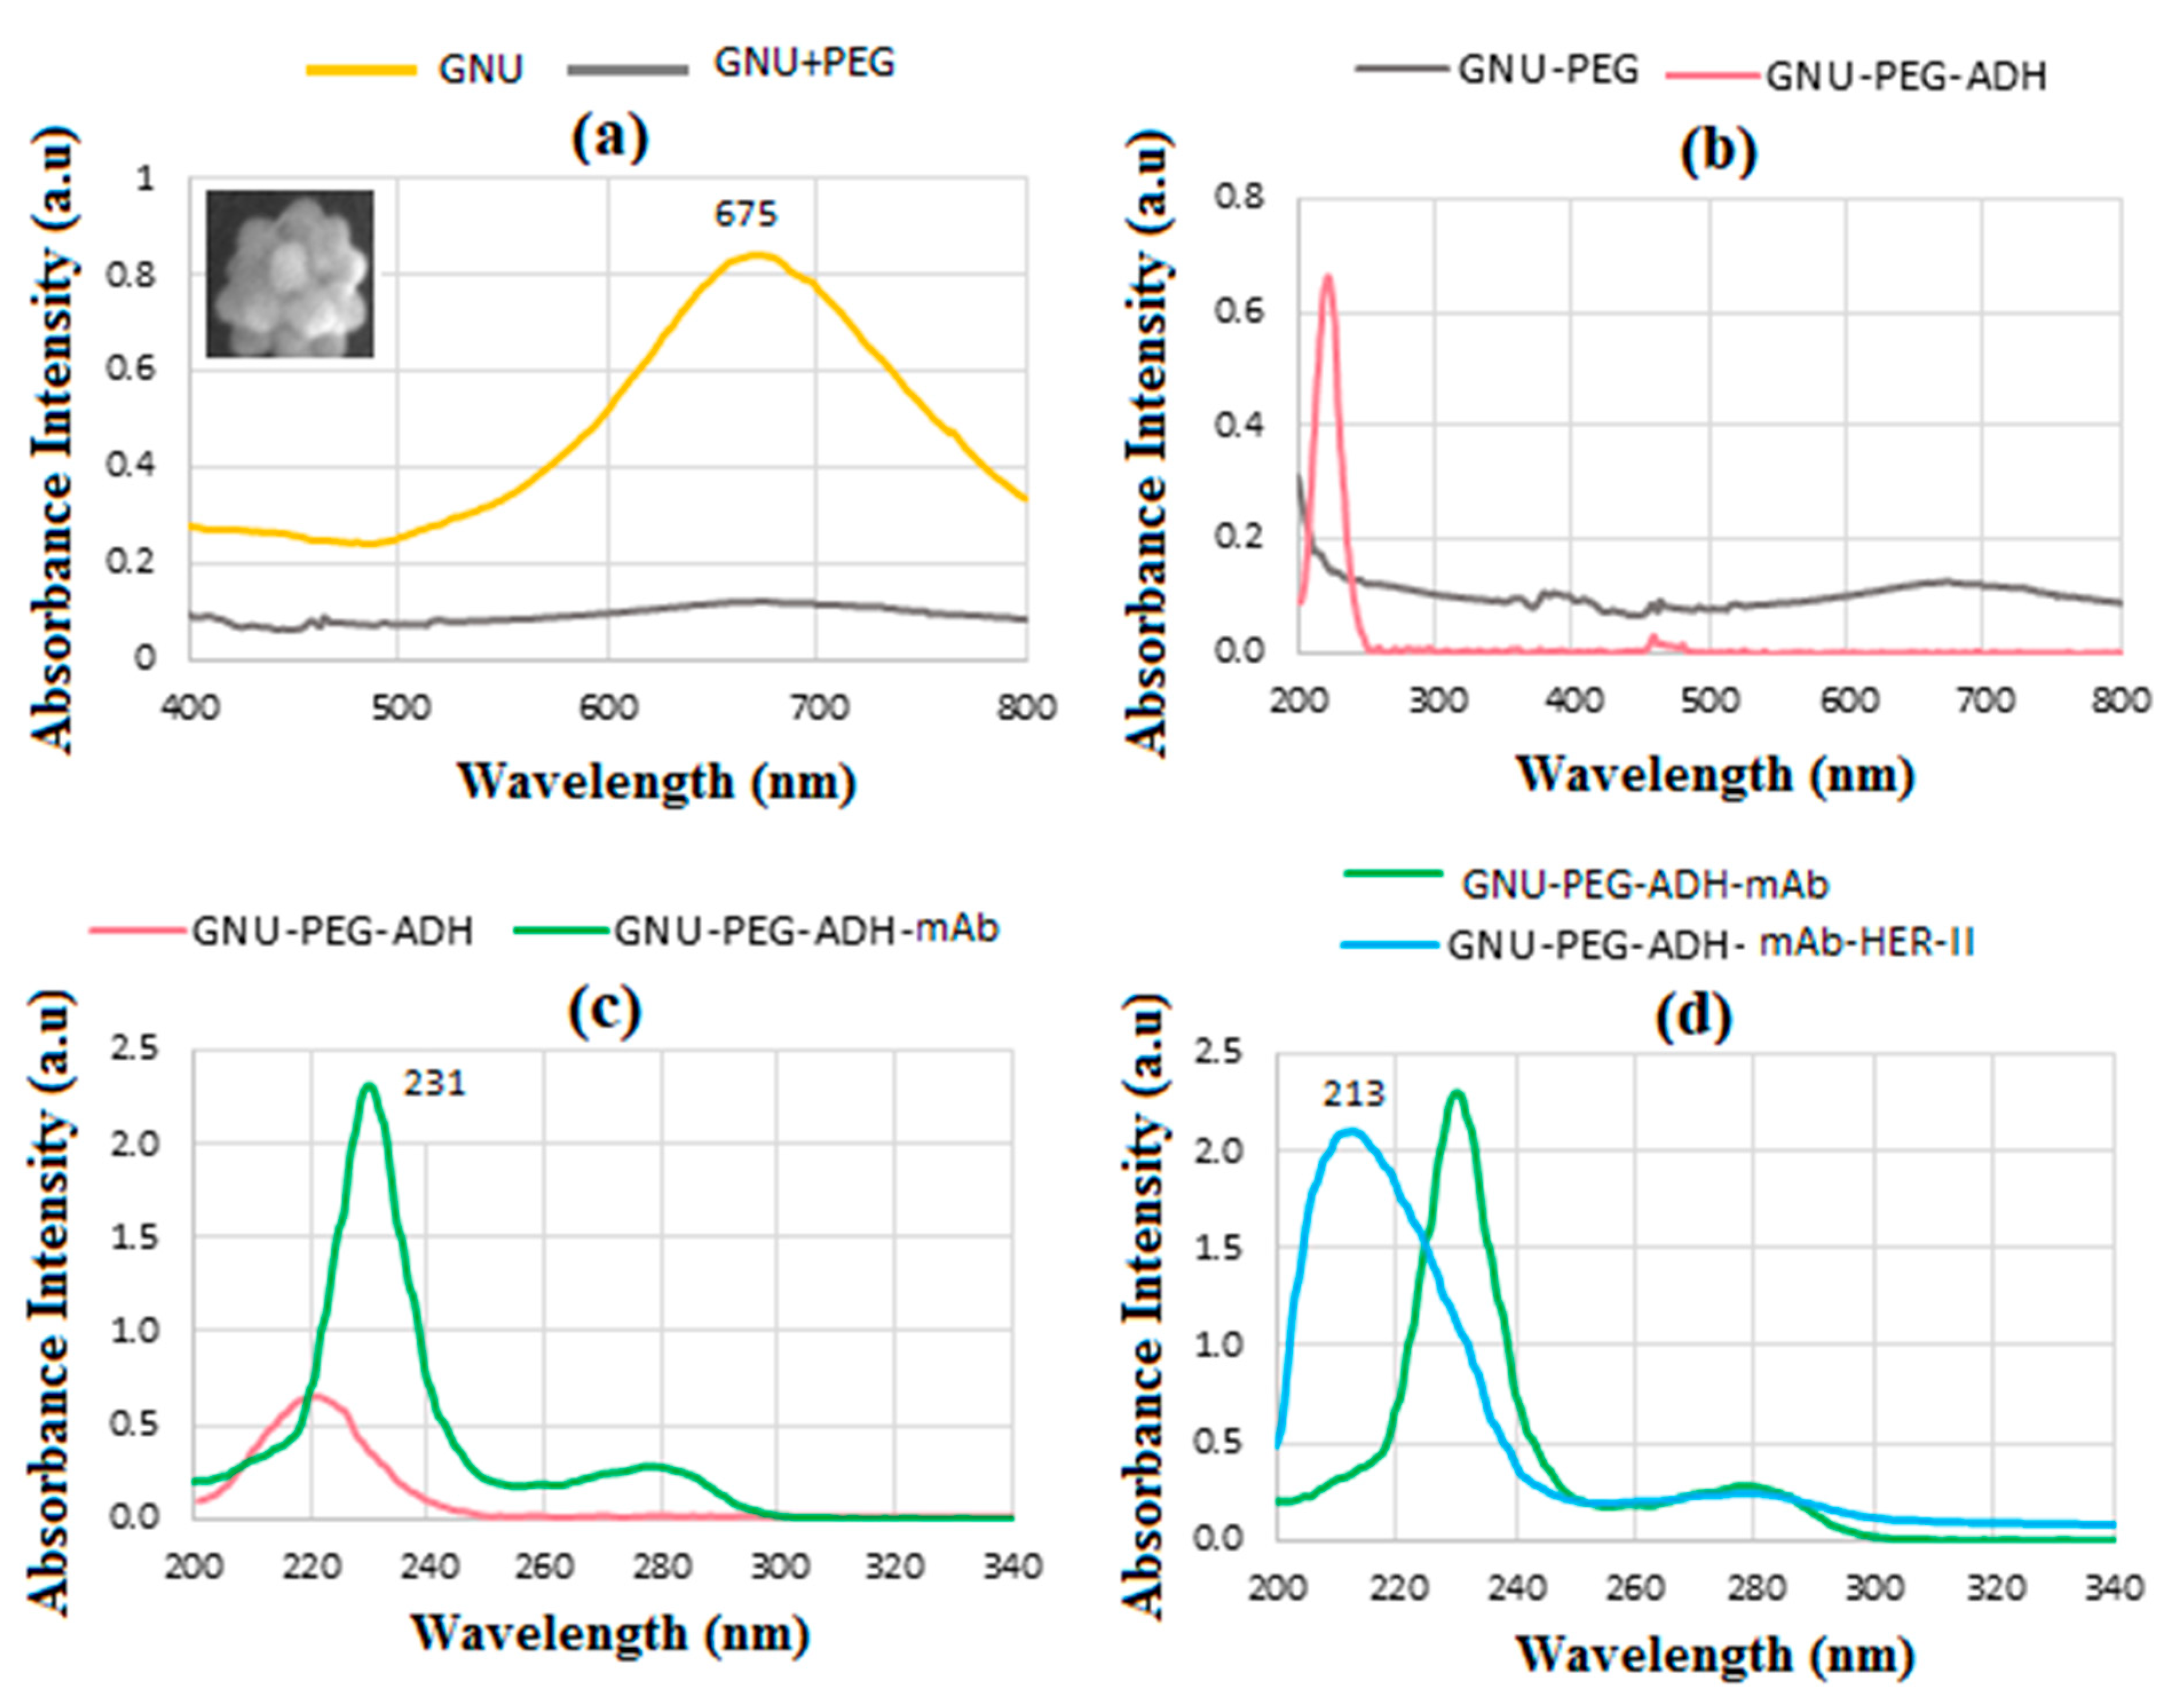
6.4. UV-Vis Spectroscopy
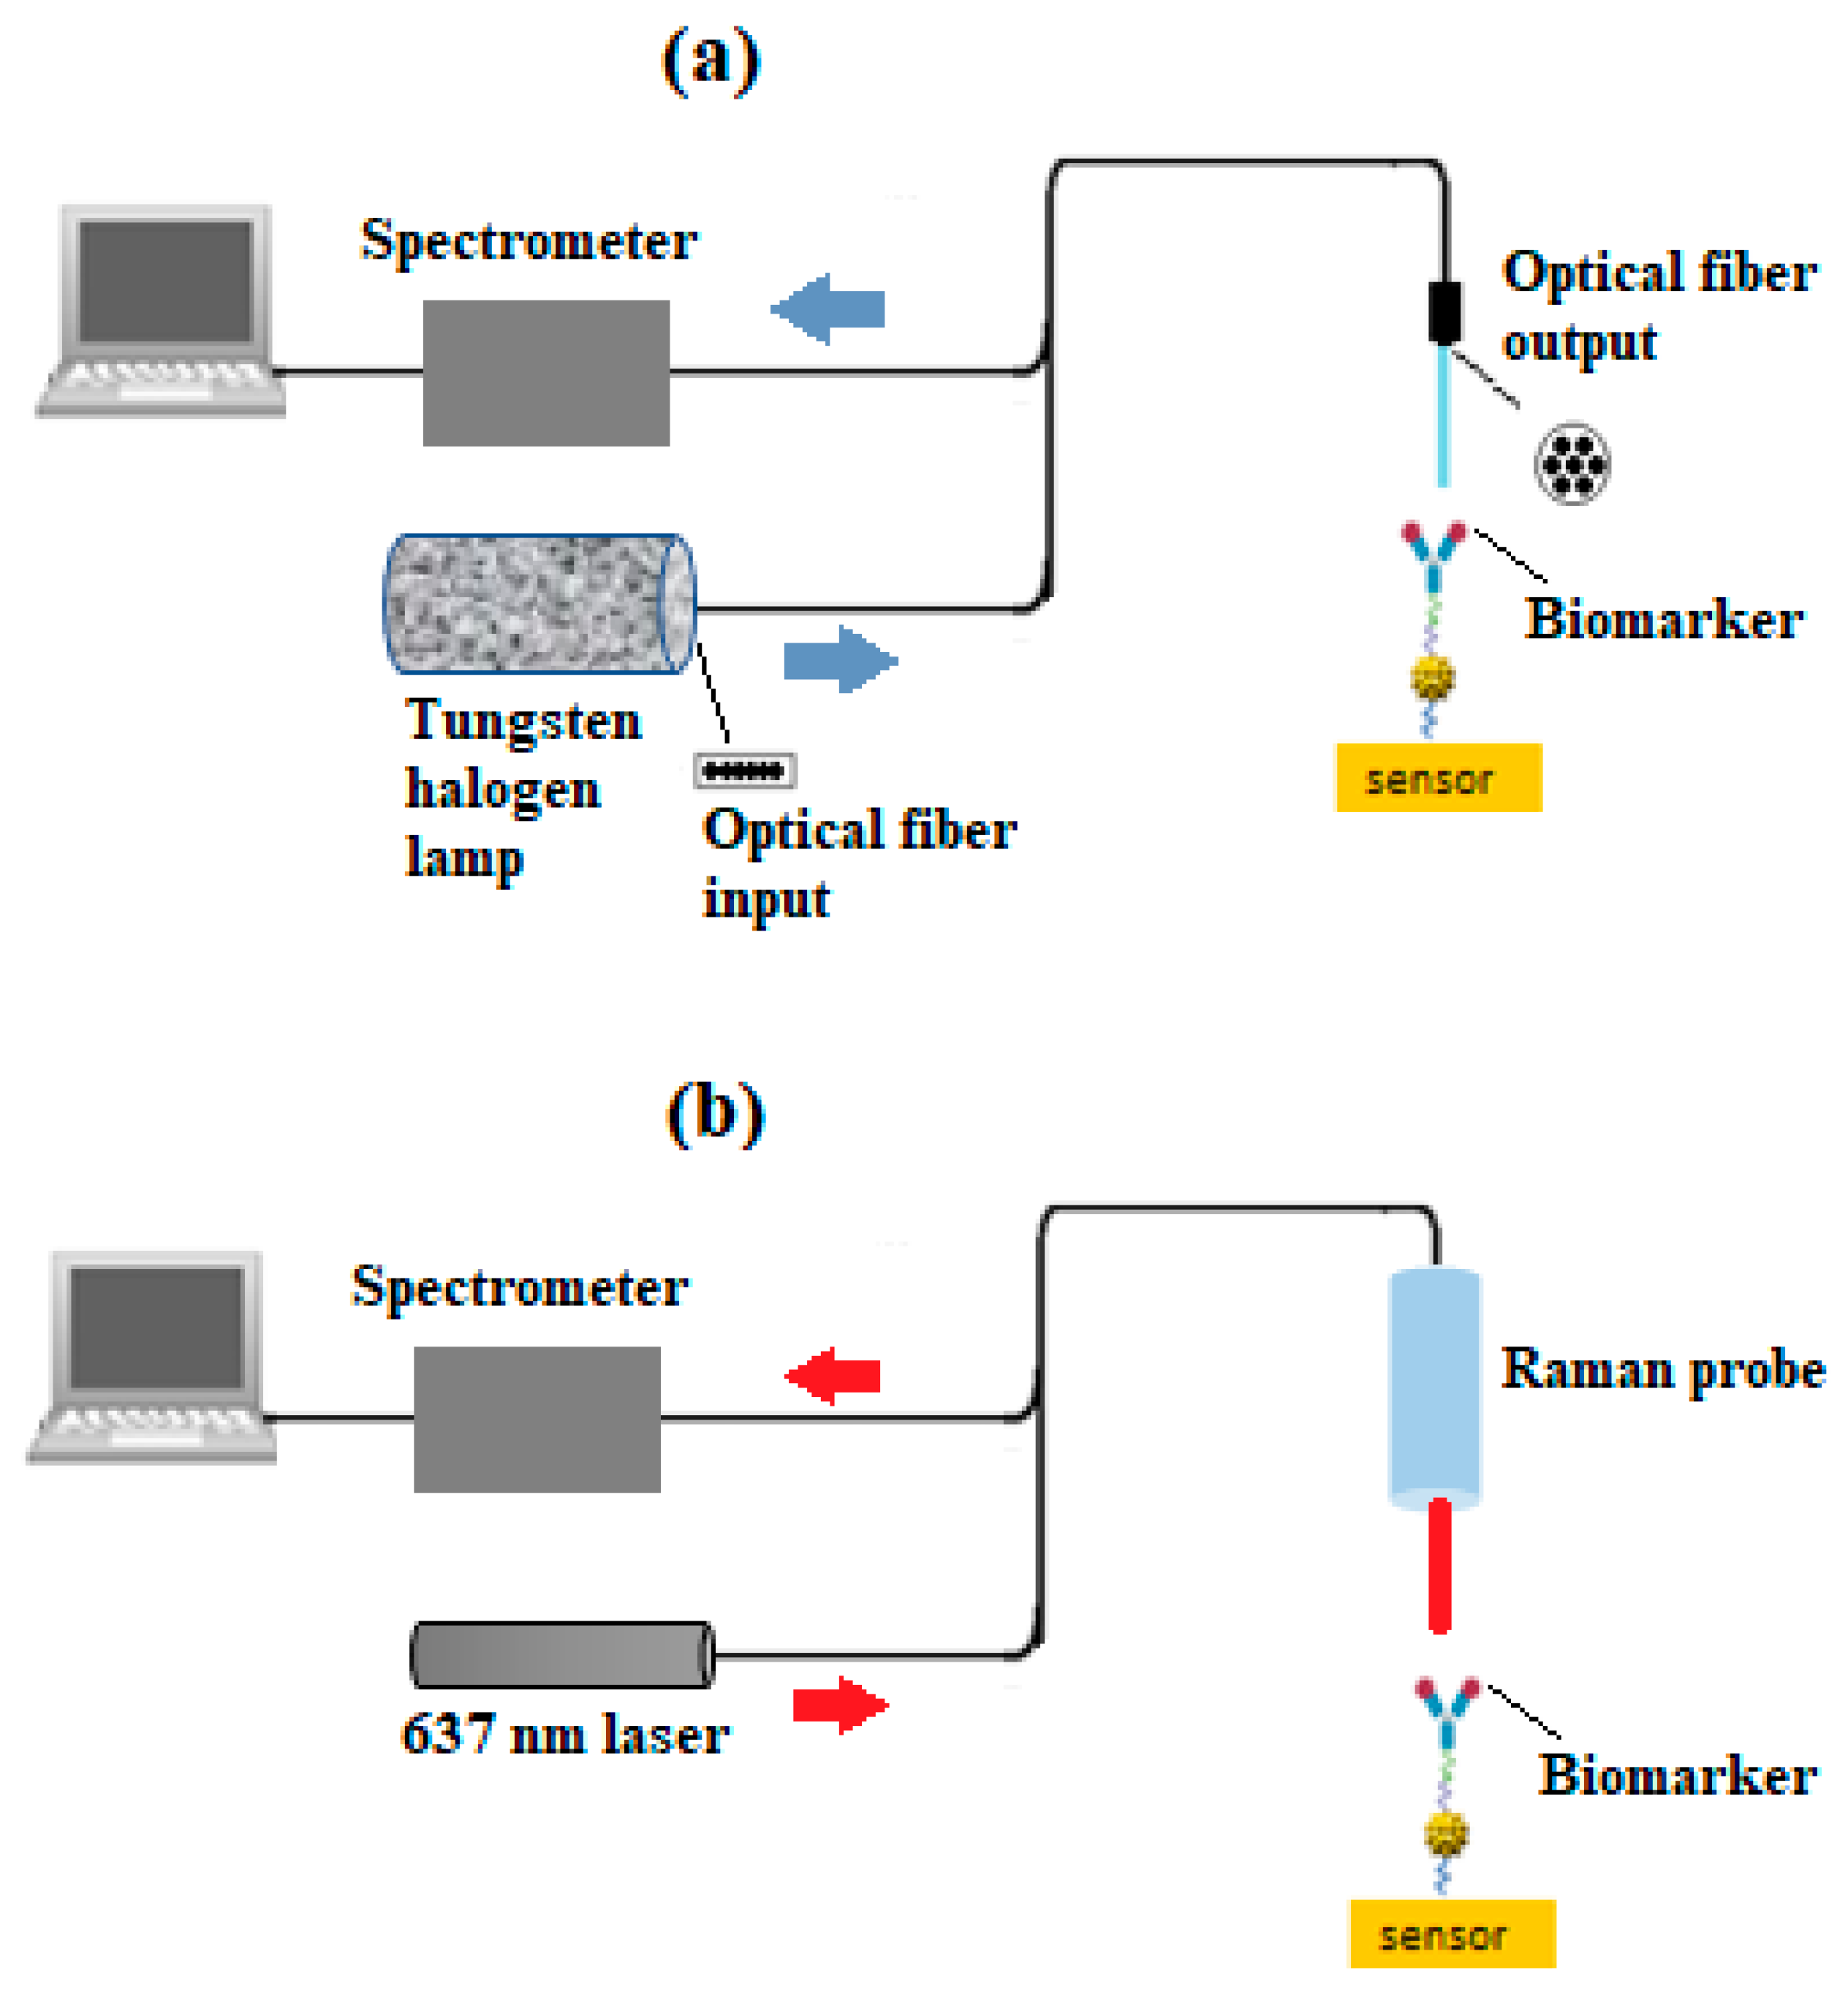
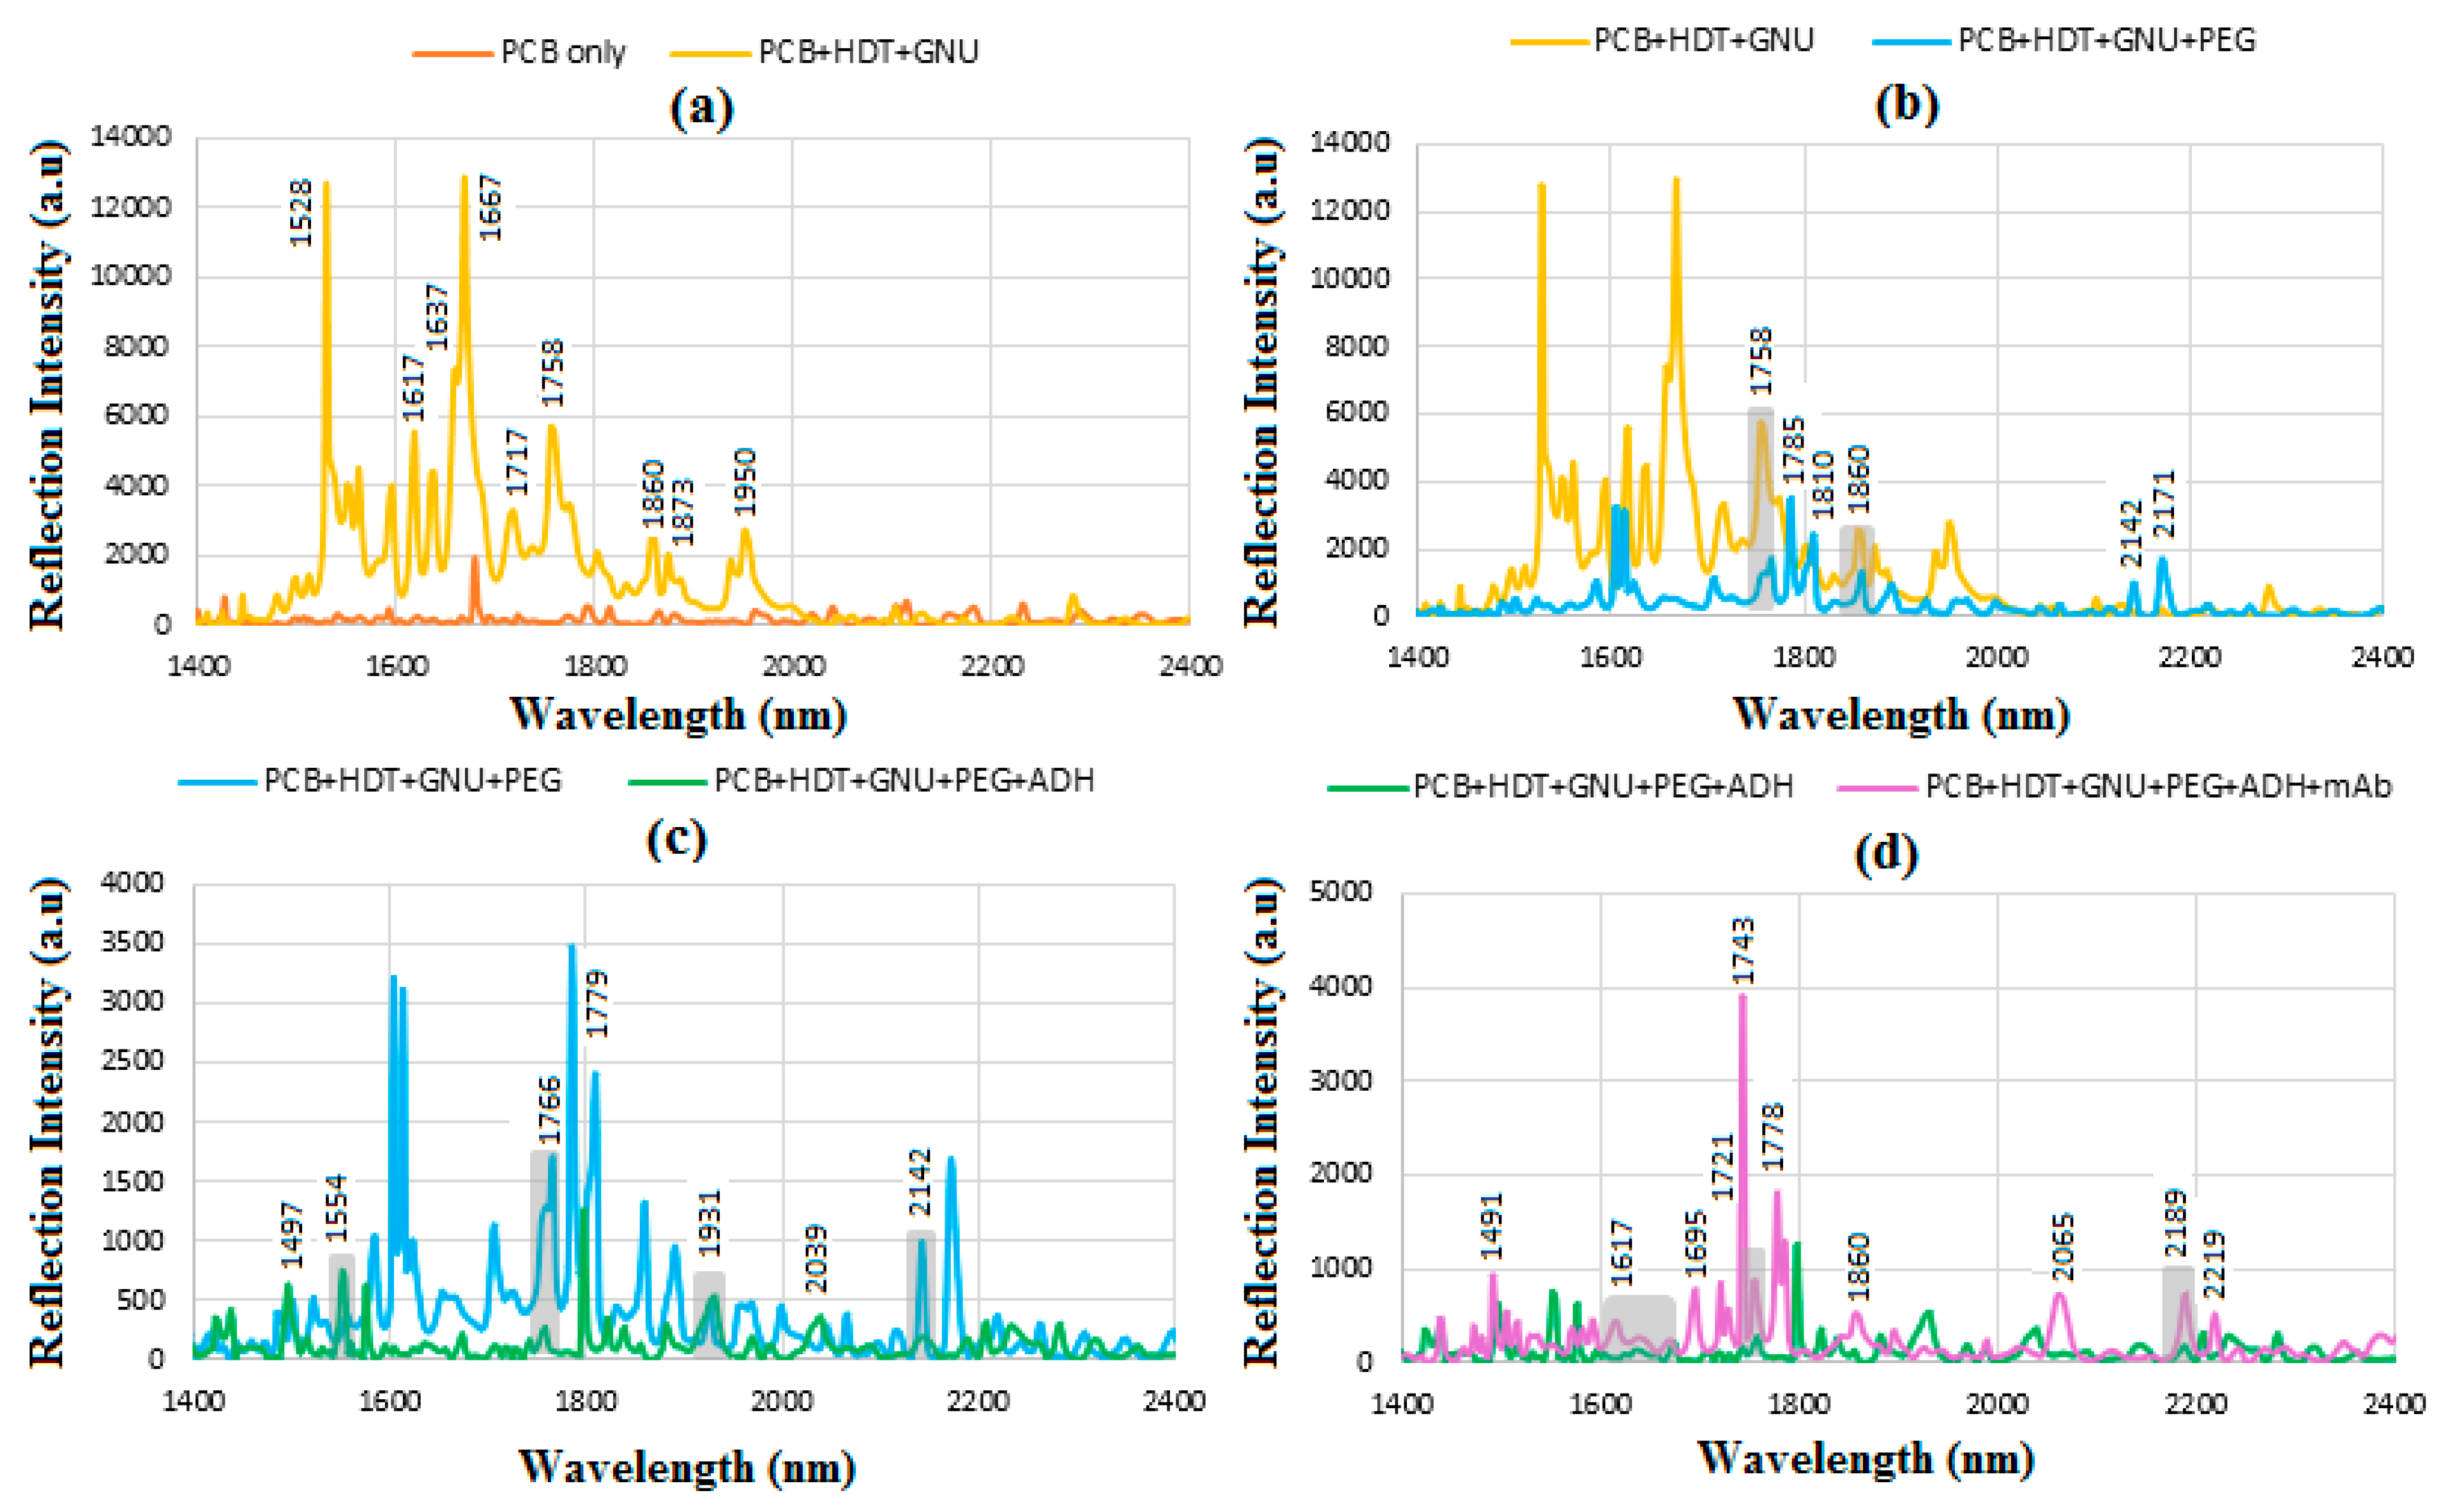
6.5. FT-NIR Spectroscopy
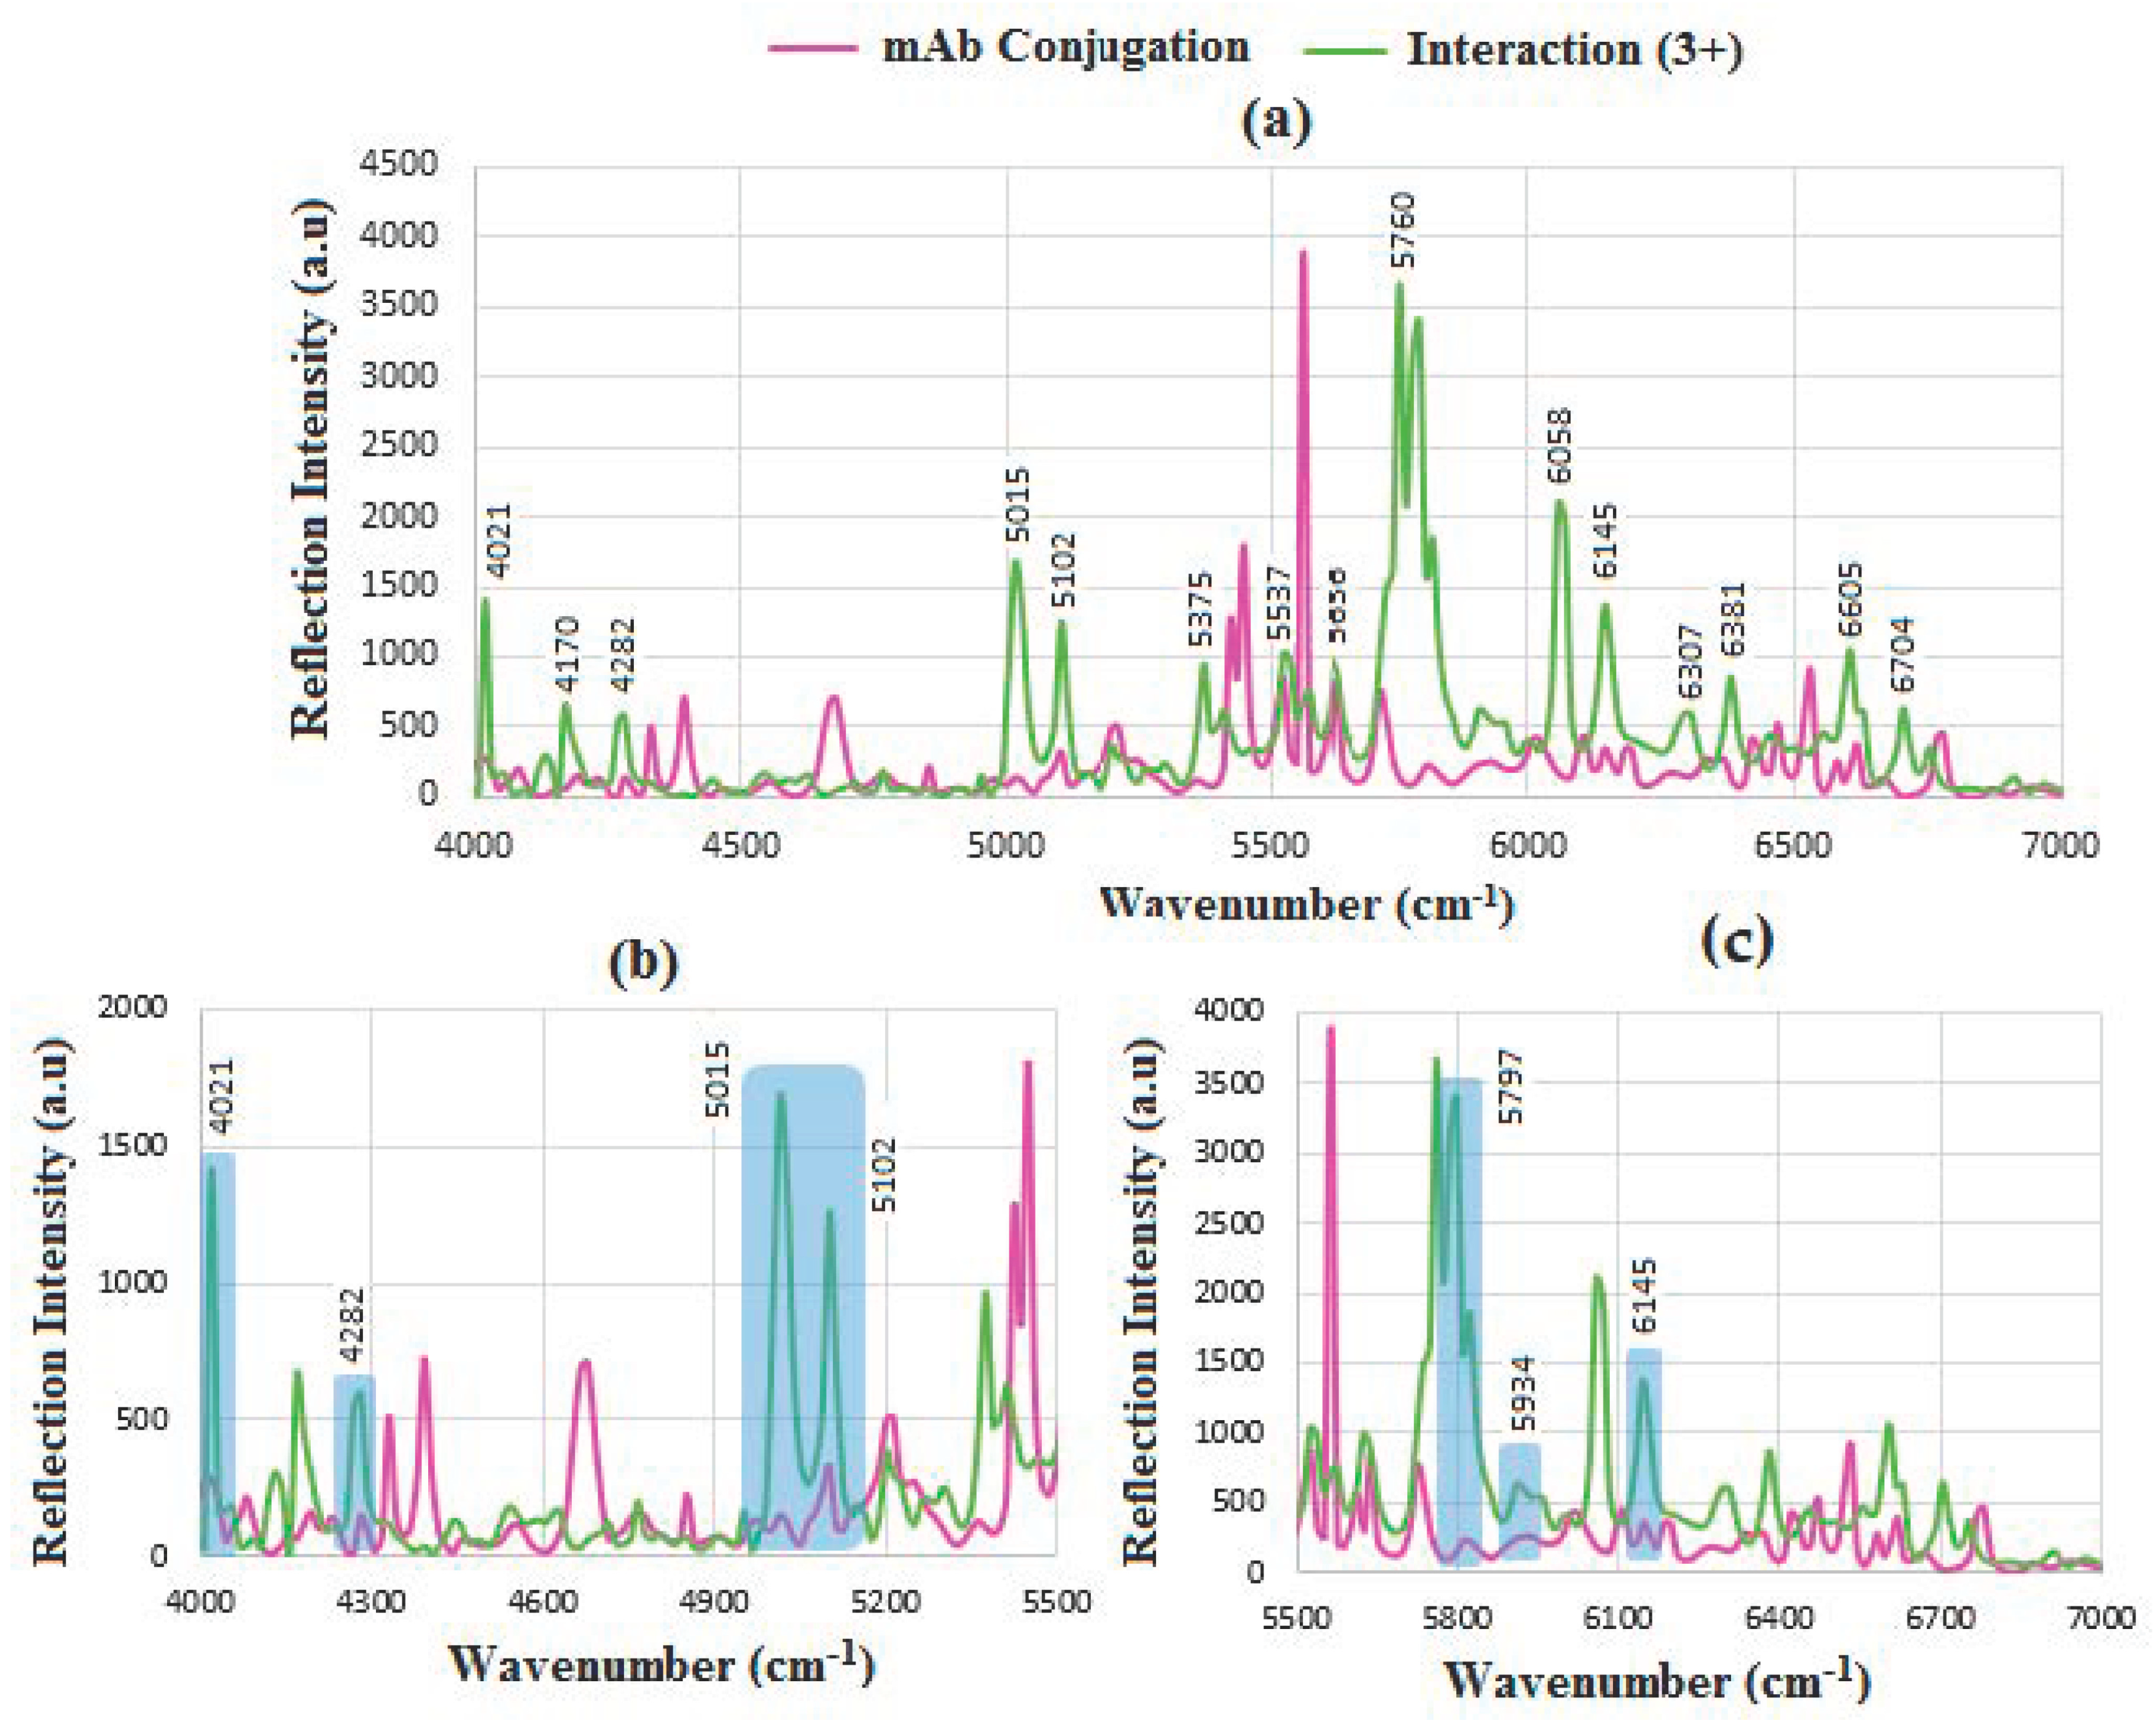
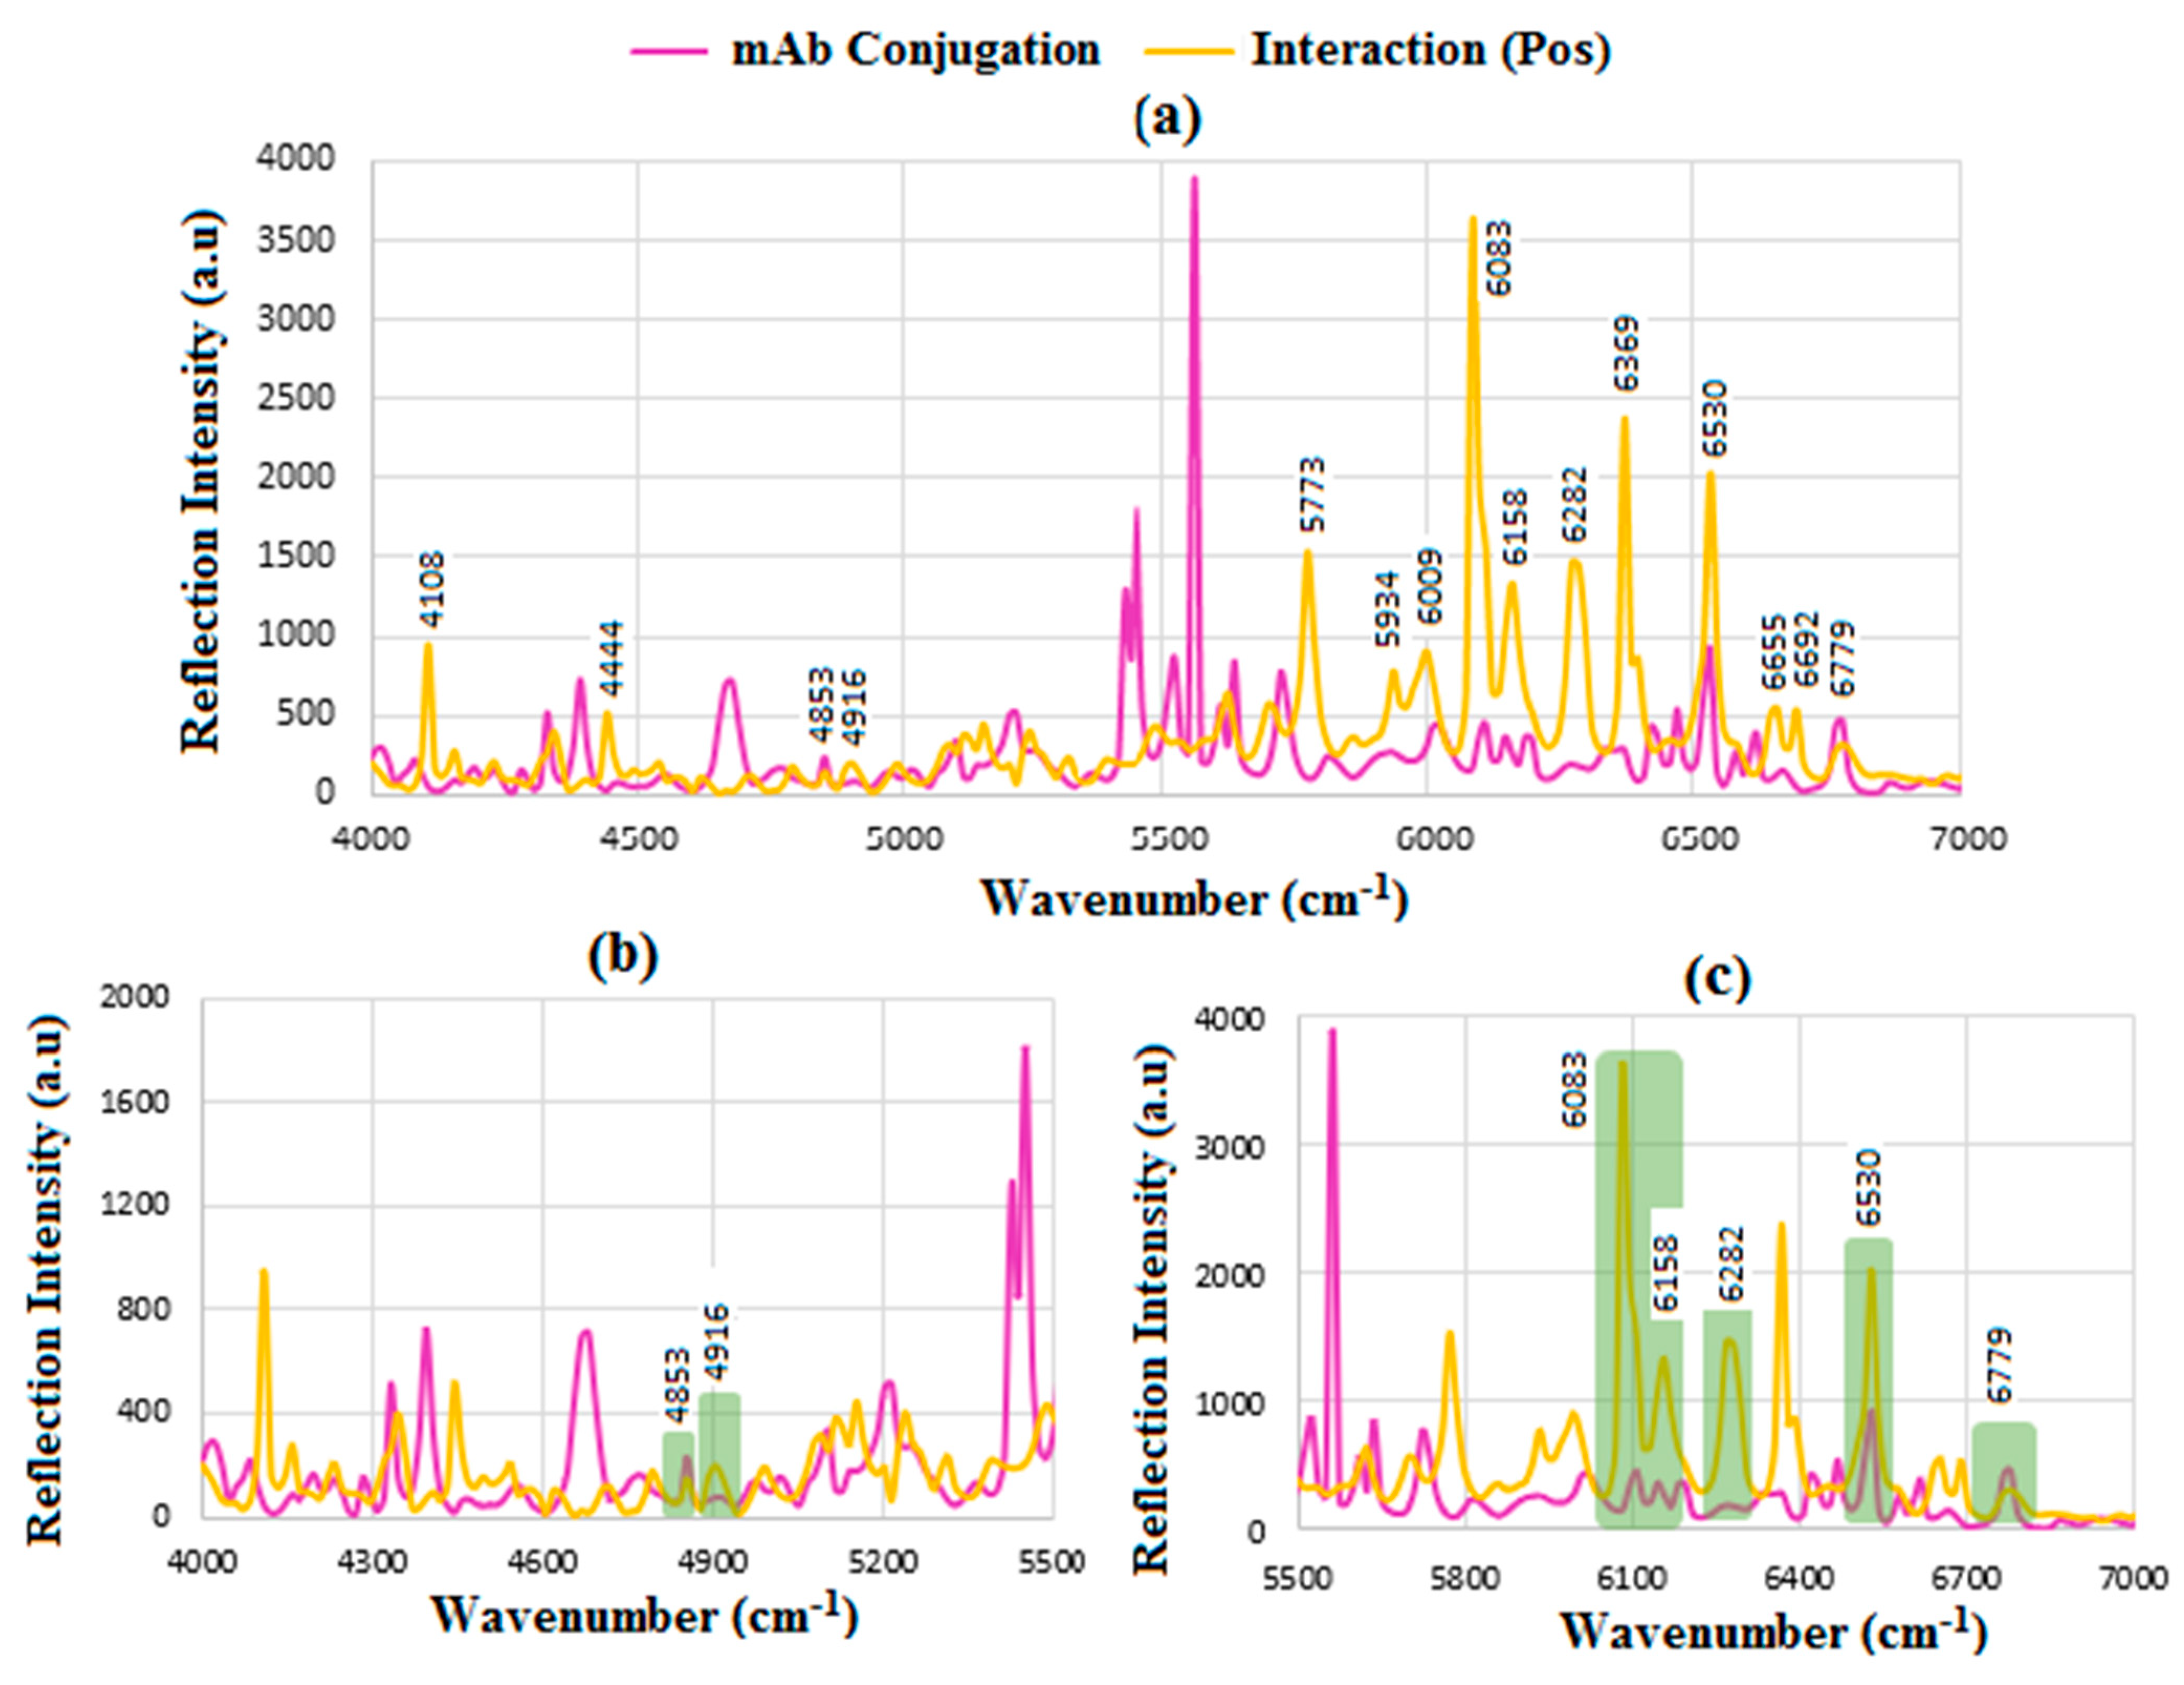
6.6. SERS
6.7. Statistical Analysis
7. Conclusions
Author Contributions
Funding
Institutional Review Board Statement
Informed Consent Statement
Data Availability Statement
Conflicts of Interest
References
- Loeb, K.R.; Loeb, L.A. Significance of multiple mutations in cancer. Carcinogenesis 2000, 21, 379–385. [Google Scholar] [CrossRef]
- Siegel, R.L.; Jamel, A.; Wander, R.C. An assessment of progress in cancer control. CA Cancer J. Clin. 2018, 6, 329–339. [Google Scholar] [CrossRef]
- Siegel, R.L.; Ma, J.Z.; Zou Jemal, A. Cancer statistics. CA Cancer J. Clin. 2014, 64, 9–29. [Google Scholar] [CrossRef] [PubMed]
- Fan, L.; Strasser-Weippl, K.; Li, J.; St Louis, J.; Finkelstein, D.; Chen, W.; Shao, Z. Breast cancer in China. Lancet Oncol. 2014, 15, e279–e289. [Google Scholar] [CrossRef]
- Momenimovahed, Z.; Salehiniya, H. Epidemiological characteristics of and risk factors for breast cancer in the world. Breast Cancer 2019, 11, 151–164. [Google Scholar] [CrossRef]
- Zhang, P.; Xiao, J.; Zhang, R.; Zhang, X. Monitoring value of serum HER2 as a predictive biomarker in patients with metastatic breast cancer. Cancer Manag. Res. 2020, 12, 4667–4675. [Google Scholar] [CrossRef] [PubMed]
- Shaath, H.; Elango, R.; Alajez, N.M. Molecular classification of breast cancer utilizing long non-coding RNA (lncRNA) transcriptomes identifies novel diagnostic lncRNA panel for triple-negative breast cancer. Cancers 2021, 13, 5350. [Google Scholar] [CrossRef]
- Fan, X.; White, I.M.; Shopova, S.I.; Suter, J.D.; Sun, Y. Sensitive optical biosensors for unlabeled targets: A review. Anal. Chim. Acta 2008, 620, 8–26. [Google Scholar] [CrossRef]
- Justino, C.I.; Duarte, A.C.; Rocha-Santos, T.A. Immunosensors in clinical laboratory diagnostics. In Advances in Clinical Chemistry; Elsevier: Oxford, UK, 2016; pp. 65–108. [Google Scholar]
- Holford, T.R.; Davis, F.; Higson, S.P. Recent trends in antibody-based sensors. Biosens. Bioelectron. 2012, 34, 12–24. [Google Scholar] [CrossRef] [PubMed]
- Jiang, S.; Win, K.Y.; Liu, S.; Teng, C.P.; Zheng, Y.; Han, M.Y. Surface-functionalized nanoparticles for biosensing and imaging-guided therapeutics. Nanoscale 2013, 5, 3127–3148. [Google Scholar] [CrossRef]
- Lipscomb, J. Estimating the cost of cancer care in the United States: A work very much in Progress. J. Natl. Cancer Instig. 2008, 100, 607–610. [Google Scholar] [CrossRef] [PubMed]
- Gu, H.Y.; Yu, A.M.; Chen, H.Y. Direct electron transfer and characterization of hemoglobin immobilized on a Au colloid–cysteamine-modified gold electrode. J. Electroanal. Chem. 2001, 516, 119–126. [Google Scholar] [CrossRef]
- Ludwig, J.A.; Weinstein, J.N. Biomarkers in cancer staging, prognosis and treatment selection. Nat. Rev. Cancer 2005, 5, 845–856. [Google Scholar] [CrossRef] [PubMed]
- Stone, N.; Prieto, M.; Crow, P.; Uff, J.; Ritchie, A. The use of Raman spectroscopy to provide an estimation of the gross biochemistry associated with urological pathologies. Anal. Bioanal. Chem. 2007, 387, 1657–1688. [Google Scholar] [CrossRef] [PubMed]
- Silveira, L.; Leite, K.; Silveira, F.; Srougi, M.; Zângaro, R.; Pasqualucci, C. Discrimination of prostate carcinoma from benign prostate tissue fragments in-vitro by estimating the gross biochemical alterations through Raman spectroscopy. Lasers Med. Sci. 2014, 29, 1469–1477. [Google Scholar] [CrossRef]
- Willets, K.A.; Van Dune, R.P. Localized surface plasmon resonance spectroscopy and Sensing. Annu. Phys. Rev. Chem. 2007, 58, 267–297. [Google Scholar] [CrossRef]
- Lee, J.; Shim, S.; Kim, B.; Shin, H. Surface-enhanced Raman scattering of single-and few- layer graphene by the deposition of gold nanoparticles. Chem. Eur. J. 2011, 17, 2381–2387. [Google Scholar] [CrossRef]
- Read, C.G.; Stein Miller, E.M.; Choi, K.S. Atomic plane-selective deposition of gold nanoparticles on metal oxide crystals exploiting preferential adsorption of additives. J. Am. Chem. Soc. 2009, 131, 12040–12041. [Google Scholar] [CrossRef]
- Dharanivasan, G.; Rajamuthuramalingam, T.; Jesse, D.M.; Rajendiran, N.; Kathiravan, K. Gold nanoparticles assisted characterization of amine functionalized polystyrene multiwall plate and glass slide surfaces. Appl. Nanosci. 2015, 5, 39–50. [Google Scholar] [CrossRef]
- Sasmal, H.S.; Halder, A.; Kunjattu, S.; Dey, K.; Nadol, A.; Ajithkumar, T.; Bedadur, P.; Banerjee, R. Covalent self-assembly in two dimensions: Connecting covalent organic framework nanospheres into crystalline and porous thin films. J. Am. Chem. Soc. 2019, 141, 20371–20379. [Google Scholar] [CrossRef]
- Jain, P.K.; Lee, K.S.; El-Sayed, I.H.; El-Sayed, M.A. Calculated absorption and scattering properties of gold nanoparticles of different size, shape, and composition: Applications in biological imaging and biomedicine. J. Phys. Chem. B 2006, 110, 7238–7248. [Google Scholar] [CrossRef] [PubMed]
- Shan, B.; Pu, Y.; Chen, Y.; Liiao, M.; Li, M. Novel SERS labels: Rational design, functional Integration and biomedical applications. Coordination Chem. Rev. 2018, 371, 11–37. [Google Scholar] [CrossRef]
- Hassannejad, Z.; Khosroshahi, M.E. Synthesis and evaluation of time dependent optical properties of plasmonic-magnetic nanoparticles. Opt. Mater. 2013, 35, 644–651. [Google Scholar] [CrossRef]
- Otto, A.; Mrozek, I.; Grabhorn, H.; Akemann, W. Surface-enhanced Raman scattering. J. Phys. Condens. Matter 1992, 4, 1143. [Google Scholar] [CrossRef]
- Rodríguez-Oliveros, R.; Sánchez-Gill, J. Gold nanostars as thermoplasmonic nanoparticles for optical heating. Opt. Express 2012, 20, 621–626. [Google Scholar] [CrossRef] [PubMed]
- Hrelescu, C.; Sau, T.; Rogach, A.; Jackel, F.; Feldman, J. Single gold nanostars enhance Raman scattering. Appl. Phys. Lett. 2009, 94, 153113. [Google Scholar] [CrossRef]
- Shan, F.; Zhang, X.; Chang, X.; Zhang, L. Investigation of simultaneously existed Raman scattering enhancement and inhibiting fluorescence using surface modified gold nanostars as SERS probes. Sci. Rep. 2017, 7, 6813–6823. [Google Scholar] [CrossRef] [PubMed]
- Jane, D.; Gorunmez, Z.; Bruzas, I.; Beck, T.; Sagle, L. Surface enhanced Raman spectroscopy of a Au@Au core-shell structure containing a spiky shell. J. Phys. Chem. 2016, 120, 20814–20821. [Google Scholar] [CrossRef]
- Khosroshahi, M.E.; Woll-Morison, V.; Patel, Y. Near IR-plasmon enhanced guided fluorescence and thermal imaging of tissue subsurface target using ICG-labelled gold nanourchin and protein Contrast agent: Implication of stability. Laser Med. Sci. 2022, 37, 2145–2156. [Google Scholar] [CrossRef]
- Jalani, G.; Cerruti, M. Nano graphene oxide-wrapped gold nanostars as ultrasensitive and stable SERS nanoprobes. Nanoscale 2015, 7, 9990–9997. [Google Scholar] [CrossRef]
- Lin, J.; Huang, Z.; Lin, X.; Wu, Q.; Quan, K.; Cheng, Y. Rapid and label-free urine test based on surface-enhanced Raman spectroscopy for the non-invasive detection of colorectal cancer at different stages. Biomed Opt. Exp. 2020, 11, 7109–7119. [Google Scholar] [CrossRef] [PubMed]
- Kong, K.V.; Leong, W.; Lam, Z.; Goh, D.; Olivo, M. A rapid and label-free SERS detection method for biomarkers in clinical biofluid. Small 2014, 10, 5030–5034. [Google Scholar] [CrossRef] [PubMed]
- Lin, Y.; Gao, J.; Tang, S.; Zheng, M.; Xie, S.; Yu, Y.; Lin, J. Label-free diagnosis of breast cancer on serum protein purification assisted surface-enhanced Raman spectroscopy. Specttrochem. Acta Part A Mol. Biomol. Spectrosc. 2021, 263, 120234. [Google Scholar] [CrossRef] [PubMed]
- Avci, E.; Yilmaz, H.; Sahiner, N.; Tuna, B.; Basak, K.; Dogan, S.; Culha, M. Label-free surface enhanced Raman spectroscopy for cancer detection. Cancers 2022, 14, 5021. [Google Scholar] [CrossRef] [PubMed]
- Khosroshahi, M.E.; Chabok, R.; Chung, N.; Patel, Y. Glass-based biosensor for targeted detection of HER-II biomarker in serum using oriented antibody-conjugated gold nanourchin. Plasmonics 2023, 8, 2155–2176. [Google Scholar] [CrossRef]
- Khosroshahi, M.E.; Patel, Y. Reflective FT-NIR and SERS Study of HER-II breast cancer biomarker in blood serum using plasmonic-active nanostructured thin film immobilized with oriented monoclonal antibody. J. Biophotonics 2022, 1–18. [Google Scholar] [CrossRef]
- Khosroshahi, M.E.; Patel, Y.; Umashanker, V.; Gaoiran, C. Fabrication of and characterization of directional antibody-conjugated gold nanourchin colloid and effect of laser polarization on SERS detection of breast cancer biomarker in serum. Colloids Surf. A Physicochem. Eng. Asp. 2024, 694, 134035. [Google Scholar] [CrossRef]
- Bhattarati, J.; Uddin, M.; Stine, K. Plasmonic-active nanostructured thin films. Processes 2020, 8, 115. [Google Scholar] [CrossRef]
- Lopez-Lorente, A.I. Recent developments on gold nanostructures for surface enhanced Raman spectroscopy: Particle shape, substrates and analytical applications. A review. Anal. Chem. Acta A 2021, 1168, 338474. [Google Scholar] [CrossRef]
- Chen, H.; Lin, Z.; Mo, L.; Wu, T.; Tan, C. Near-infrared spectroscopy as a diagnostic tool for distinguishing between normal and malignant colorectal tissues. Biomed Res. Int. 2015, 2015, 472197. [Google Scholar] [CrossRef]
- Wiercigroch, E.; Szafraniec, E.; Czamara, K.; Pacia, M.; Majzner, K.; Kaczor, A.; Malek, K. Raman and infrared spectroscopy of carbohydrates: A review. Spectrochim. Acta A Mol. Biomol. 2017, 185, 317–335. [Google Scholar] [CrossRef] [PubMed]
- Khosroshahi, M.E.; Ghazanfari, L. Physicochemical characterization of Fe3O4/SiO2/Au multilayer nanostructure. Mater. Chem. Phys. 2012, 113, 55–62. [Google Scholar] [CrossRef]
- Narayan, P.; Hancock, B.C. The relationship between the particle properties, mechanical behavior, and surface roughness of some pharmaceutical excipient compacts. Mater. Sci. Eng. A 2003, 355, 24–36. [Google Scholar] [CrossRef]
- Ujihara, M.; Dang, T.; Imae, T. Surface-enhanced resonance Raman scattering of Rhodamine 6G in dispersions and on films of Confeito-like Au nanoparticles. Sensors 2017, 17, 2563. [Google Scholar] [CrossRef]
- Baumberg, J.; Aizpurua, J.; Mikkelsen, R.; Smith, D. Extreme nanophotonics from ultrathin metallic gaps. Nat. Mater. 2019, 18, 668–678. [Google Scholar] [CrossRef]
- Esenturk, E.N.; Walker, A. Surface-enhanced Raman scattering spectroscopy via gold nanostars. J. Raman Spectrosc. 2009, 40, 86–91. [Google Scholar] [CrossRef]
- Antosiewicz, M.J.; Shugar, D. UV-vis spectroscopy of tyrosine side-groups in studies of protein structure, Part 2: Selected applications. Biophys. Rev. 2016, 8, 163–177. [Google Scholar] [CrossRef]
- Ozaki, Y. Near-infrared spectroscopy-its versatility in analytical chemistry. Anal. Sci. Int. J. Jpn. Soc. Anal. Chem. 2012, 28, 545–563. [Google Scholar] [CrossRef]
- Stuart, B.H. Infrared Spectroscopy: Fundamentals and Applications; Wiley: Chichester, UK, 2004. [Google Scholar]
- Eldin, A.B. Near Infra Red Spectroscopy. In Wide Spectra of Quality Control; Akyar, I., Ed.; Intech Open: London, UK, 2011; pp. 237–247. [Google Scholar]
- Giacomelli, C.E.; Bremer, M.G.; Norde, W. ATR-FTIR study of IgG adsorbed on different silica surfaces. J. Colloid Interface Sci. 1999, 220, 13–23. [Google Scholar] [CrossRef] [PubMed]
- Van Stokkum, I.H.; Lindsell, H.; Hadden, J.M.; Haris, P.I.; Chapman, D.; Bloemendal, M. Temperature-induced changes in protein structures studied by Fourier transform infrared spectroscopy and global analysis. Biochemistry 1995, 34, 10508–10518. [Google Scholar] [CrossRef]
- Liu, Y.; Kersey, F.; Register, J.; Parrott, M. Plasmonic gold nanostars for multi-modality sensing and diagnostics. Sensors 2015, 15, 3706–3720. [Google Scholar] [CrossRef] [PubMed]
- Ishigaki, M.; Ozaki, Y. Vibrational Spectroscopy in Protein Research; Academic Press, Elsevier: San Diego, CA, USA, 2020; pp. 143–176. [Google Scholar]
- Izutsu, K.; Fujimaki, Y.; Kuwabara, A.; Hiyama, Y.; Yomota, C.; Aoyagi, N. Near-infrared analysis of protein secondary structure in aqueous solutions and freeze-dried solids. J. Pharm. Sci. 2006, 95, 781–789. [Google Scholar] [CrossRef] [PubMed]
- Tipson, R.S. Infrared Spectroscopy of Carbohydrates: A Review of the Literature; NBS Publications: Washington, DC, USA, 1968; pp. 1–12. [Google Scholar]
- Rastall, R.A. Methods in Plant Biochemistry; Academic Press: London, UK, 1990; Volume 2. [Google Scholar]
- Stick, R.; Williams, S. Carbohydrates: The Essential Molecules of Life, 2nd ed.; Elsevier: Oxford, UK, 2009. [Google Scholar]
- Giangiacomo, R.; Magee, J.B.; Birth, G.S.; Dull, G.G. Predicting concentrations of individual sugars in dry mixtures by near-infrared reflectance spectroscopy. J. Food Sci. 1981, 46, 531–534. [Google Scholar] [CrossRef]
- Giangiacomo, R. Study of water-sugar interactions at increasing sugar concentration by NIR spectroscopy. Food Chem. 2006, 96, 371–379. [Google Scholar] [CrossRef]
- Shenk, J.S.; Workman, J.J.; Westerhaus, M.O. Application of NIR spectroscopy to agricultural products. In Handbook of Near-Infrared Analysis, 2nd ed.; CRC Press: New York, NY, USA; Basel, Switzerland, 2001; pp. 419–470. [Google Scholar]
- Khosroshahi, M.E.; Patel, Y.; Chabok, R. Non-invasive optical characterization and detection of CA 15-3 breast cancer biomarker in blood serum using monoclonal antibody- conjugated gold nanourchin and surface-enhanced Raman scattering. Lasers Med. Sci. 2023, 38, 1–13. [Google Scholar] [CrossRef] [PubMed]
- Smith, B. An IR spectral interpretation potpourri: Carbohydrates and alkynes. Spectroscopy 2017, 32, 18–24. [Google Scholar]


| HER-II Type | Inventory Barcode | Cancer Stage and Group | mAb |
|---|---|---|---|
| 2+ | 2399645 | Early | MAB1129, R&D Systems |
| 3+ | 201608071 | IIIB-Locally advanced | HER-II CAU29848, Biomatik |
| POS | 2572228 | IIIB -Meta | HER-II CAU29848, Biomatik |
| Band Assignment | Wavenumber (cm−1) | Wavelength (nm) |
|---|---|---|
| C-H combination | 4082–4545 | 2449–2200 |
| CH2 | 4140–4444 | 2415–2250 |
| C-C | 4444–4651 | 2250–2150 |
| O-H combination | 4545–5000 | 2200–2000 |
| Combined C-H stretch and C-O | 4690 | 2132 |
| Combined C-H stretch and O-H | 4890 | 2045 |
| C=O stretch 2nd overtone | 5150 | 1942 |
| O-H 1st stretch overtone | 5222–5333 | 1915 |
| C-H 1st stretch overtone | 5556–6061 | 1875–1650 |
| CH2 1st stretch overtone | 5714–5988 | 1750–1670 |
| O-H 1st stretch overtone | 6000–7000 | 1666–1429 |
| O-H 1st stretch overtone | 6667–7143 | 1500–1400 |
| CH2 combination 1st overtone | 6944–7272 | 1440–1375 |
| C-H combination overtone | 7042–7692 | 1420–1300 |
| Band Assignment | Wavenumber (cm−1) |
|---|---|
| Combination modes | 4000–5000 |
| CH2 aromatic combination | 4000–4255 |
| CH2 combination | 4140–4444 |
| CH2 aliphatic combination | 4200–4500 |
| CH2 1st overtone | 5714–5988 |
| CH2 combination 1st overtone | 6944–7272 |
| β-sheet | 4060 |
| α-helix | 4090 4365–4370 |
| C-H combination | 4098–4395 |
| C-H 1st overtone | 5633–5899 |
| C-H combination 1st overtone | 6849–7042 |
| β-sheet | 4405 4525–4540 |
| RNH2 combination | 4535–4683 |
| RNH2 1st overtone | 6600–6734 |
| α-helix | 4615 |
| CONH2(R) combination (N-H stretching) | 4705–4926 |
| β-sheet | 4865 |
| 2nd Overtones and Combination modes | 5000–8000 |
| RCO2H 1st overtone (O-H stretching) | 5249–5333 |
| α-helix | 5755 |
| β-sheet | 5915–5925 |
| Aromatic CH 1st overtone | 6060–6211 |
| Aromatic OH 1st overtone | 7017–7272 |
| Tentative Assignment | Wavenumber (cm−1) |
|---|---|
| Tryptophan ν(C-S) | 449 |
| ν(C-S) | 465 |
| ν(S-S) | 498 |
| C-N-C in amines, Vib. modes of amino acids | 510–400 |
| ν(S-S) | 512 |
| S-S str. disulfide | 550–450 |
| Vib. modes of amide, C-I str. iodine derives | 600–480 |
| C=O in amides | 615–535 |
| Phenylalanine | 622 |
| Tyrosine | 642, 640–650 |
| Tryptophan, δ(-C-H) | 722, 779 |
| C-H out-of-plane bend phenyl, Vib. modes of acids | 770–730 |
| Glycine, alanine v (C-N-C) assigned to the symmetric C-N-C stretch mode | 850–900 |
| C-H, out-of-plane bend | 980–965 |
| Phenylalanine | 1000–1010, 1103 |
| Phenylalanine | 1000–1010 |
| C-N Amines | 1000–1350 |
| Str. vib. mode C-C in the phenyl ring | 1000–1110 |
| ν(C-C) or Alkyl C-N | 1032–1170 |
| C-O benzoic ester, C-OH str. alcohols | 1100–1200 |
| Phenylalanine | 1103 |
| S=O str. sulfuric ester | 1150–1230 |
| Tyrosine | 1166 |
| Tyrosine, ν(-C-N) | 1175 |
| Tyrosine, ν (-C-N) | 1185–1175 |
| C-O stretching carboxylic acid | 1210–1320 |
| Tryptophan | 1220 |
| β-sheet structure, amide III | 1220–1240 |
| Amide III | 1230–1282 |
| Amide III region δ (N-H, Cα-H), v (Cα-N) | 1230–1340 |
| C-O str., acetic ester | 1232–1256 |
| C-O str. benzoic ester | 1250–1310 |
| Tryptophan, α helix | 1300–1345 |
| Vib. mode in phospholipids | 1392 |
| C-O str. Carboxylic acid, Vib. mode in phospholipids, | 1395–1400 |
| Histidine | 1400–1420 |
| C-H scissor in CH2 | 1436–1458 |
| N-H Primary and secondary amines and amides (stretch and bend) | 1550–1640 |
| COO− in carboxylic acid salts | 1560–1610 |
| NH2 in primary amines | 1580–1650 |
| C-O asym. str. -COO− carboxylate | 1610–1540 |
| Tryptophan ν(C=C), Tyrosine | 1620 |
| N-H in primary amides | 1620–1650 |
| C=O stretch in secondary amide (Amide I) | 1630–1680 |
| C=O stretch in primary amide (Amide I) | 1650–1670 |
| Amide I, α helix | 1654 |
| C=O stretch (fairly broad) | 1690–1710 |
| C=O vibration | 1720–1740 |
| C=O antisym stretch | 1790–1870 |
| C=O stretch | 1800–1820 |
| C-N amines, N-H primary and secondary amines and amides (stretch and bend), NH3 amine, and O-H stretch | 1920–2300 |
| N=C stretch | 2115–2175 |
| C=N stretch | 2200–2260 |
| N=C=O asym. str. isocyanate | 2271 |
| P-H stretch | 2280–2410 |
| NH3 I amine, and O-H stretch | 2350–3100 |
| -NH3+ I amine | 2350–2750 |
| O-H stretch (broad) | 2400–3100 |
| O-H stretching | 2560–2750 |
| C-H antisym and sym stretching | 2850–2990 |
| =C-H stretch in aromatic and unsaturated hydrocarbons | 3000–3100 |
| NH3+ in amino acids | 3000–3200 |
| C-H str. olefin | 3010–3040 |
| C-H str. olefin | 3050–3155 |
| C-H str. olefin | 3075–3095 |
| NH3 amine salt | 3145–3355 |
| C-H antisymmetric, C-H stretch, NH3 in amino acids, N-H primary and secondary | 3100–3500 |
| N-H str. primary amide | 3250–3420 |
| -NH2 in aromatic amines, primary amines and amides | 3320–3520 |
| -NH2 in primary amides | 3340–3360 |
| N-H stretching associated NH, amine | 3500–3060 |
| SERS Shift (cm−1) | Assignment |
|---|---|
| 304 | D-(+)-galactose amylopectin |
| 345 | D-(+)-maltose |
| 439 | D-(+)-glucose |
| 452 | D-(+)-raffinose pentahydrate |
| 699 | L-(+)-arabinose |
| 737 | D-(+)-sucrose |
| 770–730 | D- (+)-sucrose |
| 810–833 | D-(−)-ribose |
| 880 | 2-dexy-D-ribose |
| 935 | D-(+)-raffinose pentahydrate |
| 950–810 | D- (+)-raffinose pentahydrate |
| 958,1369 | D (+) mannose |
| 1104 | D-(+)-xylose D-(+)-galactose |
| 1398 | D-(−)-fructose |
| 1481 | D-(+)-galactose |
| 2665 | 2-dexy-D-ribose |
| 2865 | 2-dexy-D-ribose |
| 2919 | D-(−)-ribose |
| 3019 | D-(−)-fructose |
| 3204 | D-(+)-galactose |
| 3393 | D-(+)-glucose |
| 3397 | D-(+)-glucose |
Disclaimer/Publisher’s Note: The statements, opinions and data contained in all publications are solely those of the individual author(s) and contributor(s) and not of MDPI and/or the editor(s). MDPI and/or the editor(s) disclaim responsibility for any injury to people or property resulting from any ideas, methods, instructions or products referred to in the content. |
© 2024 by the authors. Licensee MDPI, Basel, Switzerland. This article is an open access article distributed under the terms and conditions of the Creative Commons Attribution (CC BY) license (https://creativecommons.org/licenses/by/4.0/).
Share and Cite
Khosroshahi, M.E.; Patel, Y.; Umashanker, V. Targeted FT-NIR and SERS Detection of Breast Cancer HER-II Biomarkers in Blood Serum Using PCB-Based Plasmonic Active Nanostructured Thin Film Label-Free Immunosensor Immobilized with Directional GNU-Conjugated Antibody. Sensors 2024, 24, 5378. https://doi.org/10.3390/s24165378
Khosroshahi ME, Patel Y, Umashanker V. Targeted FT-NIR and SERS Detection of Breast Cancer HER-II Biomarkers in Blood Serum Using PCB-Based Plasmonic Active Nanostructured Thin Film Label-Free Immunosensor Immobilized with Directional GNU-Conjugated Antibody. Sensors. 2024; 24(16):5378. https://doi.org/10.3390/s24165378
Chicago/Turabian StyleKhosroshahi, Mohammad E., Yesha Patel, and Vithurshan Umashanker. 2024. "Targeted FT-NIR and SERS Detection of Breast Cancer HER-II Biomarkers in Blood Serum Using PCB-Based Plasmonic Active Nanostructured Thin Film Label-Free Immunosensor Immobilized with Directional GNU-Conjugated Antibody" Sensors 24, no. 16: 5378. https://doi.org/10.3390/s24165378