Article

Sequential Injection Analysis Method for the Determination of Glutathione in Pharmaceuticals

1
Department of Analytical Chemistry, Faculty of Chemistry and Technology, University of Split, Rudjera Boskovica 35, 21000 Split, Croatia
2
Department of Chemistry, Faculty of Science and Education, University of Mostar, Matice hrvatske bb, 88000 Mostar, Bosnia and Herzegovina
3
Faculty of Chemistry and Pharmacy, Sofia University “St. Kl. Ohridski”, 1 James Bourchier Blvd., 1164 Sofia, Bulgaria
4
School of Chemistry, The University of Melbourne, Parkville, VIC 3010, Australia
5
Department of Chemical Engineering, The University of Melbourne, Parkville, VIC 3010, Australia
*
Authors to whom correspondence should be addressed.
Sensors 2024, 24(17), 5677; https://doi.org/10.3390/s24175677 (registering DOI)
Submission received: 24 July 2024 / Revised: 25 August 2024 / Accepted: 29 August 2024 / Published: 31 August 2024
(This article belongs to the Section Optical Sensors)

Abstract

:
A sequential injection analysis method for the determination of glutathione (GSH) in pharmaceuticals has been developed. It is based on the reduction of the Cu(II)-neocuproine complex by GSH and the formation of an orange-yellow colored Cu(I)-neocuproine complex with maximum absorbance at 458 nm. Under optimal conditions the method is characterized by a linear calibration range of 6.0 × 10⁻⁷–8.0 × 10⁻⁵ mol L−1 (Amax = 3270 CGSH − 0.0010; R2 = 0.9983), limit of detection of 2.0 × 10⁻⁷ mol L−1, limit of quantification of 6.7 × 10⁻⁷ mol L−1, repeatability (expressed as relative standard deviation) of 3.8%, and sampling rate of 60 h−1. The newly developed method has been successfully applied to the determination of GSH in pharmaceutical samples with no statistically significant difference between the results obtained and those produced by the standard Pharmacopoeia method.

1. Introduction

Glutathione (GSH) is a protein synthesized in the liver that plays an essential role in intercellular metabolism and the organism’s immune system. It protects cells from oxidative stress by reducing reactive oxygen species [1,2]. GSH is a tripeptide consisting of three amino acids, i.e., glycine, cysteine, and glutamic acid. The sulfhydryl group (−SH) of cysteine in GSH plays a crucial role in conjugation and reduction reactions. GSH comes in two forms: reduced (GSH) and oxidized (GSSG), and the ratio of these two forms can determine the oxidation state of the cell [3]. It is commonly used in the treatment of Parkinson’s disease and as an antidote to heavy metal poisoning [4]. The interest in glutathione as an analyte has increased since the end of the 20th century when scientific interest in the pronounced antioxidant effect of glutathione in the body began.
A number of analytical methods have been reported in the literature for the determination of GSH, most of which are designed for analyzing GSH in biological fluids and pharmaceutical formulations. These methods are often based on the use of spectrophotometry [5,6,7,8,9], fluorimetry [10,11,12,13,14], high-performance liquid chromatography (HPLC) [15,16,17,18,19,20], atomic absorption spectroscopy (AAS) [21], voltammetry [22], and kinetic methods with spectrophotometric [23,24] or potentiometric [25] detection. Some of the developed methods often involve the determination of both the reduced and oxidized forms of GSH [10,15]. However, not all of the methods mentioned above are suitable for direct routine analysis of GSH. Some of the methods are time-consuming and require laborious and/or time-consuming sample pretreatment or processing which results in low sampling rates [10,11,15,16].
Continuous-flow manufacturing, based on dynamic flow technology, offers more flexibility than traditional batch processes, making it an attractive alternative to these batch processes in the pharmaceutical industry [26]. Continuous manufacturing requires continuous monitoring to ensure production conditions are not compromised over time [26]. Continuous monitoring can be carried out by in-line or on-line mode. In in-line mode the analytical instrument is an integral part of the manufacturing setup and monitoring usually involves continuous flow of process solution through a flow-through detector. In on-line mode, a sample of the process solution is periodically analyzed by the automated analytical instrument. Flow analysis techniques are particularly suitable for on-line process monitoring and analysis [27].
Flow injection analysis (FIA), as the first generation of flow analysis techniques, has revolutionized chemical analysis by reducing drastically the volumes of samples and reagents required and by conducting fast sample processing online [28]. FIA methods utilizing different detectors (e.g., spectrophotometric [29,30,31], chemiluminescence [32,33,34,35,36,37], amperometric [38,39,40,41], voltammetric [42], and potentiometric [43]), have been reported in the literature. These methods have become versatile and cost-effective tools for pharmaceutical quality control in recent decades due to their simplicity and high throughput capacity [44]. In addition, FIA promotes greener analytical chemistry by enabling the development of environmentally friendly and safe analytical methods in terms of low waste generation and minimal human participation in the analytical process [45].
Sequential injection analysis (SIA) is the second generation of flow analysis techniques that was developed in 1990 by Ruzicka and Marshall [28] as an environmentally friendlier alternative to FIA because SIA methods require even smaller reagent and sample volumes than FIA thus further reducing chemical waste and cost of analysis. SIA methods also simplify the conduction of complex analytical reactions in on-line mode.
Despite the advantage of SIA compared to FIA only two SIA methods for the determination of GSH have been reported so far [46,47]. The first method involves enzymatic reactions for detecting oxidized and reduced glutathione in human blood spectrophotometrically at 412 nm using 2-nitro-5-thiobenzoic acid [46]. The second method involves the reaction of GSH with ethyl propiolate to form a thioacryl derivative that can be detected spectrophotometrically in the ultraviolet range [47]. These two methods use toxic (i.e., 2-nitro-5-thiobenzoic acid) or expensive (i.e., enzymes) reagents and the detection in one of them is done in the UV range where significant interferences could be encountered. Therefore, there is a need for a SIA method based on a one-step analytical reaction, utilizing inexpensive and non-toxic reagents, with detection in the visible range.
The purpose of this study is to develop such a SIA method for the determination of GSH in pharmaceuticals using spectrophotometric detection in the visible range. The newly developed method is based on a one-step redox analytical reaction in which GSH reduces the copper(II)-neocuproine complex to an orange-yellow colored copper(I)-neocuproine complex (Equation (1)) with an absorption maximum at 458 nm.
2GSH + 2[Cu(Nc)2]2+ ⇄ GSSG + 2[Cu(Nc)2]+ + 2H+

2. Materials and Methods

2.1. Solution Preparation

Analytical-grade reagents were used in this study without any further purification. Solutions were prepared in deionized water (Milli-Q, Millipore, Bay City, MI, USA, 18 MΩ).
The GSH stock solution with a concentration of 1.0 × 10⁻² mol L−1 was prepared by dissolving 0.3073 g GSH (Sigma-Aldrich, Saint Louis, MO, USA) in Britton-Robinson buffer solution (pH = 2) and then the solution was diluted to 100 mL. The stock solution was stored at 4 °C in a dark bottle where it remained stable for at least one month. Working standards were prepared daily by diluting the stock solution with Britton-Robinson buffer solution (pH = 3). The water solubility of neocuproine (2,9-dimethyl-1,10-phenantroline) was improved by reacting it with Cu(II) to form the water-soluble copper(II)-neocuproine, (Cu(Nc)22+) complex [48]. The Cu(Nc)22+ reagent was prepared by dissolving 25.0 mg of CuSO4 × 5H2O (Kemika, Zagreb, Croatia) and 50.0 mg of neocuproine hydrate (Sigma-Aldrich, Saint Louis, MO, USA) in 100 mL of Britton-Robinson buffer solution (pH = 3) [24]. The Cu(Nc)22+ reagent was stable at 4 °C for at least a month. The concentrations of copper(II) and neocuproine in the reagent solution were 1.0 × 10⁻⁴ mol L−1 and 2.4 × 10⁻⁴ mol L−1, respectively, which produced a molar ratio of n(Cu2+):n(Nc) = 1:2.4 as recommended for the determination of GSH with this reagent in a previous kinetic batch study [24].
The newly developed method was validated with the determination of GSH in commercial pharmaceutical capsules, containing 50 mg GSH per capsule. In these analyses, five capsules were weighed and mixed in powder form. An amount of powder corresponding to 50 mg GSH was dissolved in 500 mL deionized water and after appropriate dilution, the solution was analyzed without delay to avoid possible GSH oxidation. The concentration of GSH in the same solution was determined by back-titration using standard solutions of iodine (Kemika, Zagreb, Croatia) and thiosulfate (Kemika, Zagreb, Croatia) in accordance with the British Pharmacopeia procedure [49].

2.2. Apparatus and Analytical Procedure

The home-made SIA system (Figure 1) used to determine GSH consisted of a bi-directional stepper-motor syringe-free pump (Cheminert® M50, VICI Valco Instruments, Houston, TX, USA) which was connected to a programmable micro-stepping driver (Micro Lynx 4, Intelligent Motion Systems, Phoenix, AZ, USA), and a 10-port selection valve (C25-3180EMH, VICI Valco Instruments, Houston, TX, USA) equipped with a multi-position actuator control module (EMHCA-CE, VICI Valco Instruments, Houston, TX, USA). These system components were controlled by M6-LHS software (VICI Valco Instruments, Houston, TX, USA). All system tubing, including that in the holding coil (HC, 120 cm) and in the reaction coil (RC, 30 cm) was made of PTFE and had an internal diameter of 0.8 mm. The absorbance measurements at 458 nm were conducted by a double beam UV-Vis spectrophotometer (UV–1601, Shimadzu, Tokyo, Japan) equipped with a flow cell (10 mm optical path, internal volume of 80 µL, Hellma, USA). The spectrophotometer was connected to a personal computer running UVProbe software, Version 2.42 (Shimadzu, Tokyo, Japan). The absorbance of the reduced orange-yellow [Cu(Nc)2]+ complex (Equation (1)) was measured with a frequency of 1 Hz at its maximum absorbance wavelength of 458 nm.
The measurements were carried out by aspirating defined volumes of reagent and sample solutions into the holding coil where they formed adjacent zones. These zones were propelled towards the flow-through cuvette of the spectrophotometer via the reaction coil (Figure 1). The SIA absorbance peak value was used as the analytical signal. The optimal solution volumes and flow rates are listed in Table 1.

3. Results and Discussion

The optimal composition of the reagent solution (i.e., pH 3 and concentrations of Cu(II) and neocuproine of 1.0 × 10⁻⁴ mol L−1 and 2.4 × 10⁻⁴ mol L−1, respectively) was previously determined in a kinetic batch study [24]. GSH is a thiol compound and therefore it is more stable in acidic media, and its reaction with copper(II)-neocuproine complex is not affected by temperature variations in a wide range (i.e., 5–60 °C) [24]. Therefore, there was no need for thermostating the SIA system which operated at room temperature of 25 ± 1 °C.

3.1. Optimization of the SIA System Parameters

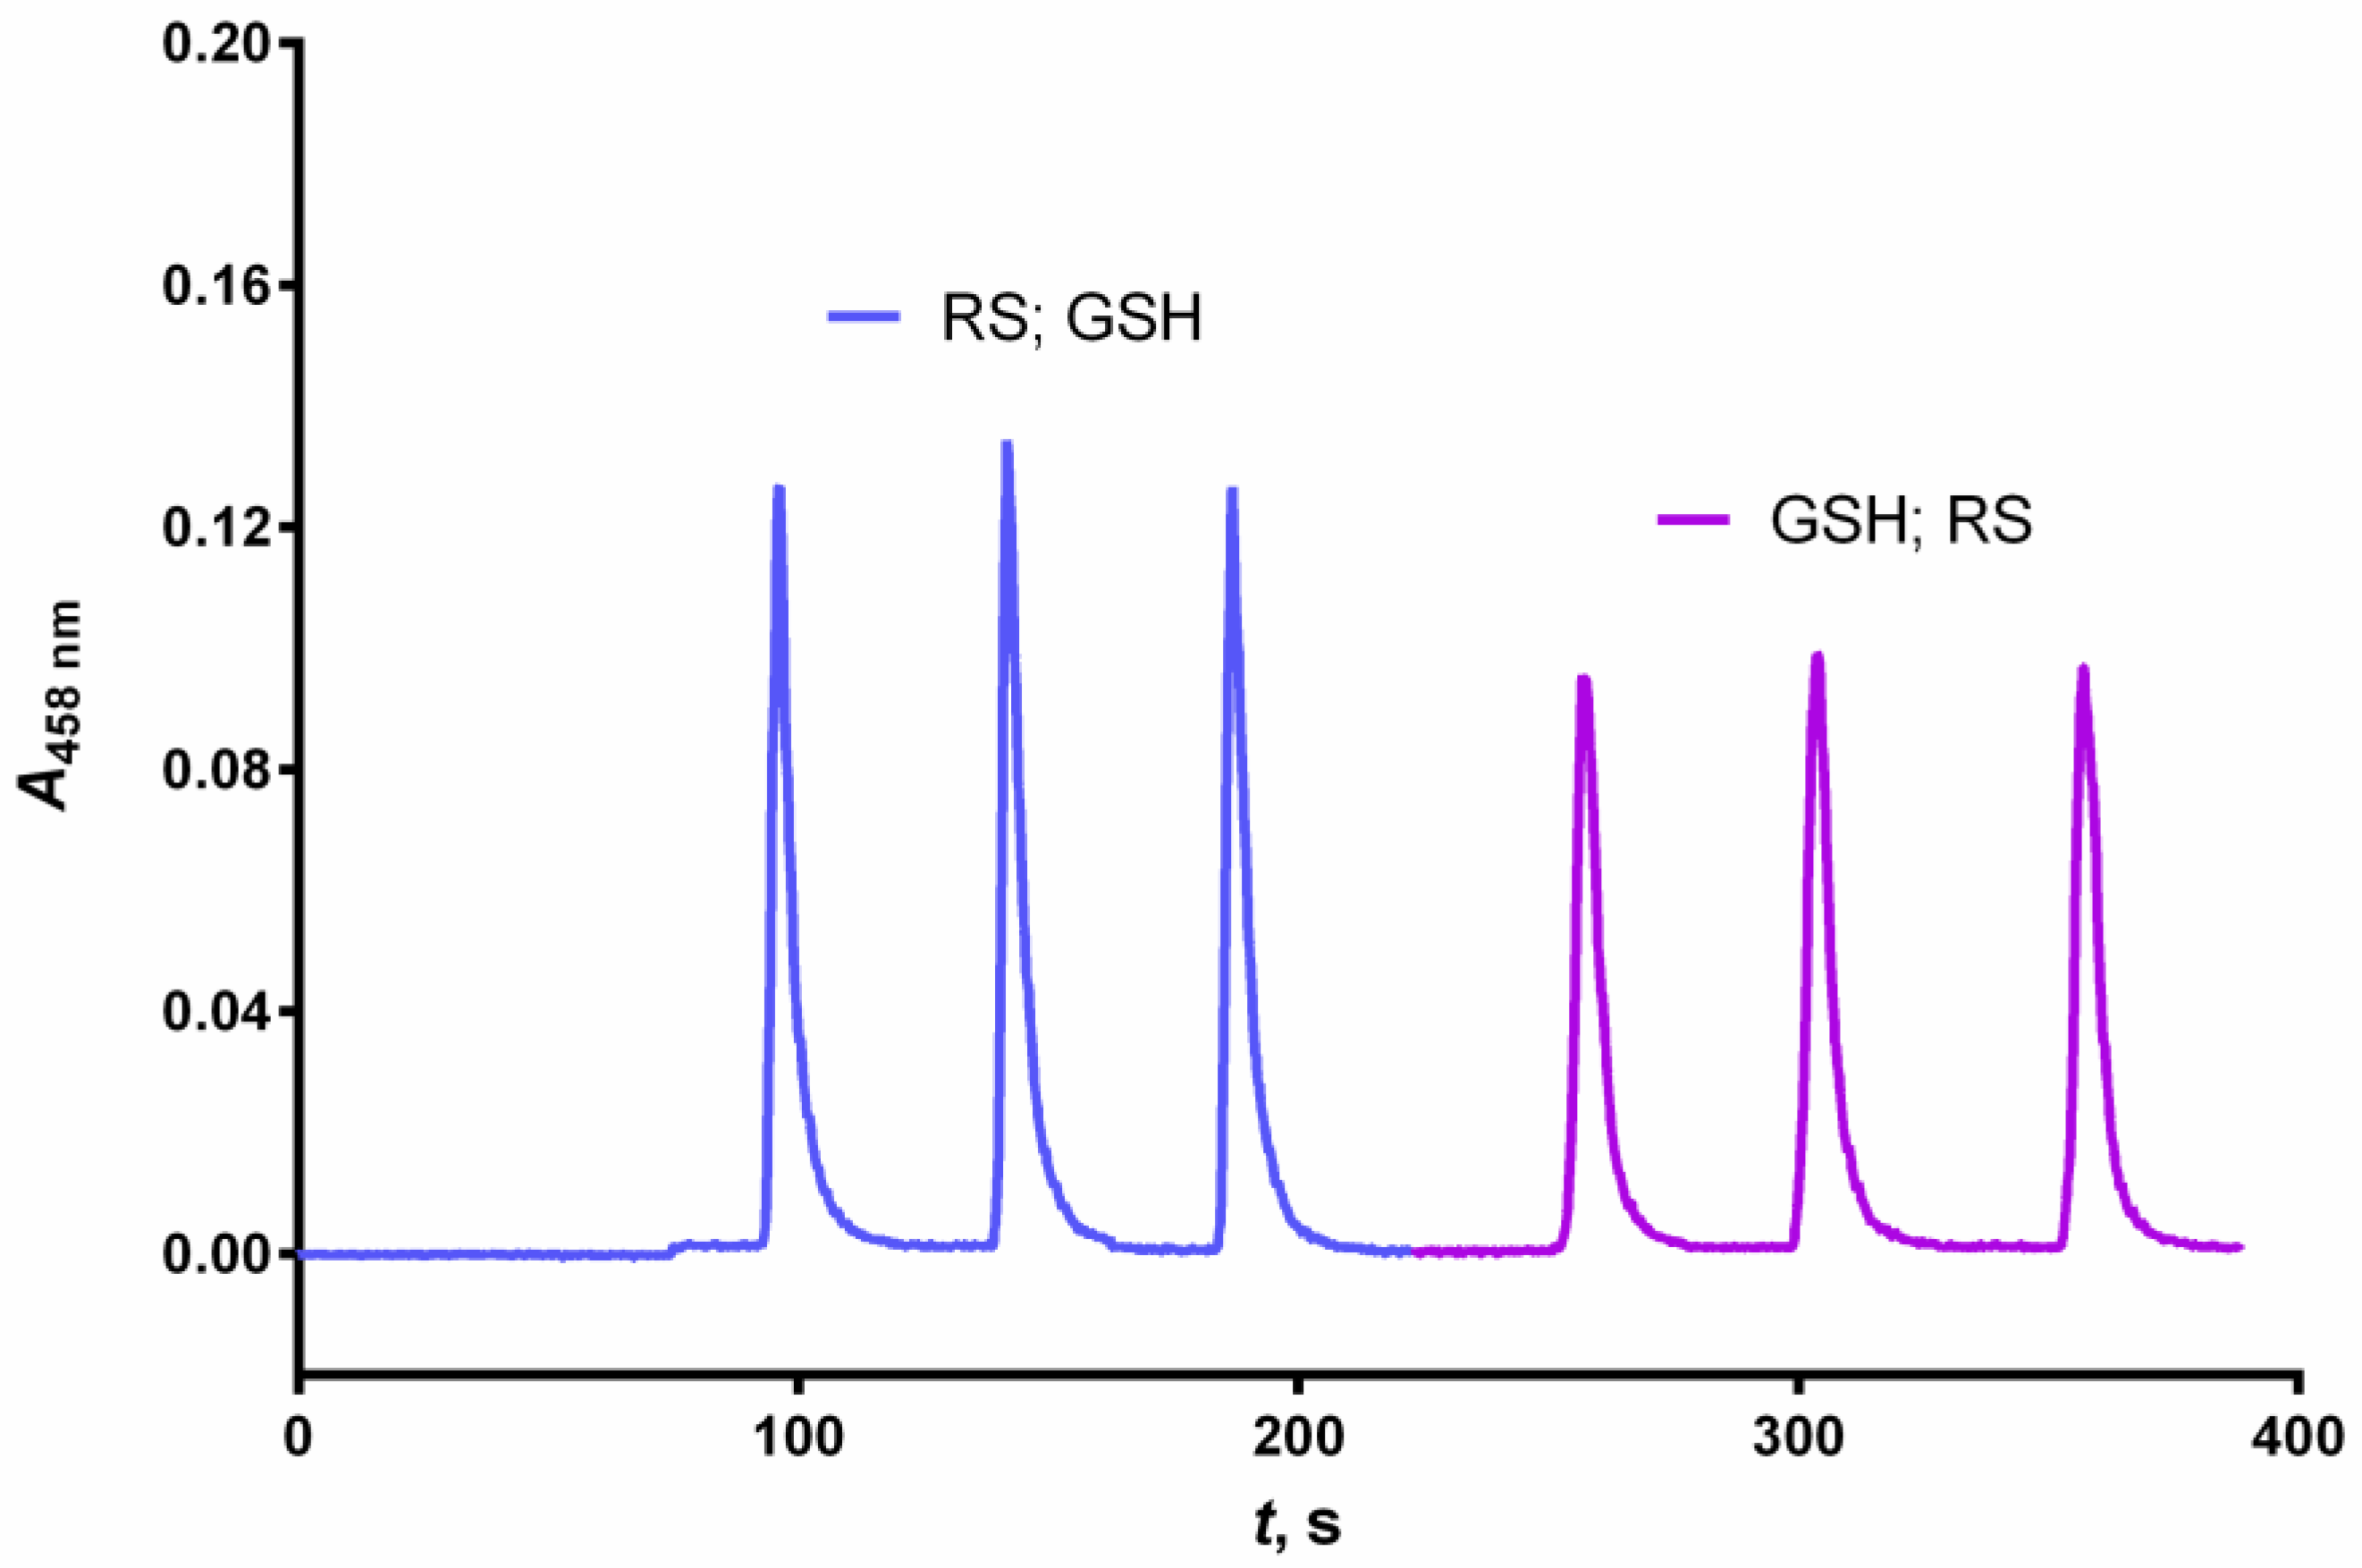
Two different aspiration sequences of the GSH standard (200 μL) and reagent (200 μL) solution were compared during the optimization process. The first sequence involved aspirating the GSH standard solution followed by aspiration of the reagent solution. The second sequence involved aspirating the reagent solution followed by aspirating the GSH standard solution. The second sequence produced a 25% higher analytical signal (Figure 2) due to the shorter travel distance of the GSH standard resulting in its lower dilution and hence higher absorbance peaks [50]. This order of aspiration was maintained for all subsequent measurements.
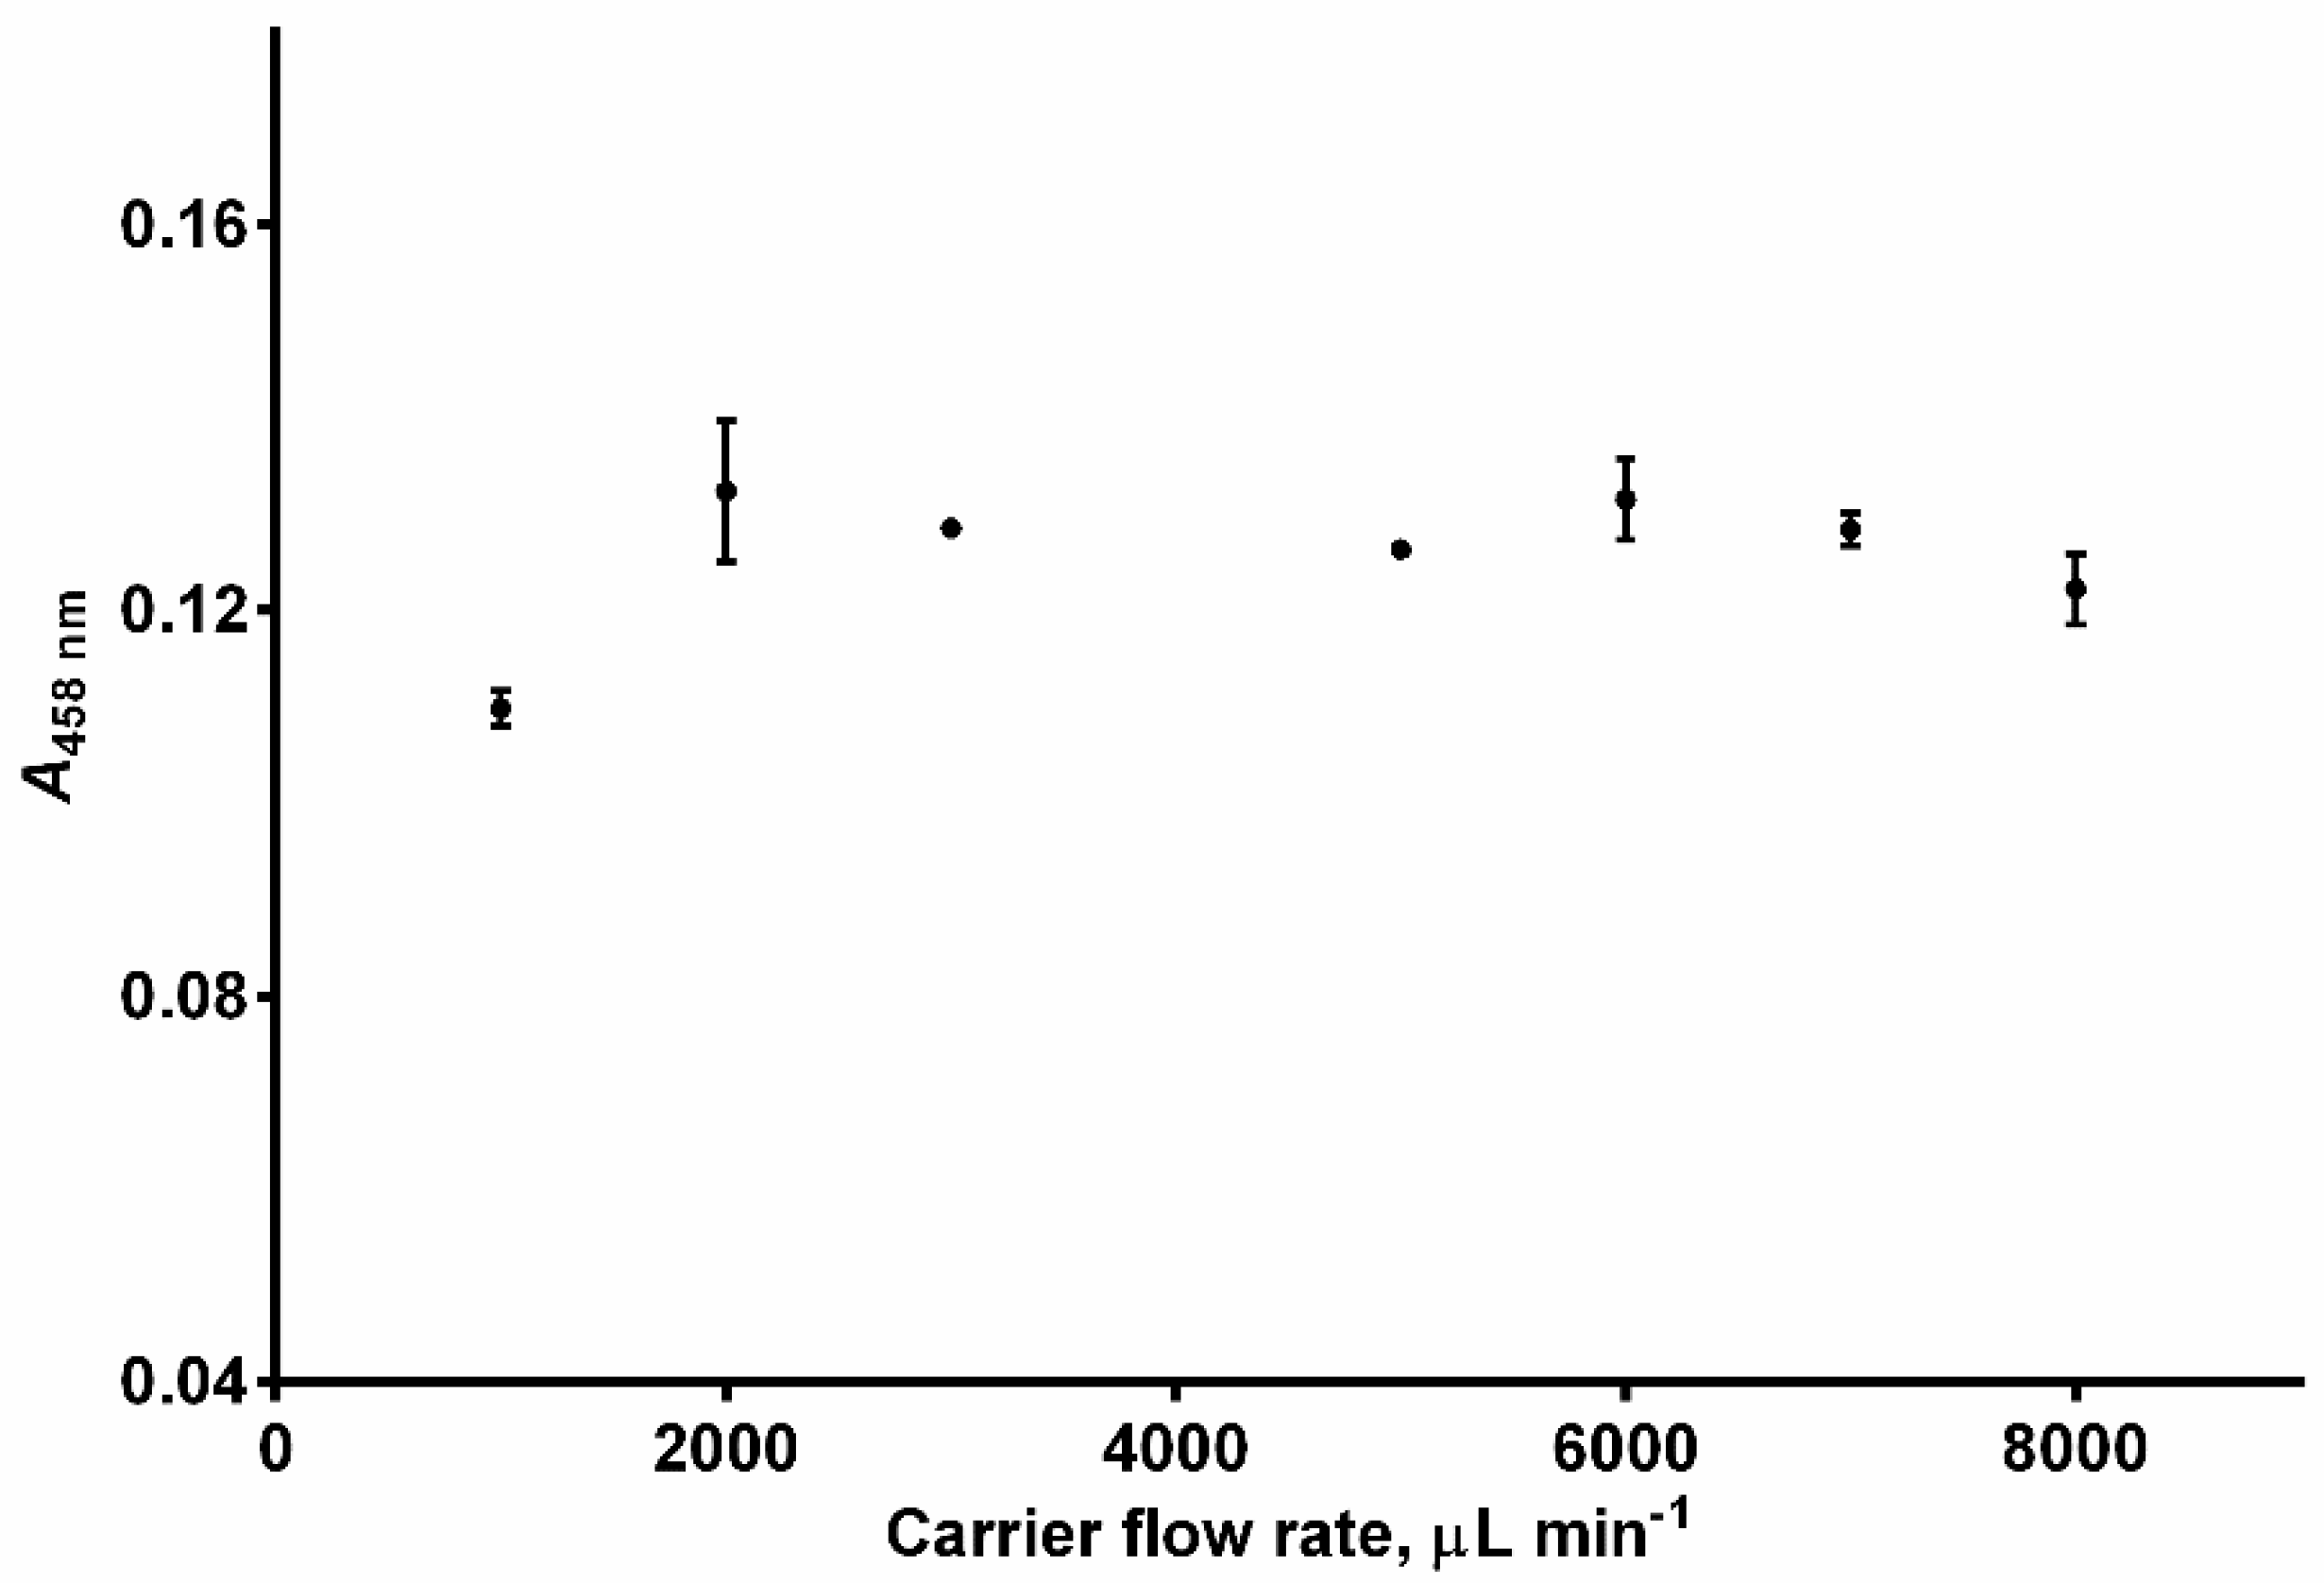
The flow rate effect on the analytical signal was examined in the range from 1000 μL min−1 to 8000 μL min−1. The analytical signal increased when the flow rate was increased from 1000 to 2000 μL min−1 and then levelled off (Figure 3). Due to the better repeatability at 3000 μL min−1 compared to that at 2000 μL min−1, the former flow rate was selected for the subsequent experiments.
The reagent volume was varied from 50 μL to 450 μL (Figure 4). The analytical signal increased with the reagent volume up to 150 μL and then levelled off. Therefore, this value was selected for all subsequent experiments.
As expected, the analytical signal increased with the sample volume in the studied range (i.e., 50–450 μL) (Figure 5). However, for volumes higher than 200 μL this increase became less pronounced and therefore it was decided that a reasonable compromise between signal height and sample consumption was 200 μL.
The analytical signals corresponding to two different holding coil (HC, Figure 1) volumes (i.e., 500 and 1000 μL), each being significantly larger than the combined volume of the reagent and sample, were found to be statistically insignificantly different at the 95% confidence level. Therefore, a 500 μL holding coil was used in the subsequent experiments.
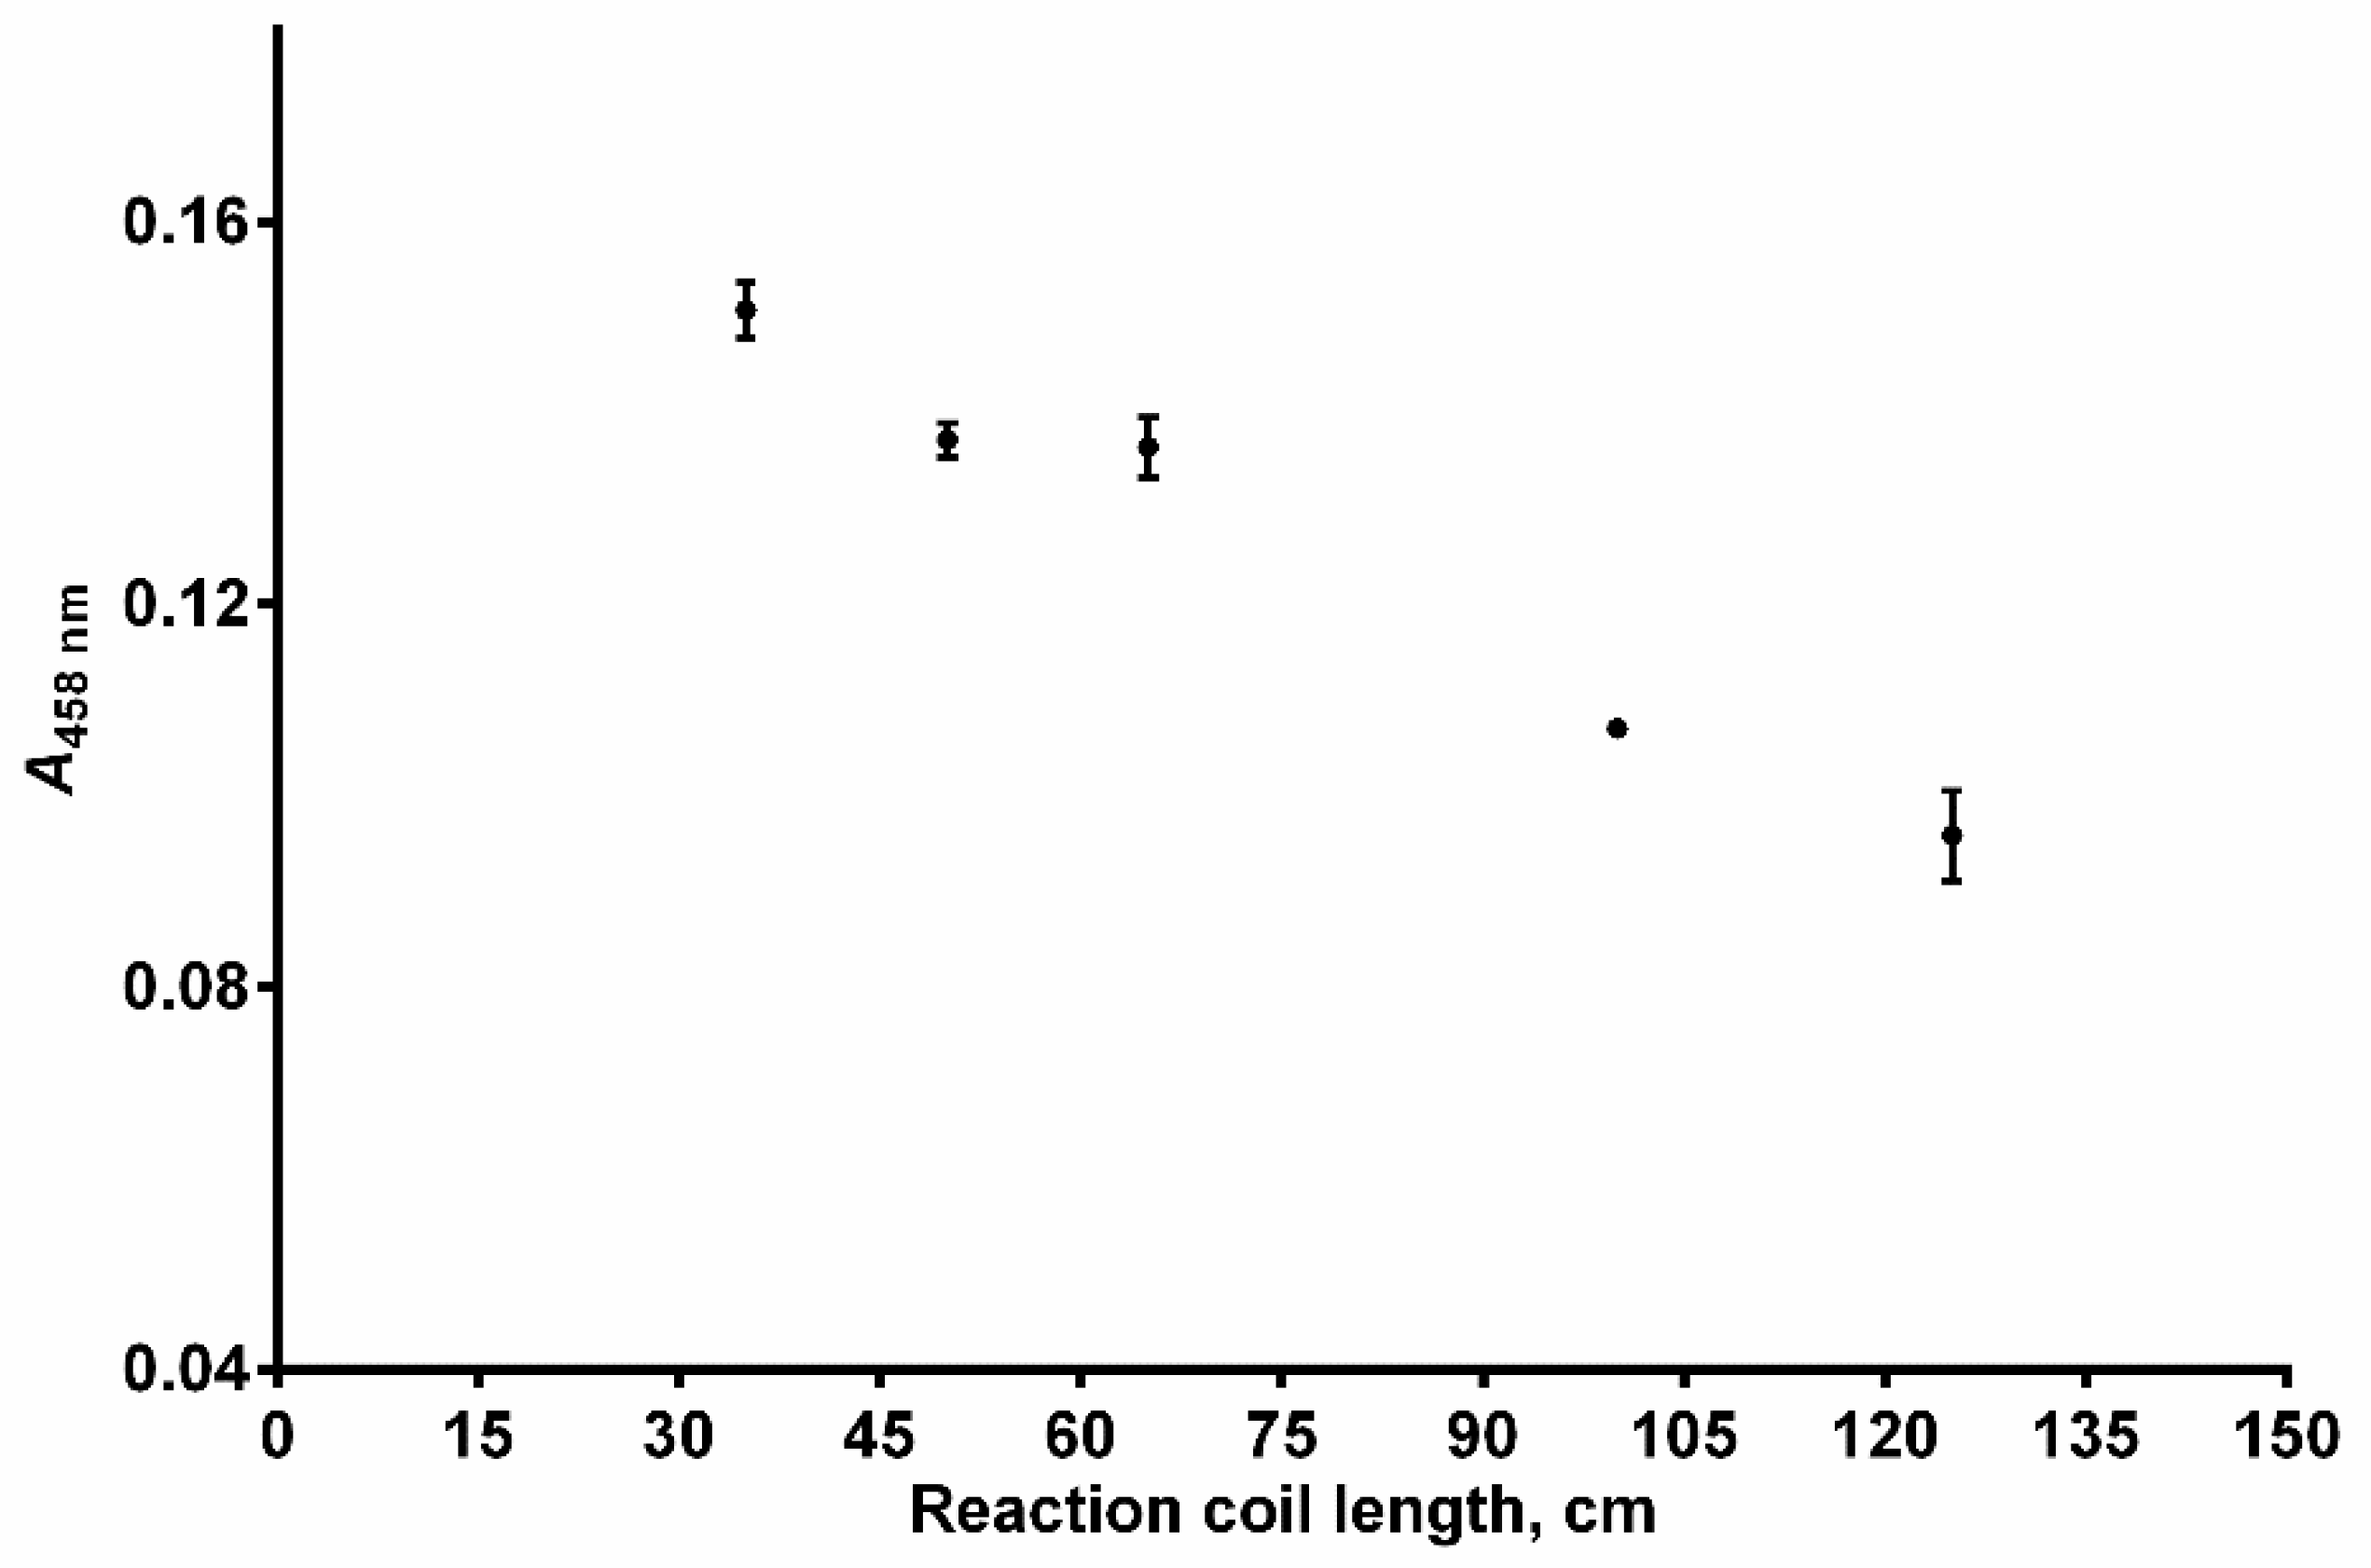
The influence of the reaction coil length (RC, Figure 1) on the analytical signal was investigated in the range of 35–125 cm. Though the highest analytical signal was observed at 35 cm length, better reproducibility with an insignificant decrease in the analytical signal was obtained at 50 cm length (Figure 6). Hence, a reaction coil of 50 cm in length was selected for the final SIA system configuration.

3.2. Analytical Figures of Merit

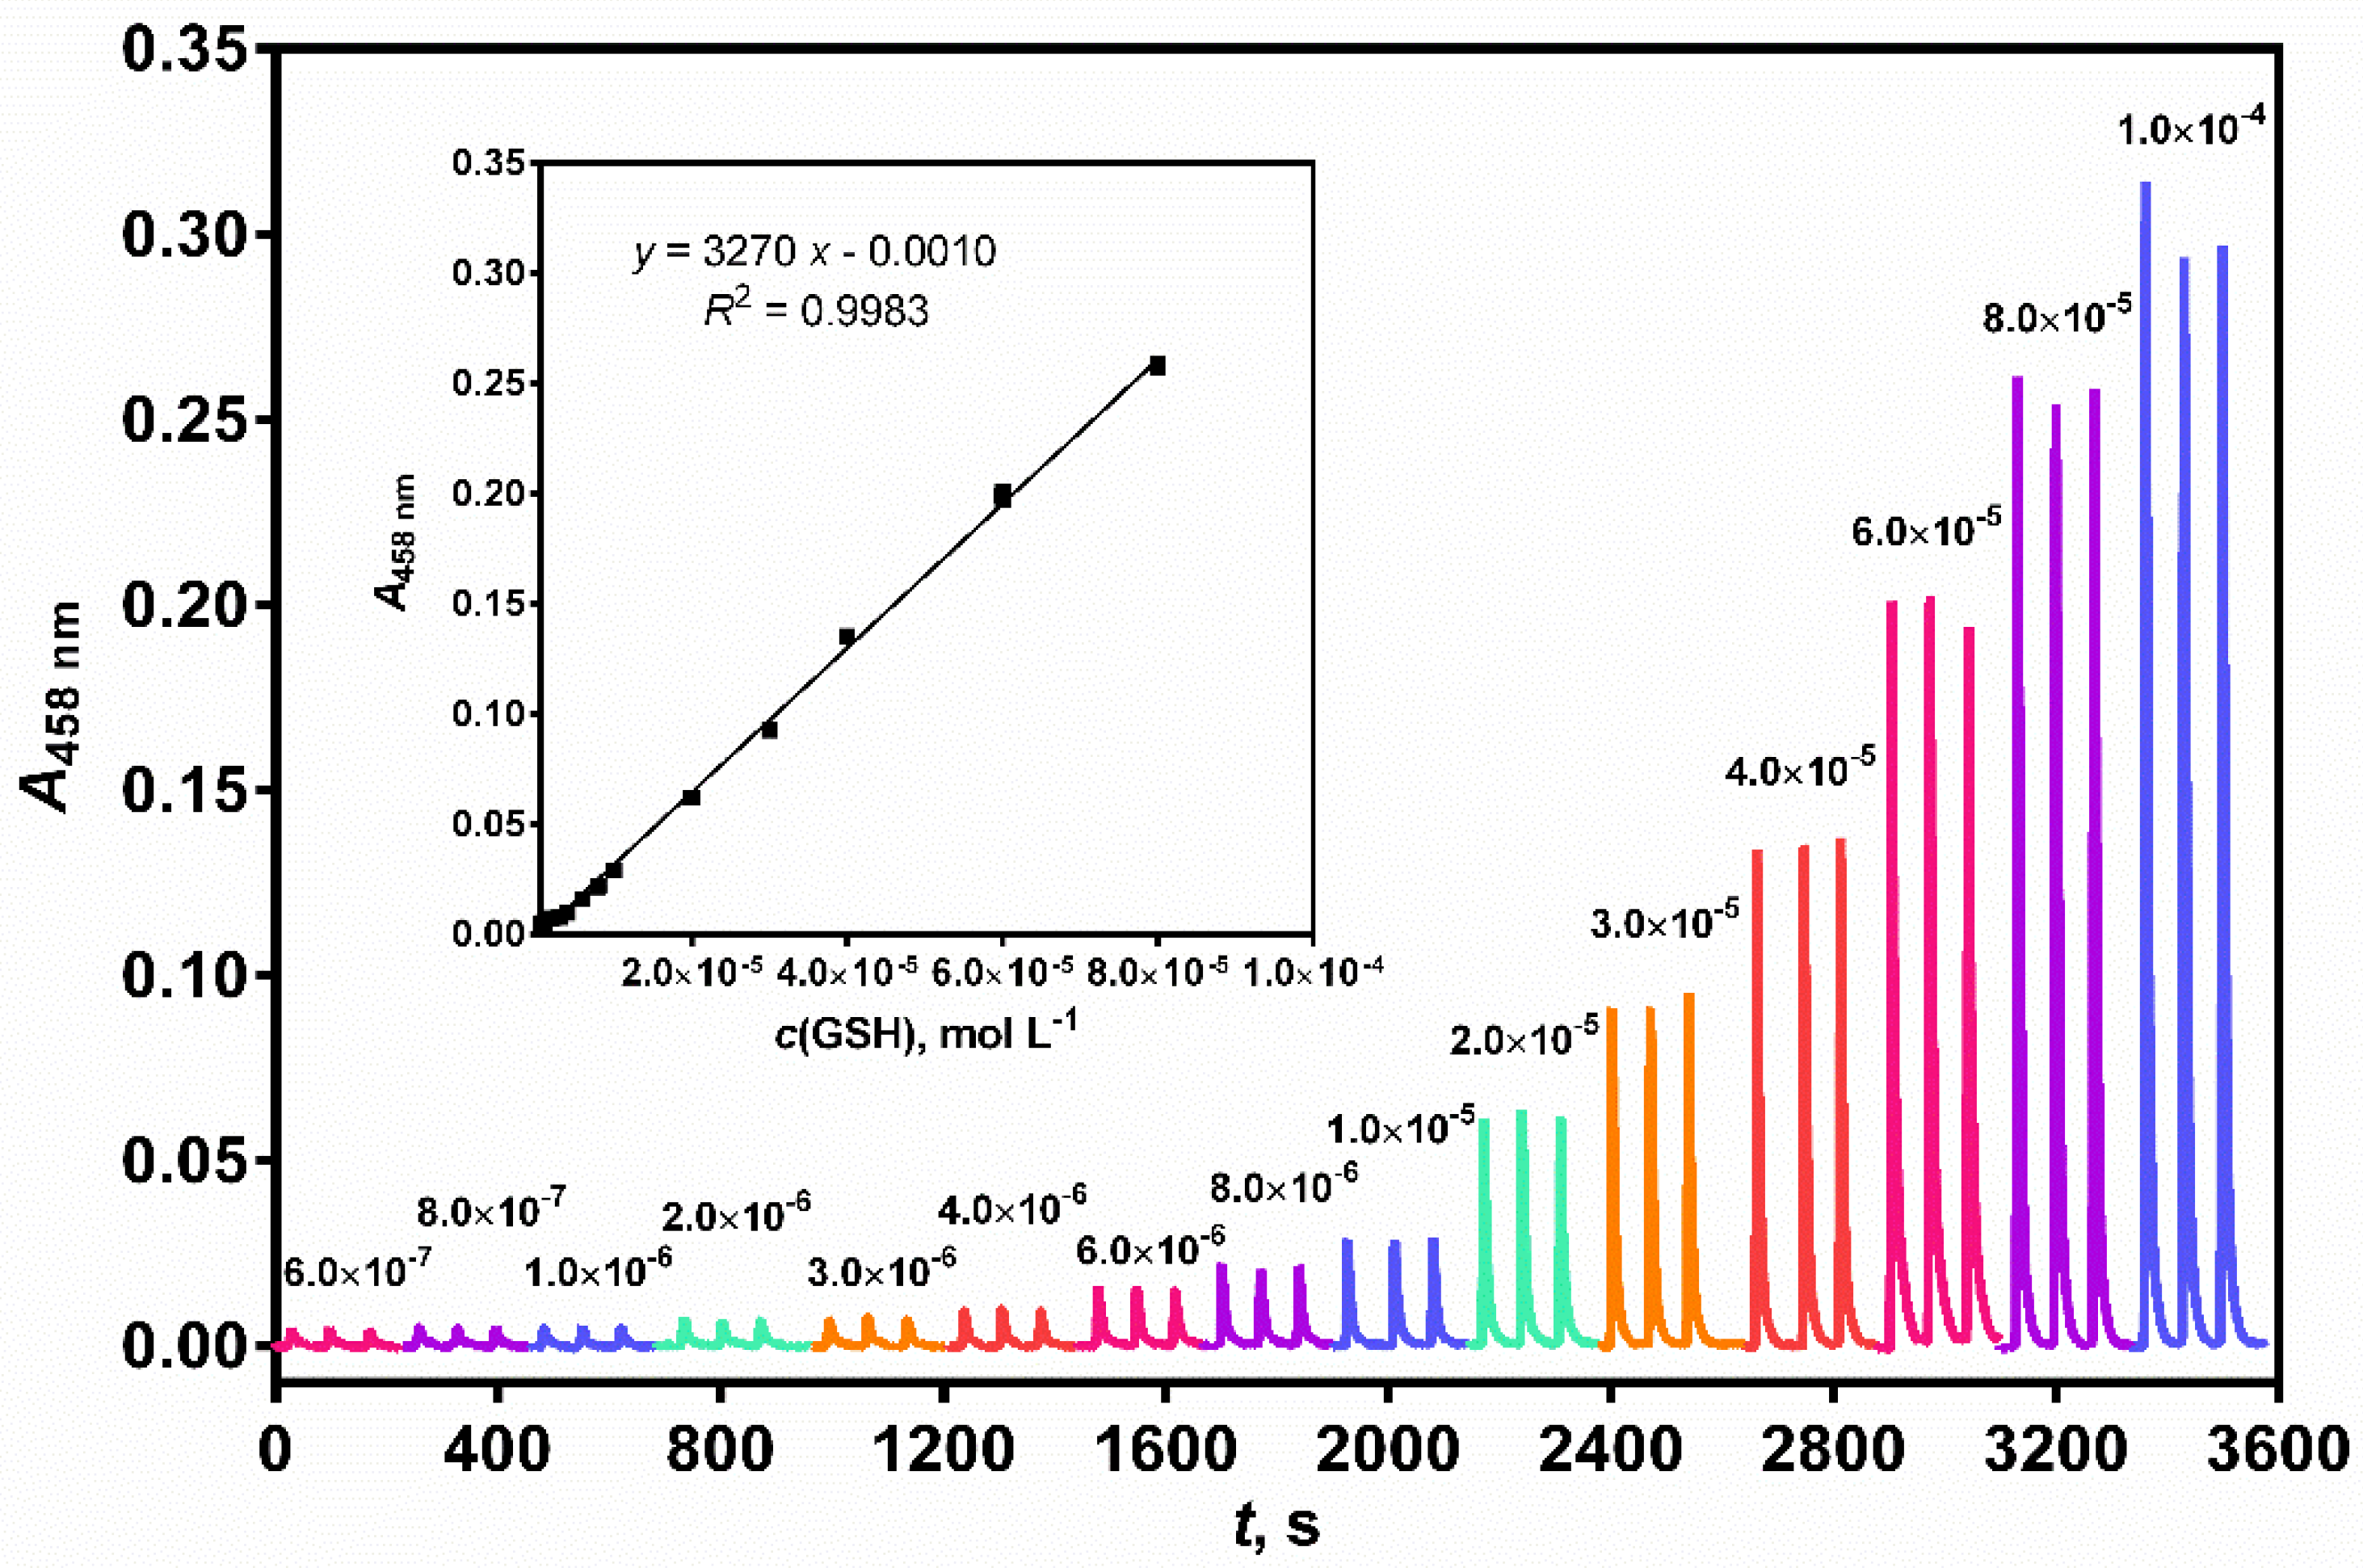
The newly developed method was calibrated in the range 6.0 × 10⁻⁷–1.0 × 10⁻⁴ mol L−1 using the optimized parameters of the SIA method and 15 GSH standards (Table 2). Significant deviation from linearity was observed for the 1.0 × 10⁻⁴ mol L−1 standard and therefore, a linear calibration curve (A458 nm = 3.27 × 10³ CGSH − 1 × 10⁻³, R2 = 0.9983) was obtained in the concentration range of 6.0 × 10⁻⁷–8.0 × 10⁻⁵ mol L−1 (Figure 7). The limit of detection (LOD) and limit of quantification (LOQ) based on 3 times and 9 times the standard deviation of the blank were calculated as 2.0 × 10⁻⁷ mol L−1 and 6.7 × 10⁻⁷ mol L−1, respectively. The repeatability, expressed as the relative standard deviation (RSD) of 30 replicate measurements of a 4 × 10⁻⁵ mol L−1 GSH standard, was calculated as 3.80%. The sampling rate was found to be 60 h−1.
The LOD of the newly developed method is approximately 6 times higher than that of the enzymatic method reported by Araujo et al. [46] and comparable to that of Zacharis et al. [47] (Table 3).
However, the former method, which uses an enzymatic reagent, is more expensive, has a significantly narrower working range and its sampling rate is approximately 5 times lower. The newly developed method offers a much wider linear dynamic range of over two orders of magnitude (Table 3). An advantage of the newly developed method compared to that reported by Zacharis et al. [47] is that it operates in the visible range thus avoiding possible interferences by compounds absorbing in the UV range. Such compounds are a number of the excipients used in commercial pharmaceutical formulations (Table 4) (e.g., glucose [51], fructose [52], and sodium citrate [53]).

3.3. Effect of Interferences

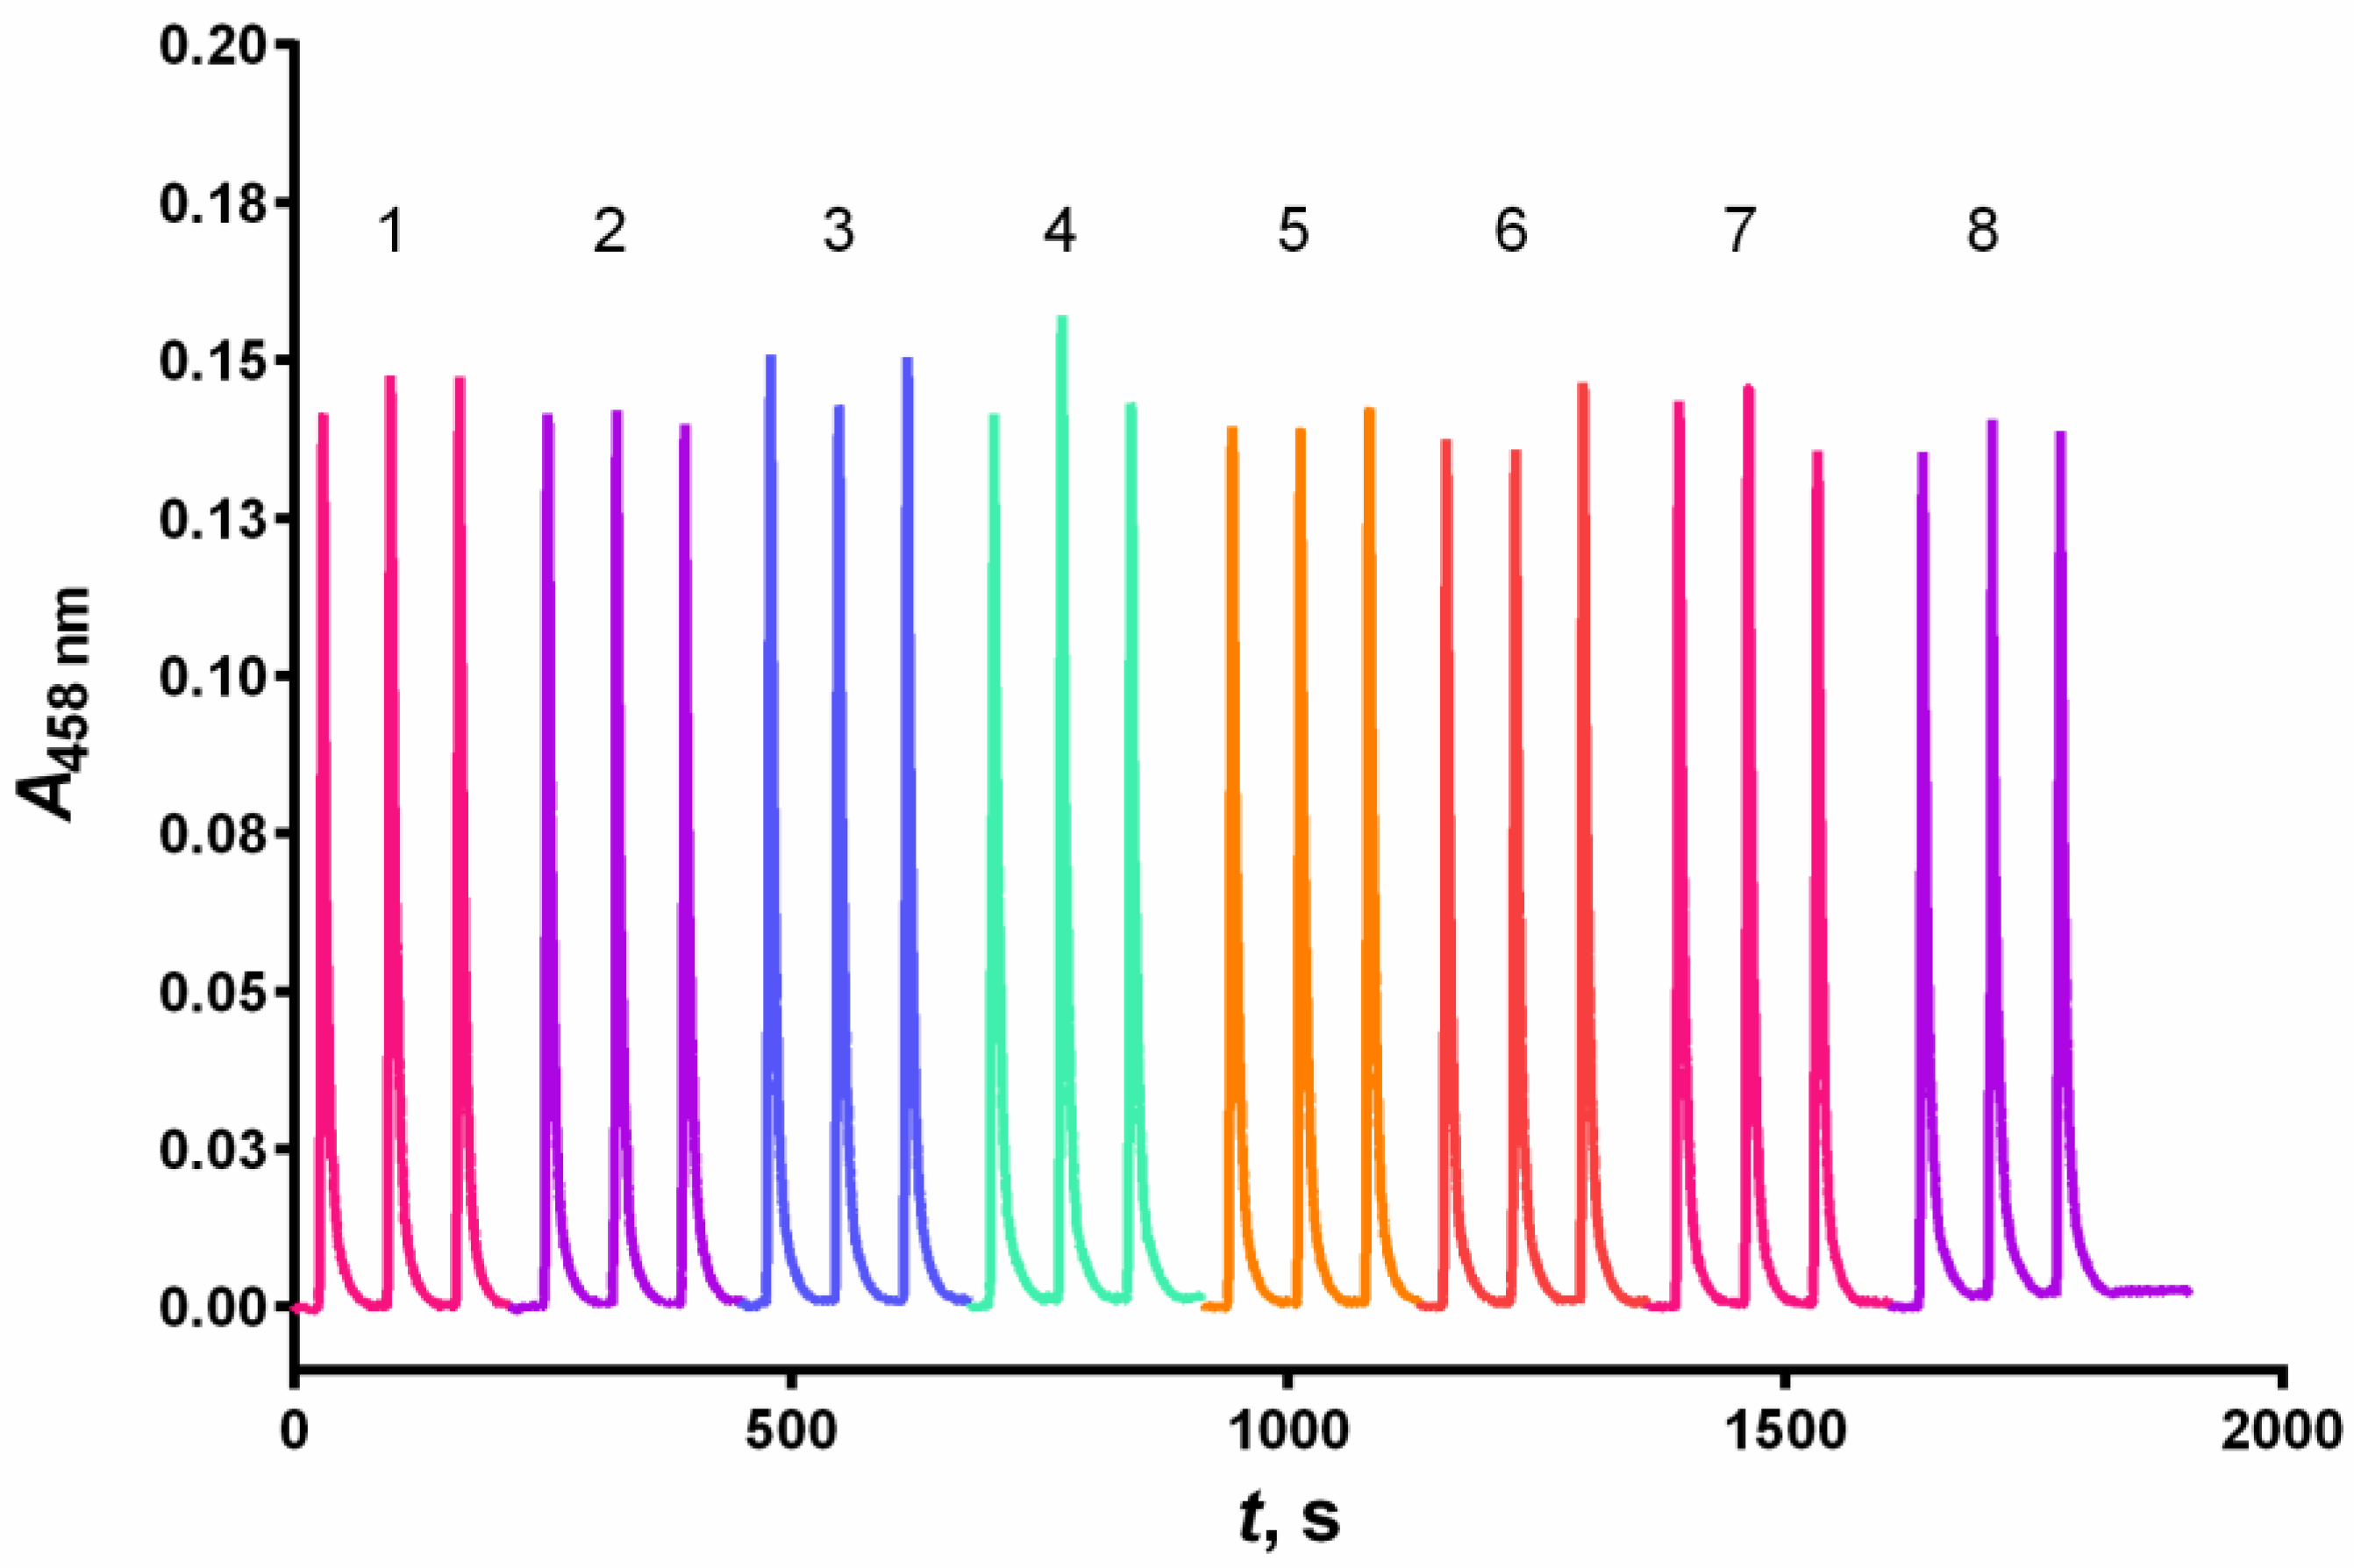
Common excipients found in commercial pharmaceutical formulations, including (KNO3 and Na2SO4) and reducing sugars (glucose, fructose, lactose) did not produce an error of more than 5% in the determination of 4.0 × 10⁻⁵ mol L−1 GSH in molar excess of up to 500 (Table 4, Figure 8).

3.4. Method Validation

Commercial GSH capsules, which according to the manufacturer contained 50 mg GSH per capsule, were analyzed in triplicate by the newly developed and the reference method [49] and no statistically significant difference at the 95% confidence level was found between the results obtained by both methods (i.e., 50.3 ± 0.9 mg and 52.0 ± 0.7).
In addition, the recovery values in the range of 96–102% in a recovery study (Table 5), involving the same commercial GSH capsules, further confirmed the validity of the newly developed SIA method.

4. Conclusions

The newly developed SIA method for GSH determination, based on a one-step redox reaction and spectrophotometric detection in the visible range is characterized by a wide linear range (6.0 × 10⁻⁷–8.0 × 10⁻⁵ mol L−1), low LOD of 2.0 × 10⁻⁷ mol L−1, and high sampling rate of 60 h−1. It was validated with samples of commercial GSH capsules. Based on the abovementioned characteristics, it can be concluded that this method is an attractive alternative to published SIA methods in terms of costs and selectivity regarding common excipients in commercial pharmaceutical formulations.

Author Contributions

Conceptualization, L.K.-M. and M.B.; Methodology, L.K.-M. and M.B.; Validation, L.K.-M. and M.B.; Formal Analysis, L.K.-M., M.B. and S.D.K.; Investigation, M.B.; Resources, L.K.-M., T.G.S. and T.K.; Data Curation, L.K.-M., M.B. and S.D.K.; Writing—Original Draft Preparation, M.B.; Writing—Review & Editing, L.K.-M., M.B., S.D.K., T.G.S. and T.K.; Visualization, M.B.; Supervision, L.K.-M.; Project Administration, L.K.-M.; Funding Acquisition, L.K.-M. and T.G.S. All authors have read and agreed to the published version of the manuscript.

Funding

This study has been financed by the European Union-NextGenerationEU, through the National Recovery and Resilience Plan of the Republic of Bulgaria, project No BG-RRP-2.004-0008, and the Ministry of Science and Education of the Republic of Croatia.

Institutional Review Board Statement

Not applicable.

Informed Consent Statement

Not applicable.

Data Availability Statement

Data will be provided upon request.

Conflicts of Interest

The authors report there are no competing interests to declare.

References

  1. Aquilano, K.; Baldelli, S.; Ciriolo, M.R. Glutathione: New roles in redox signaling for an old antioxidant. Front. Pharmacol. 2014, 5, 196. [Google Scholar] [CrossRef]
  2. Weschawalit, S.; Thongthip, S.; Phutrakool, P.; Asawanonda, P. Glutathione and its antiaging and antimelanogenic effects. Clin. Cosmet. Investig. Dermatol. 2017, 10, 147–153. [Google Scholar] [CrossRef]
  3. Berg, J.M.; Tymoczko, J.L.; Stryer, L. Biochemistry, 5th ed.; W.H. Freeman Publishing: New York, NY, USA, 2002; pp. 1018–1029. [Google Scholar]
  4. Ballatori, N.; Krance, S.M.; Notenboom, S.; Shi, S.; Tieu, K.; Hammond, C.L. Glutathione dysregulation and the etiology and progression of human diseases. Biol. Chem. 2009, 390, 191–214. [Google Scholar] [CrossRef]
  5. Hao, Y.; Xiong, D.; Wang, L.; Chen, W.; Zhou, B.; Liu, Y.-N. A reversible competition colorimetric assay for the detection of biothiols based on ruthenium-containing complex. Talanta 2013, 115, 253–257. [Google Scholar] [CrossRef]
  6. Detsri, E.; Seeharaj, P. Colorimetric detection of glutathione based on phthalic acid assisted synthesis of silver nanoparticles. Colloids Surf. A Physicochem. Eng. Asp. 2017, 533, 125–132. [Google Scholar] [CrossRef]
  7. Turkey, M.E.; Mashkoor, S.M.; Taha, N.D. Spectrophotometric Determination of Glutathione by Iodate/Iodide. J. Phys. Conf. Ser. 2019, 1294, 052063. [Google Scholar] [CrossRef]
  8. Zhang, W.A.; Chen, B.J.; Wang, R.K.; Liu, J.; Wang, B. Peroxidase-like Nanozyme Composite-based Colorimetric Determination of Glutathione and Cysteine. Anal. Lett. 2024, 57, 1271–1281. [Google Scholar] [CrossRef]
  9. Abou El-Nour, K.M.; El-Sherbiny, I.M.; Abbas, A.M.; Salem, E.H.; Khairy, G.M. Applying smartphone camera, spectrophotometry, or ocular analysis-based dipsticks for the detection of glutathione level as a cancer biomarker. Talanta Open 2023, 7, 100211. [Google Scholar] [CrossRef]
  10. Tsiasioti, A.; Tzanavaras, P.D. Determination of glutathione and glutathione disulfide using zone fluidics and fluorimetric detection. Talanta 2021, 222, 121559. [Google Scholar] [CrossRef]
  11. Toyo’oka, T.; Imai, K. Fluorescence analysis of thiols with ammonium 7-fluorobenzo-2-oxa-1,3-diazole-4-sulphonate. Analyst 1984, 109, 1003–1007. [Google Scholar] [CrossRef]
  12. Shcherbatykh, A.A.; Chernov’yants, M.S.; Voloshin, N.A.; Chernyshev, A.V. Spiropyran 5,6′-dichloro-1,3,3-trimethylspiro indoline-2,2′-2H-pyrano 3,2-h quinoli ne application as a spectorphotometric and fluorescent probe for glutathione and cysteine sensing. Chem. Pap. 2022, 76, 5541–5550. [Google Scholar] [CrossRef]
  13. Swathy, S.; Sam, S.; Kumar, K.G. Polyethyleneimine capped silver nanoclusters based turn-off-on fluorescence sensor for the determination of glutathione. Talanta 2024, 278, 126541. [Google Scholar]
  14. Francioso, A.; Fanelli, S.; Cavallaro, R.A.; Fontana, M.; Mattioli, R.; D’Erme, M.; Mosca, L. Fluorometric Optimized Determination of Total Glutathione in Erythrocytes. Separations 2021, 8, 83. [Google Scholar] [CrossRef]
  15. Nozal, M.J.; Bernal, J.L.; Toribio, L.; Marinero, P.; Moral, O.; Manzanas, L.; Rodriguez, E. Determination of glutathione, cysteine and N-acetylcysteine in rabbit eye tissues using high-performance liquid chromatography and post-column derivatization with 5,5′-dithiobis(2-nitrobenzoic acid). J. Chromatogr. A 1997, 778, 347–353. [Google Scholar] [CrossRef] [PubMed]
  16. Głowacki, R.; Bald, E. Fully automated method for simultaneous determination of total cysteine, cysteinylglycine, glutathione and homocysteine in plasma by HPLC with UV absorbance detection. J. Chromatogr. B 2009, 877, 3400–3404. [Google Scholar] [CrossRef] [PubMed]
  17. Hou, W.; Wang, E. Liquid chromatography with electrocatalytic detection of cysteine, N-acetylcysteine and glutathione by a prussian blue film-modified electrode. J. Electroanal. Chem. Interfacial Electrochem. 1991, 316, 155–163. [Google Scholar] [CrossRef]
  18. Habib, A.; Mabrouk, M.M.; Fekry, M.; Mansour, F.R. Glycerol as a new mobile phase modifier for green liquid chromatographic determination of ascorbic acid and glutathione in pharmaceutical tablets. J. Pharm. Biomed. Anal. 2022, 219, 114870. [Google Scholar] [CrossRef]
  19. Tsiasioti, A.; Tzanavaras, P.D. Determination of glutathione and glutathione disulfide using liquid chromatography: A review on recent applications. Microchem. J. 2023, 193, 109157. [Google Scholar] [CrossRef]
  20. Pavlidis, A.; Tsiasioti, A.; Tzanavaras, P.D. Extraction and determination of free glutathione and its disulfide in various flour samples using liquid chromatography and on-line post column derivatization. Microchem. J. 2023, 193, 109145. [Google Scholar] [CrossRef]
  21. Bramanti, E.; Cavallaro, R.; Onor, M.; Zamboni, R.; D’Ulivo, A. Determination of thiolic compounds as mercury complexes by cold vapor atomic absorption spectrometry and its application to wines. Talanta 2008, 74, 936–943. [Google Scholar] [CrossRef]
  22. Gashevskaya, A.S.; Dorozhko, E.V.; Korotkova, E.I.; Pashkovskaya, E.A.; Voronova, O.A.; Plotnikov, E.V.; Derina, K.V.; Lipskikh, O.I. Voltammetric Method for Determination of Glutathione on a Gold-Carbon-Containing Electrode. Inorg. Mater. 2020, 56, 1362–1368. [Google Scholar] [CrossRef]
  23. Martinović, A.; Kukoč-Modun, L.; Radić, N. Kinetic Spectrophotometric Determination of Thiols and Ascorbic Acid. Anal. Lett. 2007, 40, 805–815. [Google Scholar] [CrossRef]
  24. Kukoc-Modun, L.; Biocic, M.; Radić, N. Determination of penicillamine, tiopronin and glutathione in pharmaceutical formulations by kinetic spectrophotometry. Acta Pharm. 2021, 71, 619–630. [Google Scholar] [CrossRef]
  25. Martinović, A.; Radić, N. Kinetic Potentiometric Determination of some Thiols with Iodide Ion-Sensitive Electrode. Anal. Lett. 2007, 40, 2851–2859. [Google Scholar] [CrossRef]
  26. Price, G.A.; Mallik, D.; Organ, M.G. Process Analytical Tools for Flow Analysis: A Perspective. J. Flow Chem. 2017, 7, 82–86. [Google Scholar] [CrossRef]
  27. Warman, M.; Hammond, S. Process analysis in the pharmaceutical industry. In Pharmaceutical Analysis; Lee, D.C., Webb, M.L., Eds.; CRC Press: Boca Raton, FL, USA, 2003; pp. 324–356. [Google Scholar]
  28. Ruzicka, J.; Marshall, G.D. Sequential injection: A new concept for chemical sensors, process analysis and laboratory assays. Anal. Chim. Acta 1990, 237, 329–343. [Google Scholar] [CrossRef]
  29. Waseem, A.; Yaqoob, M.; Nabi, A. Flow-injection Determination of Cysteine, N-Acetyl Cysteine and Glutathione in Pharmaceuticals via Potassium Ferricyanide-Fe(III) Spectrophotometric System. Chem. Res. Chin. Univ. 2010, 26, 893–898. [Google Scholar]
  30. Supharoek, S.-A.; Youngvises, N.; Jakmunee, J. A Simple Microfluidic Integrated with an Optical Sensor for Micro Flow Injection Colorimetric Determination of Glutathione. Anal. Sci. 2012, 28, 651–656. [Google Scholar] [CrossRef]
  31. Kukoc-Modun, L.; Biocic, M.; Radić, N. Flow-injection Determination of Glutathione, Penicillamine and Tiopronin Based on the Reduction of Copper(II)-neocuproine Reagent. Croat. Chem. Acta 2020, 93, 133–138. [Google Scholar] [CrossRef]
  32. Ensafi, A.A.; Khayamian, T.; Hasanpour, F. Determination of glutathione in hemolysed erythrocyte by flow injection analysis with chemiluminescence detection. J. Pharm. Biomed. Anal. 2008, 48, 140–144. [Google Scholar] [CrossRef]
  33. Wang, L.; Li, Y.; Zhao, D.; Zhu, C. A Novel Enhancing Flow-Injection Chemiluminescence Method for the Determination of Glutathione Using the Reaction of Luminol with Hydrogen Peroxide. Microchim. Acta 2003, 141, 41–45. [Google Scholar] [CrossRef]
  34. Dong, Y.; Su, M.; Chen, P.; Sun, H. Chemiluminescence of carbon dots induced by diperiodato-nicklate (IV) in alkaline solution and its application to a quenchometric flow-injection assays of paracetamol, L-cysteine and glutathione. Microchim. Acta 2015, 182, 1071–1077. [Google Scholar] [CrossRef]
  35. Lu, C.; Li, Q.; Chen, S.; Zhao, L.; Zheng, Z. Gold nanorod-catalyzed luminol chemiluminescence and its selective determination of glutathione in the cell extracts of Saccharomyces cerevisiae. Talanta 2011, 85, 476–481. [Google Scholar] [CrossRef] [PubMed]
  36. Yang, P.; Chen, Y.; Zhu, Q.; Wang, F.; Wang, L.; Li, Y. Sensitive chemiluminescence method for the determination of glutathione, l-cysteine and 6-mercaptopurine. Microchim. Acta 2008, 163, 263–269. [Google Scholar] [CrossRef]
  37. Ahmed, Z.; Yaqoob, M.; Asghar, M.; Ali, S.; Munawar, N.; Achakzai, A.K.K.; Nabi, A. Flow-Injection Lucigenin–Cu(III) Complex Chemiluminescence Determination of Cysteine and Glutathione in Pharmaceutical Formulations. J. Anal. Chem. 2021, 76, 466–475. [Google Scholar] [CrossRef]
  38. Cox, J.A.; Gray, T.J. Flow-injection amperometry of cysteine and glutathione at an electrode modified with a ruthenium-containing inorganic film. Electroanalysis 1990, 2, 107–111. [Google Scholar] [CrossRef]
  39. Mao, L.; Yamamoto, K. Amperometric Biosensor for Glutathione Based on Osmium-Polyvinylpyridine Gel Polymer and Glutathione Sulfhydryl Oxidase. Electroanalysis 2000, 12, 577–582. [Google Scholar] [CrossRef]
  40. Ravi, S.D.; Narayanan, S.S. Amperometric Sensor for Glutathione Based on a Mechanically Immobilized Cobalt Hexacyanoferrate Modified Electrode. Bull. Chem. Soc. Jpn. 2002, 75, 501–505. [Google Scholar] [CrossRef]
  41. Zitka, O.; Huska, D.; Krizkova, S.; Adam, V.; Chavis, G.J.; Trnkova, L.; Horna, A.; Hubalek, J.; Kizek, R. An Investigation of Glutathione-Platinum(II) Interactions by Means of the Flow Injection Analysis Using Glassy Carbon Electrode. Sensors 2007, 7, 1256–1270. [Google Scholar] [CrossRef]
  42. Shankaran, D.D.; Narayanan, S.S. Mechanically Immobilized Copper Hexacyanoferrate Modified Electrode for Electrocatalysis Amperometric Determination of Glutathione. Bull. Korean Chem. Soc. 2001, 22, 816–820. [Google Scholar]
  43. Kolar, M.; Dobcnik, D.; Radić, N. Potentiometric flow-injection determination of vitamin C and glutathione with a chemically prepared tubular silver electrode. Pharmazie 2000, 55, 913–916. [Google Scholar] [PubMed]
  44. Evgen’ev, M.I.; Garmonov, S.Y.; Shakirova, L.S. Flow-Injection Analysis of Pharmaceuticals. J. Anal. Chem. 2001, 56, 313–323. [Google Scholar] [CrossRef]
  45. Rocha, F.R.P.; Nóbrega, J.A.; Filho, O.F. Flow analysis strategies to greener analytical chemistry. An overview. Green Chem. 2001, 3, 216–220. [Google Scholar] [CrossRef]
  46. Araujo, A.R.T.S.; Saraiva, M.L.M.F.S.; Lima, J.L.F.C. Determination of total and oxidized glutathione in human whole blood with a sequential injection analysis system. Talanta 2008, 74, 1511–1519. [Google Scholar] [CrossRef]
  47. Zacharis, C.K.; Tzanavaras, P.D. High throughput automated determination of glutathione based on the formation of a UV-absorbing thioacrylate derivative. Comb. Chem. High Throughput Screen. 2010, 13, 461–468. [Google Scholar] [CrossRef]
  48. Besada, A.; Tadros, N.B.; Gawargious, Y.A. Copper(II)-neocuproine as colour reagent for some biologically active thiols: Spectrophotometric determination of cysteine, penicillamine, glutathione, and 6-mercaptopurine. Microchim. Acta 1989, 99, 143–146. [Google Scholar] [CrossRef]
  49. British Pharmacopoeia; The Stationery Office: London, UK, 2018.
  50. Kolev, S.D. Theoretical basis of flow injection analysis. In Advances in Flow Injection Analysis and Related Techniques, 1st ed.; Kolev, S.D., McKlevie, I.D., Eds.; Elsevier: Amsterdam, The Netherlands, 2008; pp. 47–49. [Google Scholar]
  51. El-Kemary, M.; Nagy, N.; El-Mehasseb, I. Nickel oxide nanoparticles: Synthesis and spectral studies of interactions with glucose. Mater. Sci. Semicond. Process. 2013, 16, 1747–1752. [Google Scholar] [CrossRef]
  52. Orlowska, M.; Koutchma, T.; Grapperhaus, M.; Gallagher, J.; Schaefer, R.; Defelice, C. Continuous and Pulsed Ultraviolet Light for Nonthermal Treatment of Liquid Foods. Part 1: Effects on Quality of Fructose Solution, Apple Juice, and Milk. Food Bioprocess Technol. 2013, 6, 1580–1592. [Google Scholar] [CrossRef]
  53. Bui, T.Q.; Ton, S.N.-C.; Duong, A.T.; Tran, H.T. Size-dependent magnetic responsiveness of magnetite nanoparticles synthesised by co-precipitation and solvothermal methods. J. Sci. Adv. Mater. Devices 2018, 3, 107–112. [Google Scholar] [CrossRef]
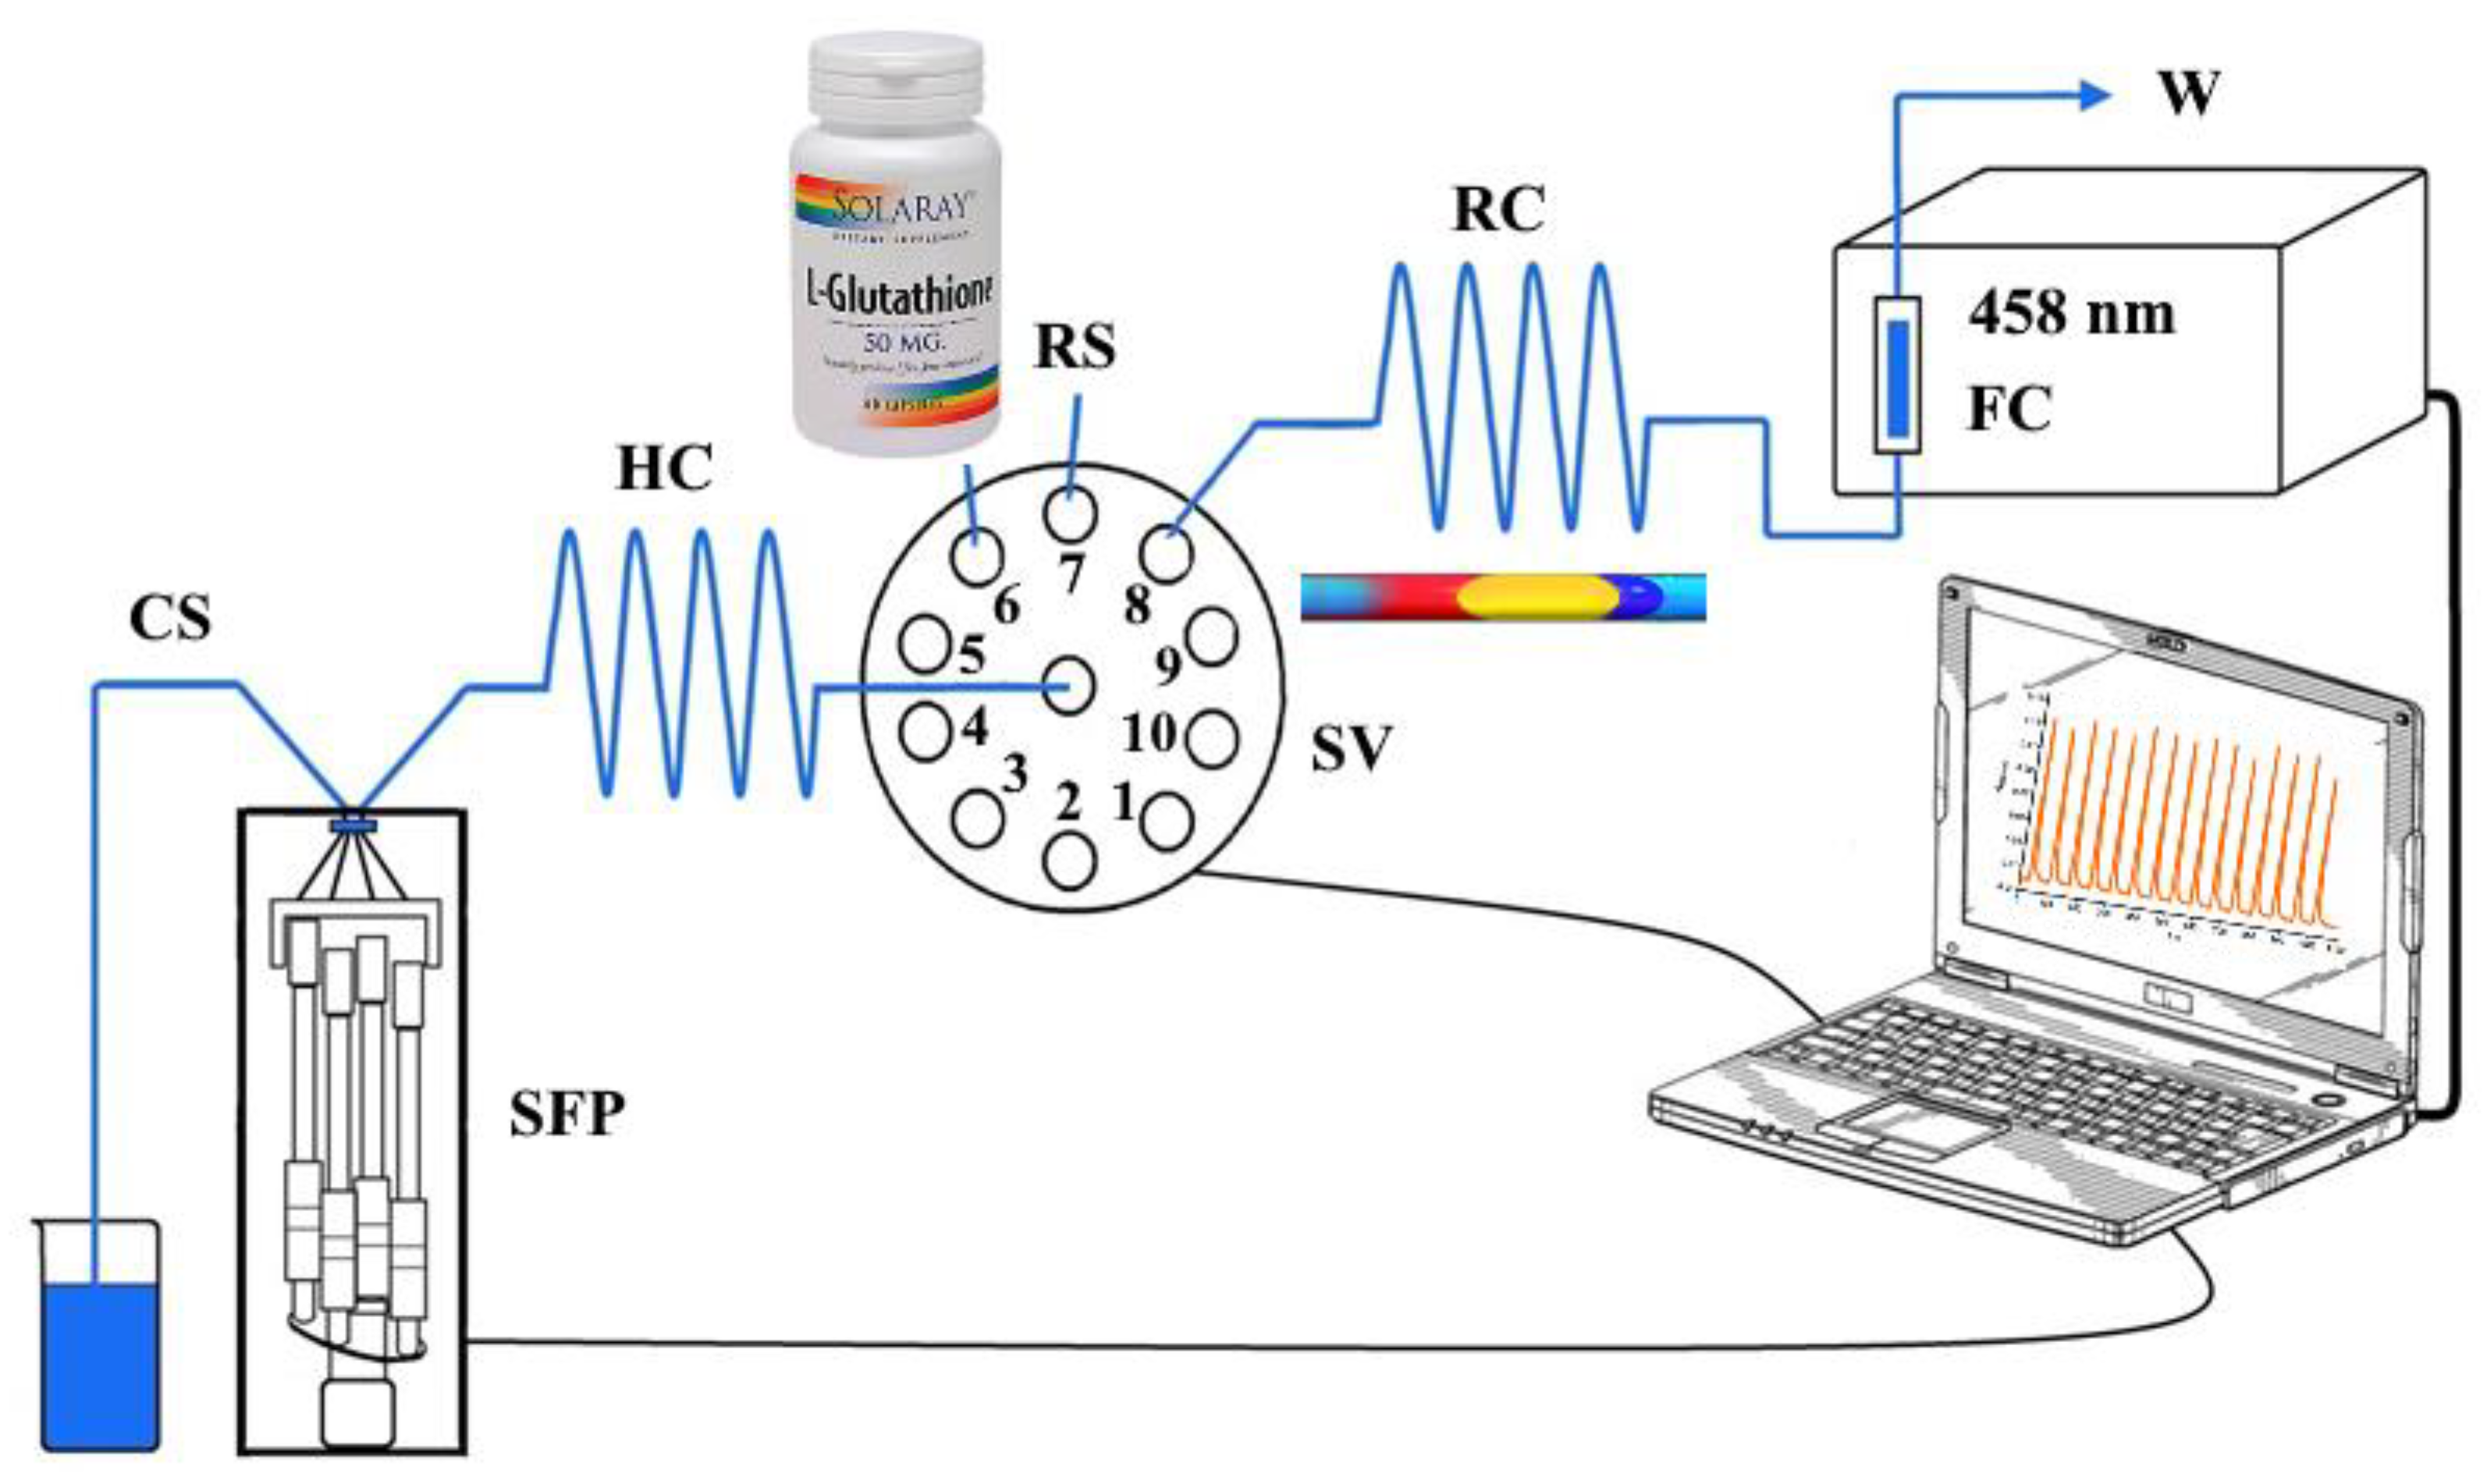
Figure 1. Schematic diagram of the SIA system: SFP—syringe-free pump (M50), SV—10-port selection valve, HC—holding coil, RC—reaction coil, CS—carrier stream (deionized H2O), RS—reagent stream, FC—flow cell, W—waste.
Sensors 24 05677 g001
Figure 2. Siagram of the aspiration sequence of analyte (GSH) and reagent (RS) solutions. Experimental conditions: c(GSH) = 4 × 10⁻⁵ mol L−1, c(Cu2+) = 1.0 × 10⁻⁴ mol L−1, c(Nc) = 2.4 × 10⁻⁴ mol L−1, pH = 3.0, temperature = 25 °C, carrier flow rate = 5000 μL min−1, reagent volume = 200 μL, sample volume = 200 μL, volume of the holding coil = 1000 µL, length of the reaction coil = 65 cm.
Sensors 24 05677 g002
Figure 3. Effect of the carrier flow rate on peak absorbance (A458 nm). Experimental conditions: c(GSH) = 4 × 10⁻⁵ mol L−1, c(Cu2+) = 1 × 10⁻⁴ mol L−1, c(Nc) = 2.4 × 10⁻⁴ mol L−1, pH = 3.0, temperature = 25 °C, reagent volume = 200 μL, sample volume = 200 μL, volume of the holding coil = 1000 μL, length of the reaction coil = 65 cm. Error bars = ±standard deviation (SD) (n = 3).
Sensors 24 05677 g003
Figure 4. Influence of the reagent volume on peak absorbance (A458 nm). Experimental conditions: c(GSH) = 4 × 10⁻⁵ mol L−1, c(Cu2+) = 1 × 10⁻⁴ mol L−1, c(Nc) = 2.4 × 10⁻⁴ mol L−1, pH = 3.0, temperature = 25 °C, carrier flow rate = 3000 mL min−1, sample volume = 200 μL, volume of the holding coil = 1000 μL, length of the reaction coil = 65 cm. Error bars = ±SD (n = 3).
Sensors 24 05677 g004
Figure 5. Effect of the sample volume on peak absorbance (A458 nm). Experimental conditions: c(GSH) = 4 × 10⁻⁵ mol L−1, c(Cu2+) = 1 × 10⁻⁴ mol L−1, c(Nc) = 2.4 × 10⁻⁴ mol L−1, pH = 3.0, temperature = 25 °C, carrier flow rate = 3000 mL min−1, reagent volume = 150 μL, volume of the holding coil = 1000 μL, length of the reaction coil = 65 cm. Error bars = ±SD (n = 3).
Sensors 24 05677 g005
Figure 6. Effect of the reaction coil length on peak absorbance (A458 nm). Experimental conditions: c(GSH) = 4 × 10⁻⁵ mol L−1, c(Cu2+) = 1 × 10⁻⁴ mol L−1, c(Nc) = 2.4 × 10⁻⁴ mol L−1, pH = 3.0, temperature = 25 °C, carrier flow rate = 3000 mL min−1, reagent volume = 150 μL, sample volume = 200 μL, volume of the holding coil = 500 μL. Error bars = ±SD (n = 3).
Sensors 24 05677 g006
Figure 7. Siagrams of the spectrophotometric determination of GSH in the concentration range of 6.0 × 10⁻⁷ mol L−1 to 1.0 × 10⁻⁴ mol L−1. Inset: calibration curve for the SIA determination of GSH in the range 6.0 × 10⁻⁷ mol L−1 to 8.0 × 10⁻⁵ mol L−1, obtained under optimal conditions (Table 2).
Sensors 24 05677 g007
Figure 8. Siagrams of the spectrophotometric determination of 4 × 10⁻⁵ mol L−1 GSH (1) and 4 × 10⁻⁵ mol L−1 GSH in the presence of 2 × 10⁻² mol L−1 (500 times molar excess) glucose (2), fructose (3), lactose (4), KNO3 (5), Na2SO4 (6), boric acid (7), or 4 × 10⁻⁴ mol L−1 (10 times molar excess) sodium citrate, obtained under optimal conditions (Table 2).
Sensors 24 05677 g008
Table 1. Optimized SIA procedure.
StepValve PositionFlow Rate, µL min−1Volume, µLDescription
173000150Aspiration of reagent solution to the holding coil
263000200Aspiration of sample solution to the holding coil
3830003000Propelling of the reaction mixture to the flow cell
Table 2. Initial values, studied ranges, and optimal values of the main design and operational parameters of the SIA method (RS-reagent solution, GSH–analyte solution).
Studied ParametersInitial ValueStudied RangeOptimal Value
Aspiration sequenceRS, GSHRS, GSH; GSH, RSRS, GSH
Carrier flow rate, µL min−150001000–80003000
Reagent volume, µL20050–450150
Sample volume, µL20050–450200
Holding coil length, μL1000500; 1000500
Reaction coil length, cm6535–12550
Table 3. The comparison of the analytical parameters of the presented SIA method for the determination of GSH with the previously developed SIA methods using spectrophotometric detection.
ldetection, nmLinear Range,
mol L−1
LOD,
mol L−1
RSD, %Sampling Rate, h−1SampleRef.
4121.0 × 10−7–3.0 × 10⁻⁶ 3.1 × 10⁻⁸ <5.0013blood[46]
2854.9 × 10−7–2.3 × 10−41.6 × 10−73.00100pharmaceuticals[47]
4586.0 × 10−7–8.0 × 10−52.0 × 10−73.8060pharmaceuticalspresent
LOD—Limit of Detection; RSD—Relative Standard Deviation.
Table 4. The effect of excipients commonly used in commercial pharmaceutical formulations in solutions containing 4 × 10⁻⁵ mol L−1 GSH (Peak absorbance; SD (n = 3); 0.145; 0.003).
ExcipientMolar Ratio of GSH to ExcipientPeak Absorbance; SD (n = 3)Relative Error, %
Glucose1:5000.141; 0.001−2.9
Fructose1:5000.148; 0.0041.8
Lactose1:5000.147; 0.0091.3
KNO31:5000.140; 0.002−3.5
Na2SO41:5000.140; 0.006−3.5
Boric acid1:5000.142; 0.005−2.7
Sodium citrate1:100.138; 0.003−4.9
Table 5. Evaluation of the accuracy of the SIA method for the determination of GSH.
SampleAdded, mgFound (b), mgRecovery, %
L-glutathione (a)050.3 ± 0.9
5096.5 ± 1.196.5
100149.7 ± 0.599.8
150195.8 ± 1.397.9
200254.0 ± 1.5101.6
(a) Capsules containing GSH 50 mg and excipients. (b) Average ± standard deviation (SD) of three determinations per sample.
Disclaimer/Publisher’s Note: The statements, opinions and data contained in all publications are solely those of the individual author(s) and contributor(s) and not of MDPI and/or the editor(s). MDPI and/or the editor(s) disclaim responsibility for any injury to people or property resulting from any ideas, methods, instructions or products referred to in the content.