
Use of the Perturbing Sphere Method for the Estimation of Radiofrequency Coils’ Efficiency in Magnetic Resonance Applications: Experience from an Electromagnetic Laboratory
Abstract
:1. Introduction
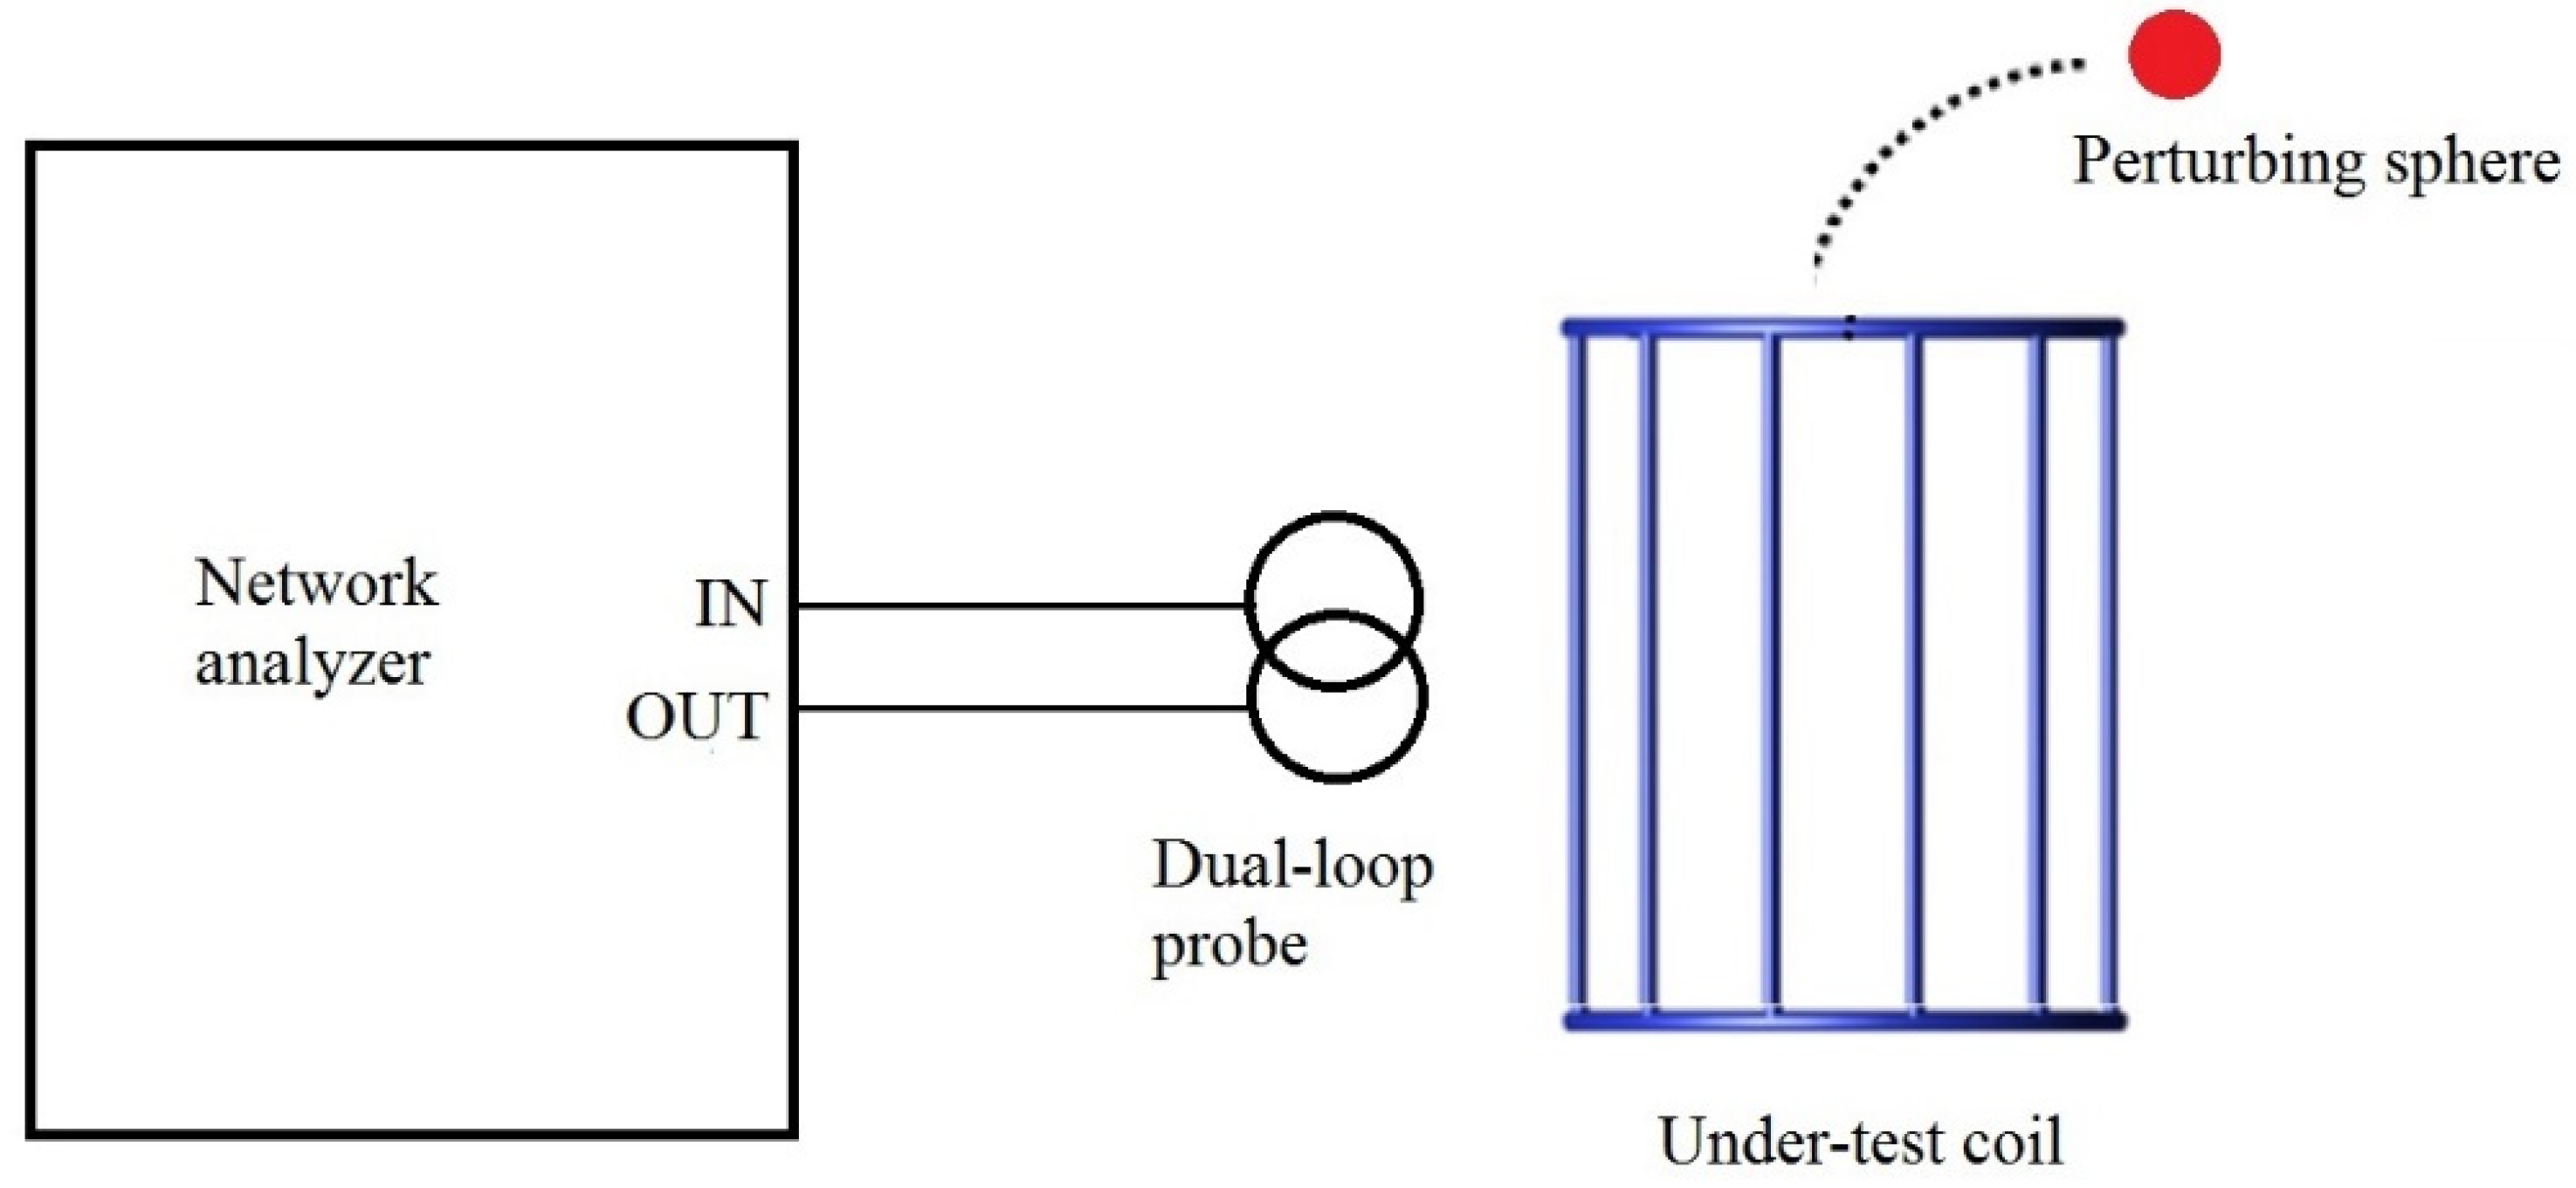
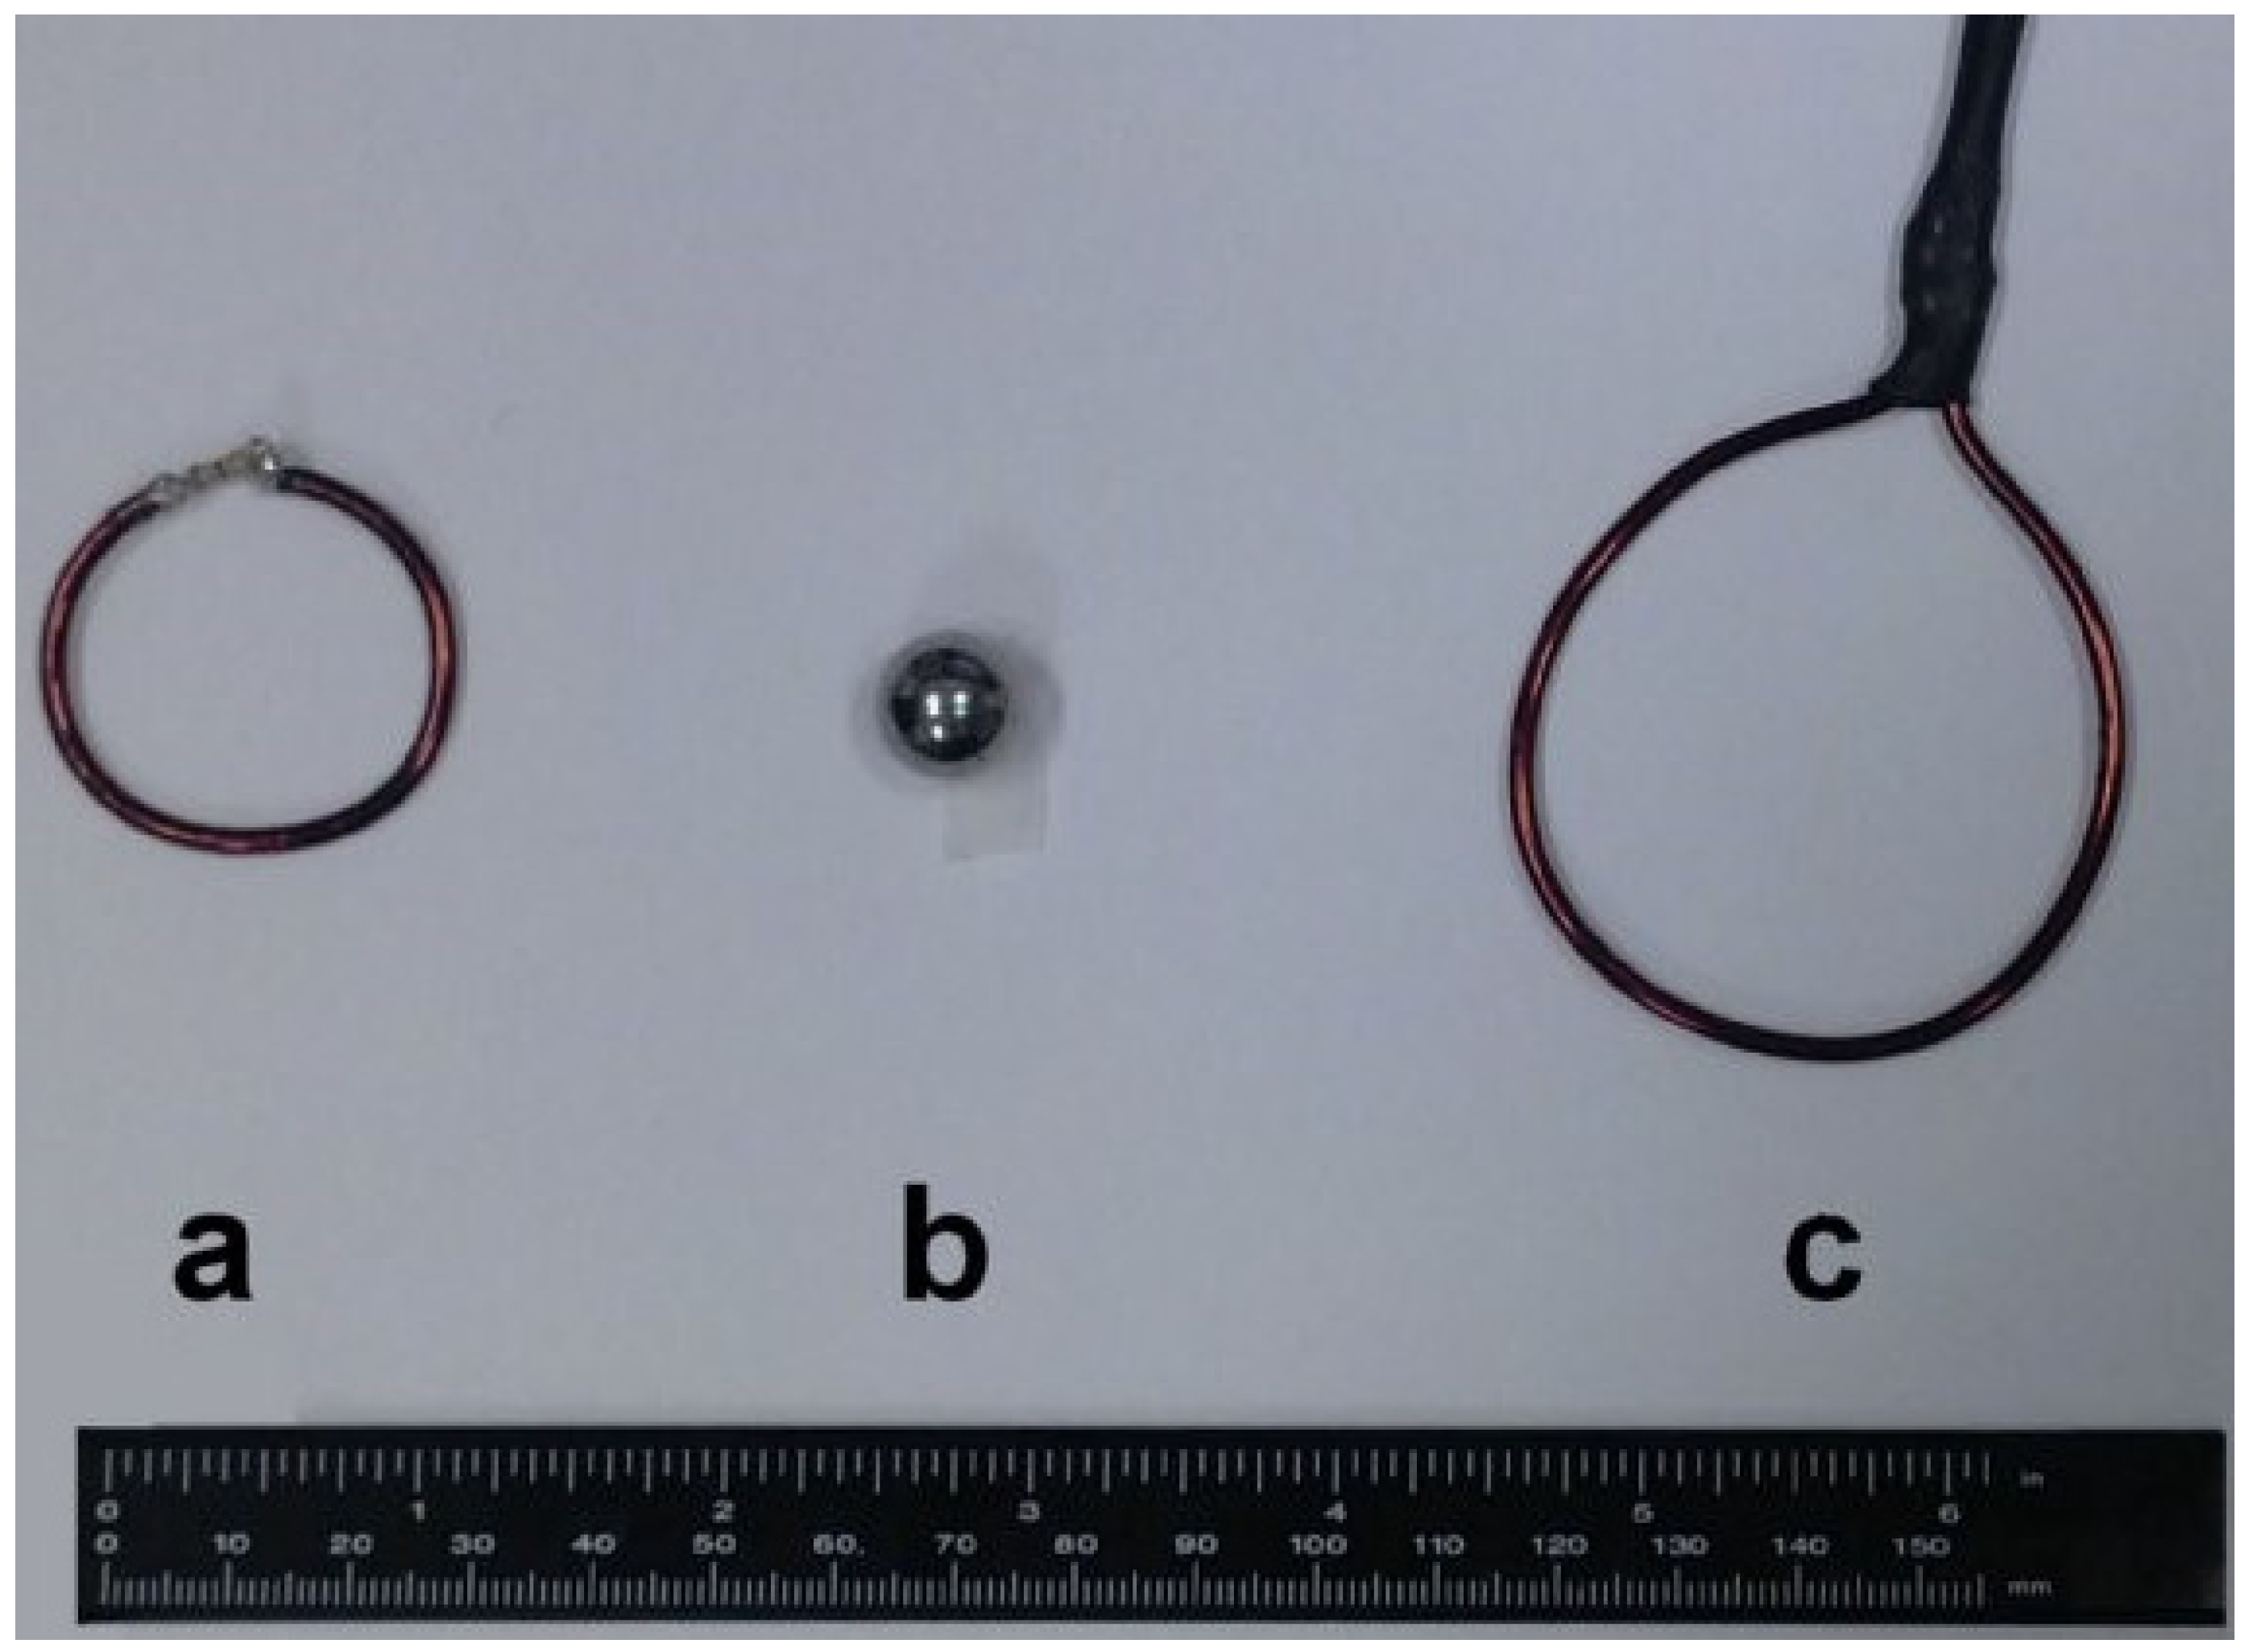
2. Perturbing Sphere Method
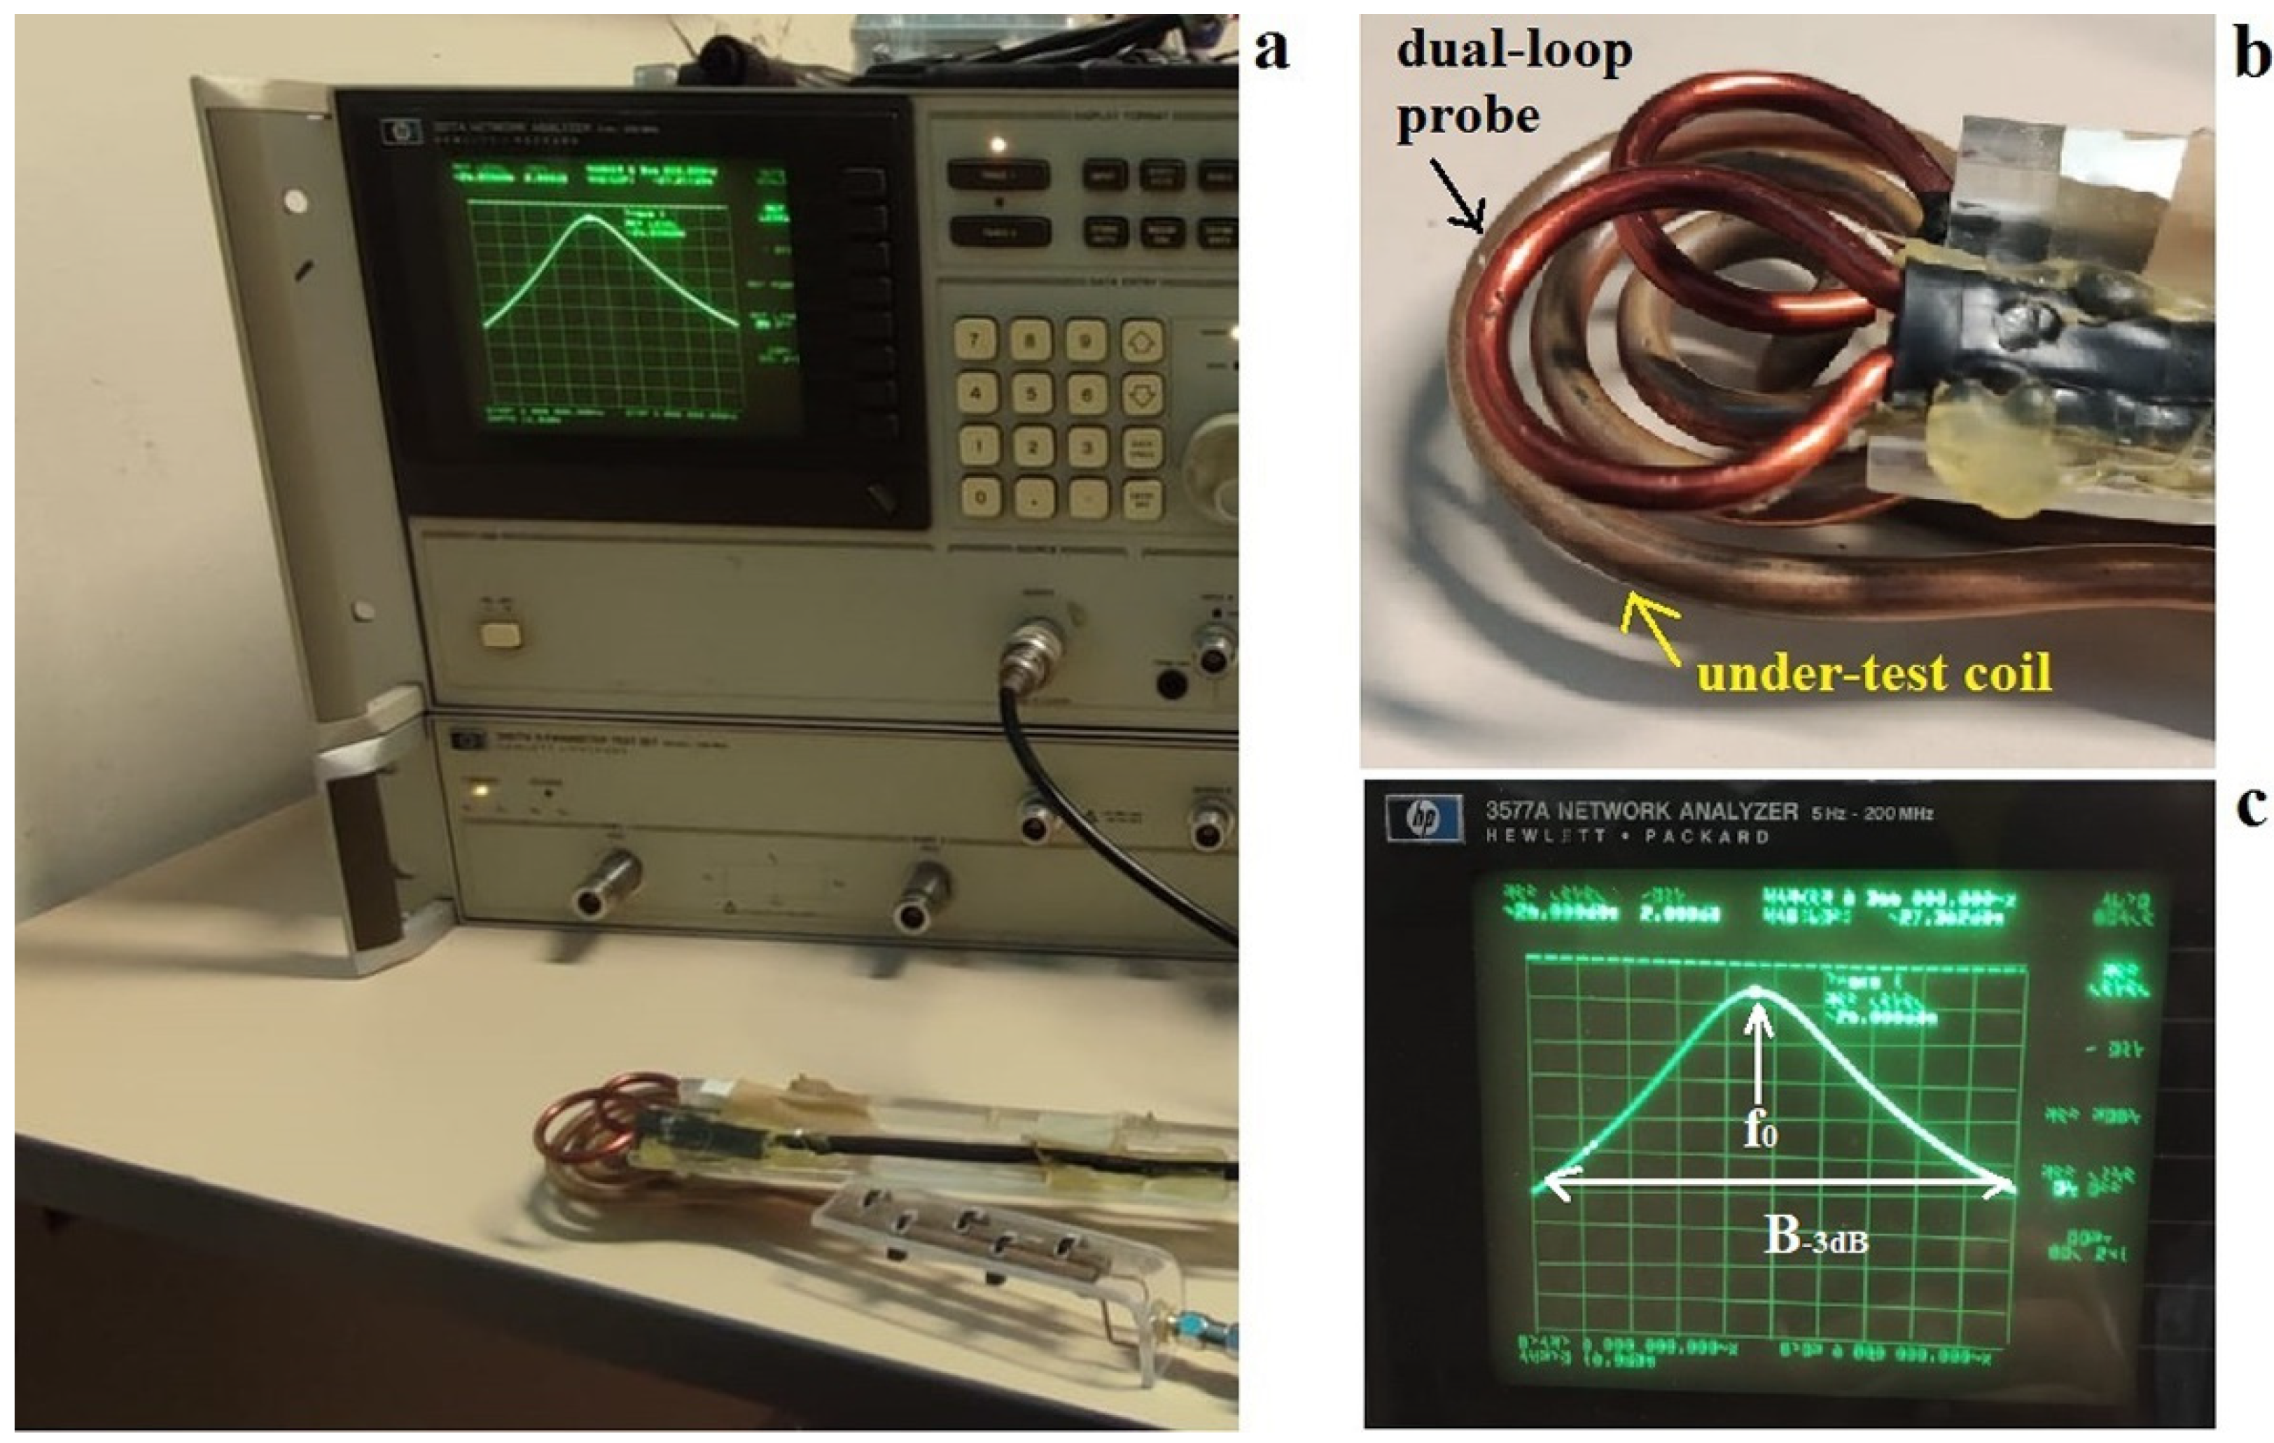
3. Workbench Measurements
4. Coil Efficiency Measurements Performed in Our Lab
5. Discussion
Author Contributions
Funding
Institutional Review Board Statement
Informed Consent Statement
Data Availability Statement
Conflicts of Interest
References
- Faghihi, R.; Zeinali-Rafsanjani, B.; Mosleh-Shirazi, M.A.; Saeedi-Moghadam, M.; Lotfi, M.; Jalli, R.; Iravani, V. Magnetic Resonance Spectroscopy and its Clinical Applications: A Review. J. Med. Imaging Radiat. Sci. 2017, 48, 233–253. [Google Scholar] [CrossRef] [PubMed]
- Jin, J. Electromagnetic Analysis and Design in Magnetic Resonance Imaging; CRC: Boca Raton, FL, USA, 1999. [Google Scholar]
- Haase, A.; Odoj, F.; Von Kienlin, M.; Warnking, J.; Fidler, F.; Weisser, A.; Nittka, M.; Rommel, E.; Lanz, T.; Kalusche, B.; et al. NMR probeheads for in vivo applications. Conc. Magn. Reson. 2000, 12, 361–388. [Google Scholar] [CrossRef]
- Roemer, P.B.; Edelstein, W.A.; Hayes, C.E.; Souza, S.P.; Mueller, O.M. The NMR phased array. Magn. Reson. Med. 1990, 16, 192–225. [Google Scholar] [CrossRef]
- Darrasse, L.; Kassab, G. Quick measurement of NMR-coil sensitivity with a dual-loop probe. Rev. Sci. Instrum. 1993, 64, 1841–1844. [Google Scholar] [CrossRef]
- Hoult, D.I. The principle of reciprocity in signal strength calculations—A mathematical guide. Concepts Magn. Reson. 2000, 12, 173–187. [Google Scholar] [CrossRef]
- Hoult, D.I.; Lauterbur, P.C. The sensitivity of the zeugmatographic experiment involving human samples. J. Magn. Reson. (1969) 1979, 34, 425–433. [Google Scholar] [CrossRef]
- Hornak, J.P. Encyclopedia of Imaging Science and Technology; Wiley: Hoboken, NJ, USA, 2002; Volume 2. [Google Scholar]
- Maier, L.C., Jr.; Slater, J.C. Field Strength Measurements in Resonant Cavities. J. Appl. Phys. 1952, 23, 68–77. [Google Scholar] [CrossRef]
- Freed, J.H.; Leniart, D.S.; Hyde, J.S. Theory of Saturation and Double Resonance Effects in ESR Spectra. III. rf Coherence and Line Shapes. J. Chem. Phys. 1967, 47, 2762–2773. [Google Scholar] [CrossRef]
- Hornak, J.P.; Freed, J.H. Spectral rotation in pulsed ESR spectroscopy. J. Magn. Reson. (1969) 1986, 67, 501–518. [Google Scholar] [CrossRef]
- Alecci, M.; Seimenis, I.; McCallum, S.J.; Lurie, D.J.; Foster, M.A. Nitroxide free radical clearance in the live rat monitored by radio-frequency CW-EPR and PEDRI. Phys. Med. Biol. 1998, 43, 1899. [Google Scholar] [CrossRef]
- He, G.; Evalappan, S.P.; Hirata, H.; Deng, Y.; Petryakov, S.; Kuppusamy, P.; Zweier, J.L. Mapping of the B1 field distribution of a surface coil resonator using EPR imaging. Magn. Reson. Med. 2002, 48, 1057–1062. [Google Scholar] [CrossRef] [PubMed]
- Hirata, H.; He, G.; Deng, Y.; Salikhov, I.; Petryakov, S.; Zweier, J.L. A loop resonator for slice-selective in vivo EPR imaging in rats. J. Magn. Reson. 2008, 190, 124–134. [Google Scholar] [CrossRef] [PubMed]
- Petryakov, S.V.; Schreiber, W.; Kmiec, M.M.; Williams, B.B.; Swartz, H.M. Surface Dielectric Resonators for X-band EPR Spectroscopy. Radiat. Prot. Dosim. 2016, 172, 127–132. [Google Scholar] [CrossRef]
- Sidabras, J.W.; Reijerse, E.J.; Lubitz, W. Uniform Field Re-entrant Cylindrical TE[Formula: See text] Cavity for Pulse Electron Paramagnetic Resonance Spectroscopy at Q-band. Appl. Magn. Reson. 2017, 48, 1301–1314. [Google Scholar] [CrossRef] [PubMed]
- Amida, T.; Nakaoka, R.; Komarov, D.A.; Yamamoto, K.; Inanami, O.; Matsumoto, S.; Hirata, H. A 750-MHz Electronically Tunable Resonator Using Microstrip Line Couplers for Electron Paramagnetic Resonance Imaging of a Mouse Tumor-Bearing Leg. IEEE Trans. Biomed. Eng. 2018, 65, 1124–1132. [Google Scholar] [CrossRef]
- Wiedemann, H.T.A.; Ruloff, S.; Richter, R.; Zollitsch, C.W.; Kay, C.W.M. Towards high performance dielectric microwave resonators for X-band EPR spectroscopy. J. Magn. Reson. 2023, 354, 107519. [Google Scholar] [CrossRef]
- Chen, C.N.; Hoult, D.I.; Sank, V.J. A further improvement in sensitivity. J. Magn. Reson. 1983, 54, 324–327. [Google Scholar]
- Mispelter, J.; Lupu, M.; Briguet, A. NMR Probeheads for Biophysical and Biomedical Experiments: Theoretical Principles & Practical Guidelines, 2nd ed.; Imperial College Press: London, UK, 2015. [Google Scholar]
- Wright, S.M.; Wald, L.L. Theory and application of array coils in MR spectroscopy. NMR Biomed. 1997, 10, 394–410. [Google Scholar] [CrossRef]
- Nasserdine, M.; Menguè, S.; Bourcier, C.; Richalot, E. Field Measurements within a Large Resonant Cavity Based on the Perturbation Theory. Progress. Electromagn. Res. B 2014, 57, 1–20. [Google Scholar] [CrossRef]
- Belevitch, V. Lateral skin effect in a flat conductor. Philips. Tech. Rev. 1971, 32, 221–231. [Google Scholar]
- Doty, F.D.; Entzminger, G.; Hauck, C.D.; Staab, J.P. Practical aspects of birdcage coils. J. Magn. Reson. 1999, 138, 144–154. [Google Scholar] [CrossRef]
- Yeung, D.; Hutchison, J.M.S.; Lurie, D.J. An efficient birdcage resonator at 2.5 MHz using a novel multilayer self-capacitance construction technique. Magn. Reson. Mater. Phys. Bioiogy Med. 1995, 3, 163–168. [Google Scholar] [CrossRef]
- Giovannetti, G.; Francesconi, R.; Landini, L.; Santarelli, M.F.; Positano, V.; Viti, V.; Benassi, A. Conductor geometry and capacitor quality for performance optimization of low-frequency birdcage coils. Concepts Magn. Reson. Part B Magn. Reson. Eng. 2004, 20, 9–16. [Google Scholar] [CrossRef]
- Chen, C.N.; Hoult, D.I. Biomedical Magnetic Resonance Technology; Adam Hilger: London, UK, 1989. [Google Scholar]
- Giovannetti, G.; Frijia, F.; Menichetti, L.; Ardenkjaer-Larsen, J.H.; Hartwig, V.; De Marchi, D.; Positano, V.; Landini, L.; Lombardi, M.; Santarelli, M.F. Coil Sensitivity Estimation with Perturbing Sphere Method: Application to 13C Birdcages. Appl. Magn. Reson. 2012, 42, 511–518. [Google Scholar] [CrossRef]
- Hendrick, E.R. Breast MRI: Fundamentals and Technical Aspects; Springer Science and Business Media: New York, NY, USA, 2008. [Google Scholar]
- Giovannetti, G.; Hartwig, V.; Landini, L.; Santarelli, M.F. Classical and lateral skin effect contributions estimation in strip MR coils. Concepts Magn. Reson. Part B Magn. Reson. Eng. 2012, 41, 57–61. [Google Scholar] [CrossRef]
- Giovannetti, G.; Frijia, F.; Hartwig, V.; Menichetti, L.; Ardenkjaer-Larsen, J.H.; De Marchi, D.; Positano, V.; Landini, L.; Lombardi, M.; Santarelli, M.F. Efficiency evaluation of a 13C Magnetic Resonance birdcage coil: Theory and comparison of four methods. Measurement 2013, 46, 2201–2205. [Google Scholar] [CrossRef]
- Giovannetti, G.; Frijia, F.; Hartwig, V.; Menichetti, L.; De Marchi, D.; Positano, V.; Landini, L.; Lombardi, M.; Santarelli, M.F.; Ardenkjaer-Larsen, J.H. A novel method for coil efficiency estimation: Validation with a 13C birdcage. Concepts Magn. Reson. Part B Magn. Reson. Eng. 2012, 41, 139–143. [Google Scholar] [CrossRef]
- Keifer, P.A. 90° pulse width calibrations: How to read a pulse width array. Concept. Magn. Res. 1999, 11, 165–180. [Google Scholar] [CrossRef]
- Giovannetti, G.; Frijia, F.; Flori, A.; Montanaro, D. Design and Simulation of a Helmholtz Coil for Magnetic Resonance Imaging and Spectroscopy Experiments with a 3T MR Clinical Scanner. Appl. Magn. Reson. 2019, 50, 1083–1097. [Google Scholar] [CrossRef]
- Giovannetti, G.; Flori, A.; De Marchi, D.; Montanaro, D.; Frijia, F. Design of a dedicated circular coil for Magnetic Resonance Spectroscopy studies in small phantoms and animal acquisition with a 3 Tesla Magnetic Resonance clinical scanner. Pol. J. Med. Phys. Eng. 2020, 26, 269–276. [Google Scholar] [CrossRef]
- Frijia, F.; Flori, A.; Giovannetti, G. Design, simulation, and test of surface and volume radio frequency coils for 13C magnetic resonance imaging and spectroscopy. Rev. Sci. Instrum. 2021, 92, 081402. [Google Scholar] [CrossRef] [PubMed]
- Giovannetti, G.; Flori, A.; Martini, N.; Cademartiri, F.; Aquaro, G.D.; Pingitore, A.; Frijia, F. Hardware and Software Setup for Quantitative 23Na Magnetic Resonance Imaging at 3T: A Phantom Study. Sensors 2024, 24, 2716. [Google Scholar] [CrossRef] [PubMed]
- Matson, G.B.; Vermathen, P.; Hill, T.C. A practical double-tuned 1H/31P quadrature birdcage headcoil optimized for 31P operation. Magn. Reson. Med. 1999, 42, 173–182. [Google Scholar] [CrossRef]
- Isaac, G.; Schnall, M.D. A design for a double-tuned birdcage coil for use in an integrated MRI/MRS examination. J. Magn. Reson. 1990, 89, 41–50. [Google Scholar] [CrossRef]
- Hoult, D.I. Sensitivity and power deposition in a high-field imaging experiment. J. Magn. Reson. Imag. 2000, 12, 46–67. [Google Scholar] [CrossRef]
- Kwok, W.E. Basic Principles of and Practical Guide to Clinical MRI Radiofrequency Coils. RadioGraphics 2022, 42, 898–918. [Google Scholar] [CrossRef]
- Testagrossa, B.; Ruello, E.; Gurgone, S.; Denaro, L.; Sansotta, C.; Salmeri, F.M.; Acri, G. Radio Frequency MRI coils and safety: How infrared thermography can support quality assurance. Egypt. J. Radiol. Nucl. Med. 2021, 52, 277. [Google Scholar] [CrossRef]

| Birdcage Typology | Q | η (μT/W1/2) | |
|---|---|---|---|
| 35 μm thickness strip conductor and standard-quality capacitors | 21 | 11.92 | 2.6 |
| 35 μm thickness strip conductor and high-quality capacitors | 228 | 34.61 | 2.2 |
| 800 μm thickness strip conductor and high-quality capacitors | 374 | 42.74 | 2.3 |
| Wire conductor and high-quality capacitors | 477 | 52.31 | 2.4 |
| Experiment | Rat Coil η (μT/W1/2) | Pig Coil η (μT/W1/2) | Rat/Pig η Ratio |
|---|---|---|---|
| Workbench efficiency test with steel sphere | 20.92 | 2.21 | 9.47 |
| Workbench efficiency test with lead sphere | 20.66 | 2.28 | 9.06 |
| MR scanner efficiency test with lead sphere | 21.89 | 1.48 | 14.8 |
| Circular Coil | Q | η (μT/W1/2) | |
|---|---|---|---|
| Strip conductor | 315 | 9.48 | 0.53 |
| Wire conductor | 345 | 11.01 | 0.57 |
| Efficiency Measurement Method | η (μT/W1/2) |
|---|---|
| Perturbing loop | 25.65 ± 1.76 |
| Perturbing sphere | 26.40 ± 0.52 |
| Pickup loop | 26.24 |
| Nutation | 25.10 |
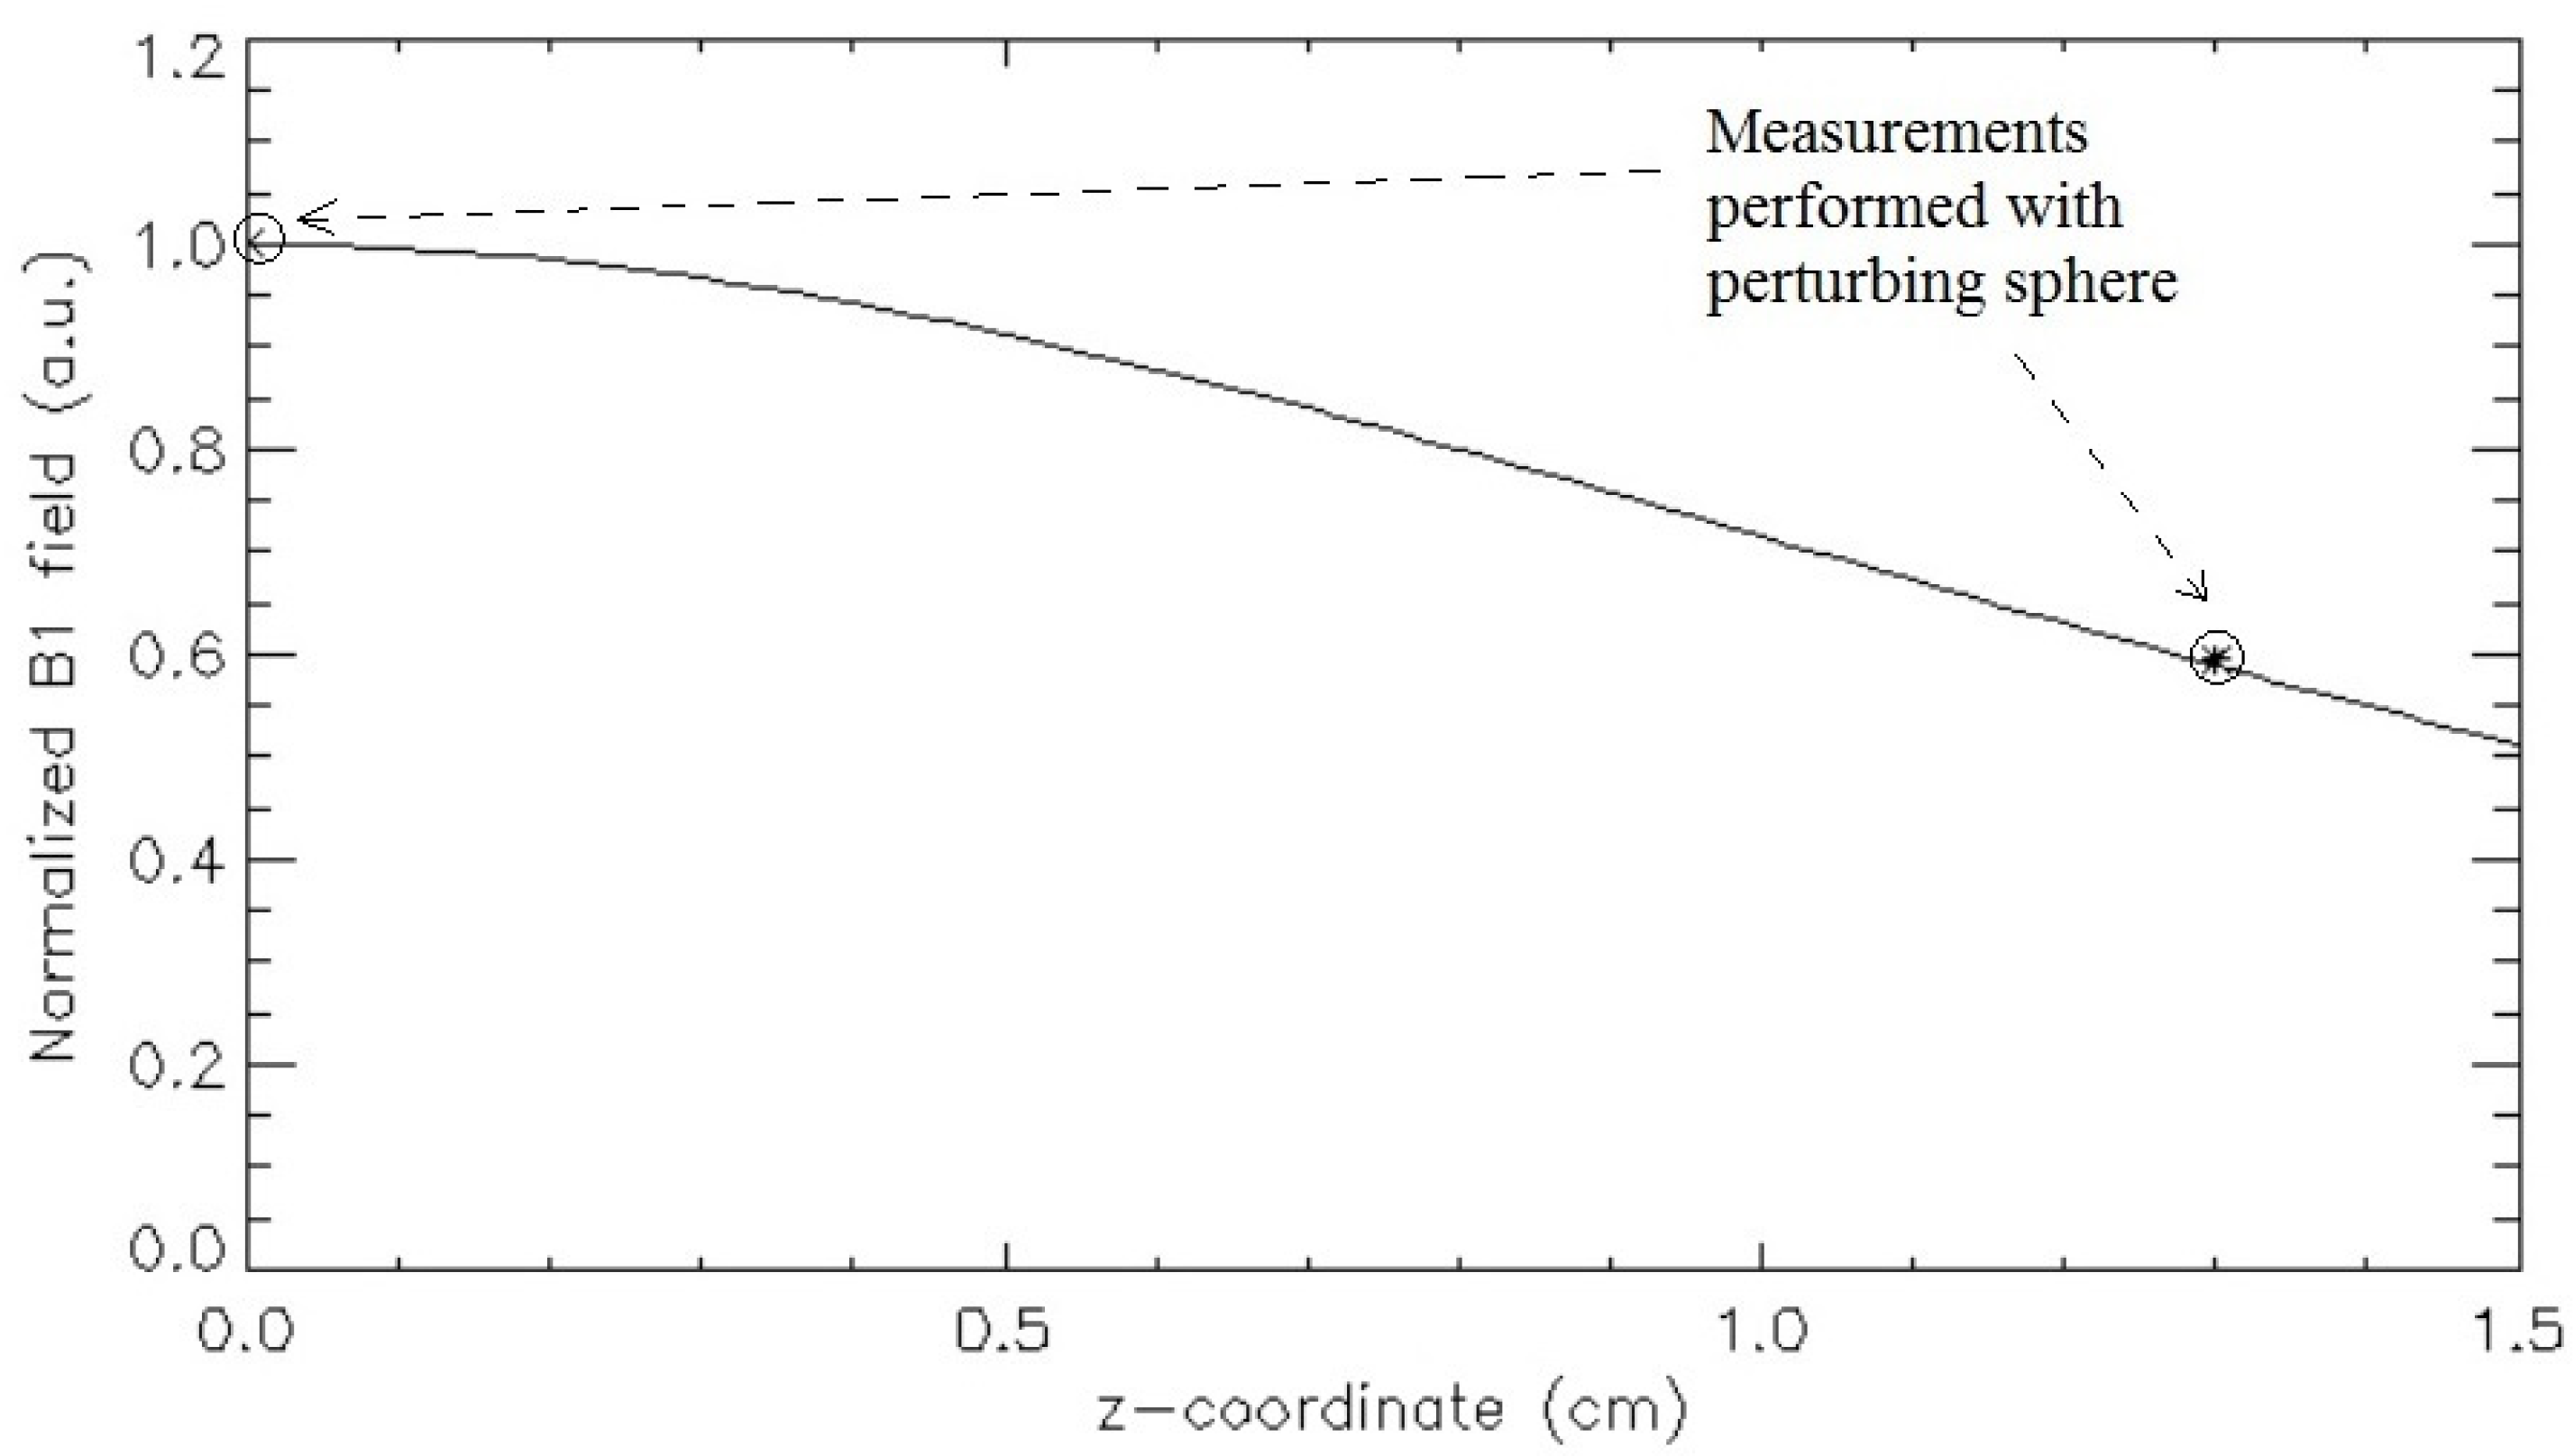
| Coil Efficiency | z = 0 cm | z = 1.3 cm |
|---|---|---|
| η (μT/W1/2) | 30.13 ± 0.44 | 17.91 ± 0.63 |
Disclaimer/Publisher’s Note: The statements, opinions and data contained in all publications are solely those of the individual author(s) and contributor(s) and not of MDPI and/or the editor(s). MDPI and/or the editor(s) disclaim responsibility for any injury to people or property resulting from any ideas, methods, instructions or products referred to in the content. |
© 2024 by the authors. Licensee MDPI, Basel, Switzerland. This article is an open access article distributed under the terms and conditions of the Creative Commons Attribution (CC BY) license (https://creativecommons.org/licenses/by/4.0/).
Share and Cite
Giovannetti, G.; Frijia, F. Use of the Perturbing Sphere Method for the Estimation of Radiofrequency Coils’ Efficiency in Magnetic Resonance Applications: Experience from an Electromagnetic Laboratory. Sensors 2024, 24, 5705. https://doi.org/10.3390/s24175705
Giovannetti G, Frijia F. Use of the Perturbing Sphere Method for the Estimation of Radiofrequency Coils’ Efficiency in Magnetic Resonance Applications: Experience from an Electromagnetic Laboratory. Sensors. 2024; 24(17):5705. https://doi.org/10.3390/s24175705
Chicago/Turabian StyleGiovannetti, Giulio, and Francesca Frijia. 2024. "Use of the Perturbing Sphere Method for the Estimation of Radiofrequency Coils’ Efficiency in Magnetic Resonance Applications: Experience from an Electromagnetic Laboratory" Sensors 24, no. 17: 5705. https://doi.org/10.3390/s24175705