

Analytical Performance of the FreeStyle Libre 2 Glucose Sensor in Healthy Male Adults
 , ,
, ,
Abstract
:1. Introduction
2. Materials and Methods
2.1. Trial Oversight
2.2. Participants
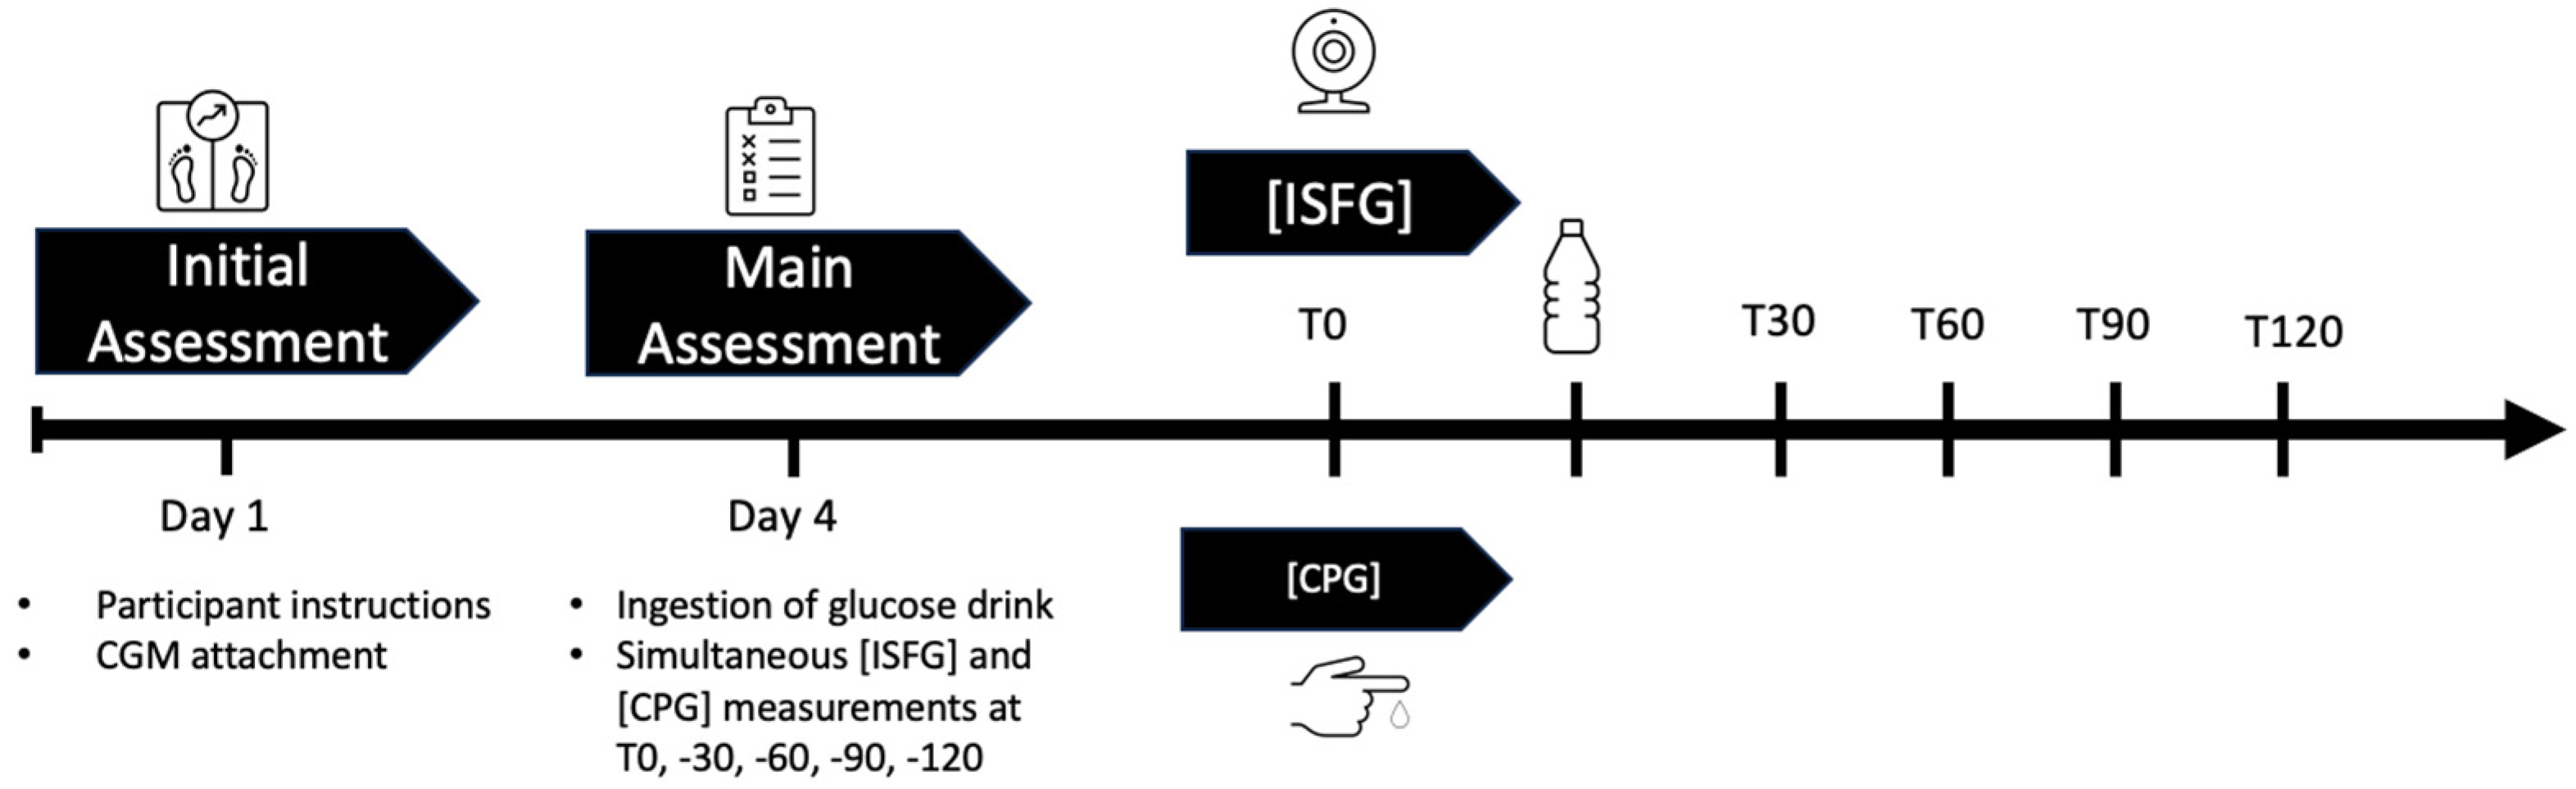
2.3. Study Design
2.3.1. Initial Assessment
2.3.2. Main Assessment
2.3.3. Blood Sampling and Analysis
2.4. Statistical Approach and CGM Accuracy
2.4.1. Mean Absolute Relative Difference (MARD)
2.4.2. ISO 15197:2013 Criteria
- When the reference CPG is less than 100 mg/dL (resp. 5.56 mmol/L), 95% of the device’s ISFG results must fall within ±15 mg/dL (0.83 mmol/L) of the reference value CPG or within ±15% when the reference glucose values are greater than 100 mg/dL;
- At least 99% of results must fall within zones A and B in the Consensus Error Grid (CEG), also referred to as the Parkes Error Grid. Zones are defined as follows: zone A (no effect on clinical action), zone B (altered clinical action with little or no effect on clinical outcomes), zone C (altered clinical action and likely to affect clinical outcomes), zone D (altered clinical action that could have significant medical risks), and zone E (altered clinical action that could have dangerous consequences).
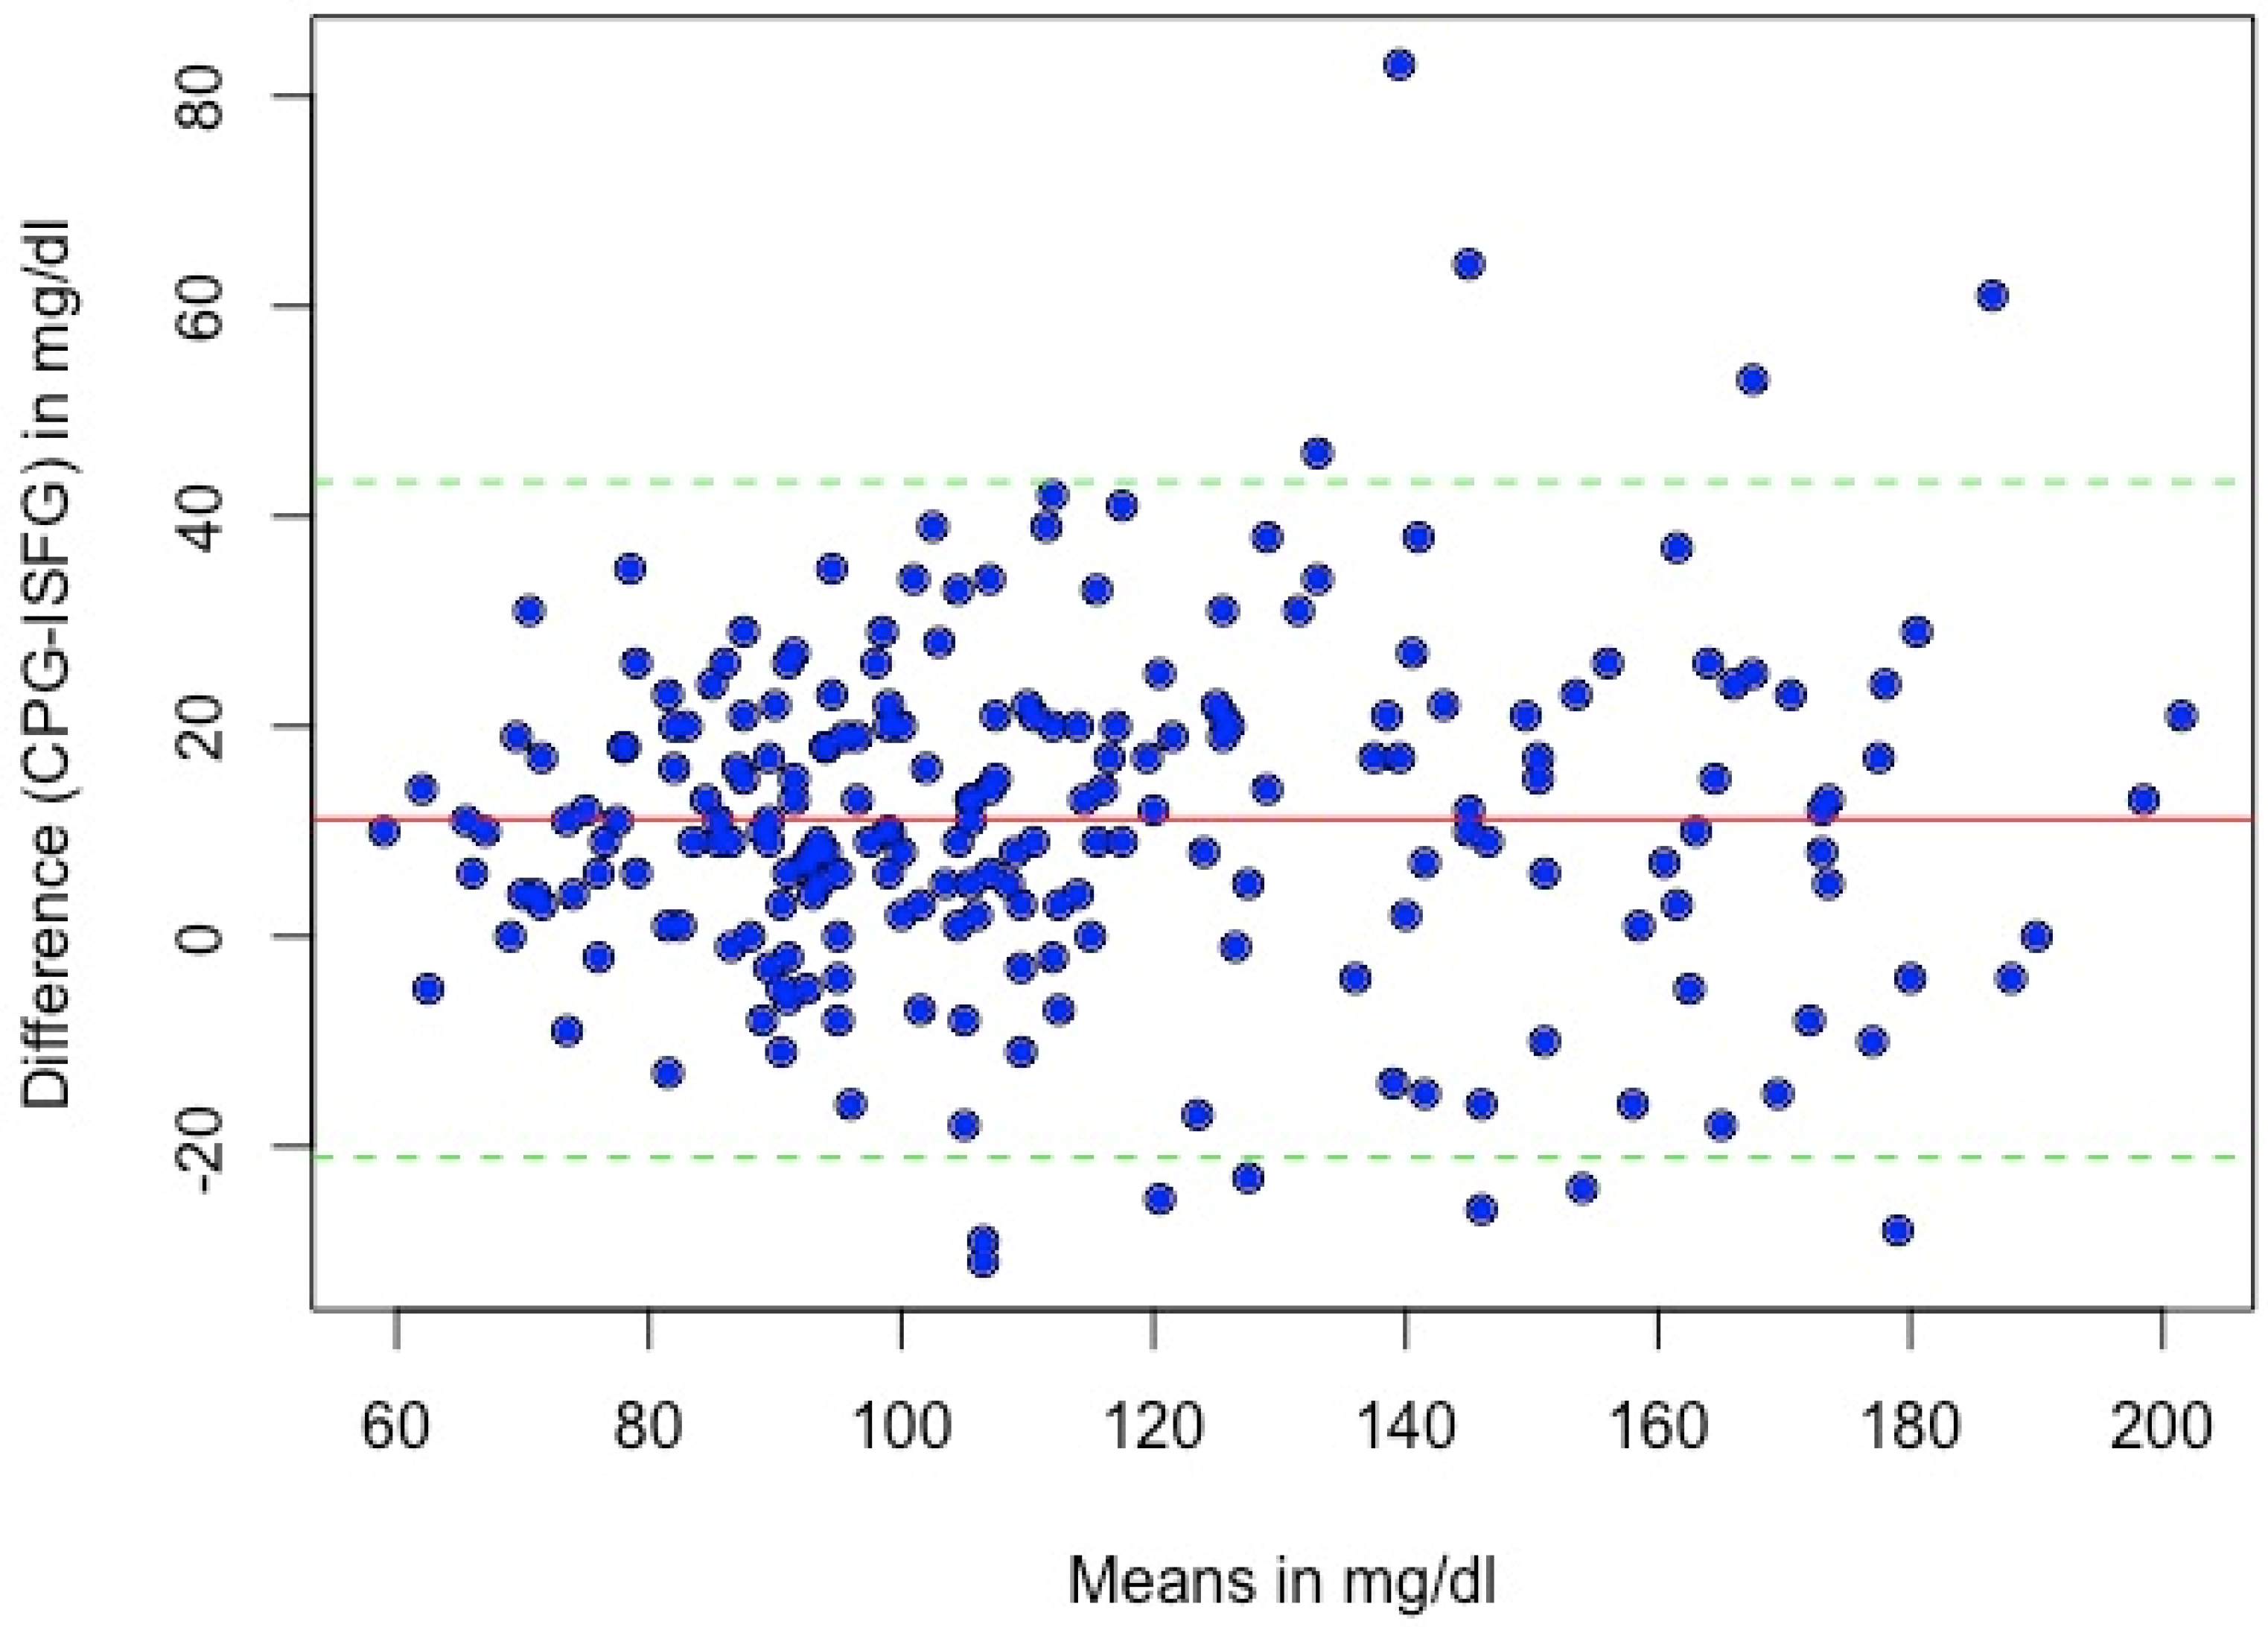
2.4.3. Systematic Measurement Difference (Bias)
2.4.4. Differences between Discrete Timepoints
3. Results
3.1. Mean Absolute Relative Difference (MARD)
3.2. ISO 15197:2013 Criteria
3.3. Systematic Measurement Difference (Bias)
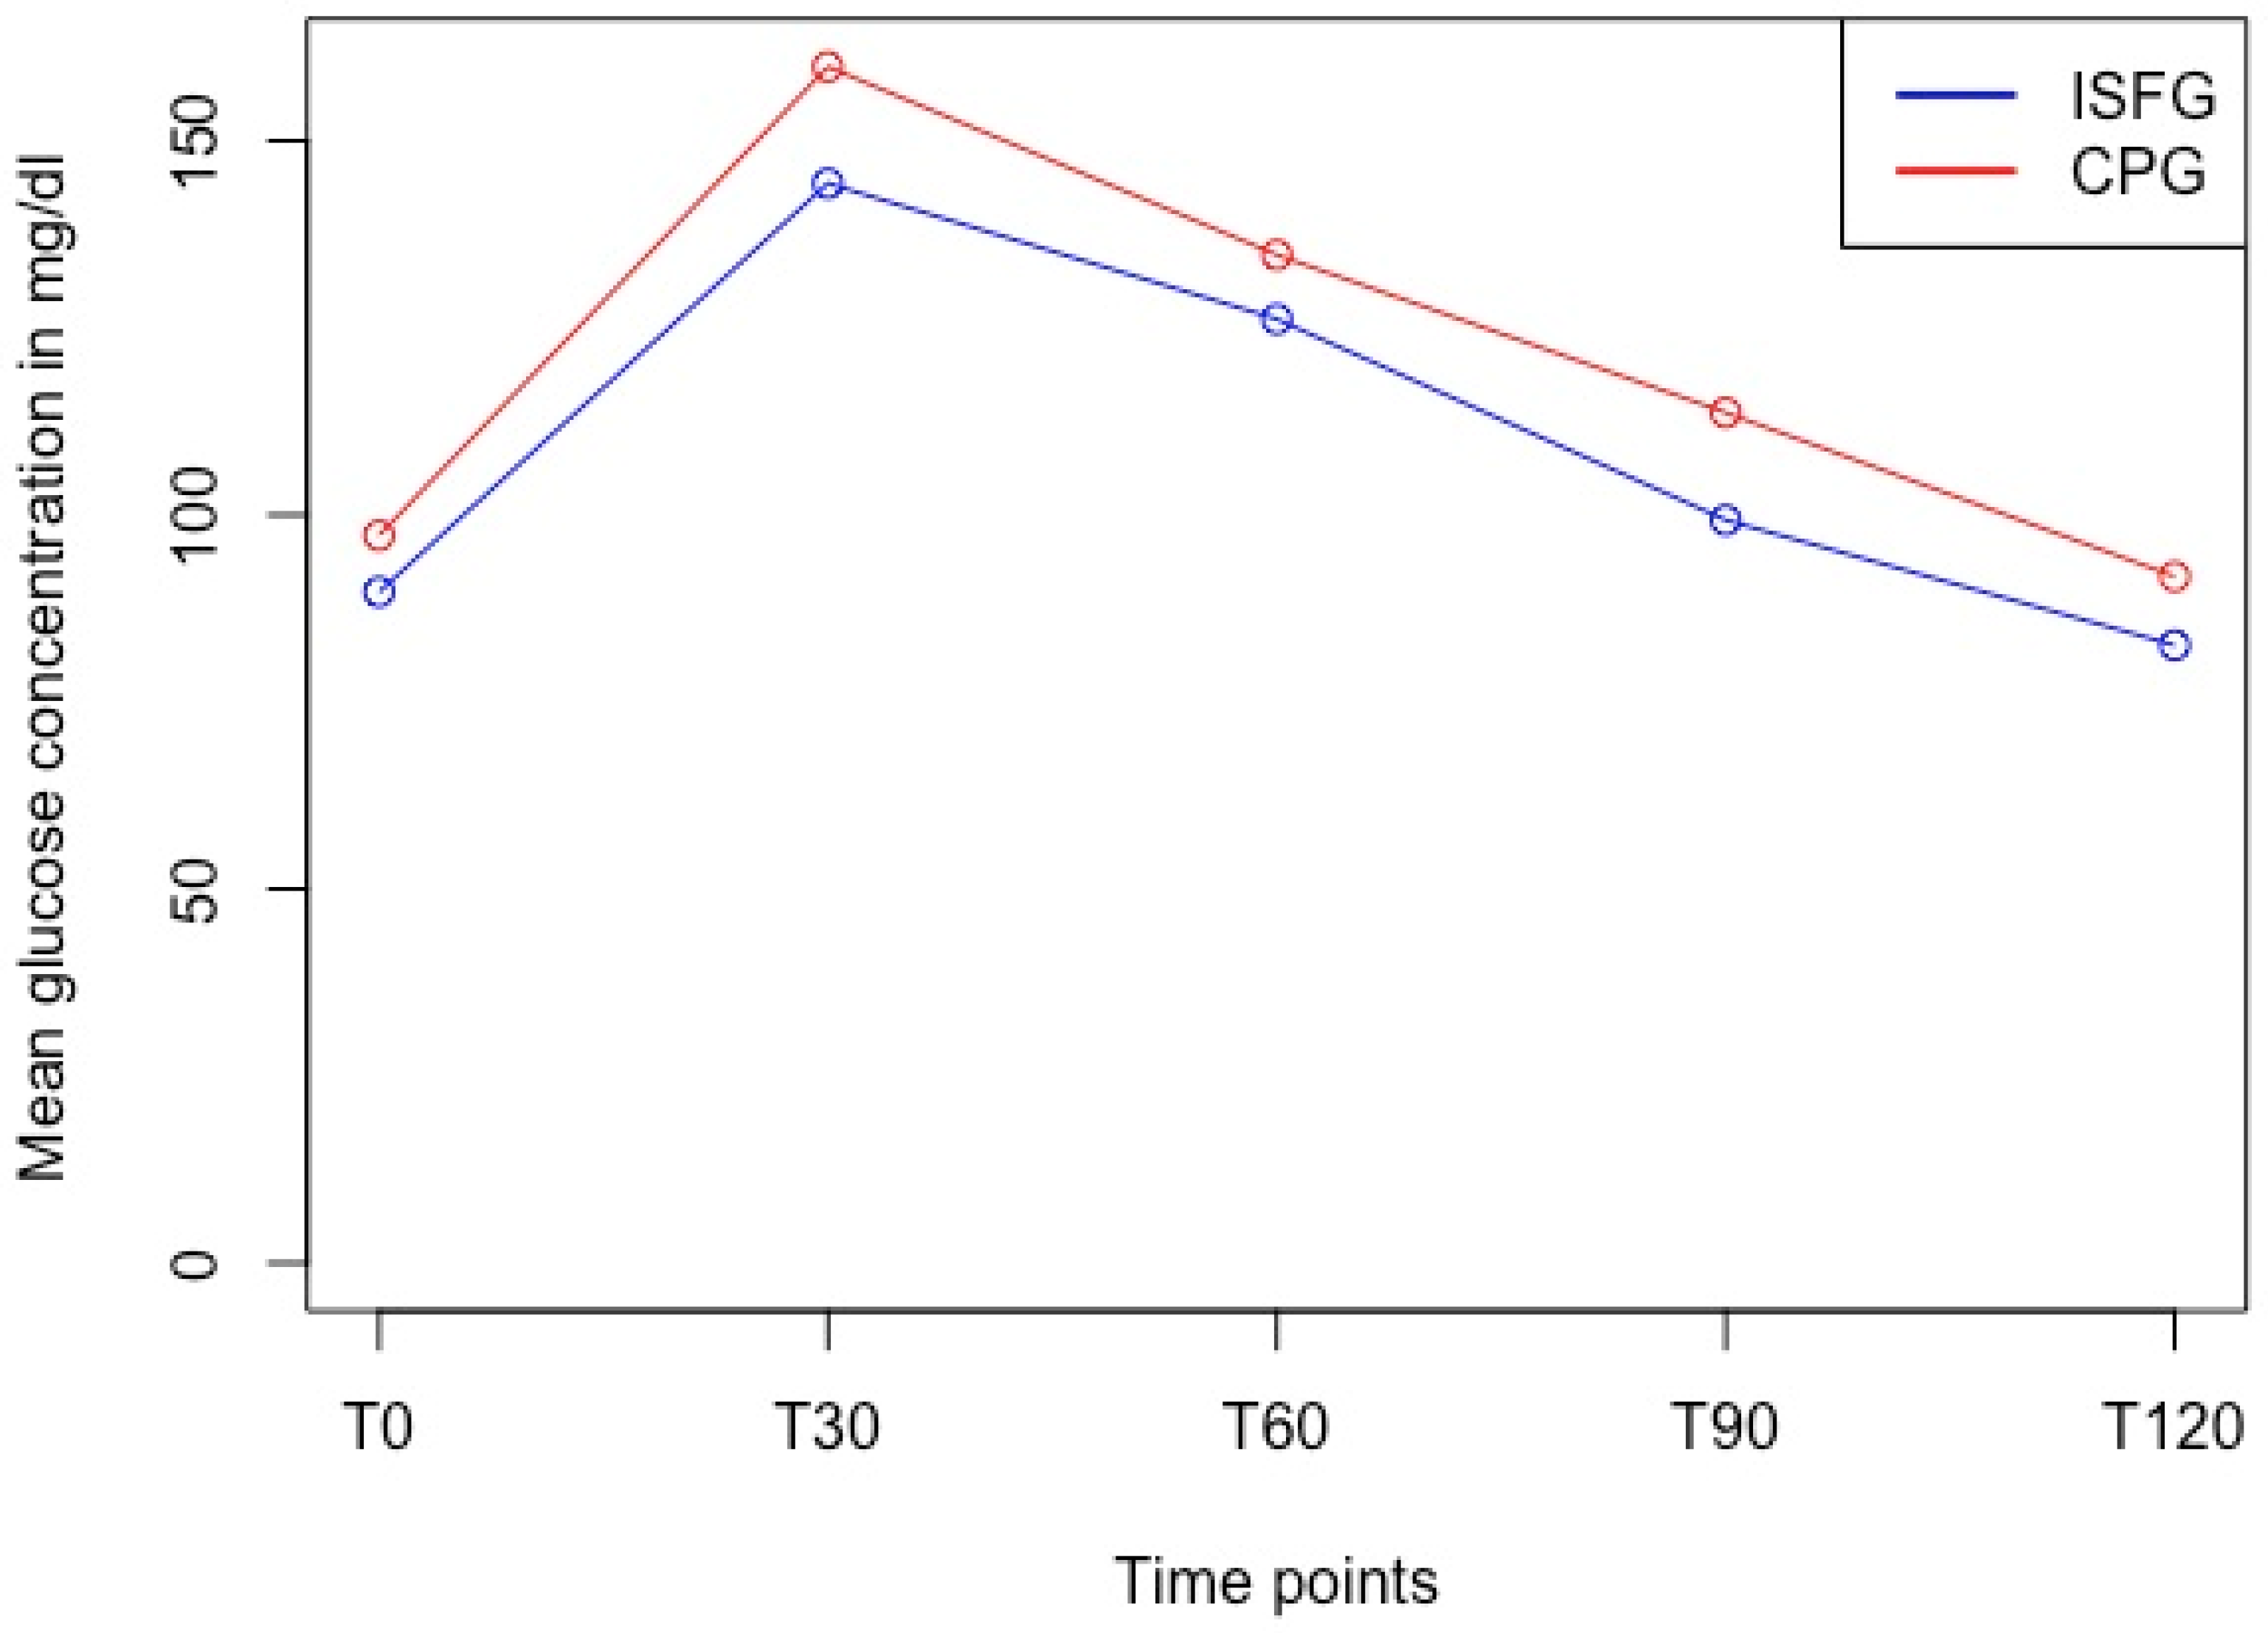
3.4. Differences between Discrete Timepoints
4. Discussion
5. Conclusions
Author Contributions
Funding
Institutional Review Board Statement
Informed Consent Statement
Data Availability Statement
Conflicts of Interest
References
- Olczuk, D.; Priefer, R. A history of continuous glucose monitors (CGMs) in self-monitoring of diabetes mellitus. Diabetes Metab. Syndr. 2018, 12, 181–187. [Google Scholar] [CrossRef]
- Freckmann, G.; Pleus, S.; Link, M.; Zschornack, E.; Klötzer, H.-M.; Haug, C. Performance Evaluation of Three Continuous Glucose Monitoring Systems: Comparison of Six Sensors per Subject in Parallel. J. Diabetes Sci. Technol. 2013, 7, 842–853. [Google Scholar] [CrossRef] [PubMed]
- Bailey, T.; Bode, B.W.; Christiansen, M.P.; Klaff, L.J.; Alva, S. The Performance and Usability of a Factory-Calibrated Flash Glucose Monitoring System. Diabetes Technol. Ther. 2015, 17, 787–794. [Google Scholar] [CrossRef] [PubMed]
- Afeef, S.; Tolfrey, K.; Zakrzewski-Fruer, J.K.; Barrett, L.A. Performance of the FreeStyle Libre Flash Glucose Monitoring System during an Oral Glucose Tolerance Test and Exercise in Healthy Adolescents. Sensors 2023, 23, 4249. [Google Scholar] [CrossRef] [PubMed]
- Bowler, A.-L.M.; Whitfield, J.; Marshall, L.; Coffey, V.G.; Burke, L.M.; Cox, G.R. The Use of Continuous Glucose Monitors in Sport: Possible Applications and Considerations. Int. J. Sport Nutr. Exerc. Metab. 2023, 33, 121–132. [Google Scholar] [CrossRef]
- Keshet, A.; Shilo, S.; Godneva, A.; Talmor-Barkan, Y.; Aviv, Y.; Segal, E.; Rossman, H. CGMap: Characterizing continuous glucose monitor data in thousands of non-diabetic individuals. Cell Metab. 2023, 35, 758–769.e3. [Google Scholar] [CrossRef]
- Skroce, K.; Zignoli, A.; Fontana, F.Y.; Maturana, F.M.; Lipman, D.; Tryfonos, A.; Riddell, M.C.; Zisser, H.C. Real World Interstitial Glucose Profiles of a Large Cohort of Physically Active Men and Women. Sensors 2024, 24, 744. [Google Scholar] [CrossRef]
- Shah, V.N.; Dubose, S.N.; Li, Z.; Beck, R.W.; Petesrs, A.L.; Weinstock, R.S.; Kruger, D.; Tansey, M.; Sparling, D.; Woerner, S.; et al. Continuous Glucose Monitoring Profiles in Healthy Nondiabetic Participants: A Multicenter Prospective Study. J. Clin. Endocrinol. Metab. 2019, 104, 4356–4364. [Google Scholar] [CrossRef]
- Holzer, R.; Bloch, W.; Brinkmann, C. Continuous Glucose Monitoring in Healthy Adults—Possible Applications in Health Care, Wellness, and Sports. Sensors 2022, 22, 2030. [Google Scholar] [CrossRef]
- Akintola, A.A.; Noordam, R.; Jansen, S.W.; de Craen, A.J.; Ballieux, B.E.; Cobbaert, C.M.; Mooijaart, S.P.; Pijl, H.; Westendorp, R.G.; van Heemst, D. Accuracy of Continuous Glucose Monitoring Measurements in Normo-Glycemic Individuals. PLoS ONE 2015, 10, e0139973. [Google Scholar] [CrossRef]
- Jin, Z.; Thackray, A.E.; King, J.A.; Deighton, K.; Davies, M.J.; Stensel, D.J. Analytical Performance of the Factory-Calibrated Flash Glucose Monitoring System FreeStyle Libre2TM in Healthy Women. Sensors 2023, 23, 7417. [Google Scholar] [CrossRef]
- Stumvoll, M.; Mitrakou, A.; Pimenta, W.; Jenssen, T.; Yki-Järvinen, H.; Van Haeften, T.; Renn, W.; Gerich, J. Use of the oral glucose tolerance test to assess insulin release and insulin sensitivity. Diabetes Care 2000, 23, 295–301. [Google Scholar] [CrossRef] [PubMed]
- ISO 15197:2013; In Vitro Diagnostic Test Systems—Requirements for Blood-Glucose Monitoring Systems for Self-Testing in Managing Diabetes Mellitus. International Organization for Standardization: Geneva, Switzerland, 2013. Available online: https://www.iso.org/standard/54976.html (accessed on 30 August 2024).
- Danne, T.; Nimri, R.; Battelino, T.; Bergenstal, R.M.; Close, K.L.; DeVries, J.H.; Garg, S.; Heinemann, L.; Hirsch, I.; Amiel, S.A.; et al. International Consensus on Use of Continuous Glucose Monitoring. Diabetes Care 2017, 40, 1631–1640. [Google Scholar] [CrossRef] [PubMed]
- Jendrike, N.; Baumstark, A.; Kamecke, U.; Haug, C.; Freckmann, G. ISO 15197: 2013 Evaluation of a Blood Glucose Monitoring System’s Measurement Accuracy. J. Diabetes Sci. Technol. 2017, 11, 1275–1276. [Google Scholar] [CrossRef]
- Altman, D.G.; Bland, J.M. Measurement in Medicine: The Analysis of Method Comparison Studies. J. R. Stat. Soc. Ser. Stat. 1983, 32, 307–317. [Google Scholar] [CrossRef]
- Freckmann, G.; Pleus, S.; Grady, M.; Setford, S.; Levy, B. Measures of Accuracy for Continuous Glucose Monitoring and Blood Glucose Monitoring Devices. J. Diabetes Sci. Technol. 2019, 13, 575–583. [Google Scholar] [CrossRef]
- Rodbard, D. Continuous glucose monitoring: A review of recent studies demonstrating improved glycemic outcomes. Diabetes Technol. Ther. 2017, 19, S25–S37. [Google Scholar] [CrossRef] [PubMed]
- Staal, O.M.; Hansen, H.M.U.; Christiansen, S.C.; Fougner, A.L.; Carlsen, S.M.; Stavdahl, Ø. Differences Between Flash Glucose Monitor and Fingerprick Measurements. Biosensors 2018, 8, 93. [Google Scholar] [CrossRef]
- Ólafsdóttir, A.F.; Attvall, S.; Sandgren, U.; Dahlqvist, S.; Pivodic, A.; Skrtic, S.; Theodorsson, E.; Lind, M. A Clinical Trial of the Accuracy and Treatment Experience of the Flash Glucose Monitor FreeStyle Libre in Adults with Type 1 Diabetes. Diabetes Technol. Ther. 2017, 19, 164–172. [Google Scholar] [CrossRef]
- Alva, S.; Bailey, T.; Brazg, R.; Budiman, E.S.; Castorino, K.; Christiansen, M.P.; Forlenza, G.; Kipnes, M.; Liljenquist, D.R.; Liu, H. Accuracy of a 14-Day Factory-Calibrated Continuous Glucose Monitoring System With Advanced Algorithm in Pediatric and Adult Population With Diabetes. J. Diabetes Sci. Technol. 2022, 16, 70–77. [Google Scholar] [CrossRef]
- Schrangl, P.; Reiterer, F.; Heinemann, L.; Freckmann, G.; Del Re, L. Limits to the Evaluation of the Accuracy of Continuous Glucose Monitoring Systems by Clinical Trials. Biosensors 2018, 8, 50. [Google Scholar] [CrossRef] [PubMed]
- Wadwa, R.P.; Laffel, L.M.; Shah, V.N.; Garg, S.K. Accuracy of a Factory-Calibrated, Real-Time Continuous Glucose Monitoring System During 10 Days of Use in Youth and Adults with Diabetes. Diabetes Technol. Ther. 2018, 20, 395–402. [Google Scholar] [CrossRef]
- Zhang, X.; Sun, F.; Wongpipit, W.; Huang, W.Y.J.; Wong, S.H.S. Accuracy of Flash Glucose Monitoring During Postprandial Rest and Different Walking Conditions in Overweight or Obese Young Adults. Front. Physiol. 2021, 12, 732751. [Google Scholar] [CrossRef]
- Sekido, K.; Sekido, T.; Kaneko, A.; Hosokawa, M.; Sato, A.; Sato, Y.; Yamazaki, M.; Komatsu, M. Careful readings for a flash glucose monitoring system in nondiabetic Japanese subjects: Individual differences and discrepancy in glucose concentrarion after glucose loading [Rapid Communication]. Endocr. J. 2017, 64, 827–832. [Google Scholar] [CrossRef]
- Wong, T.H.T.; Wan, J.M.F.; Louie, J.C.Y. Flash Glucose Monitoring Can Accurately Reflect Postprandial Glucose Changes in Healthy Adults in Nutrition Studies. J. Am. Coll. Nutr. 2021, 40, 26–32. [Google Scholar] [CrossRef]
- Tramunt, B.; Smati, S.; Grandgeorge, N.; Lenfant, F.; Arnal, J.-F.; Montagner, A.; Gourdy, P. Sex differences in metabolic regulation and diabetes susceptibility. Diabetologia 2020, 63, 453–461. [Google Scholar] [CrossRef] [PubMed]
- Mauvais-Jarvis, F. Gender differences in glucose homeostasis and diabetes. Physiol. Behav. 2018, 187, 20–23. [Google Scholar] [CrossRef]
- Moser, O.; Moser, O.; Eckstein, M.L.; Eckstein, M.L.; Mueller, A.; Mueller, A.; Birnbaumer, P.; Birnbaumer, P.; Aberer, F.; Aberer, F.; et al. Impact of physical exercise on sensor performance of the FreeStyle Libre intermittently viewed continuous glucose monitoring system in people with Type 1 diabetes: A randomized crossover trial. Diabet. Med. J. Br. Diabet. Assoc. 2019, 36, 606–611. [Google Scholar] [CrossRef] [PubMed]
- Wentholt, I.M.; Hoekstra, J.B.; DeVries, J.H. A critical appraisal of the continuous glucose-error grid analysis. Diabetes Care 2006, 29, 1805–1811. [Google Scholar] [CrossRef]
- Narang, B.J.; Atkinson, G.; Gonzalez, J.T.; Betts, J.A. A tool to explore discrete-time data: The time series response analyser. Int. J. Sport Nutr. Exerc. Metab. 2020, 30, 374–381. [Google Scholar] [CrossRef]
- Eichenlaub, M.; Stephan, P.; Waldenmaier, D.; Pleus, S.; Rothenbühler, M.; Haug, C.; Hinzmann, R.; Thomas, A.; Jendle, J.; Diem, P.; et al. Continuous Glucose Deviation Interval and Variability Analysis (CG-DIVA): A Novel Approach for the Statistical Accuracy Assessment of Continuous Glucose Monitoring Systems. J. Diabetes Sci. Technol. 2022, 18, 857–865. [Google Scholar] [CrossRef] [PubMed]


| Variable | Mean ± SD 1 | Range |
|---|---|---|
| Age (years) | 25.5 (±4.5) | 20.0–40.0 |
| Height (m) | 1.81 (±0.05) | 1.73–1.90 |
| Body mass (kg) | 84.9 (±13.4) | 64.0–122.4 |
| BMI (kg/m2) | 25.9 (±3.5) | 20.5–35.2 |
| Body fat (%) | 15.8 (±7.7) | 6.5–40.3 |
| Muscle Mass (kg) | 34.3 (±4.6) | 25.6–46.2 |
| Timepoint | CPG 1 (mg/dL) | ISFG (mg/dL) | MARD (%) | 95%-CI | p-Value | Cohen’s d |
|---|---|---|---|---|---|---|
| T0 | 97.3 ± 8.5 | 89.7 ± 12.6 | 12.5 | 10.9–14.1 | <0.001 | 0.61 |
| T30 | 159.9 ± 24.6 | 144.3 ± 29.3 | 14.2 | 12.0–16.4 | <0.001 | 0.63 |
| T60 | 134.8 ± 29.8 | 126.2 ± 31.0 | 10.9 | 9.4–12.5 | <0.001 | 0.57 |
| T90 | 113.7 ± 21.5 | 99.3 ± 20.6 | 14.6 | 12.5–16.6 | <0.001 | 1.02 |
| T120 | 91.8 ± 21.2 | 82.6 ± 18.4 | 12.3 | 10.9–13.8 | <0.001 | 0.92 |
Disclaimer/Publisher’s Note: The statements, opinions and data contained in all publications are solely those of the individual author(s) and contributor(s) and not of MDPI and/or the editor(s). MDPI and/or the editor(s) disclaim responsibility for any injury to people or property resulting from any ideas, methods, instructions or products referred to in the content. |
© 2024 by the authors. Licensee MDPI, Basel, Switzerland. This article is an open access article distributed under the terms and conditions of the Creative Commons Attribution (CC BY) license (https://creativecommons.org/licenses/by/4.0/).
Share and Cite
Fellinger, E.; Brandt, T.; Creutzburg, J.; Rommerskirchen, T.; Schmidt, A. Analytical Performance of the FreeStyle Libre 2 Glucose Sensor in Healthy Male Adults. Sensors 2024, 24, 5769. https://doi.org/10.3390/s24175769
Fellinger E, Brandt T, Creutzburg J, Rommerskirchen T, Schmidt A. Analytical Performance of the FreeStyle Libre 2 Glucose Sensor in Healthy Male Adults. Sensors. 2024; 24(17):5769. https://doi.org/10.3390/s24175769
Chicago/Turabian StyleFellinger, Eva, Tom Brandt, Justin Creutzburg, Tessa Rommerskirchen, and Annette Schmidt. 2024. "Analytical Performance of the FreeStyle Libre 2 Glucose Sensor in Healthy Male Adults" Sensors 24, no. 17: 5769. https://doi.org/10.3390/s24175769