
High-Sensitivity and In Situ Multi-Component Detection of Gases Based on Multiple-Reflection-Cavity-Enhanced Raman Spectroscopy

Abstract
:
1. Introduction
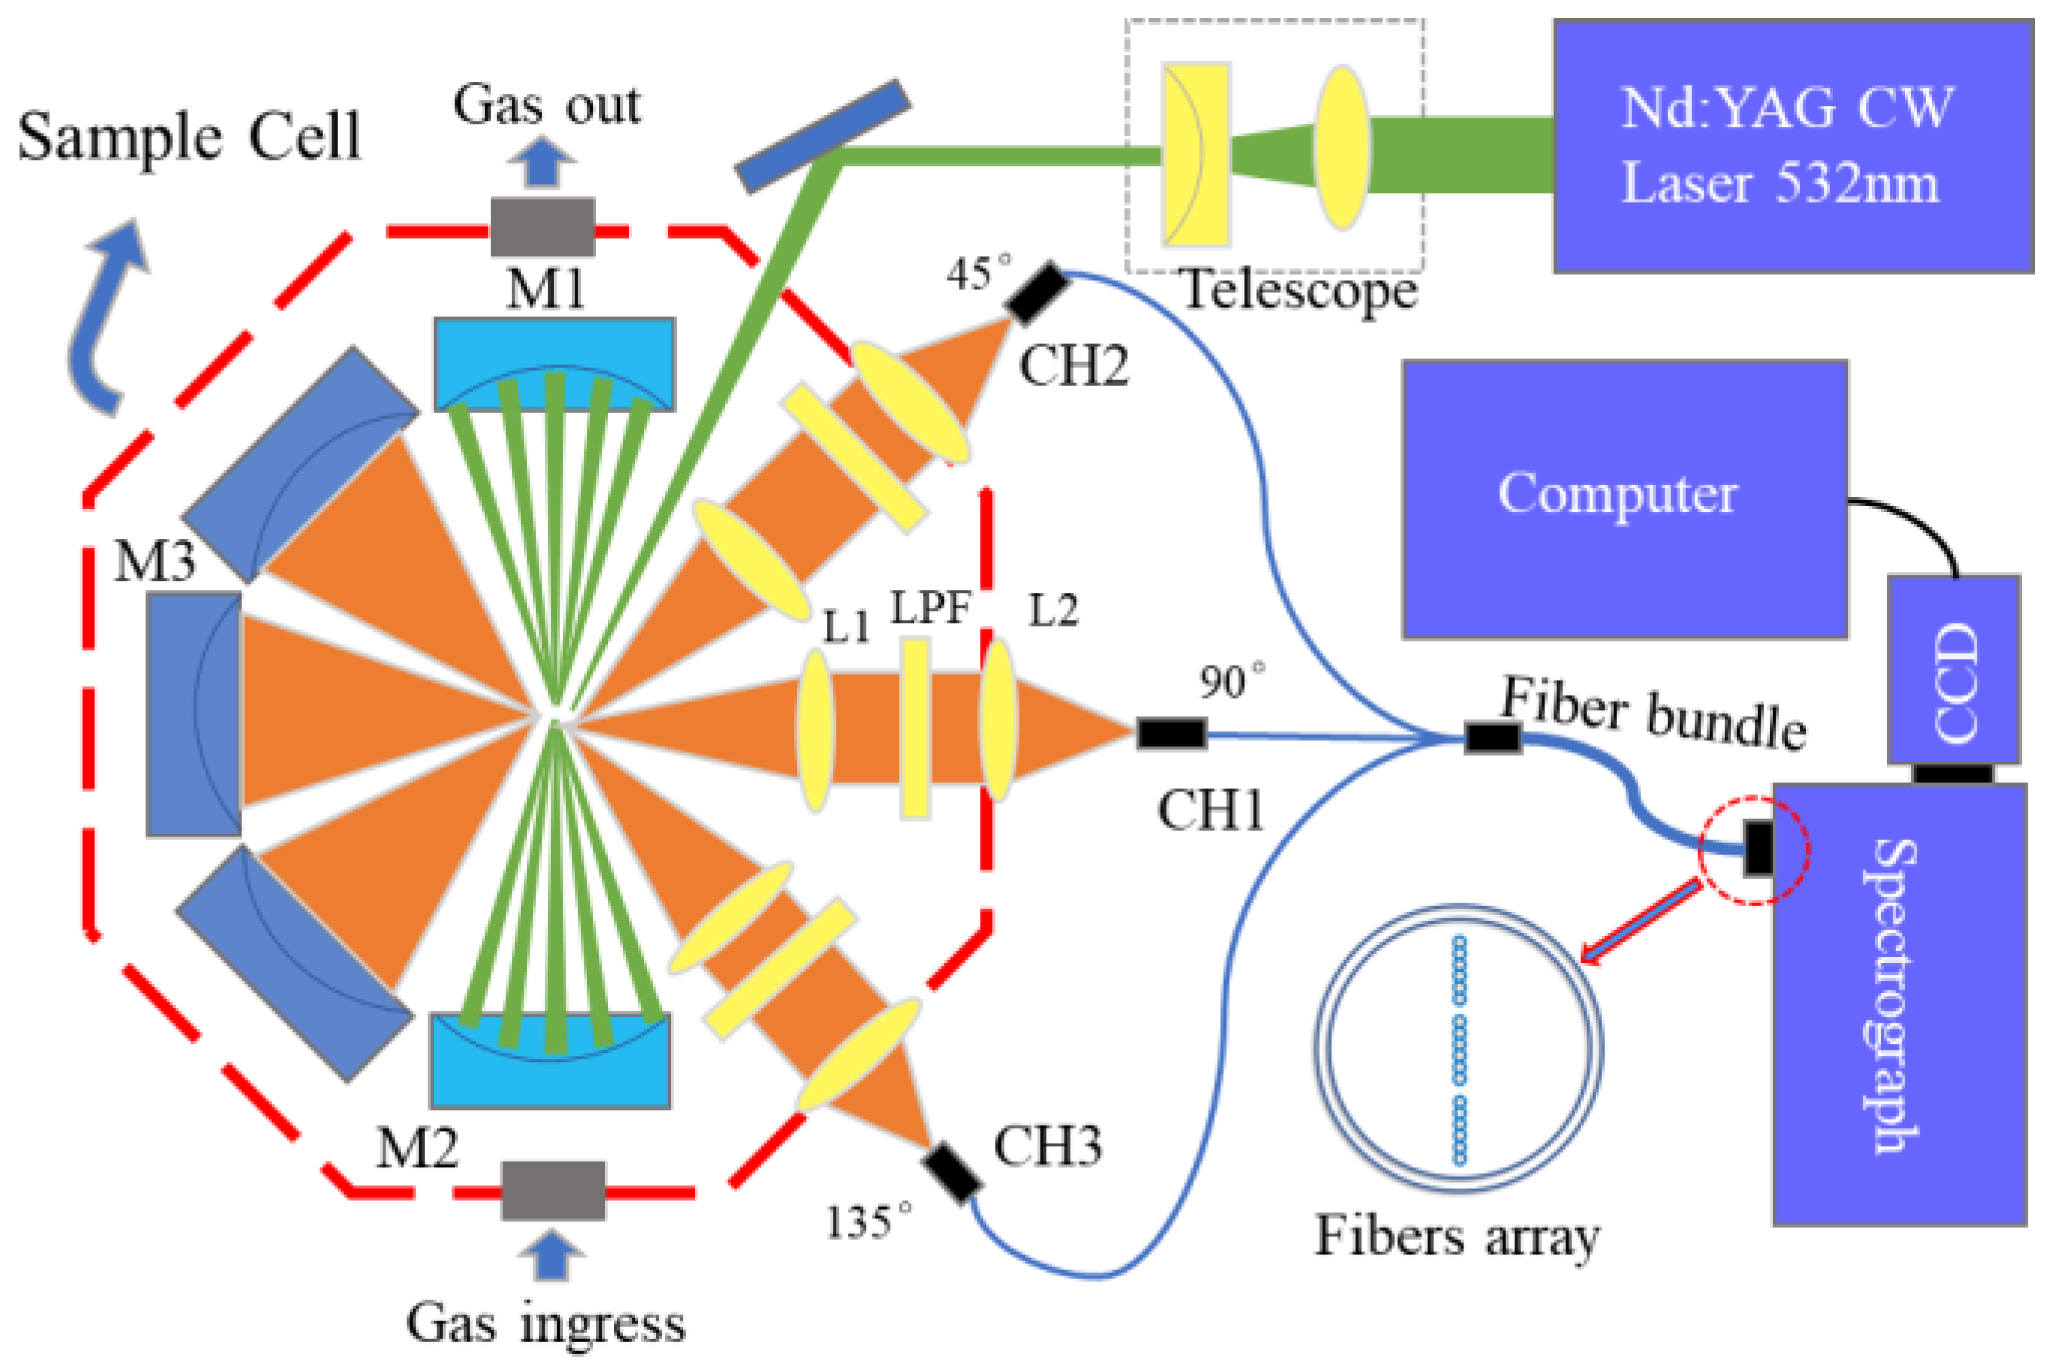
2. Experiment Setup
2.1. Cavity-Enhanced Raman Spectroscopy Principle
2.2. Parameter Design of Raman Spectroscopy System
2.3. Sample Preparation and Spectra Acquisition
3. Results
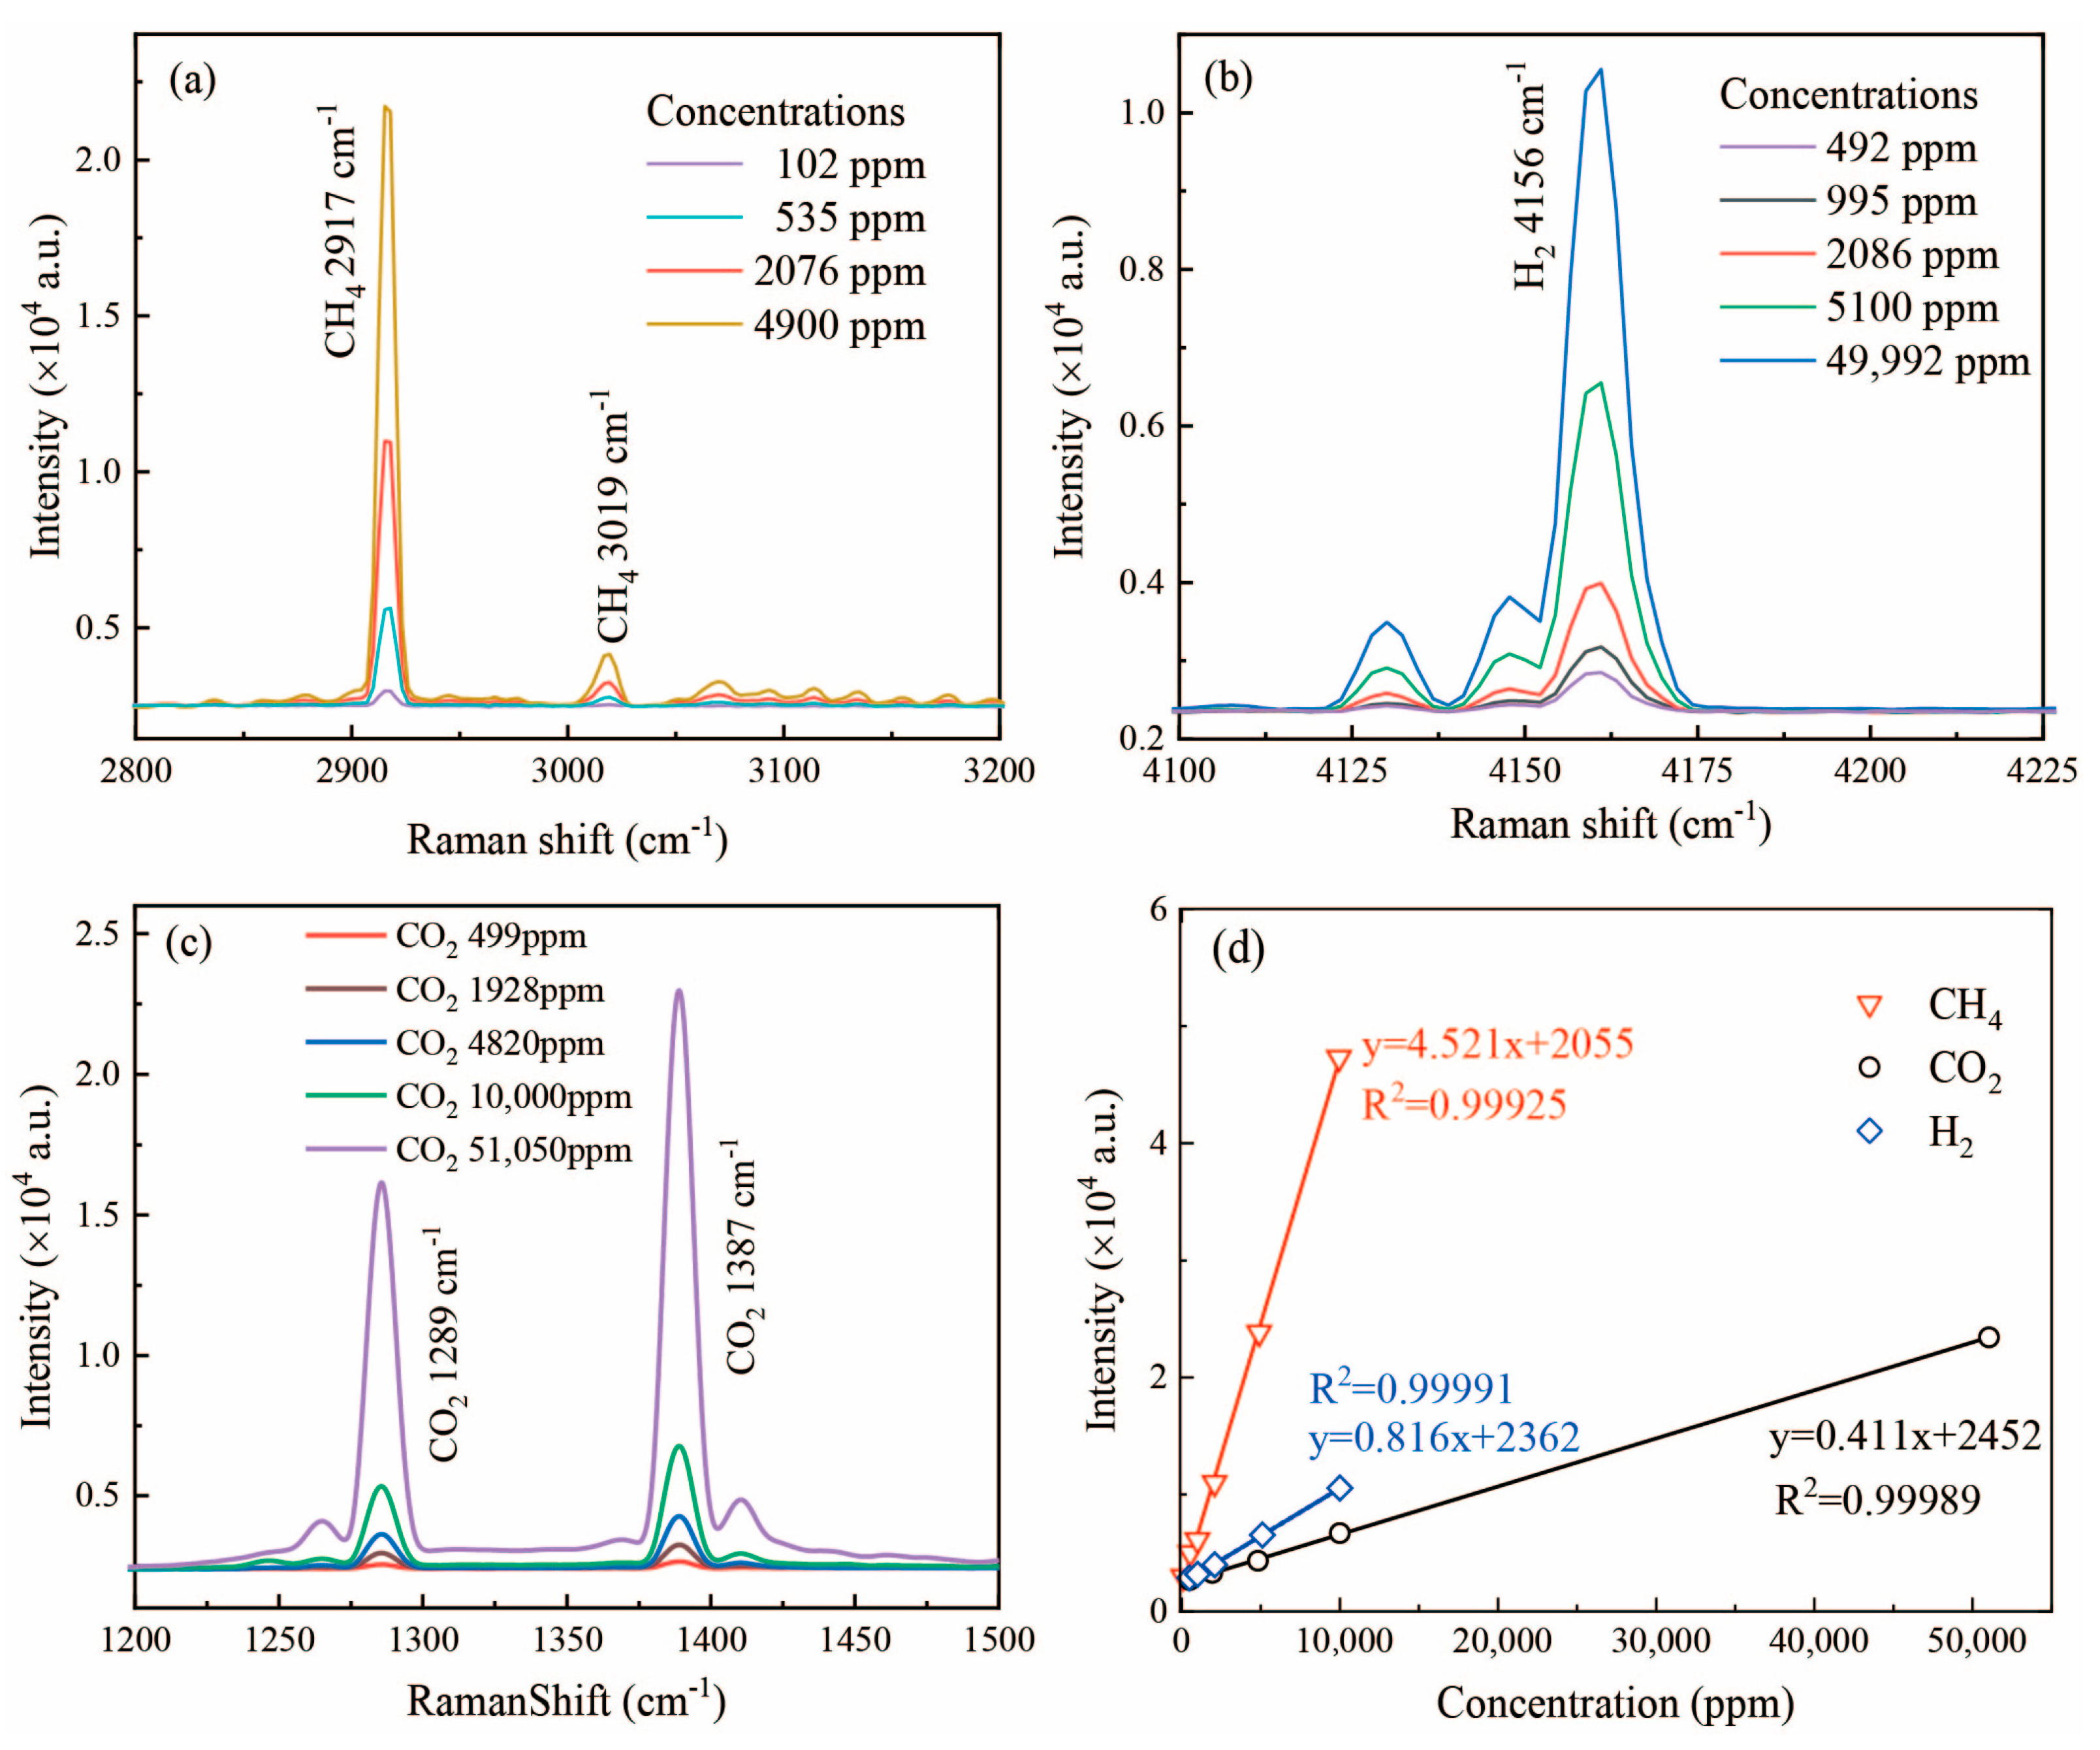
3.1. Original Raman Spectra of Different Gases
3.2. Raman Spectra of Gas Samples under Different Concentrations
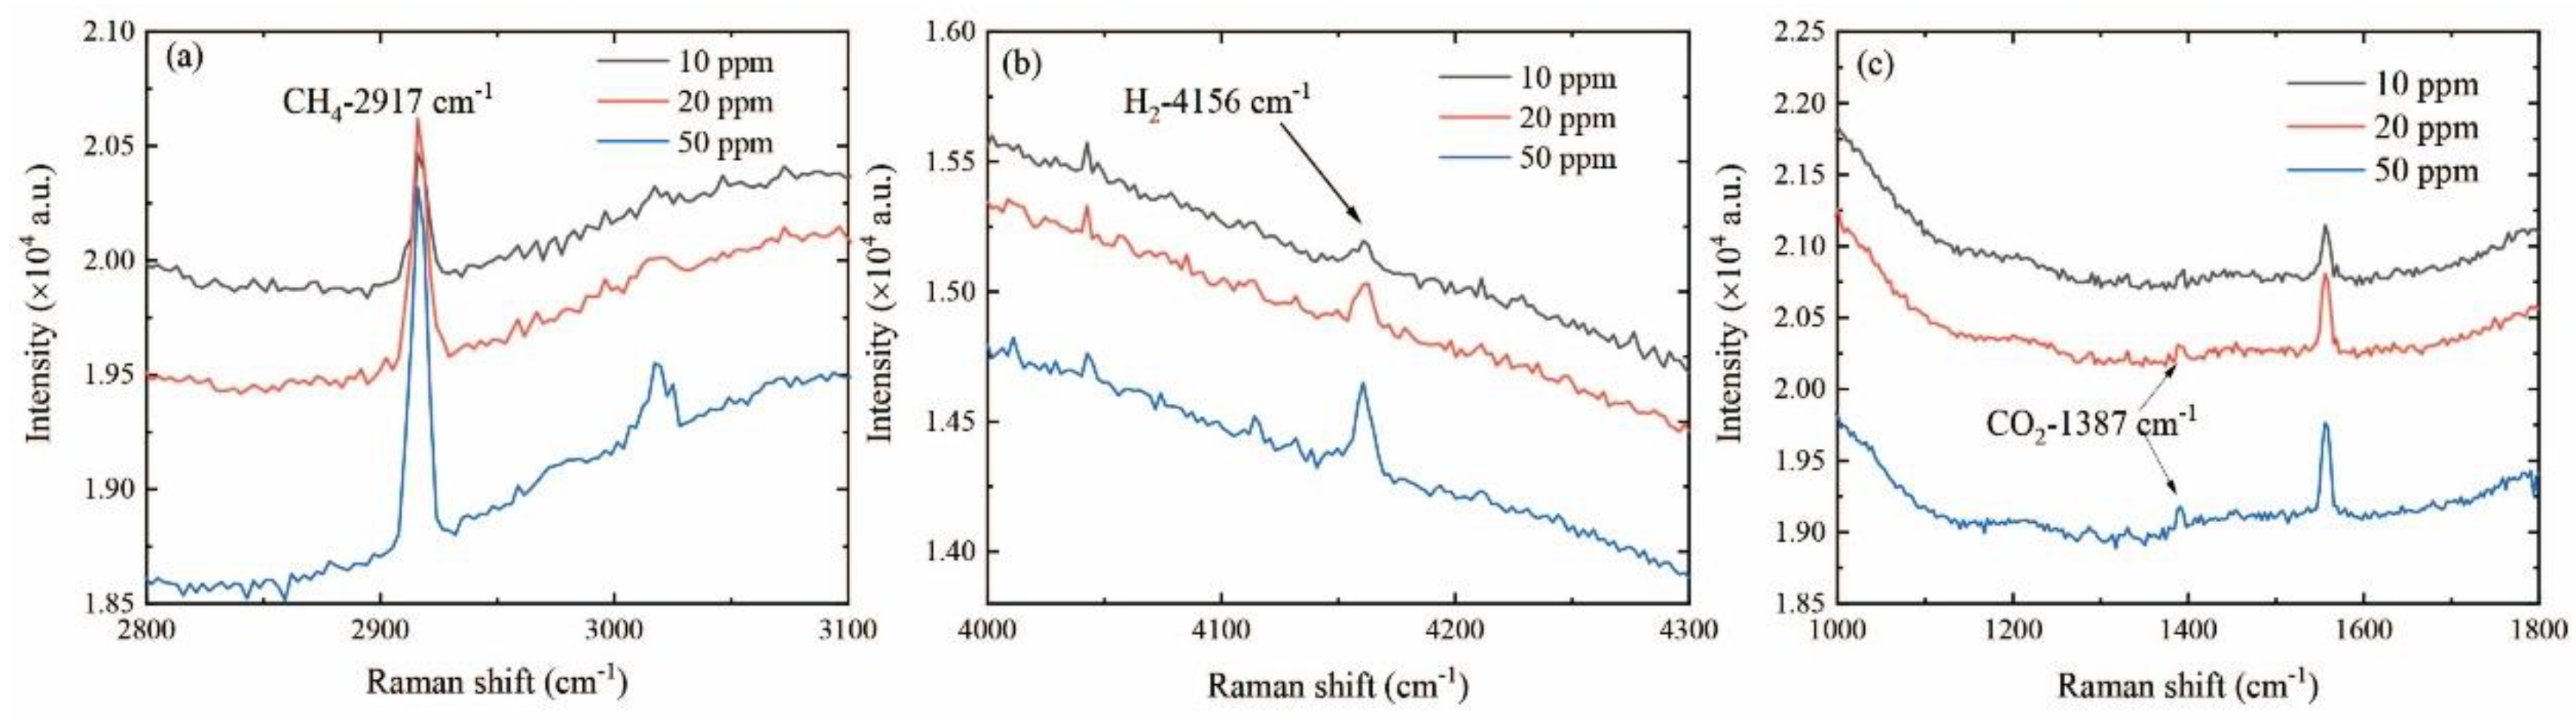
3.3. Limit of Detection of the Raman System
3.4. Long-Time Integration Detection of the Raman System
4. Conclusions
Author Contributions
Funding
Institutional Review Board Statement
Informed Consent Statement
Data Availability Statement
Acknowledgments
Conflicts of Interest
References
- Wang, J.Y.; Shan, Y.L.; Cui, C.; Zhao, C.Y.; Meng, J.; Wang, S.J. Investigating the fast energy-related carbon emissions growth in African countries and its drivers. Appl. Energy 2024, 357, 122494. [Google Scholar] [CrossRef]
- Wang, J.X.; Chen, W.G.; Wang, P.Y.; Wan, F.; Zhang, Z.X.; Gao, S.F.; Wang, Y.Y. Analysis of SF6 decomposed products by fibre-enhanced Raman spectroscopy for gas-insulated switchgear diagnosis. High Volt. 2024, 9, 206–216. [Google Scholar] [CrossRef]
- Erland, B.M.; Thorpe, A.K.; Gamon, J.A. Recent Advances Toward Transparent Methane Emissions Monitoring: A Review. Environ. Sci. Technol. 2022, 56, 16567–16581. [Google Scholar] [CrossRef]
- Han, X.; Huang, Z.X.; Chen, X.D.; Li, Q.F.; Xu, K.X.; Chen, D. On-line multi-component analysis of gases for mud logging industry using data driven Raman spectroscopy. Fuel 2017, 207, 146–153. [Google Scholar] [CrossRef]
- Banga, I.; Paul, A.; Poudyal, D.C.; Muthukumar, S.; Prasad, S. Recent Advances in Gas Detection Methodologies with a Special Focus on Environmental Sensing and Health Monitoring Applications—A Critical Review. ACS Sens. 2023, 8, 3307–3319. [Google Scholar] [CrossRef]
- Hardy, L. Modeling nitrogen species as a source of titratable alkalinity and dissolved gas pressure in water. Appl. Geochem. 2018, 98, 301–309. [Google Scholar] [CrossRef]
- Khan, M.A.H.; Rao, M.V.; Li, Q. Recent advances in electrochemical sensors for detecting toxic gases: NO2, SO2 and H2S. Sensors 2019, 19, 905. [Google Scholar] [CrossRef] [PubMed]
- Yu, L.; Li, S.Y.; Liu, B.; Liu, S.; Sheng, J.J.; Ao, Y.Y. Determination of hydrogen gas by 1,4-bis(phenylethynyl)benzene hydrogenation coupled with gas chromatography-mass spectrometry. Talanta 2024, 266, 125071. [Google Scholar] [CrossRef] [PubMed]
- Johnsen, L.G.; Skou, P.B.; Khakimov, B.; Bro, R. Gas chromatography-mass spectrometry data processing made easy. J. Chromatogr. A 2017, 1503, 57–64. [Google Scholar] [CrossRef]
- Jung, J.K.; Kim, I.G.; Chung, K.S.; Baek, U.B. Gas chromatography techniques to evaluate the hydrogen permeation characteristics in rubber: Ethylene propylene diene monomer. Sci. Rep. 2021, 11, 4859. [Google Scholar] [CrossRef]
- Hu, Q.T.; Solomon, P.; Osterlund, L.; Zhang, Z. Nanotransistor-based gas sensing with record-high sensitivity enabled by electron trapping effect in nanoparticles. Nat. Commun. 2024, 15, 5259. [Google Scholar] [CrossRef]
- Zhang, B.H.; Tekle, H.; O’Malley, R.J.; Smith, J.D.; Gerald, R.E.; Huang, J. In situ high-temperature Raman spectroscopy via a remote fiber-optic Raman probe. IEEE Trans. Instrum. Meas. 2023, 72, 6002008. [Google Scholar] [CrossRef]
- Yang, D.W.; Liu, Q.S.; Guo, J.J.; Wu, L.L.; Kong, A.D. Cavity enhanced multi-channels gases Raman spectrometer. Sensors 2021, 21, 3803. [Google Scholar] [CrossRef] [PubMed]
- Zhang, B.H.; Rahman, M.A.; Liu, J.L.; Huang, J.; Yang, Q.B. Real-time detection and analysis of foodborne pathogens via machine learning based fiber-optic Raman sensor. Measurement 2023, 217, 113121. [Google Scholar] [CrossRef]
- Guo, J.J.; Wang, Y.M.; Luo, Z.; Zhang, F.; Yang, D.W. Real-time analysis of multicomponent dissolved inorganic carbon in the air-sea exchanging process using gas-liquid Raman spectroscopy. J. Environ. Chem. Eng. 2021, 9, 105785. [Google Scholar] [CrossRef]
- Guo, J.J.; Luo, Z.; Liu, Q.S.; Yang, D.W.; Dong, H.; Huang, S.K.; Kong, A.D.; Wu, L.L. High-sensitivity Raman gas probe for in situ multi-component gas detection. Sensors 2021, 21, 3539. [Google Scholar] [CrossRef]
- Sepman, A.; Ögren, Y.; Qu, Z.C.; Wiinikka, H.; Schmidt, F.M. Real-time in situ multi-parameter TDLAS sensing in the reactor core of an entrained-flow biomass gasifier. Proc. Combust. Inst. 2017, 36, 4541–4548. [Google Scholar] [CrossRef]
- Wang, P.; Chen, W.; Wan, F.; Wang, J.X.; Hu, J. A review of cavity-enhanced Raman spectroscopy as a gas sensing method. Appl. Spectrosc. Rev. 2020, 55, 393–417. [Google Scholar] [CrossRef]
- Elger, A.K.; Hess, C. Application of Raman spectroscopy to working gas sensors: From in situ to operando studies. Sensors 2019, 19, 5075. [Google Scholar] [CrossRef]
- Niklas, C.; Wackerbarth, H.; Ctistis, G. A short review of cavity-enhanced Raman spectroscopy for gas analysis. Sensors 2021, 21, 1698. [Google Scholar] [CrossRef]
- Cai, Y.Y.; Xu, G.R.; Yang, D.W.; Tian, H.Y.; Zhou, F.J.; Guo, J.J. On-line multi-gas component measurement in the mud logging process based on Raman spectroscopy combined with a CNN-LSTM-AM hybrid model. Anal. Chim. Acta. 2023, 1259, 341200. [Google Scholar] [CrossRef]
- Nie, Q.L.; Liu, Z.X.; Cheng, M.E.; Pei, S.L.; Yang, D.X.; Guo, D.L.; Yang, M.H. Review on hollow-core fiber based multi-gas sensing using Raman spectroscopy. Photonic Sens. 2024, 14, 240412. [Google Scholar] [CrossRef]
- Wen, C.; Huang, X.; Shen, C. Multiple-pass enhanced Raman spectroscopy for fast industrial trace gas detection and process control. J. Raman Spectrosc. 2020, 51, 781–787. [Google Scholar] [CrossRef]
- Gautam, R.; Samuel, A.; Sil, S.; Chaturvedi, D.; Dutta, A.; Ariese, F.; Umapathy, S. Raman and mid-infrared spectroscopic imaging: Applications and advancements. Curr. Sci. 2015, 108, 341–356. [Google Scholar]
- Sardari, B.; Özcan, M. Concentric toroids as a wideband and efficient substrate for surface-enhanced Raman spectroscopy applications. Spectrosc. Lett. 2017, 50, 591–594. [Google Scholar] [CrossRef]
- Li, X.; Xia, Y.; Zhan, L.; Huang, J. Near-confocal cavity-enhanced Raman spectroscopy for multitrace-gas detection. Opt. Lett. 2008, 33, 2143–2145. [Google Scholar] [CrossRef] [PubMed]
- Utsav, K.C.; Varghese, P.L. Accurate temperature measurements in flames with high spatial resolution using Stokes Raman scattering from nitrogen in a multiple-pass cell. Appl. Opt. 2013, 52, 5007–5021. [Google Scholar] [CrossRef] [PubMed]
- Yang, D.; Guo, J.; Liu, Q.; Luo, Z.; Yan, J.; Zheng, R. Highly sensitive Raman system for dissolved gas analysis in water. Appl. Opt. 2016, 55, 7744–7748. [Google Scholar] [CrossRef]
- Velez, J.G.; Muller, A. Trace gas sensing using diode-pumped collinearly detected spontaneous Raman scattering enhanced by a multipass cell. Opt. Lett. 2019, 45, 133–136. [Google Scholar] [CrossRef]
- Cui, Y.L.; Tian, X.; Rao, B.Y.; Huang, W.; Li, H.; Pei, W.X.; Wang, M.; Chen, Z.L.; Wang, Z.F. Stimulated Raman scattering of H2 in hollow-core photonics crystal fibers pumped by high-power narrow-linewidth fiber oscillators. Opt. Express 2023, 31, 8441–8452. [Google Scholar] [CrossRef]
- Knebl, A.; Yan, D.; Popp, J.; Frosch, T. Fiber enhanced Raman gas spectroscopy. TrAc Trend. Anal. Chem. 2018, 103, 230–238. [Google Scholar] [CrossRef]
- Wang, P.Y.; Chen, W.G.; Wang, J.X.; Tang, J.; Shi, Y.L.; Wan, F. Multigas analysis by cavity-enhanced Raman spectroscopy for power transformer diagnosis. Anal. Chem. 2020, 92, 5969–5977. [Google Scholar] [CrossRef] [PubMed]
- Petrov, D.; Matrosov, I. Natural gas analysis using polarized Raman spectroscopy. Anal. Chem. 2023, 95, 9409–9414. [Google Scholar] [CrossRef]
- Wang, Y.M.; Zhao, Z.S.; Qin, J.Y.; Liu, H.; Liu, A.F.; Xu, M.M. Rapid in situ analysis of L-histidine and α-lactose in dietary supplements by fingerprint peaks using terahertz frequency-domain spectroscopy. Talanta 2020, 208, 120469. [Google Scholar] [CrossRef] [PubMed]
- Petrov, D.V.; Matrosov, L.L.; Zaripov, A.R.; Maznoy, A.S. Effects of pressure and composition on Raman spectra of CO-H2-CO2-CH4 mixtures. Spectrochim. Acta A. 2019, 215, 363–370. [Google Scholar] [CrossRef]
- Gu, Y.; Zhou, Y.; Tang, H.; Rothe, E.W.; Reck, G.P. Pressure dependence of vibrational Raman scattering of narrow-band, 248-nm, laser light by H2, N2, O2, CO2, CH4, C2H6, and C3H8 as high as 97 bar. Appl. Phys. B 2000, 71, 865–871. [Google Scholar] [CrossRef]


| Components | Concentrations (ppm) | ||||||||
| samples | 1 | 2 | 3 | 4 | 5 | 6 | 7 | 8 | 9 |
| N2 | balance gas | balance gas | balance gas | balance gas | 5150 | 10,200 | balance gas | balance gas | balance gas |
| H2 | 994.9 | 2086 | 9999 | 19,635 | 2010 | 5100 | 492 | 5030 | 50,000 |
| CH4 | 535.3 | 2076 | 49,992 | 99,662 | 1970 | 4900 | 102 | 998 | 9950 |
| CO2 | 1027.8 | 1928 | 51,050 | 99,662 | 1970 | 4820 | 499 | 1510 | 10,000 |
| O2 | 0 | 0 | 0 | 0 | 0 | 0 | 0 | 0 | 0 |
| Ar | 0 | 0 | 0 | 0 | balance gas | balance gas | 0 | 0 | 0 |
| Components | Concentrations (ppm) | ||||||||
| samples | 10 | 11 | 12 | 13 | 14 | 15 | 16 | 17 | 18 |
| N2 | balance gas | 50,100 | 105 | 301,000 | 0 | 0 | 0 | 0 | 0 |
| H2 | 0 | 0 | 0 | 0 | 106 | 0 | 0 | 0 | 0 |
| CH4 | 0 | 0 | 0 | 0 | 0 | 106 | 0 | 0 | 0 |
| CO2 | 0 | balance gas | balance gas | balance gas | 0 | 0 | 106 | 0 | 0 |
| O2 | 149,708 | 2000 | 10,000 | 50,100 | 0 | 0 | 0 | 106 | 0 |
| Ar | 0 | 0 | 0 | 0 | 0 | 0 | 0 | 0 | 106 |
| Sample | Characteristic Peak (cm−1) | Scattering Cross-Section | LOD (ppm) |
|---|---|---|---|
| CH4 | 2917 | 6.0 | 3.14 |
| CO2 | 1387 | 1.1 | 34.79 |
| H2 | 4156 | 2.0 | 17.90 |
| N2 | 2331 | 1.0 | 26.96 |
| O2 | 1555 | 1.0 | 35.17 |
Disclaimer/Publisher’s Note: The statements, opinions and data contained in all publications are solely those of the individual author(s) and contributor(s) and not of MDPI and/or the editor(s). MDPI and/or the editor(s) disclaim responsibility for any injury to people or property resulting from any ideas, methods, instructions or products referred to in the content. |
© 2024 by the authors. Licensee MDPI, Basel, Switzerland. This article is an open access article distributed under the terms and conditions of the Creative Commons Attribution (CC BY) license (https://creativecommons.org/licenses/by/4.0/).
Share and Cite
Yang, D.; Li, W.; Tian, H.; Chen, Z.; Ji, Y.; Dong, H.; Wang, Y. High-Sensitivity and In Situ Multi-Component Detection of Gases Based on Multiple-Reflection-Cavity-Enhanced Raman Spectroscopy. Sensors 2024, 24, 5825. https://doi.org/10.3390/s24175825
Yang D, Li W, Tian H, Chen Z, Ji Y, Dong H, Wang Y. High-Sensitivity and In Situ Multi-Component Detection of Gases Based on Multiple-Reflection-Cavity-Enhanced Raman Spectroscopy. Sensors. 2024; 24(17):5825. https://doi.org/10.3390/s24175825
Chicago/Turabian StyleYang, Dewang, Wenhua Li, Haoyue Tian, Zhigao Chen, Yuhang Ji, Hui Dong, and Yongmei Wang. 2024. "High-Sensitivity and In Situ Multi-Component Detection of Gases Based on Multiple-Reflection-Cavity-Enhanced Raman Spectroscopy" Sensors 24, no. 17: 5825. https://doi.org/10.3390/s24175825