


Preservation and Protection of Cultural Heritage: Vibration Monitoring and Seismic Vulnerability of the Ruins of Carmo Convent (Lisbon)

 ,
,  , , ,
, , ,
Abstract
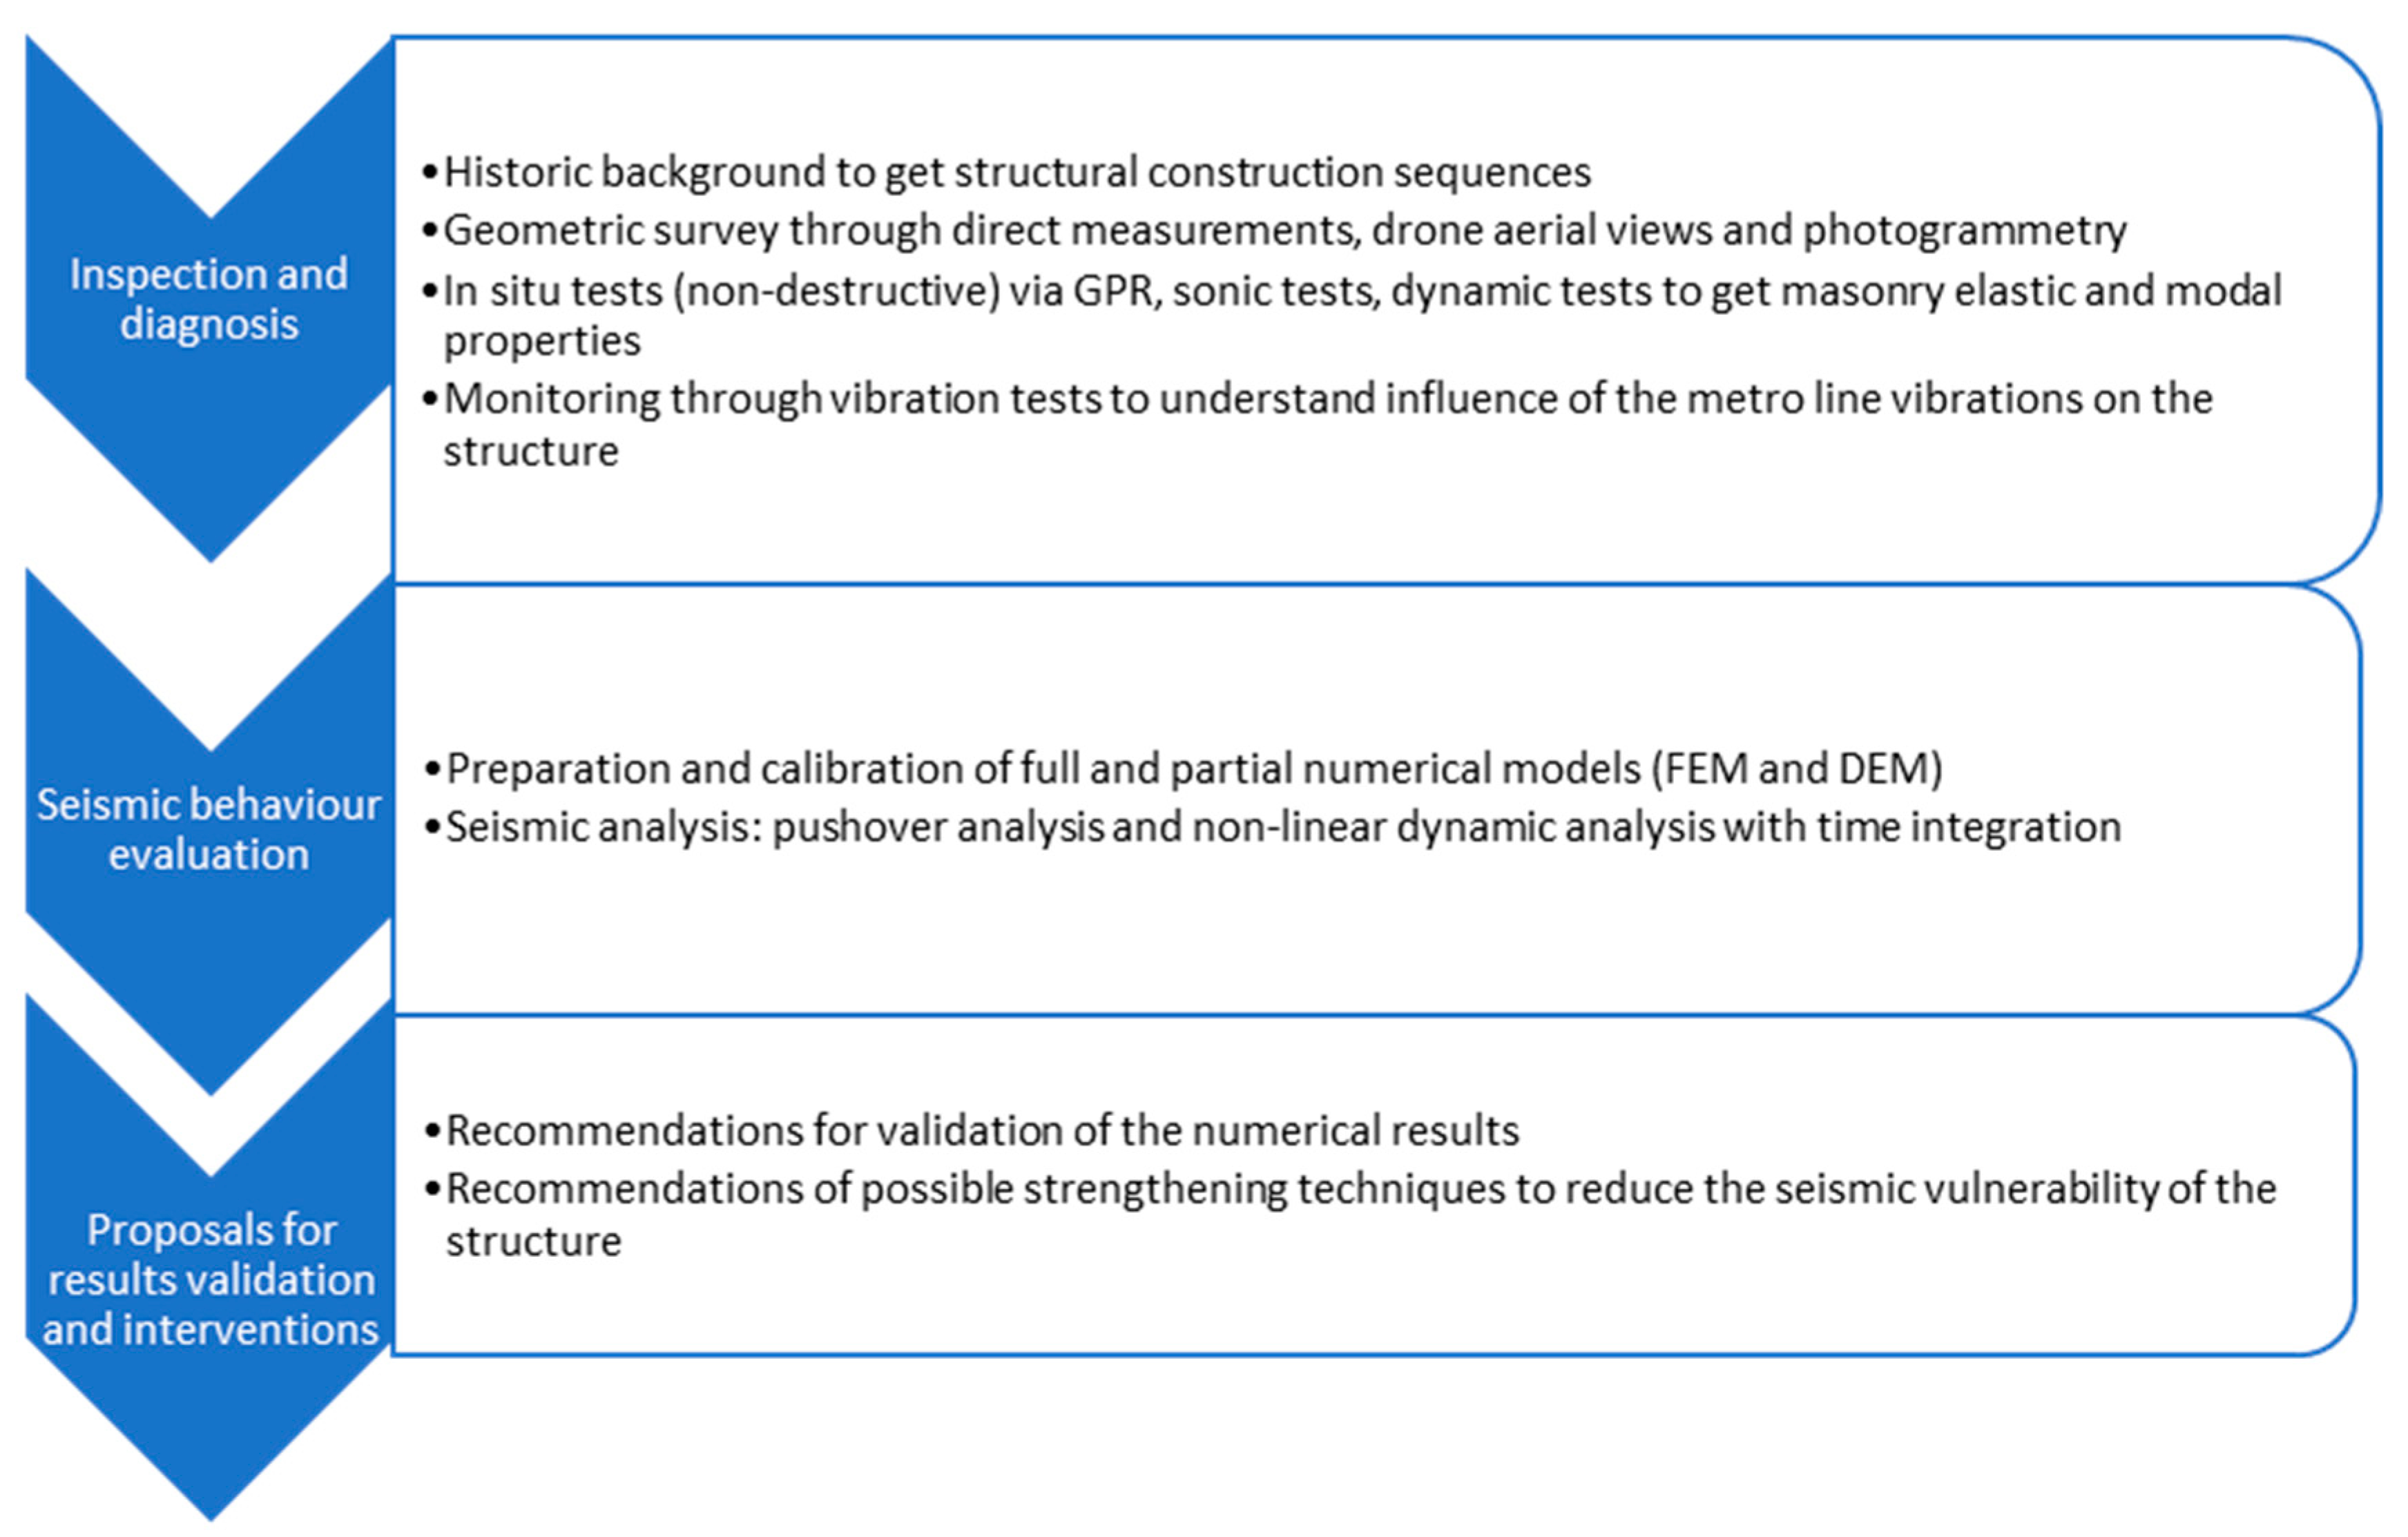
1. Introduction
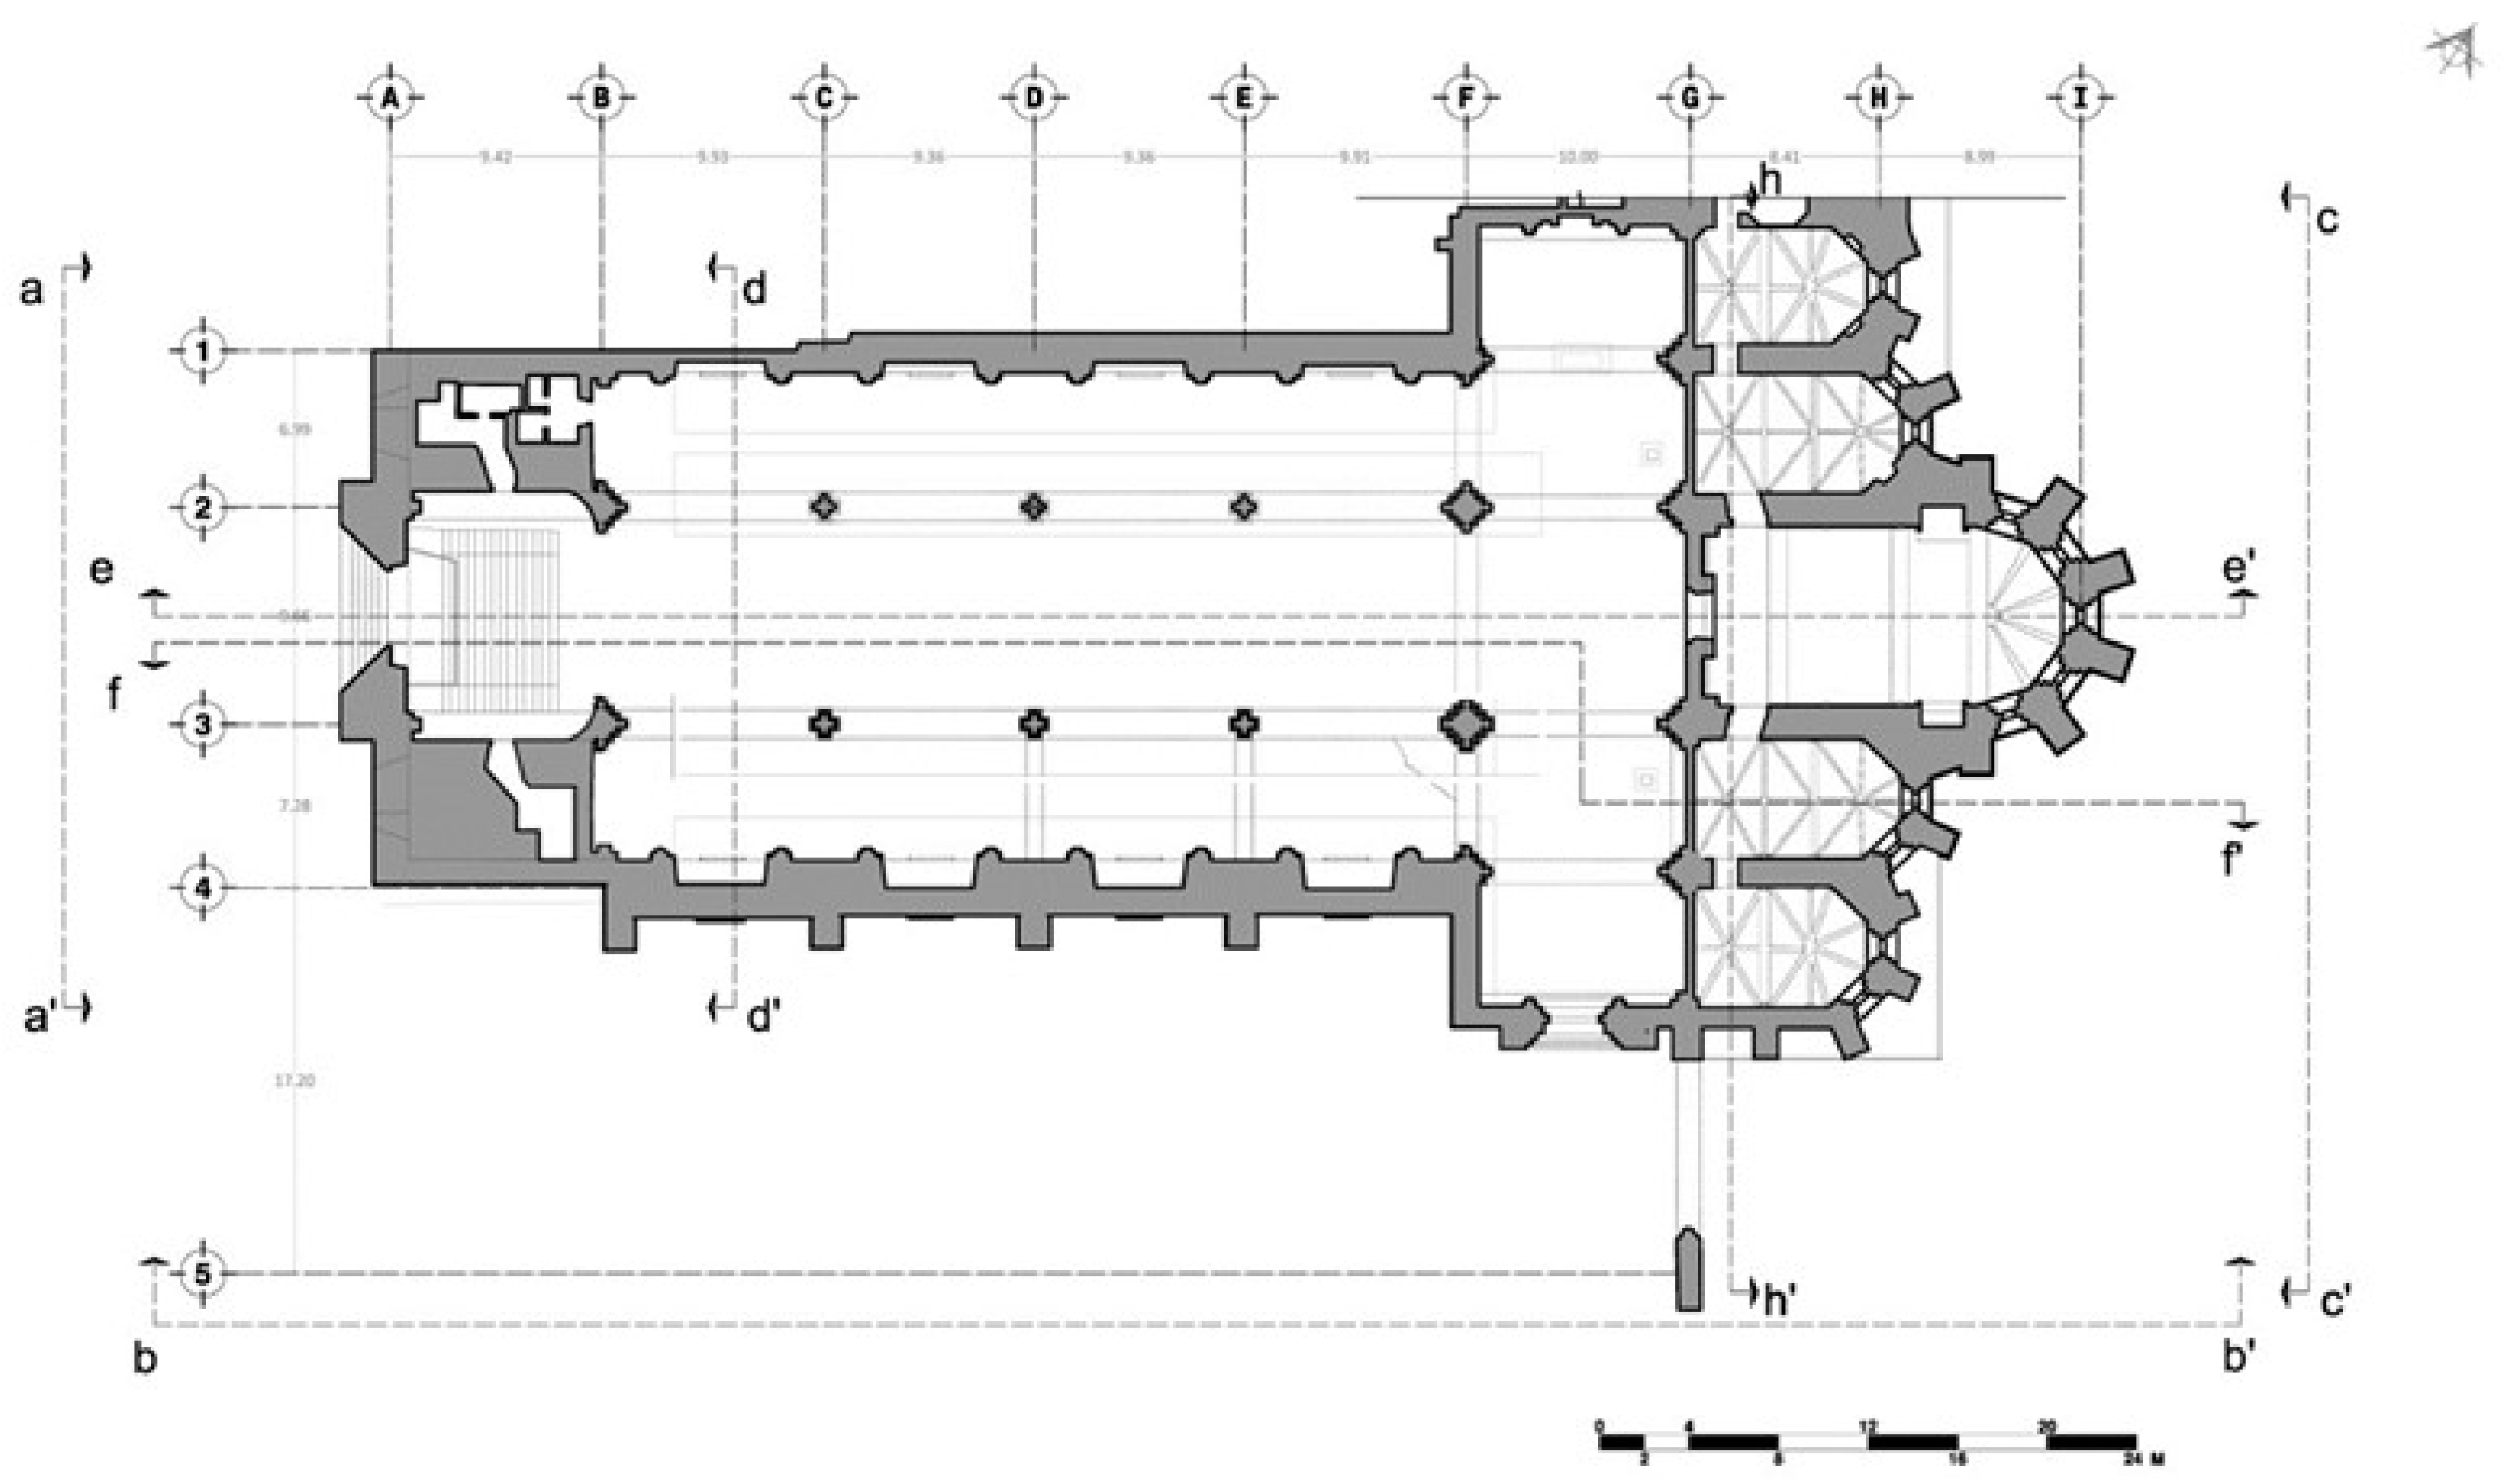
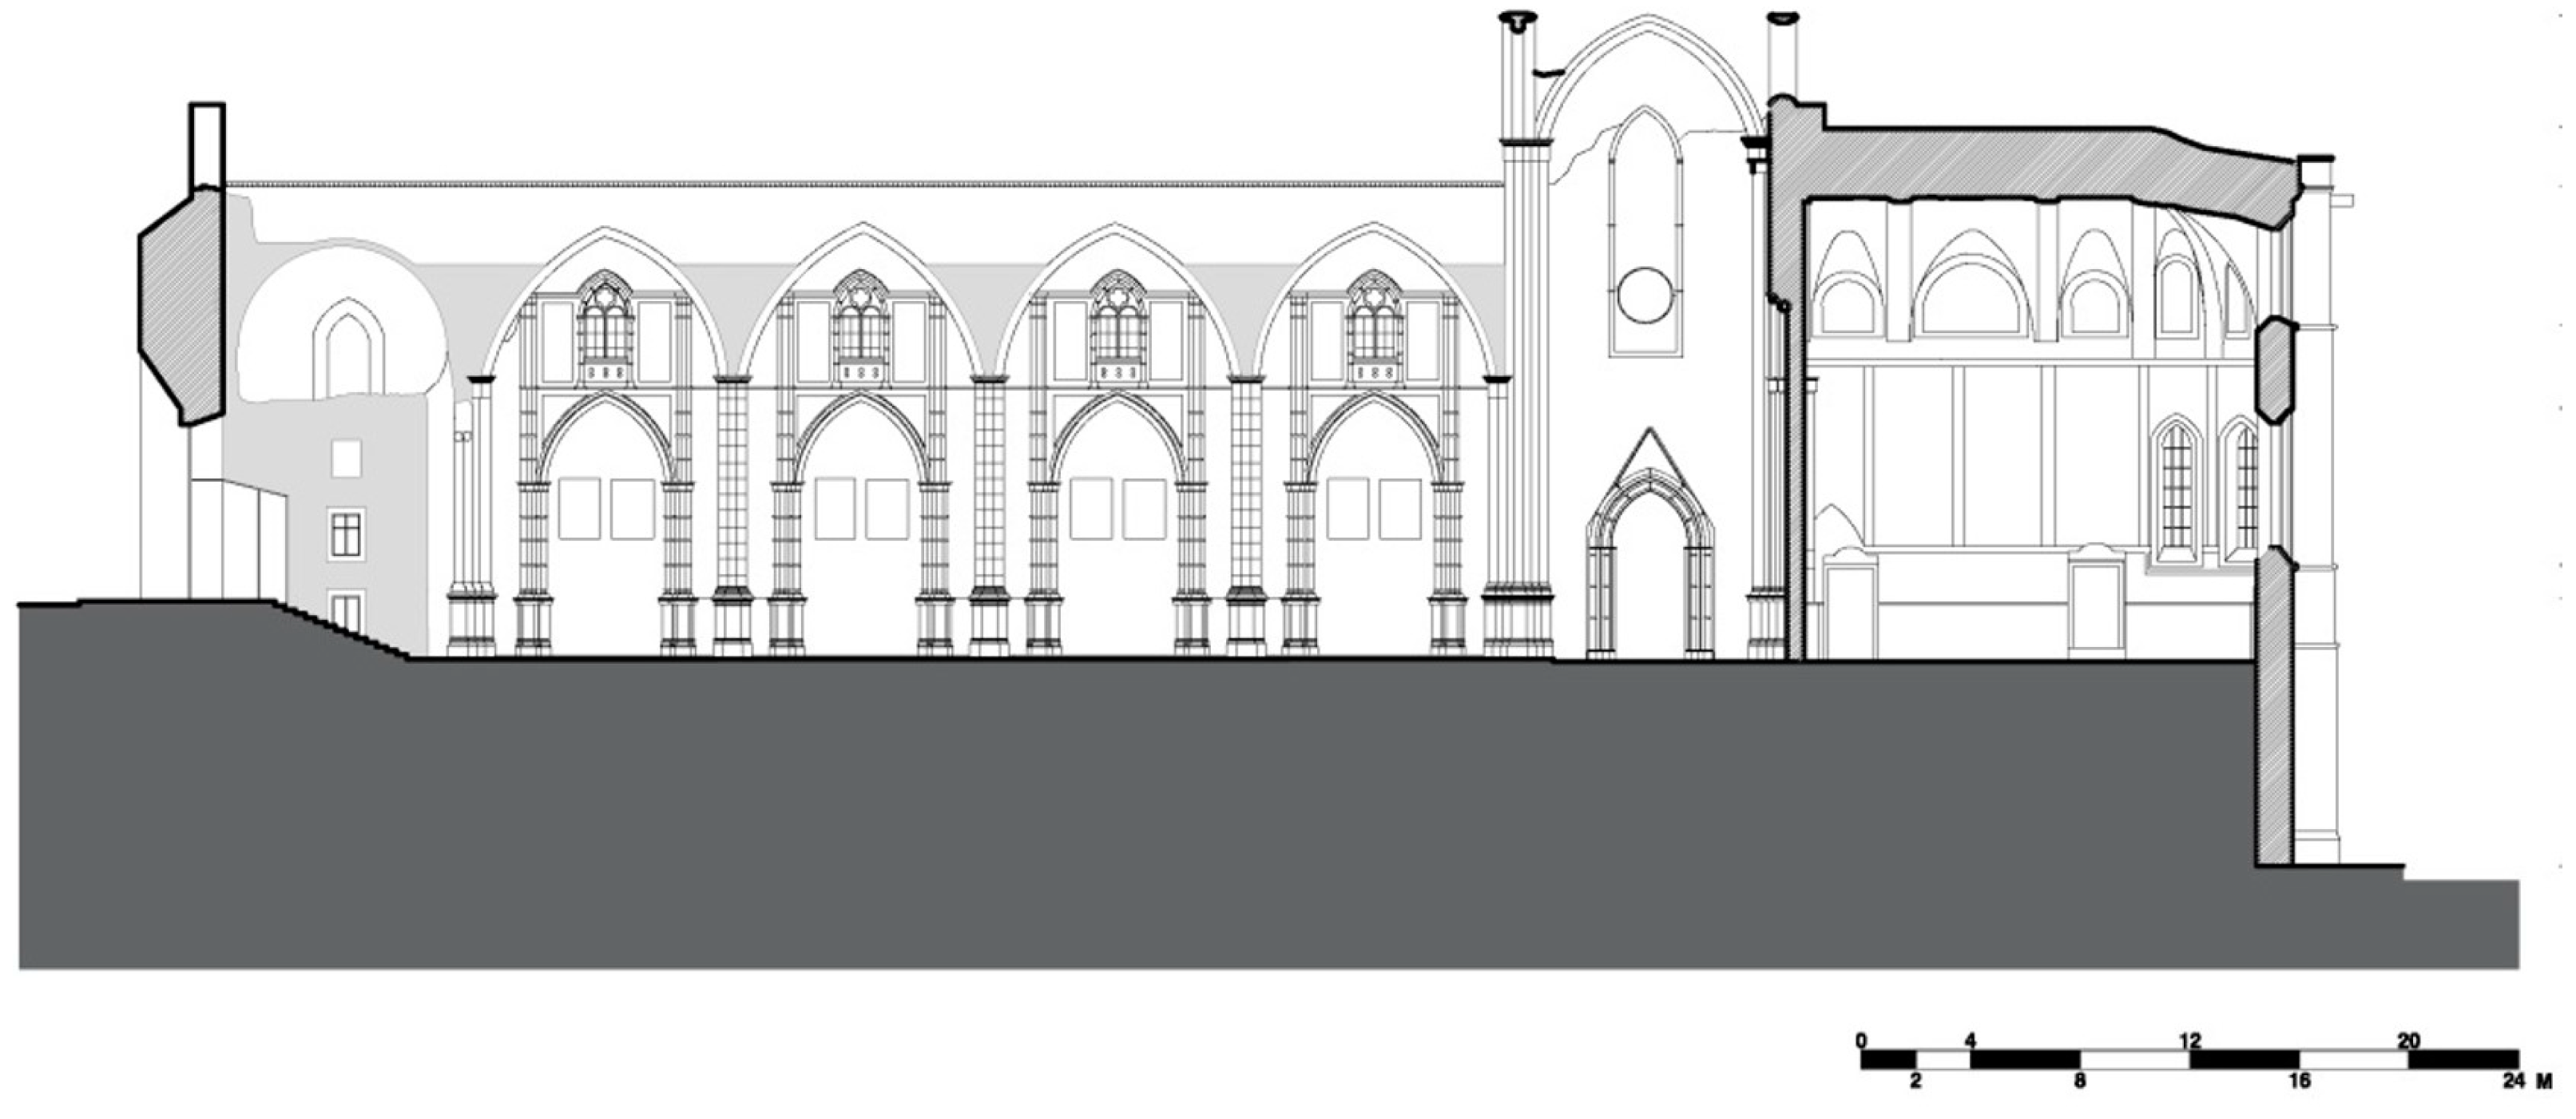
2. Church Ruins of Carmo Convent
3. Non-Destructive Tests
3.1. Geometrical and Damage Survey
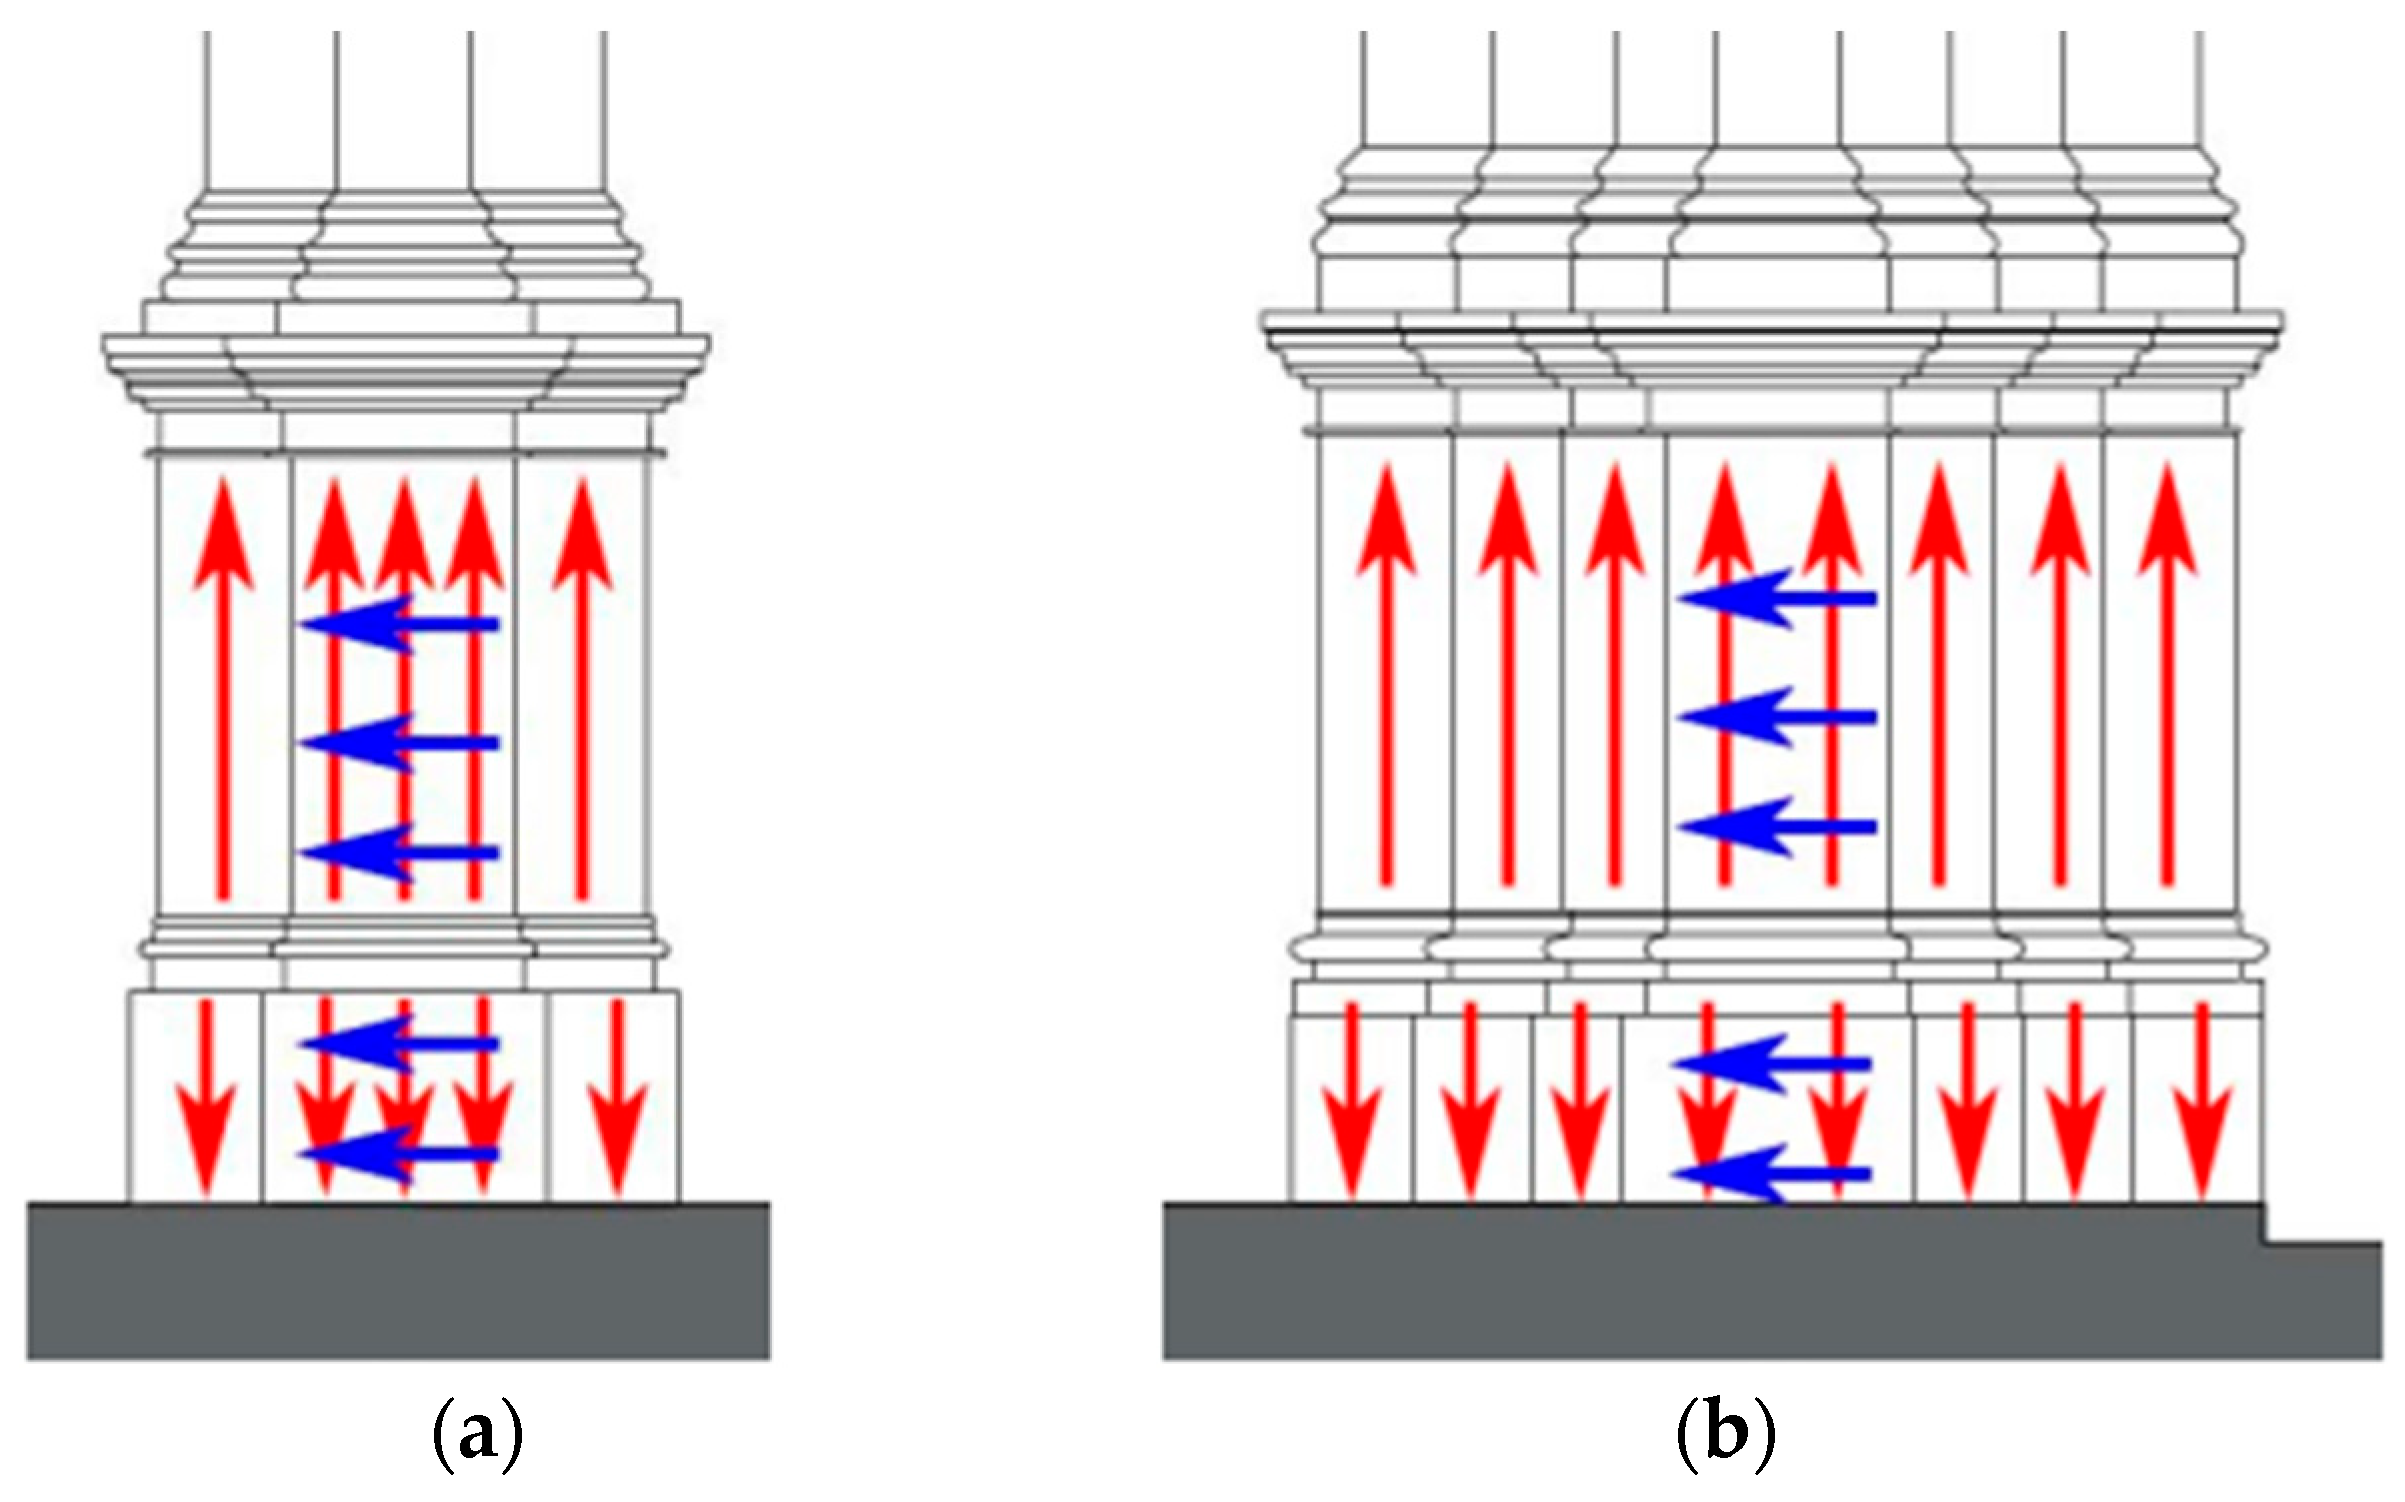
3.2. Sonic Tests
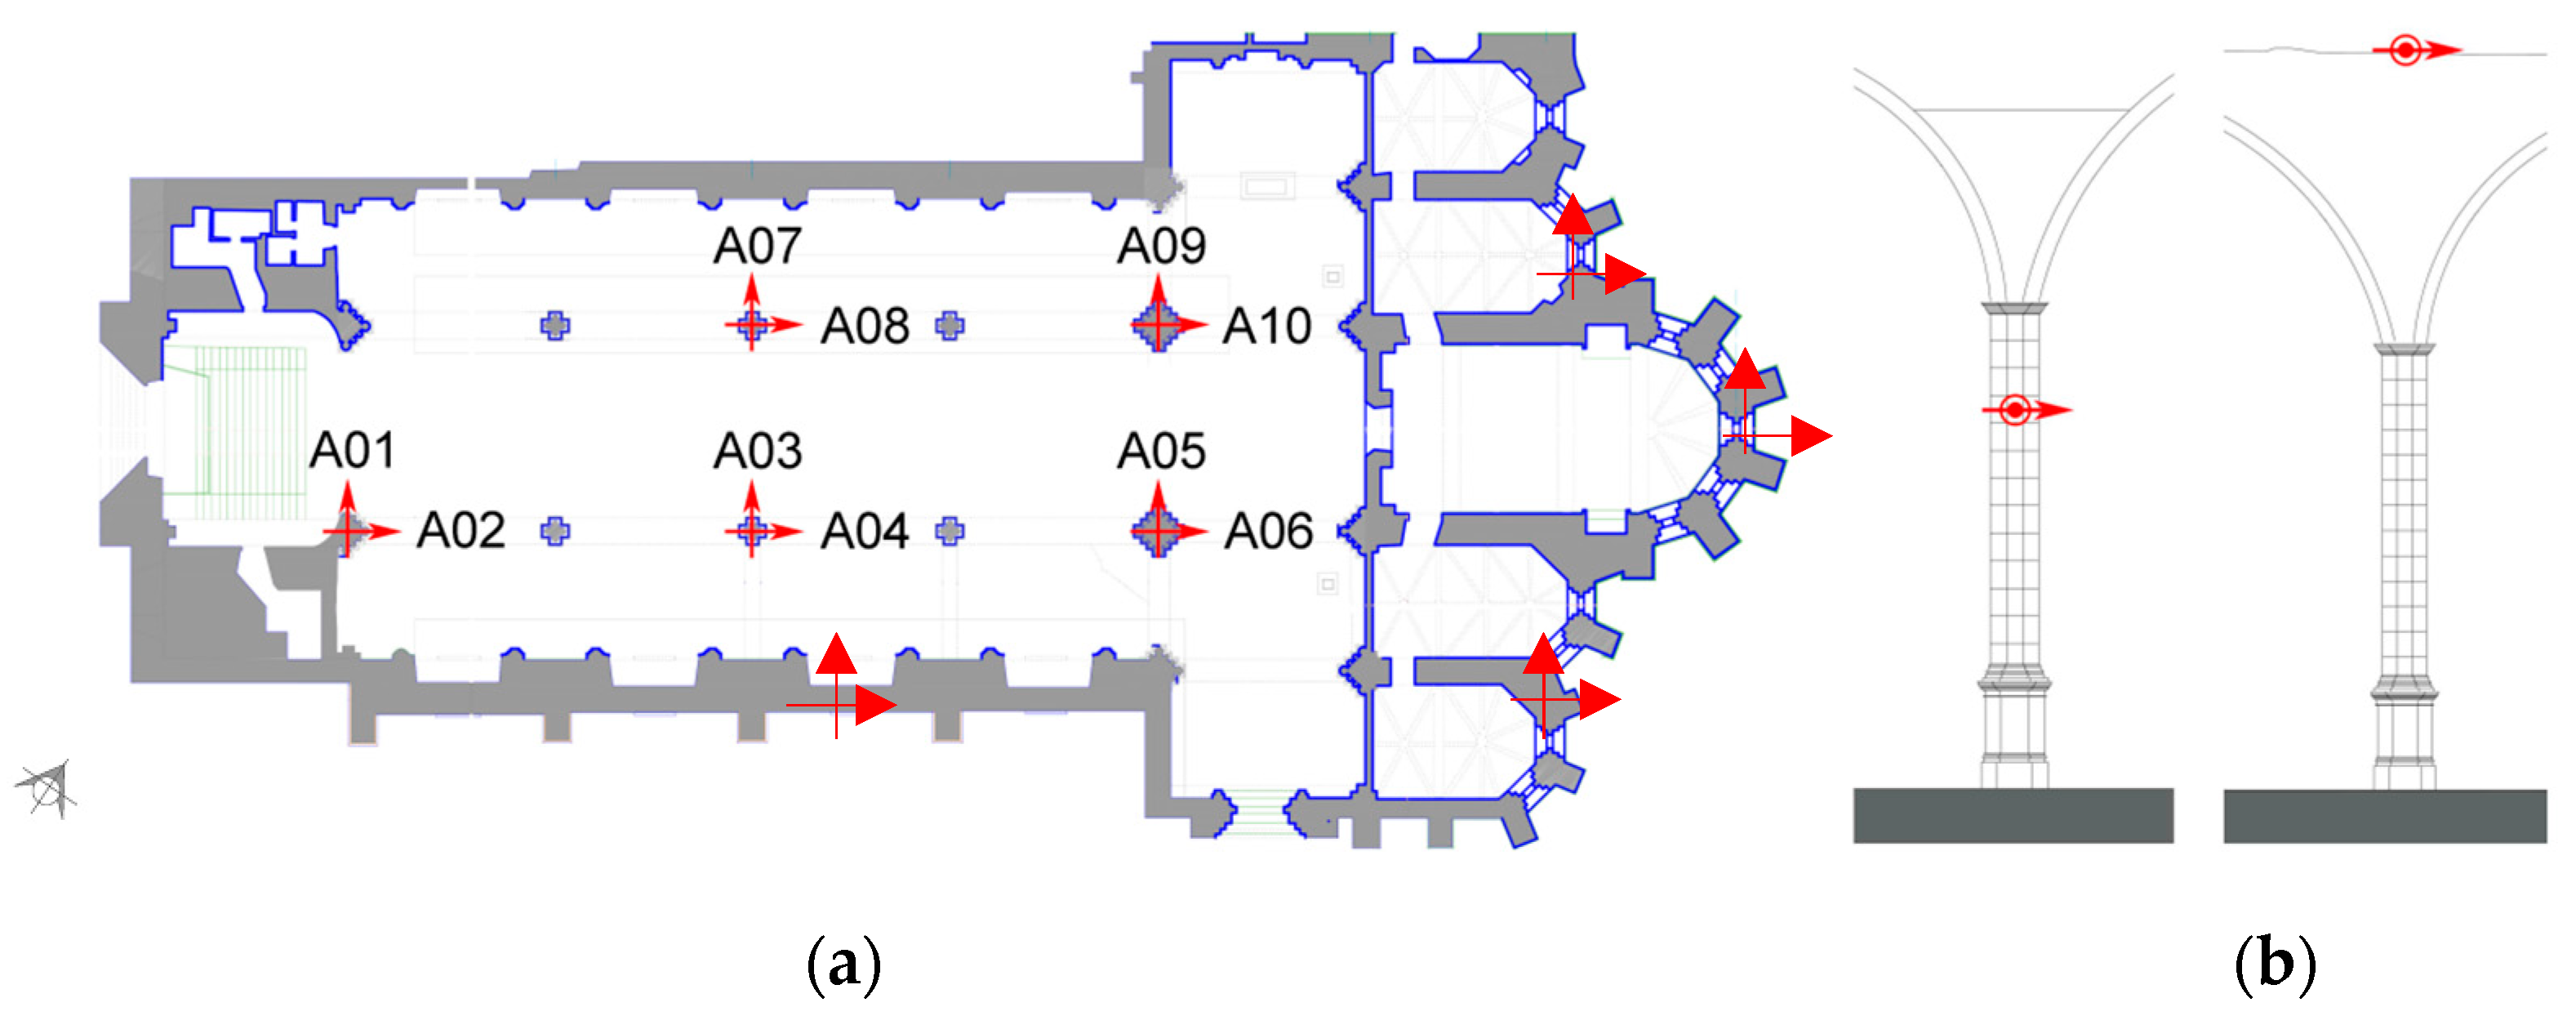
3.3. Dynamic Identification Tests
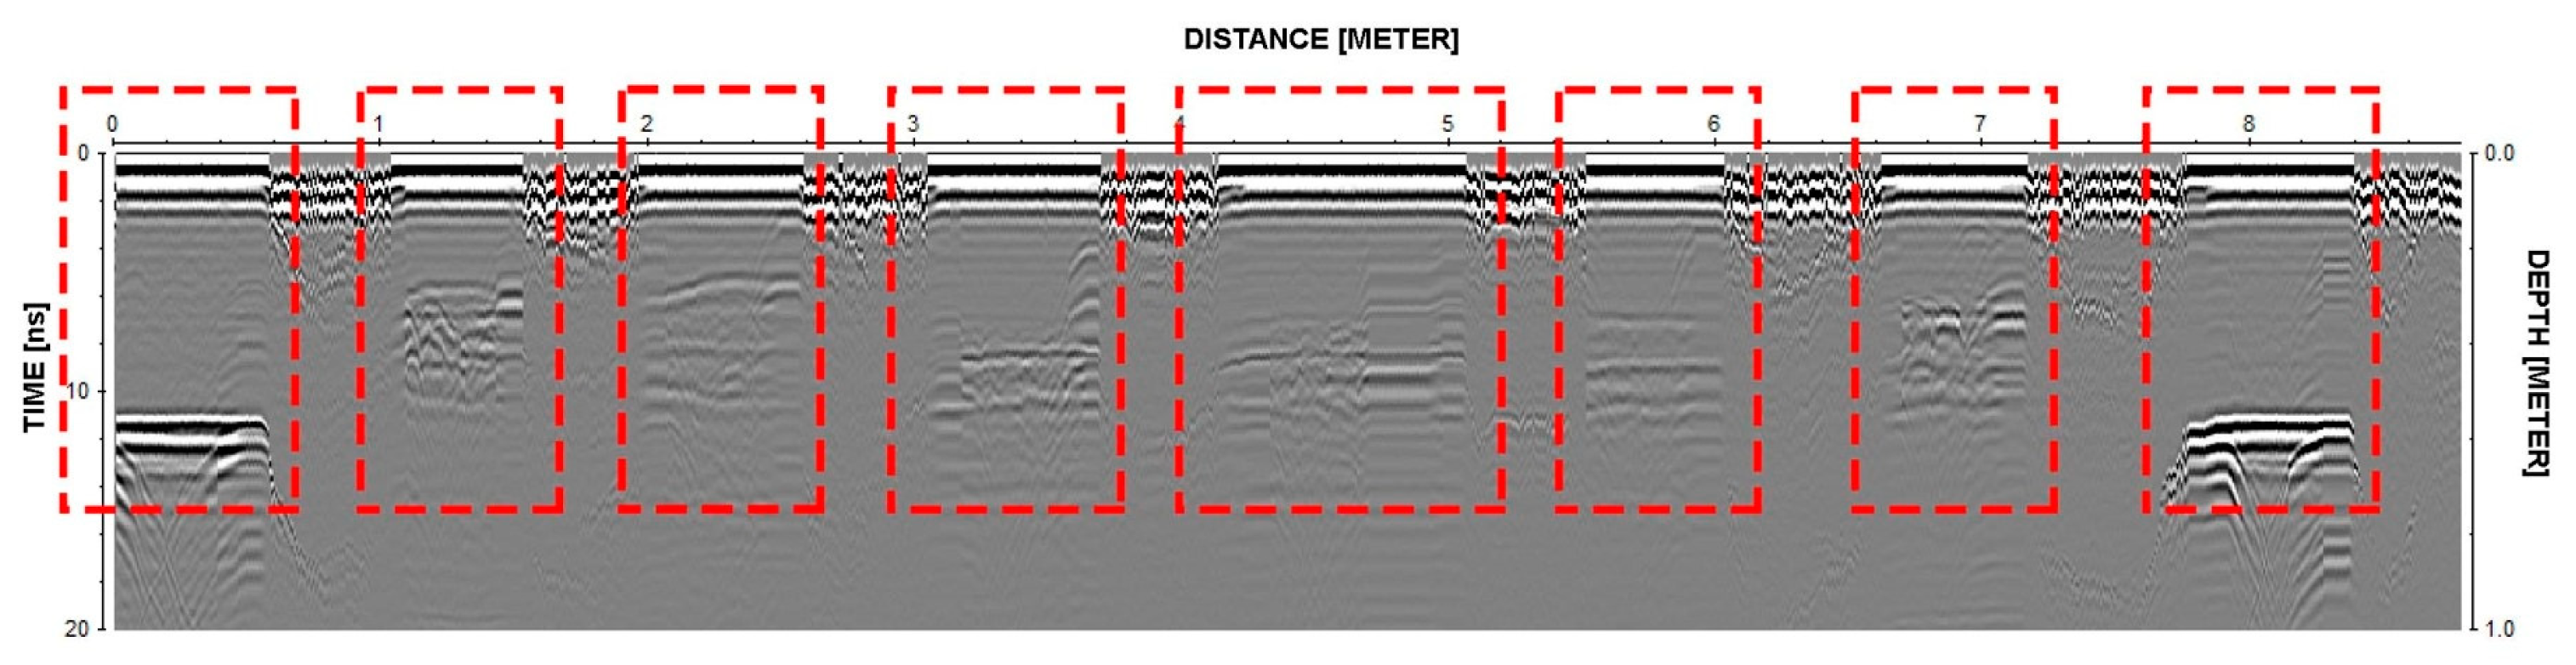
3.4. GPR Surveys
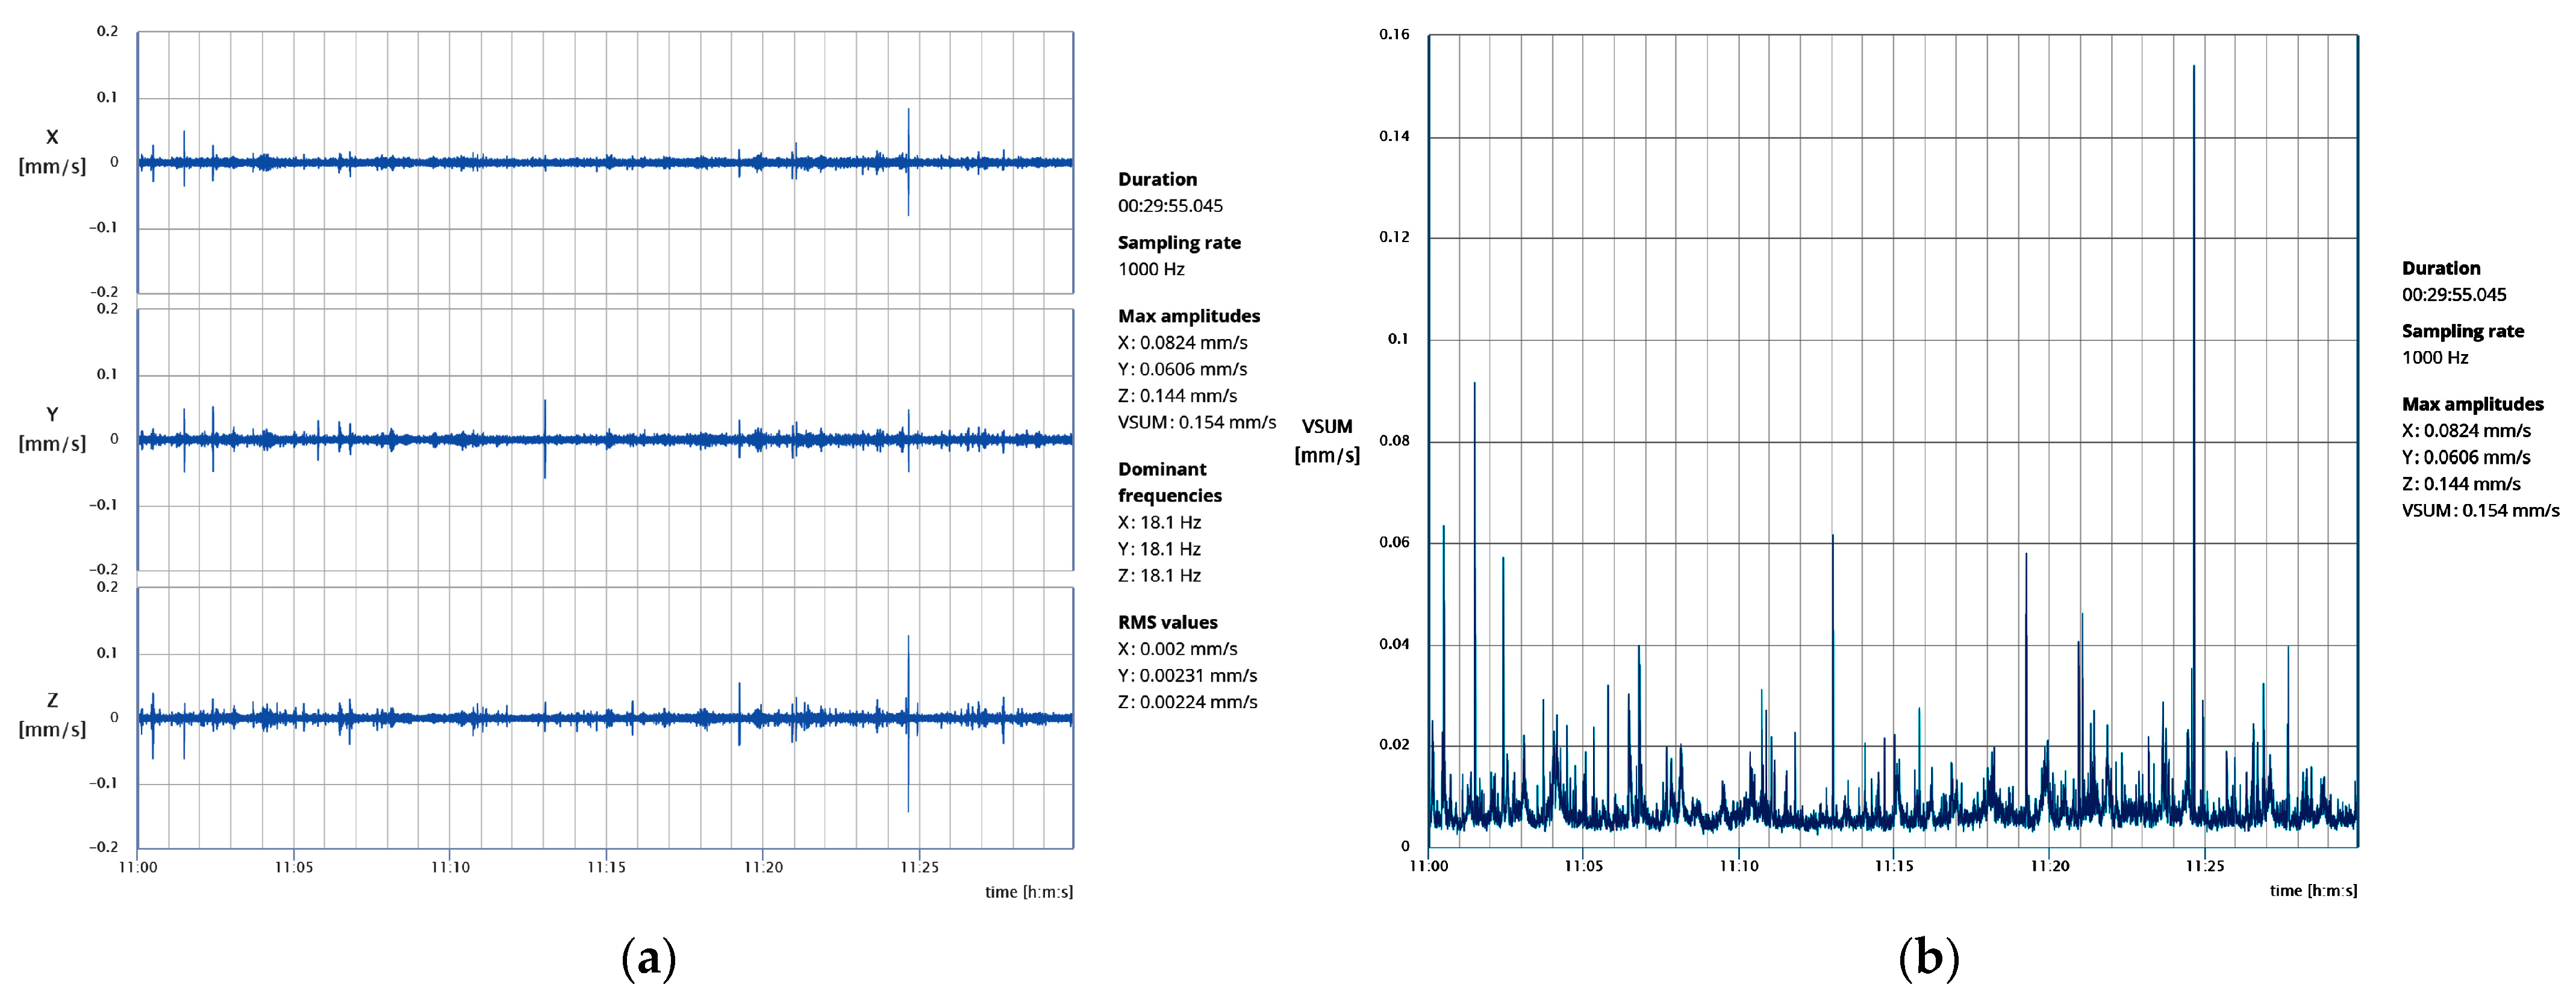
4. Vibration Assessment
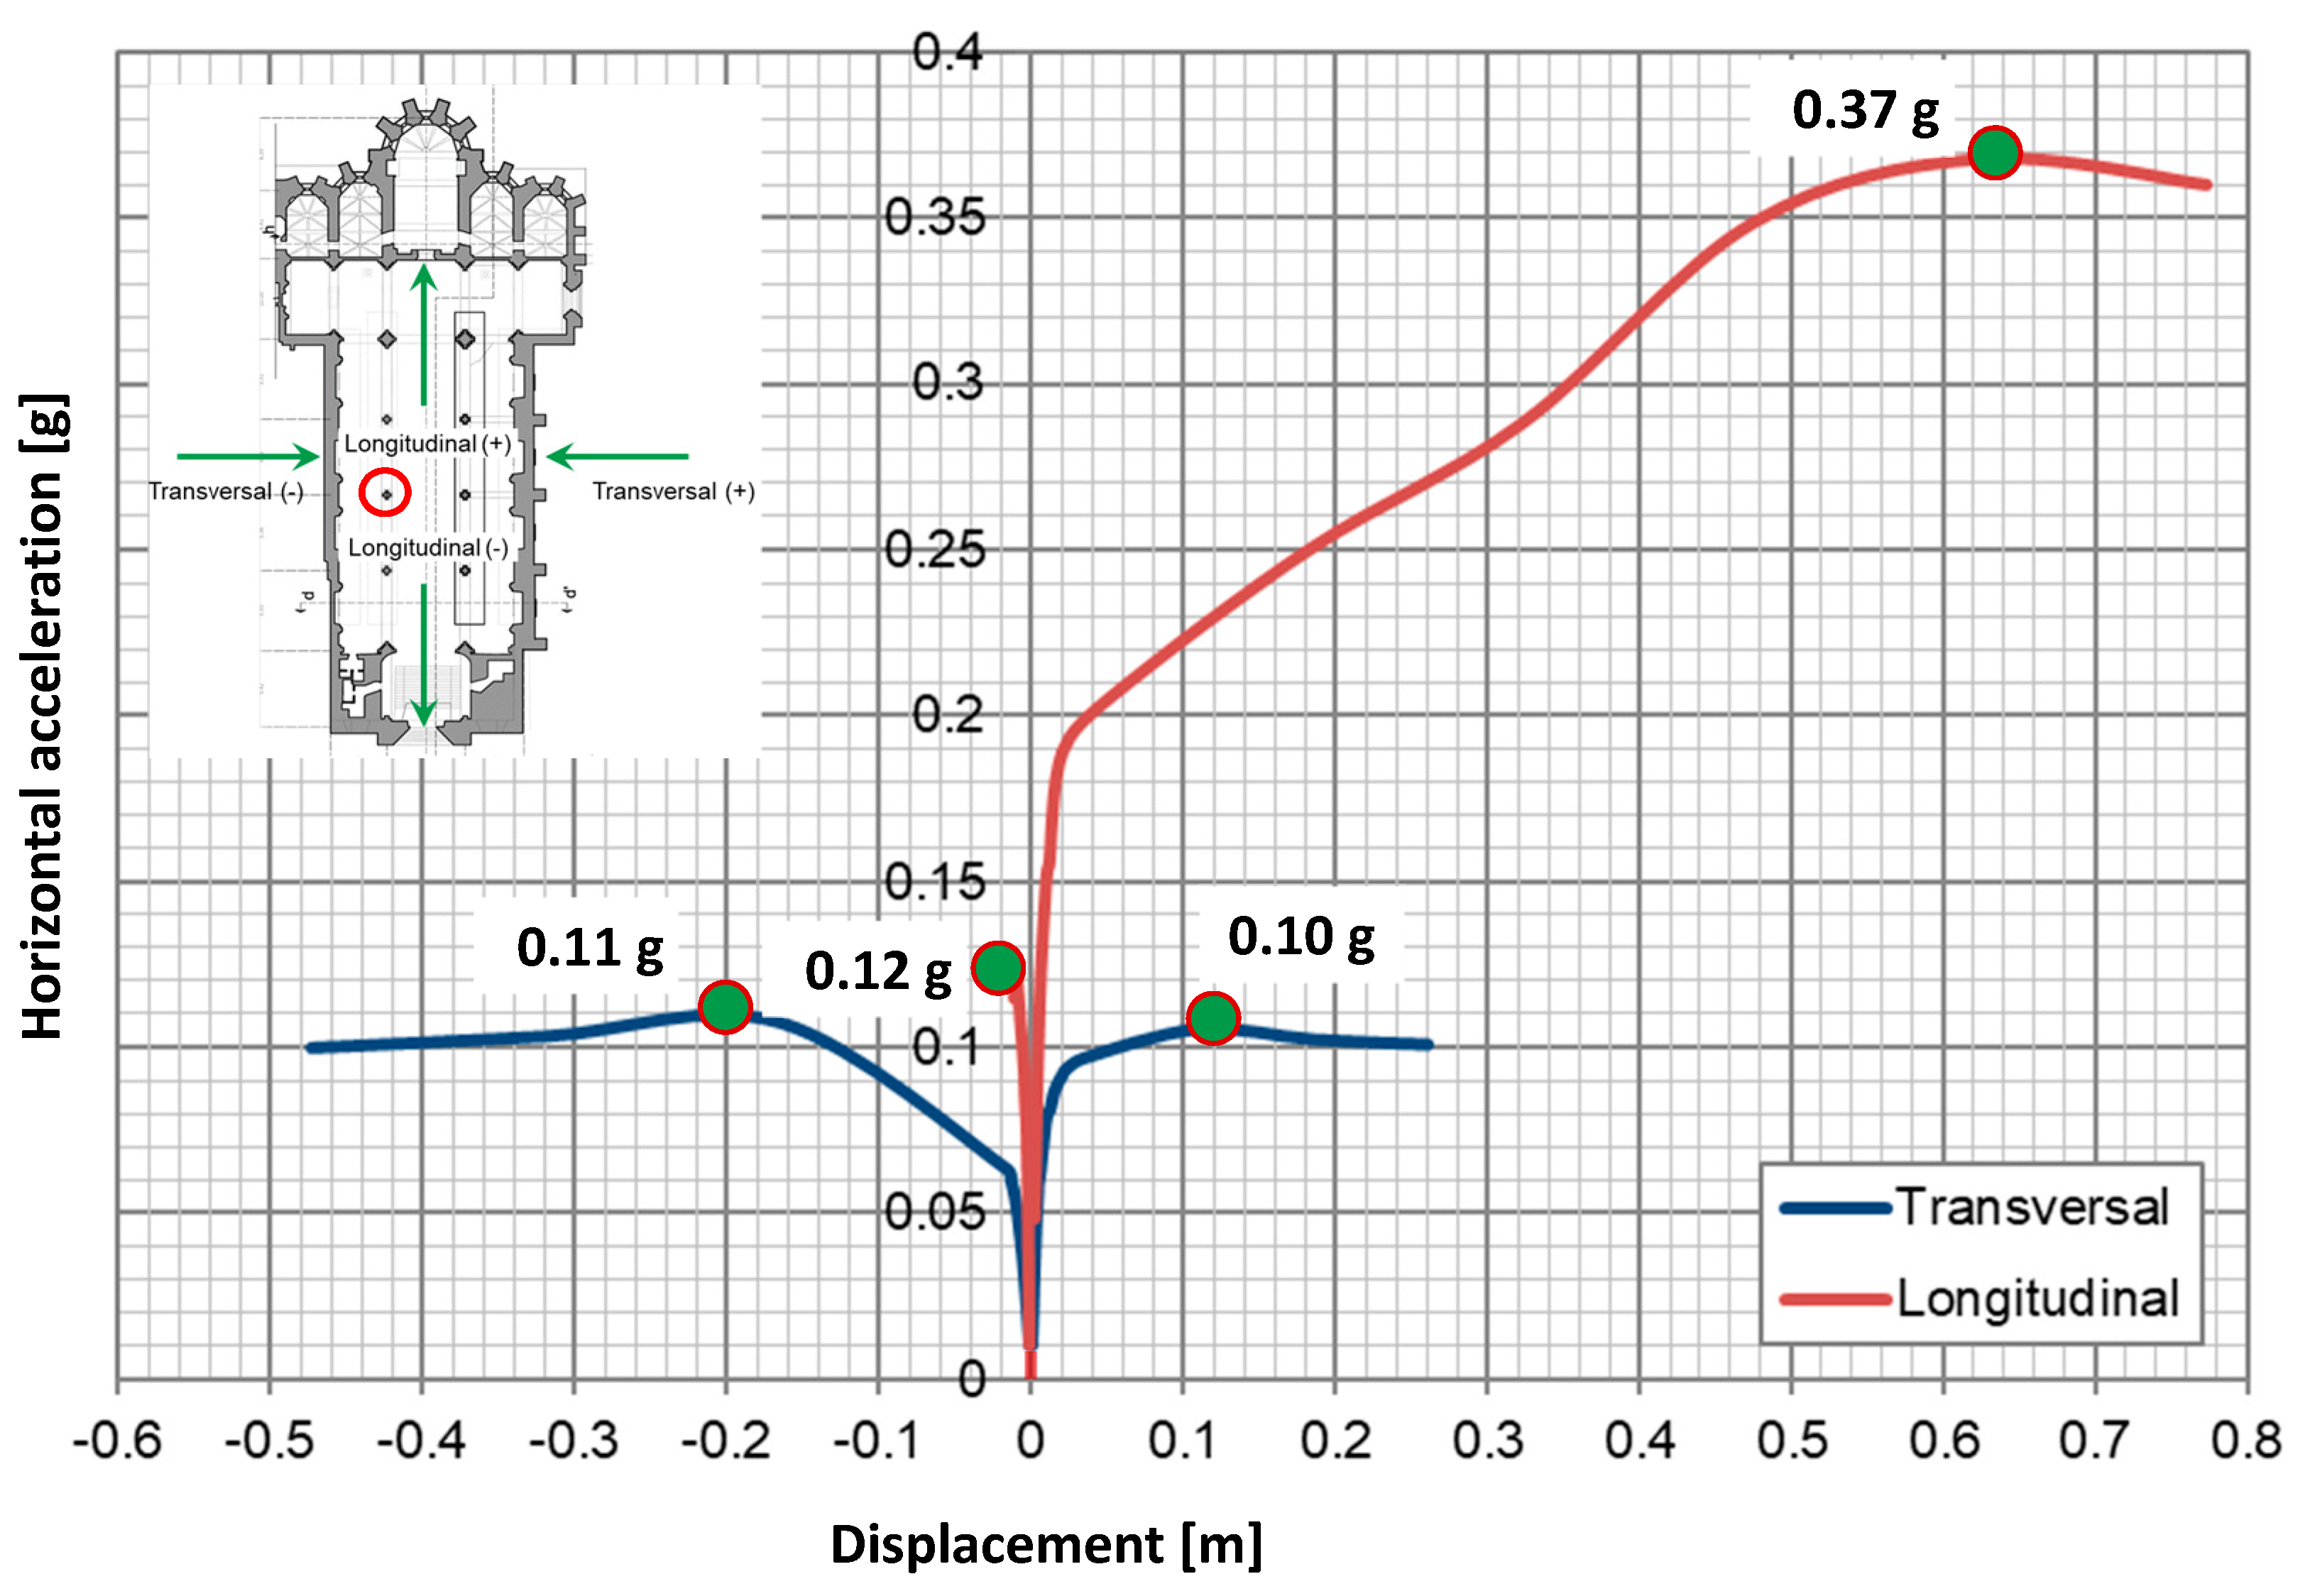
5. Seismic Vulnerability
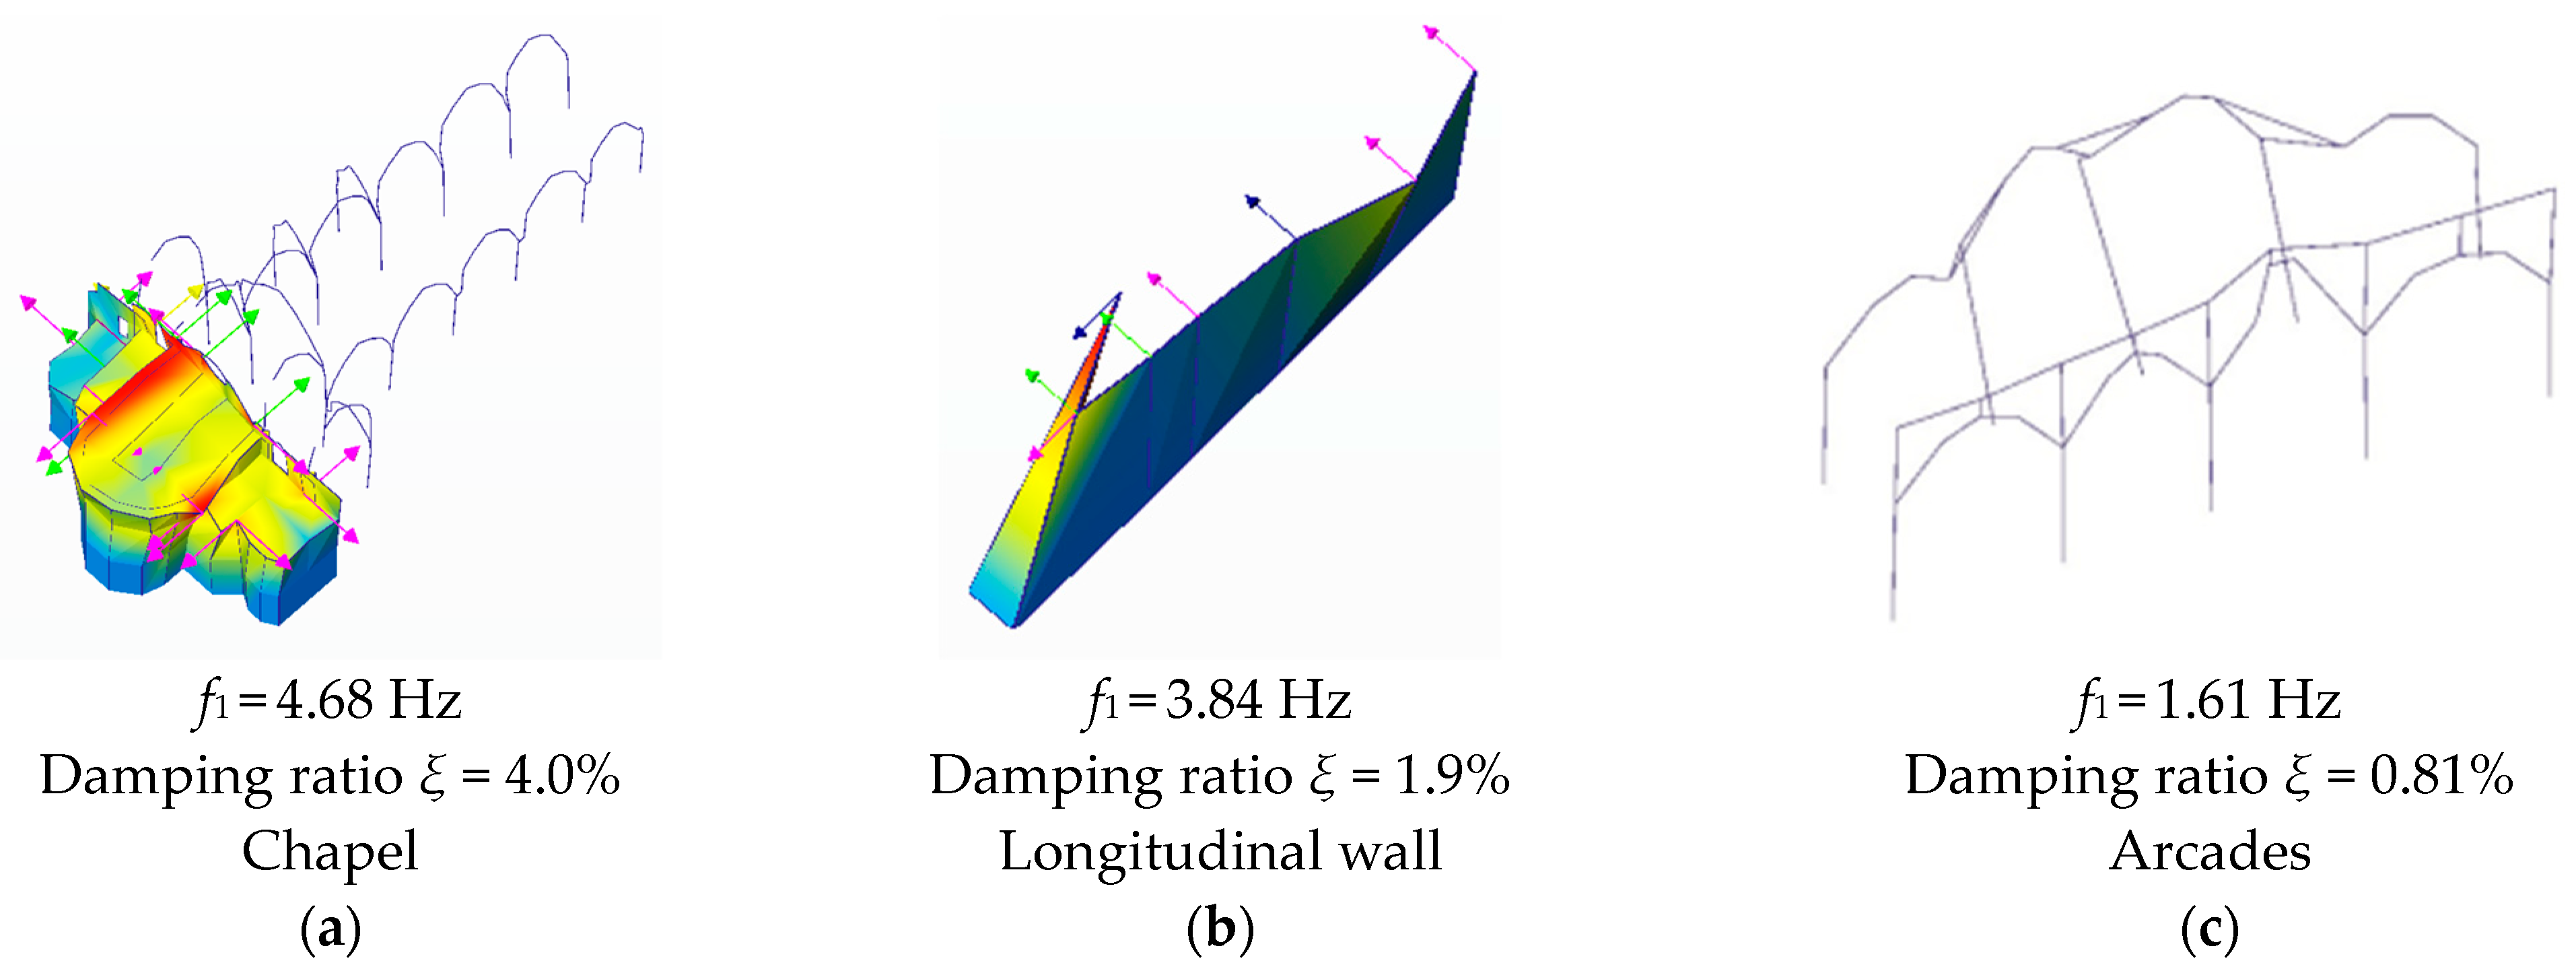
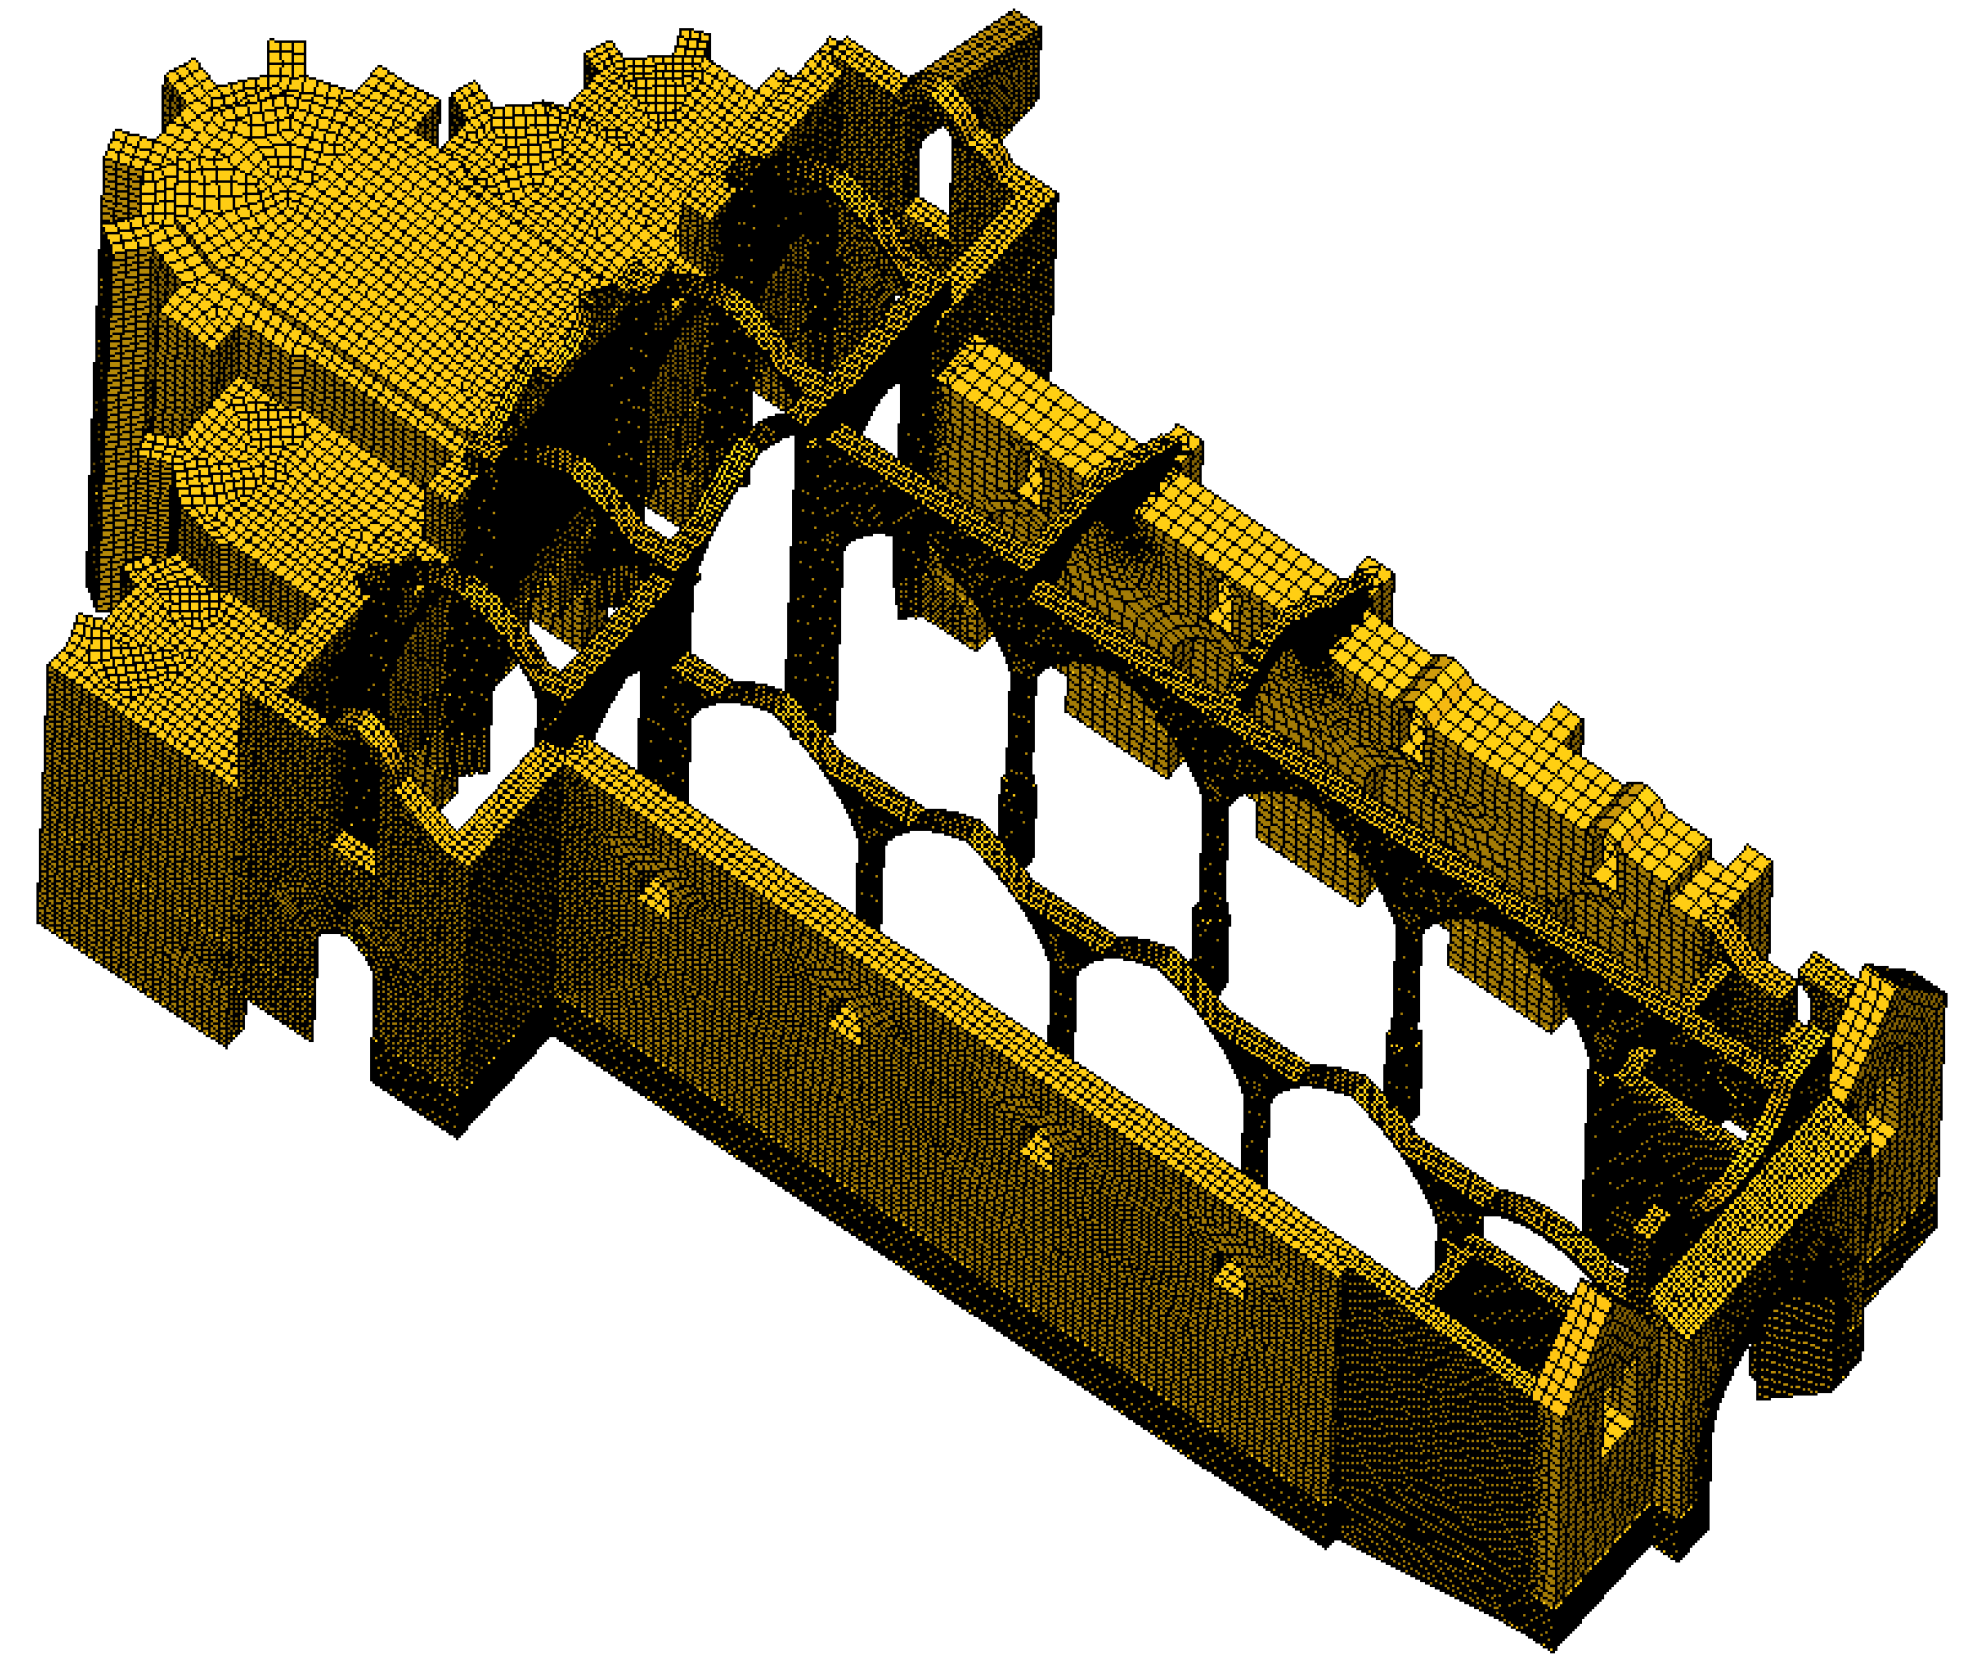
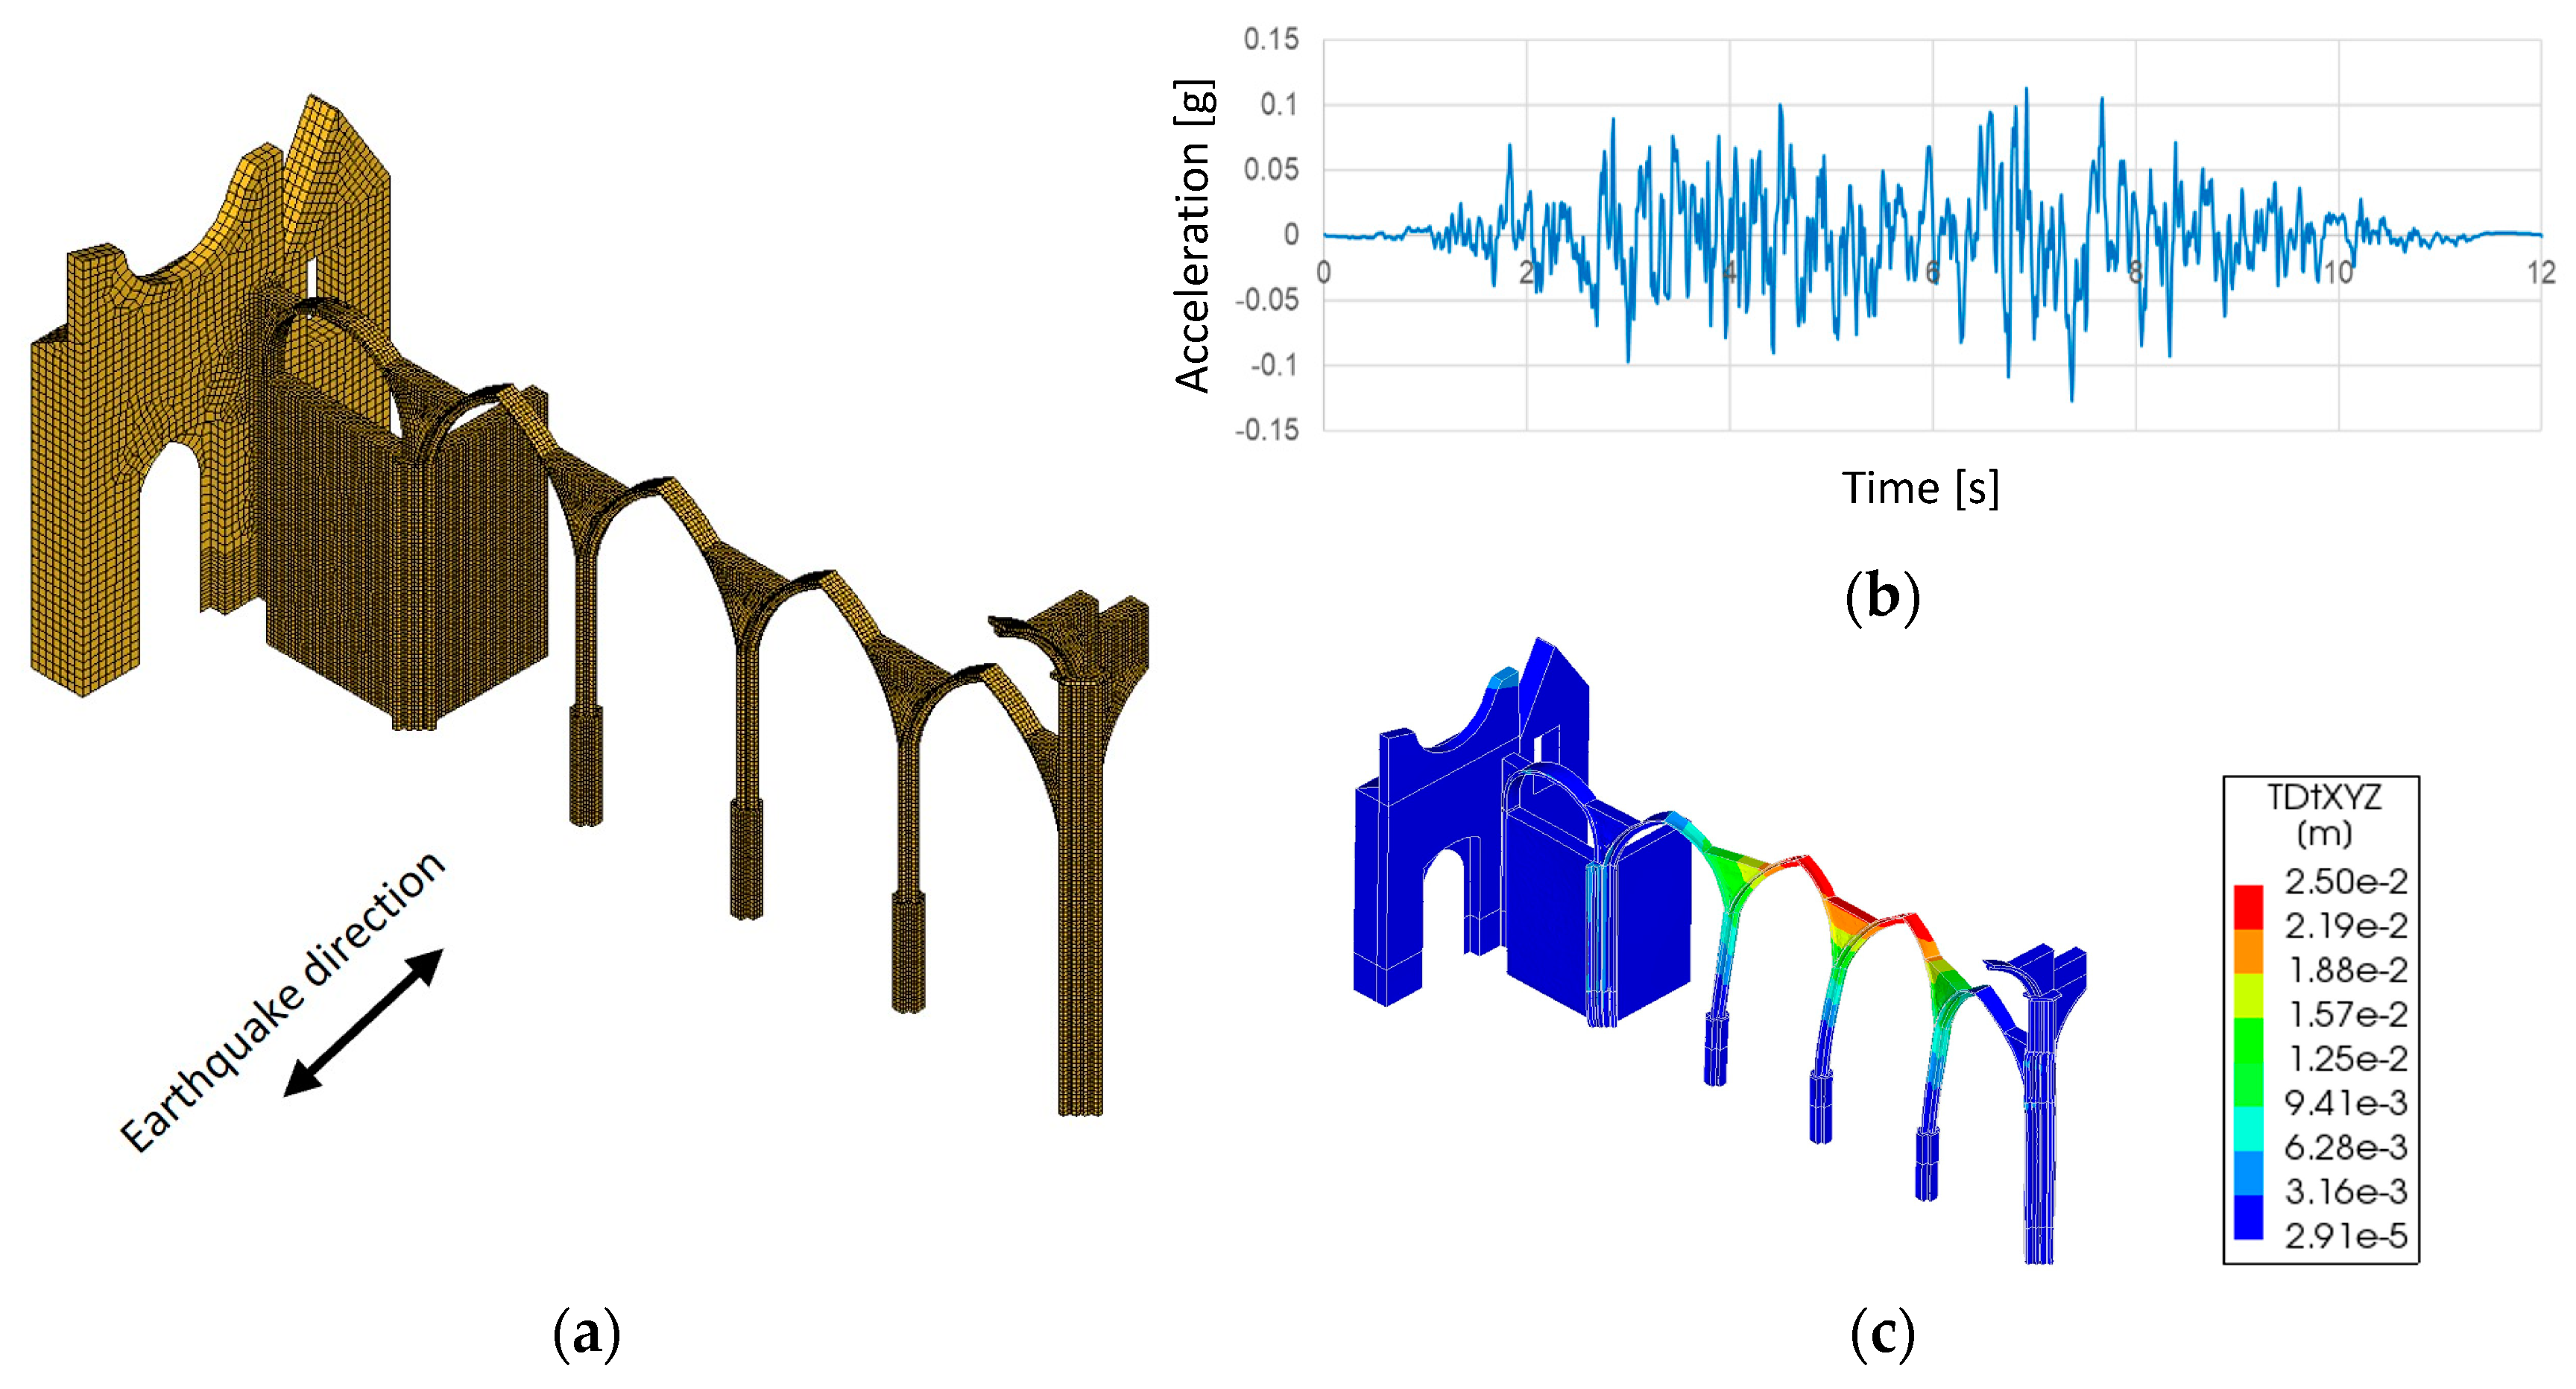
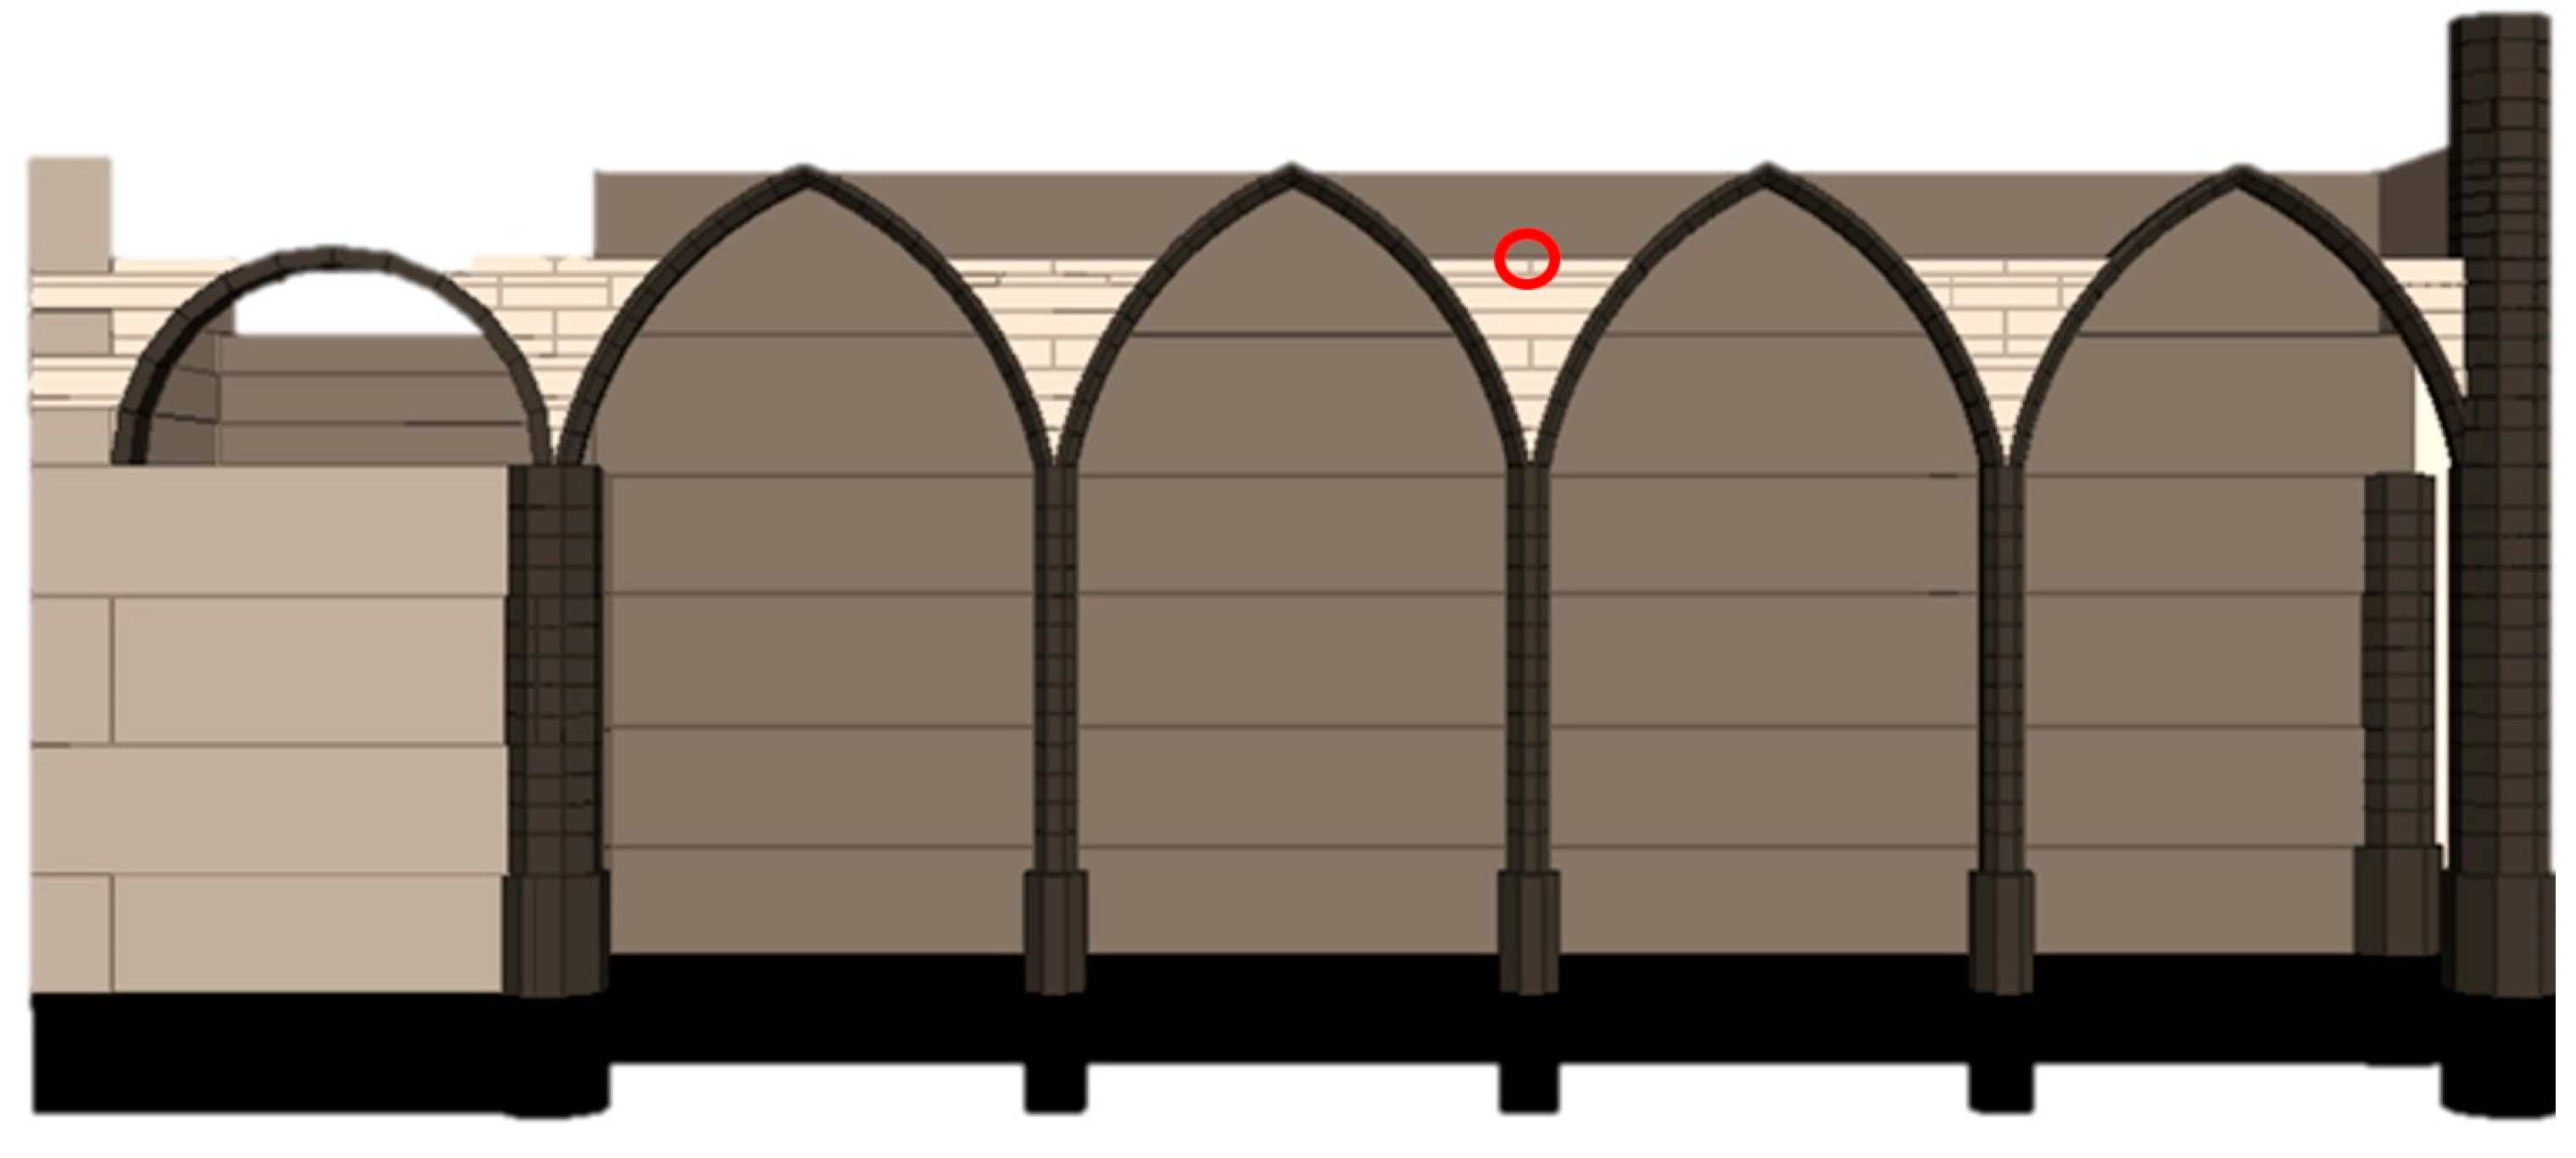
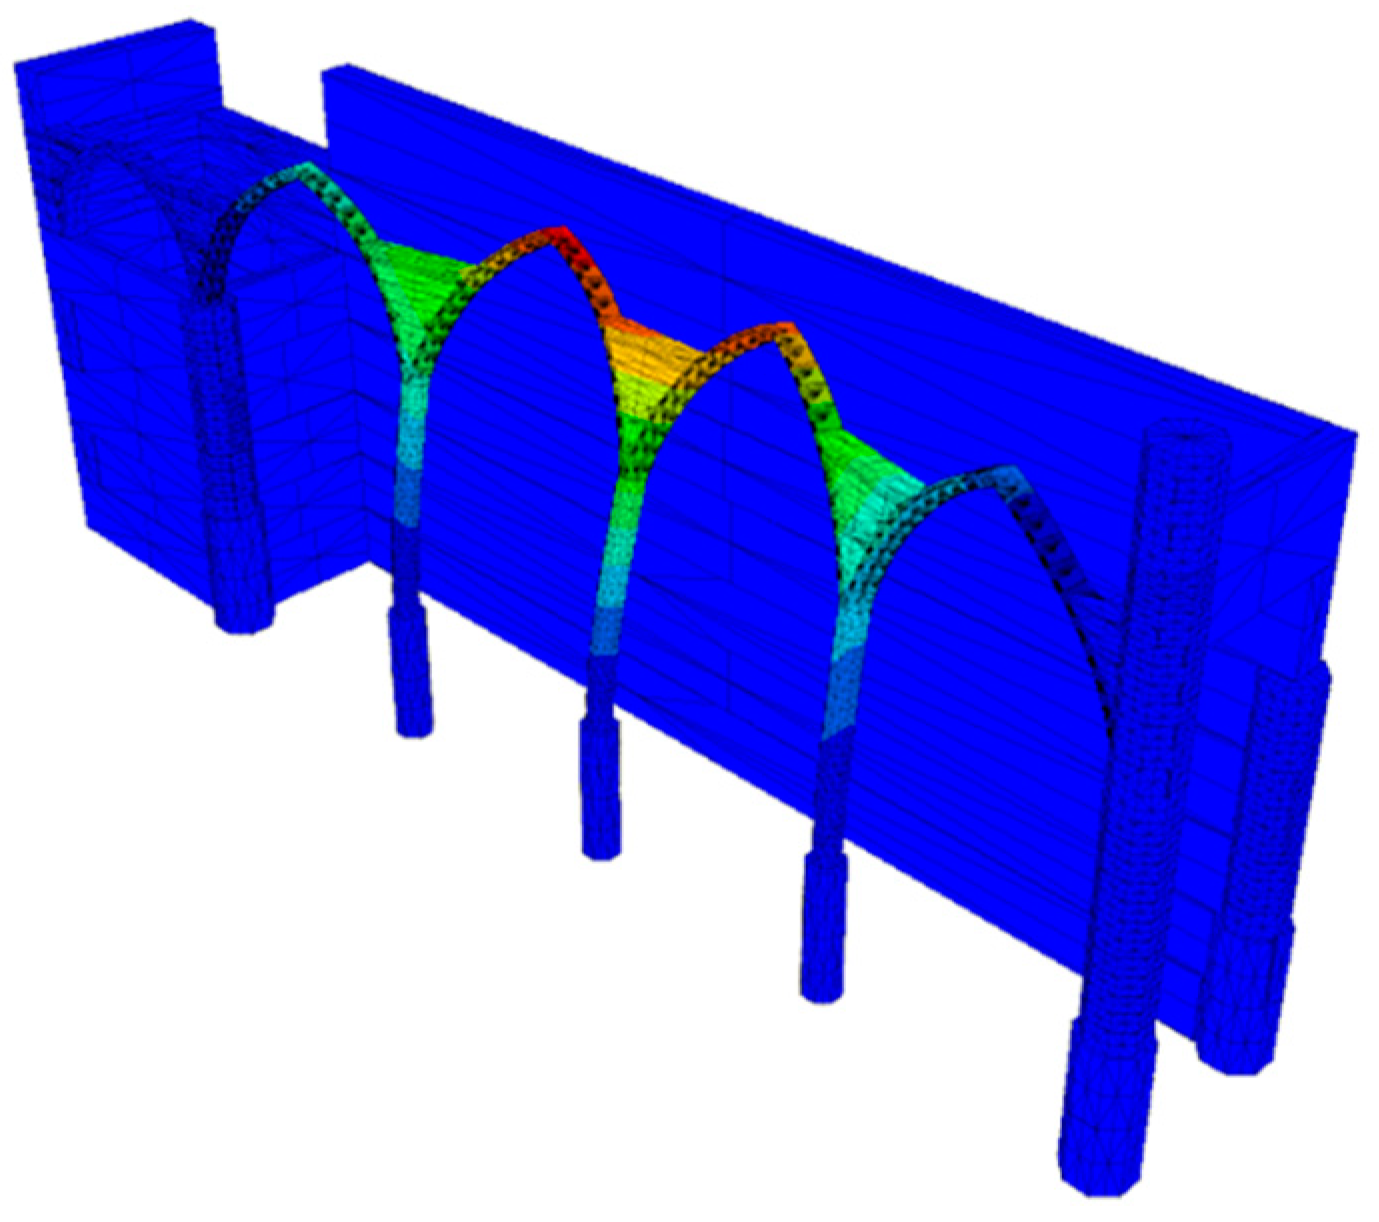
5.1. Finite Element Model
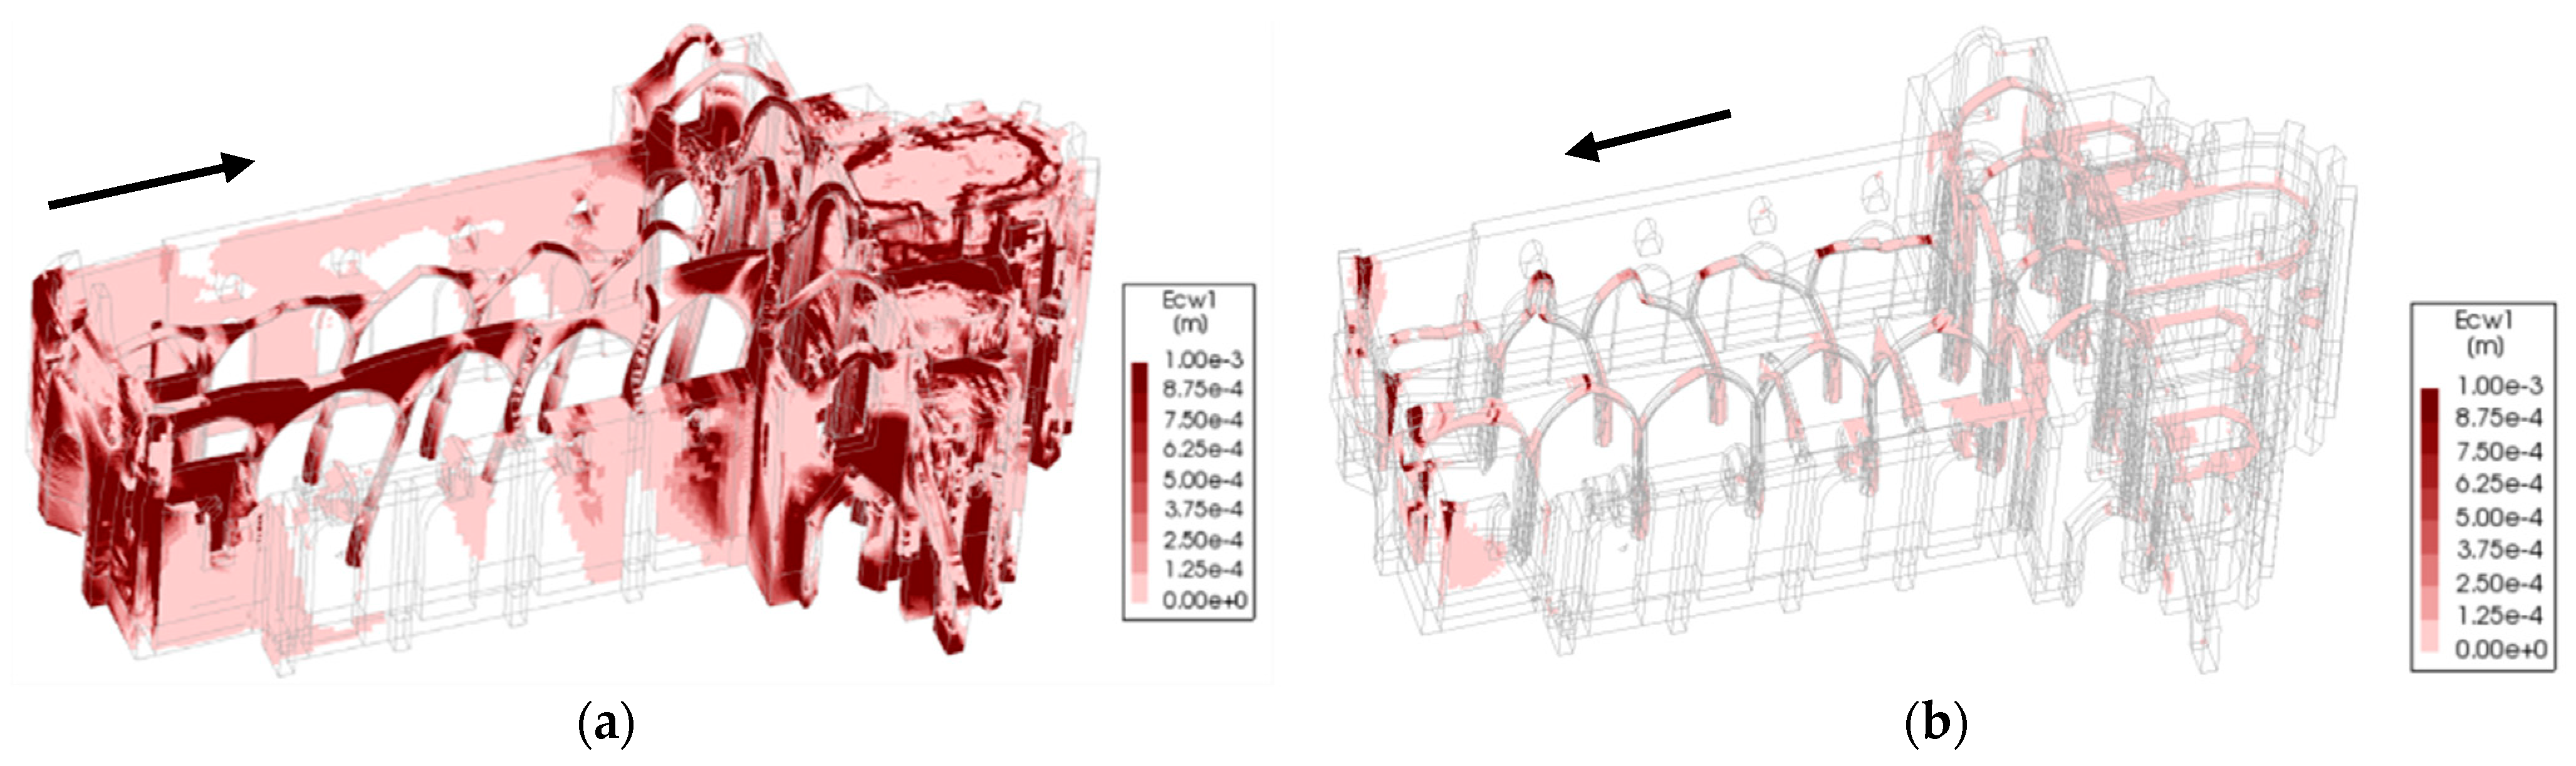
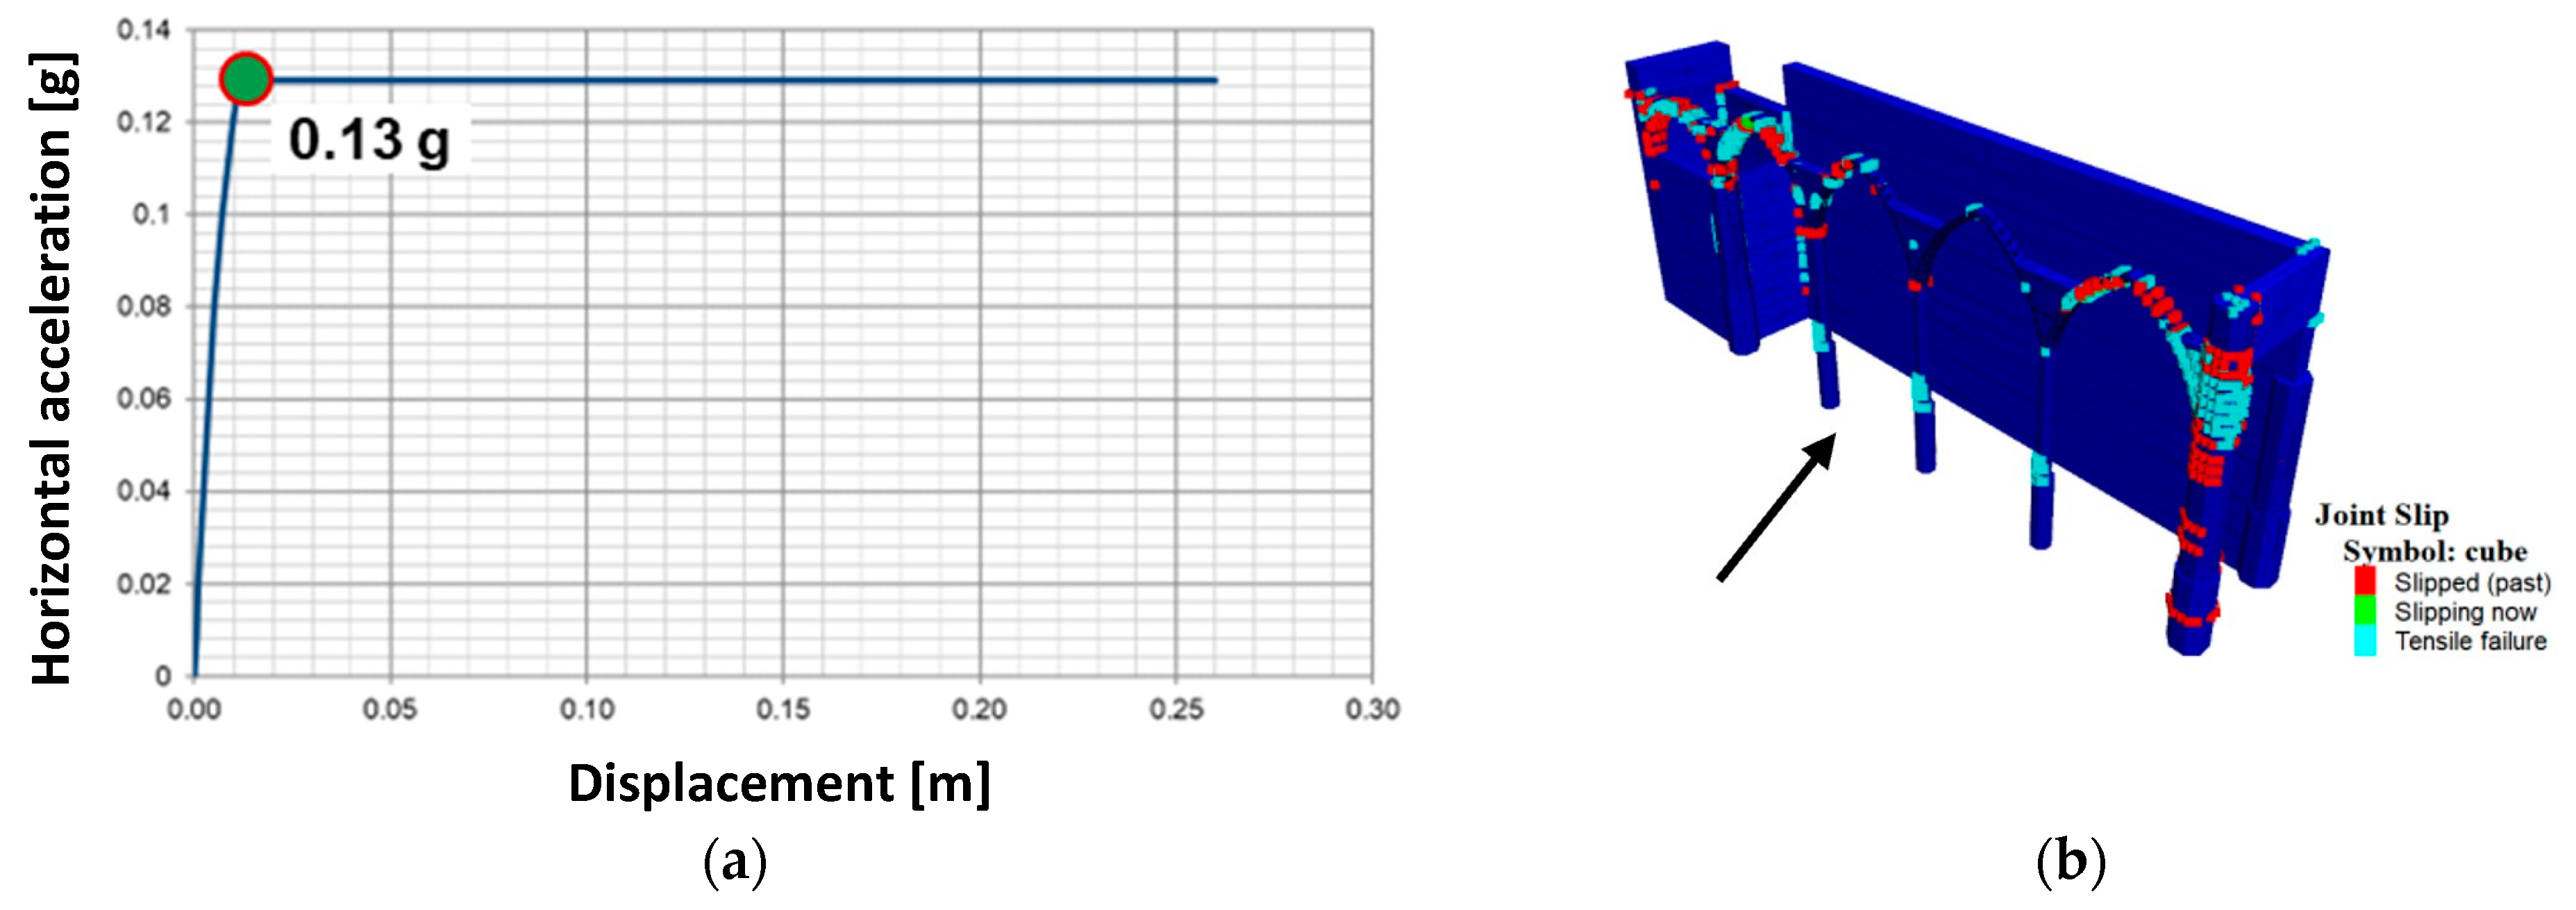
5.2. Discrete Element Model
6. Conclusions
Author Contributions
Funding
Institutional Review Board Statement
Informed Consent Statement
Data Availability Statement
Acknowledgments
Conflicts of Interest
References
- Coelho, M.J.; Salgado, F.M.; Rodrigues, L. The Role of Crosshole Seismic Tomography for Site Characterization and Grout Injection Evaluation on Carmo Convent Foundations. In Proceedings of the 2nd International Conference on Site Charcterization (ISC’2), Porto, Portugal, 19–22 September 2002; pp. 443–449. [Google Scholar]
- Compán, V.; Pachón, P.; Cámara, M.; Lourenço, P.B.; Sáez, A. Structural safety assessment of geometrically complex masonry vaults by non-linear analysis. The Chapel of the Würzburg Residence (Germany). Eng. Struct. 2017, 140, 1–13. [Google Scholar] [CrossRef]
- Salachoris, G.P.; Standoli, G.; Betti, M.; Milani, G.; Clementi, F. Evolutionary numerical model for cultural heritage structures via genetic algorithms: A case study in central Italy. Bull. Earthq. Eng. 2024, 22, 3591–3625. [Google Scholar] [CrossRef]
- Costamagna, E.; Quintero, M.S.; Bianchini, N.; Mendes, N.; Lourenço, P.B.; Su, S.; Paik, Y.M.; Min, A. Advanced non-destructive techniques for the diagnosis of historic buildings: The Loka-Hteik-Pan temple in Bagan. J. Cult. Herit. 2020, 43, 108–117. [Google Scholar] [CrossRef]
- Chaves, E.; Aguilar, J.; Barontini, A.; Mendes, N.; Compán, V. Digital Tools for the Preventive Conservation of Built Heritage: The Church of Santa Ana in Seville. Heritage 2024, 7, 3470–3494. [Google Scholar] [CrossRef]
- Elevation of Lisbon, Portugal [Internet]. Worldw. Elev. Map Finder. Available online: http://elevation.maplogs.com/poi/lisbon_portugal.485.html (accessed on 3 June 2024).
- Noé, P.; Figueiredo, P. Igreja do Convento do Carmo [Internet]. Sist. Informação Para o Património Arquit. 2008. Available online: http://www.monumentos.gov.pt/site/app_pagesuser/sipa.aspx?id=6521 (accessed on 20 June 2024).
- Gil, N.; Oliveira, C.S. A preliminary study on the seismic behaviour of the church of Convento do Carmo in Lisbon and its confrontation with the historical perspective. Trans. Built Environ. 1995, 15, 311–318. [Google Scholar]
- Bianchini, Cullimore, Jain, Mendes, Salazar and Scacco, “Carmo Convent—The Church Ruins,” Guimarães; Report of Integrated project; University of Minho: Braga, Portugal, 2018.
- Miranda, J.M.; Btlló, J.; Ferreira, H.; Matias, L.M.; Baptista, M.A. The 1531 Lisbon earthquake and tsunami. In Proceedings of the 15th World Conference on Earthquake Engineering—WCEE, Lisbon, Portugal, 24–28 September 2012; pp. 1–9. [Google Scholar]
- Agisoft PhotoScan 1.4.0 build 5310; Agisoft LLC: St. Petersburg, Russia, 2017.
- McNeel, R. Rhinoceros NURBS modeling for Windows; Robert McNeel & Associates: Seattle, WA, USA, 2008. [Google Scholar]
- Frenz, R. ReCap 360—Advanced Workflows; Autodesk, Inc.: San Francisco, CA, USA, 2015. [Google Scholar]
- ICOMOS-ISCS. Illustrated Glossary on Stone Deterioration Patterns; International Scientific Committee for Stone (ISCS): Champigny Marne, France, 2008. [Google Scholar]
- Miranda, L.F.; Rio, J.; Guedes, J.M.; Costa, A. Sonic Impact Method—A new technique for characterization of stone masonry walls. Constr. Build. Mater. 2012, 36, 27–35. [Google Scholar] [CrossRef]
- Norme Tecniche per le Costruzioni; Ministero delle Infrastrutture e Trasporti. 2018. Available online: https://biblus.acca.it/download/norme-tecniche-per-le-costruzioni-2018-ntc-2018-pdf/ (accessed on 14 June 2024).
- Lourenco, P.B.; Ramos, L.F. In Situ NDT and MDT For Masonry Structures; Guimaraes: Lisboa, Portugal, 2017. [Google Scholar]
- UMacquisition. Guimarães, Portugal: Historic Masonry Structures (HMS); University of Minho: Braga, Portugal, 2008. [Google Scholar]
- Cunha, Á.; Caetano, E. Experimental Modal Analysis of Civil Engineering Structures. Sound Vib [Internet]. 2006. Available online: https://www.academia.edu/210199/Experimental_Modal_Analysis_of_Civil_Engineering_Structures (accessed on 14 June 2024).
- Secanellas, S.A.; Gallego, J.C.L.; Catalán, G.A.; Navarro, R.M.; Heras, J.O.; Izquierdo, M.G.; Hernández, M.G.; Velayos, J.J.A. An Ultrasonic Tomography System for the Inspection of Columns in Architectural Heritage. Sensors 2022, 22, 6646. [Google Scholar] [CrossRef] [PubMed]
- Thompson, D.J.; Jones, C.; Gautier, P. Railway Noise and Vibration: Mechanisms, Modelling and Means of Control; Elsevier: Amsterdam, The Netherlands, 2009. [Google Scholar]
- ISO 4866—Amendment 2; Mechanical Vibration and Shock—Vibration of Buildings Guidelines for the Measurement of Vibrations and Their Effects on Buildings. International Organization for Standardization: Geneva, Switzerland, 1996.
- Karanikoloudis, G.; Lourenço, P.B.; Mendes, N.; Serra, J.B.; Boroschek, R. Monitoring of Induced Groundborne Vibrations in Cultural Heritage Buildings: Miscellaneous Errors and Aliasing through Integration and Filtering. Int. J. Archit. Herit. 2021, 15, 205–228. [Google Scholar] [CrossRef]
- NP 2074; Assessment of the Influence of Impulsive Vibrations on Structures, Portuguese Standard. IPQ Portuguese Institute of Quality: Caparica, Portugal, 2015. (In Portuguese)
- Teves-Costa, P.; Batlló, J.; Matias, L.; Catita, C.; Jiménez, M.J.; García-Fernández, M. Maximum intensity maps (MIM) for Portugal mainland. J. Seism. 2019, 23, 417–440. [Google Scholar] [CrossRef]
- Maio, R.; Estêvão, J.M.C.; Ferreira, T.M.; Vicente, R. The seismic performance of stone masonry buildings in Faial island and the relevance of implementing effective seismic strengthening policies. Eng. Struct. 2017, 141, 41–58. [Google Scholar] [CrossRef]
- Santos, C.; Ferreira, T.M.; Vicente, R.; Mendes da Silva, J.A.R. Building typologies identification to support risk mitigation at the urban scale—Case study of the old city centre of Seixal, Portugal. J. Cult. Heritage 2013, 14, 449–463. [Google Scholar] [CrossRef]
- Ferreira, T.M.; Vicente, R.; Mendes da Silva, J.A.R.; Varum, H.; Costa, A. Seismic vulnerability assessment of historical urban centres: Case study of the old city centre in Seixal, Portugal. Bull. Earthq. Eng. 2013, 11, 1753–1773. [Google Scholar] [CrossRef]
- Maio, R.; Ferreira, T.M.; Vicente, R.; Costa, A. Is the use of traditional seismic strengthening strategies economically attractive in the renovation of urban cultural heritage assets in Portugal? Bull. Earthq. Eng. 2018, 17, 2307–2330. [Google Scholar] [CrossRef]
- Varum, H.; Vicente, R.; Rodrigues, H.; Mendes da Silva, J.A.R. Seismic Evaluation of Old Masonry Buildings: Performance and Strengthening. In Proceedings of the 8th International Conference on Computational Structures Technology, Las Palmas de Gran Canaria, Spain, 12–15 September 2006; pp. 1–20. [Google Scholar]
- Grünthal, G. European Macroseismic Scale 1998 (EMS-98). In Cahiers du Centre Européen de Géodynamique et de Séismologie 15. Cent. Eur; Géodynamique Séismologie: Walferdange, Luxembourg, 1998. [Google Scholar]
- Lemos, J.V. Discrete element modelling of the seismic behaviour of stone masonry arches. Comput. Methods Struct. Mason. 1997, 4, 220–227. [Google Scholar]
- DIANA 10.3. Finite Element Modelling Software; DIANA FEA: Delft, The Netherlands, 2022. [Google Scholar]
- Borri, A.; Corradi, M.; Castori, G.; De Maria, A. A method for the analysis and classification of historic masonry. Bull. Earthq. Eng. 2015, 13, 2647–2665. [Google Scholar] [CrossRef]
- Douglas, B.M.; Reid, W.H. Dynamic tests and system identification of bridges. J. Struct. Div. 1982, 108, 2295–2312. Available online: https://trid.trb.org/view/188041 (accessed on 14 June 2024). [CrossRef]
- NP EN 1998—1: 2010; Eurocode 8: Design of Structures for Earthquake Resistance—Part 1: General Rules, Seismic Actions and Rules for Buildings. IPQ: Caparica, Lisbon, 2010.
- Itasca Consulting Group I. 3DEC—Three-Dimensional Distinct Element Code; Itasca Consulting Group, Inc.: Minneapolis, IL, USA, 2016. [Google Scholar]
- Sarhosis, V.; Sheng, Y. Identification of material parameters for low bond strength masonry. Eng. Struct. 2014, 60, 100–110. Available online: https://linkinghub.elsevier.com/retrieve/pii/S0141029613006007 (accessed on 21 June 2024). [CrossRef]
- Lemos, J.V.; Campos Costa, A. Simulation of Shake Table Tests on Out-Of-Plane Masonry Buildings. Part (V): Discrete Element Approach. Int. J. Arch. Heritage 2016, 1–8. Available online: https://www.tandfonline.com/doi/full/10.1080/15583058.2016.1237587 (accessed on 26 June 2024). [CrossRef]
- Sarhosis, V.; Garrity, S.W.; Sheng, Y. Influence of brick–mortar interface on the mechanical behaviour of low bond strength masonry brickwork lintels. Eng. Struct. 2015, 88, 1–11. Available online: https://linkinghub.elsevier.com/retrieve/pii/S014102961400755X (accessed on 3 July 2024). [CrossRef]
- Oliveira, D.V.; Grecchi, G.; Mccall, A.; Noh, J.; Speer, E.; Tohidi, M. Seismic Analysis of the Roman Temple of Évora, Portugal. 15 WCEE [Internet]. Lisbon. 2012. Available online: https://repositorium.sdum.uminho.pt/bitstream/1822/22022/1/2012_Seismic analysis of the Roman Temple of Évora%2C Portugal.pdf (accessed on 5 July 2024).
- Vasconcelos, G.; Lourenço, P.B. Experimental characterization of stone masonry in shear and compression. Constr. Build. Mater. 2009, 23, 3337–3345. Available online: https://linkinghub.elsevier.com/retrieve/pii/S0950061809002177 (accessed on 14 June 2024). [CrossRef]
- NP EN 1998—3: 2017; Eurocode 8: Design of Structures for Earthquake Resistance—Part 3: Assessment and Retrofitting of Buildings. IPQ: Caparica, Lisbon, 2017.


| Location | Young’s Modulus [GPa] | |
|---|---|---|
| Direct Test | Indirect Test | |
| Column A | 25.9 | 4.6 |
| Column B | 19.3 | 4.9 |
| Wall N1 | 16.4 | - |
| Wall L | -- | 2.2 |
| Wall T1 | 18.5 | 3.9 |
| Wall T2 | 2.9 | 2.1 |
| Wall T3 | 14.9 | 4.4 |
| Wall C1 | 6.6 | 1.1 |
| Wall C2 | 7.9 | 5.4 |
| Buttress R1 | 10.9 | 4.2 |
| Buttress B1 | 22.1 | - |
| Façade FI | - | 6.9 |
| Façade FE | - | 3.6 |
| Peak Velocity x-x [mm/s] | Peak Velocity y-y [mm/s] | Peak Velocity z-z [mm/s] | |
|---|---|---|---|
| Max | 0.0391 | 0.0590 | 0.0416 |
| Min | 0 | 0 | 0 |
| Mean | 0.0013 | 0.0015 | 0.0009 |
| Median | 0.0010 | 0.0011 | 0.0007 |
| STD | 0.0012 | 0.0017 | 0.0010 |
| COV | 0.9% | 1.1% | 1.1% |
| Peak Velocity x-x [mm/s] | Peak Velocity y-y [mm/s] | Peak Velocity z-z [mm/s] | |
|---|---|---|---|
| Max | 0.0439 | 0.0359 | 0.0364 |
| Min | 0 | 0 | 0 |
| Mean | 0.0021 | 0.0020 | 0.0018 |
| Median | 0.0015 | 0.0015 | 0.0013 |
| STD | 0.0021 | 0.0018 | 0.0016 |
| COV | 1% | 0.9% | 0.9% |
| Peak Velocity x-x [mm/s] | Peak Velocity y-y [mm/s] | Peak Velocity z-z [mm/s] | |
|---|---|---|---|
| Max | 0.0471 | 0.0772 | 0.0429 |
| Min | 0 | 0 | 0 |
| Mean | 0.0021 | 0.0026 | 0.0016 |
| Median | 0.0016 | 0.0019 | 0.0012 |
| STD | 0.0021 | 0.0026 | 0.0016 |
| COV | 1% | 1% | 1% |
| Peak Velocity x-x [mm/s] | Peak Velocity y-y [mm/s] | Peak Velocity z-z [mm/s] | |
|---|---|---|---|
| Max | 0.0824 | 0.0636 | 0.1441 |
| Min | 0 | 0 | 0 |
| Mean | 0.0015 | 0.0017 | 0.0016 |
| Median | 0.0013 | 0.0014 | 0.0013 |
| STD | 0.0013 | 0.0015 | 0.0015 |
| COV | 0.9% | 0.9% | 0.9% |
| Experimental Frequency (Hz) | Numerical Frequency (Hz) | Attempts Calibration |
|---|---|---|
| 5.7 | 1.83 | E = 1.7 GPa |
| 5.7 | 3.24 | foundations level = 1.5 m, E = 5 GPa |
| 5.7 | 5.0 | foundations level = 3 m, E = 15 GPa |
| 5.7 | 5.76 | foundations level = 3 m, E = 16 GPa |
| Location | Young’s Modulus [GPa] | v | Density [kg/m3] | ft [MPa] | fc [MPa] | Gt [N/m] | Gc [kN/m] | |||
|---|---|---|---|---|---|---|---|---|---|---|
| Prior | After | Prior | After | Prior | After | After | After | |||
| Arcade arches | 35.0 | 35.0 | 0.2 | 2240 | 0.2 | 0.2 | 59 | 59 | 50 | 28 |
| Arcade columns | 35.0 | 35.0 | 0.2 | 2240 | 0.2 | 0.2 | 59 | 59 | 50 | 28 |
| Arcade filling | 2.9 | 2.4 | 0.2 | 2140 | 0.15 | 0.15 | 3.9 | 3.9 | 50 | 6.3 |
| Longitudinal walls | 18.0 | 18.0 | 0.2 | 2140 | 0.2 | 0.2 | 30 | 30 | 50 | 25 |
| Chapels filling | 1.0 | 1.0 | 0.2 | 2000 | 0.1 | 0.1 | 1.7 | 1.7 | 25 | 2.7 |
| Transverse walls of the chapels and main façade | 2.9 | 2.9 | 0.2 | 2140 | 0.15 | 0.15 | 4.8 | 4.8 | 50 | 7.7 |
| Joint Normal Stiffness (MPa/m) | Joint Shear Stiffness (MPa/m) | Friction Angle | Cohesion | Joint Tensile Stiffness (MPa/m) |
|---|---|---|---|---|
| 2200 | 880 | 35 | 400 | 200 |
Disclaimer/Publisher’s Note: The statements, opinions and data contained in all publications are solely those of the individual author(s) and contributor(s) and not of MDPI and/or the editor(s). MDPI and/or the editor(s) disclaim responsibility for any injury to people or property resulting from any ideas, methods, instructions or products referred to in the content. |
© 2024 by the authors. Licensee MDPI, Basel, Switzerland. This article is an open access article distributed under the terms and conditions of the Creative Commons Attribution (CC BY) license (https://creativecommons.org/licenses/by/4.0/).
Share and Cite
Mendes, N.; Bianchini, N.; Karanikoloudis, G.; Blyth, A.; Scacco, J.; Flores Salazar, L.G.; Cullimore, C.; Jain, L. Preservation and Protection of Cultural Heritage: Vibration Monitoring and Seismic Vulnerability of the Ruins of Carmo Convent (Lisbon). Sensors 2024, 24, 6095. https://doi.org/10.3390/s24186095
Mendes N, Bianchini N, Karanikoloudis G, Blyth A, Scacco J, Flores Salazar LG, Cullimore C, Jain L. Preservation and Protection of Cultural Heritage: Vibration Monitoring and Seismic Vulnerability of the Ruins of Carmo Convent (Lisbon). Sensors. 2024; 24(18):6095. https://doi.org/10.3390/s24186095
Chicago/Turabian StyleMendes, Nuno, Nicoletta Bianchini, Georgios Karanikoloudis, Anna Blyth, Jacopo Scacco, Luis Gerardo Flores Salazar, Cassie Cullimore, and Lavina Jain. 2024. "Preservation and Protection of Cultural Heritage: Vibration Monitoring and Seismic Vulnerability of the Ruins of Carmo Convent (Lisbon)" Sensors 24, no. 18: 6095. https://doi.org/10.3390/s24186095
APA StyleMendes, N., Bianchini, N., Karanikoloudis, G., Blyth, A., Scacco, J., Flores Salazar, L. G., Cullimore, C., & Jain, L. (2024). Preservation and Protection of Cultural Heritage: Vibration Monitoring and Seismic Vulnerability of the Ruins of Carmo Convent (Lisbon). Sensors, 24(18), 6095. https://doi.org/10.3390/s24186095