A Study on Sensitivity Improvement of the Fiber Optic Acoustic Sensing System Based on Sagnac Interference


Abstract
:1. Introduction
2. Structural Analysis
2.1. Linear Sagnac Fiber Optic Acoustic Sensing System
2.2. Pickup Structure Analysis
3. Simulations
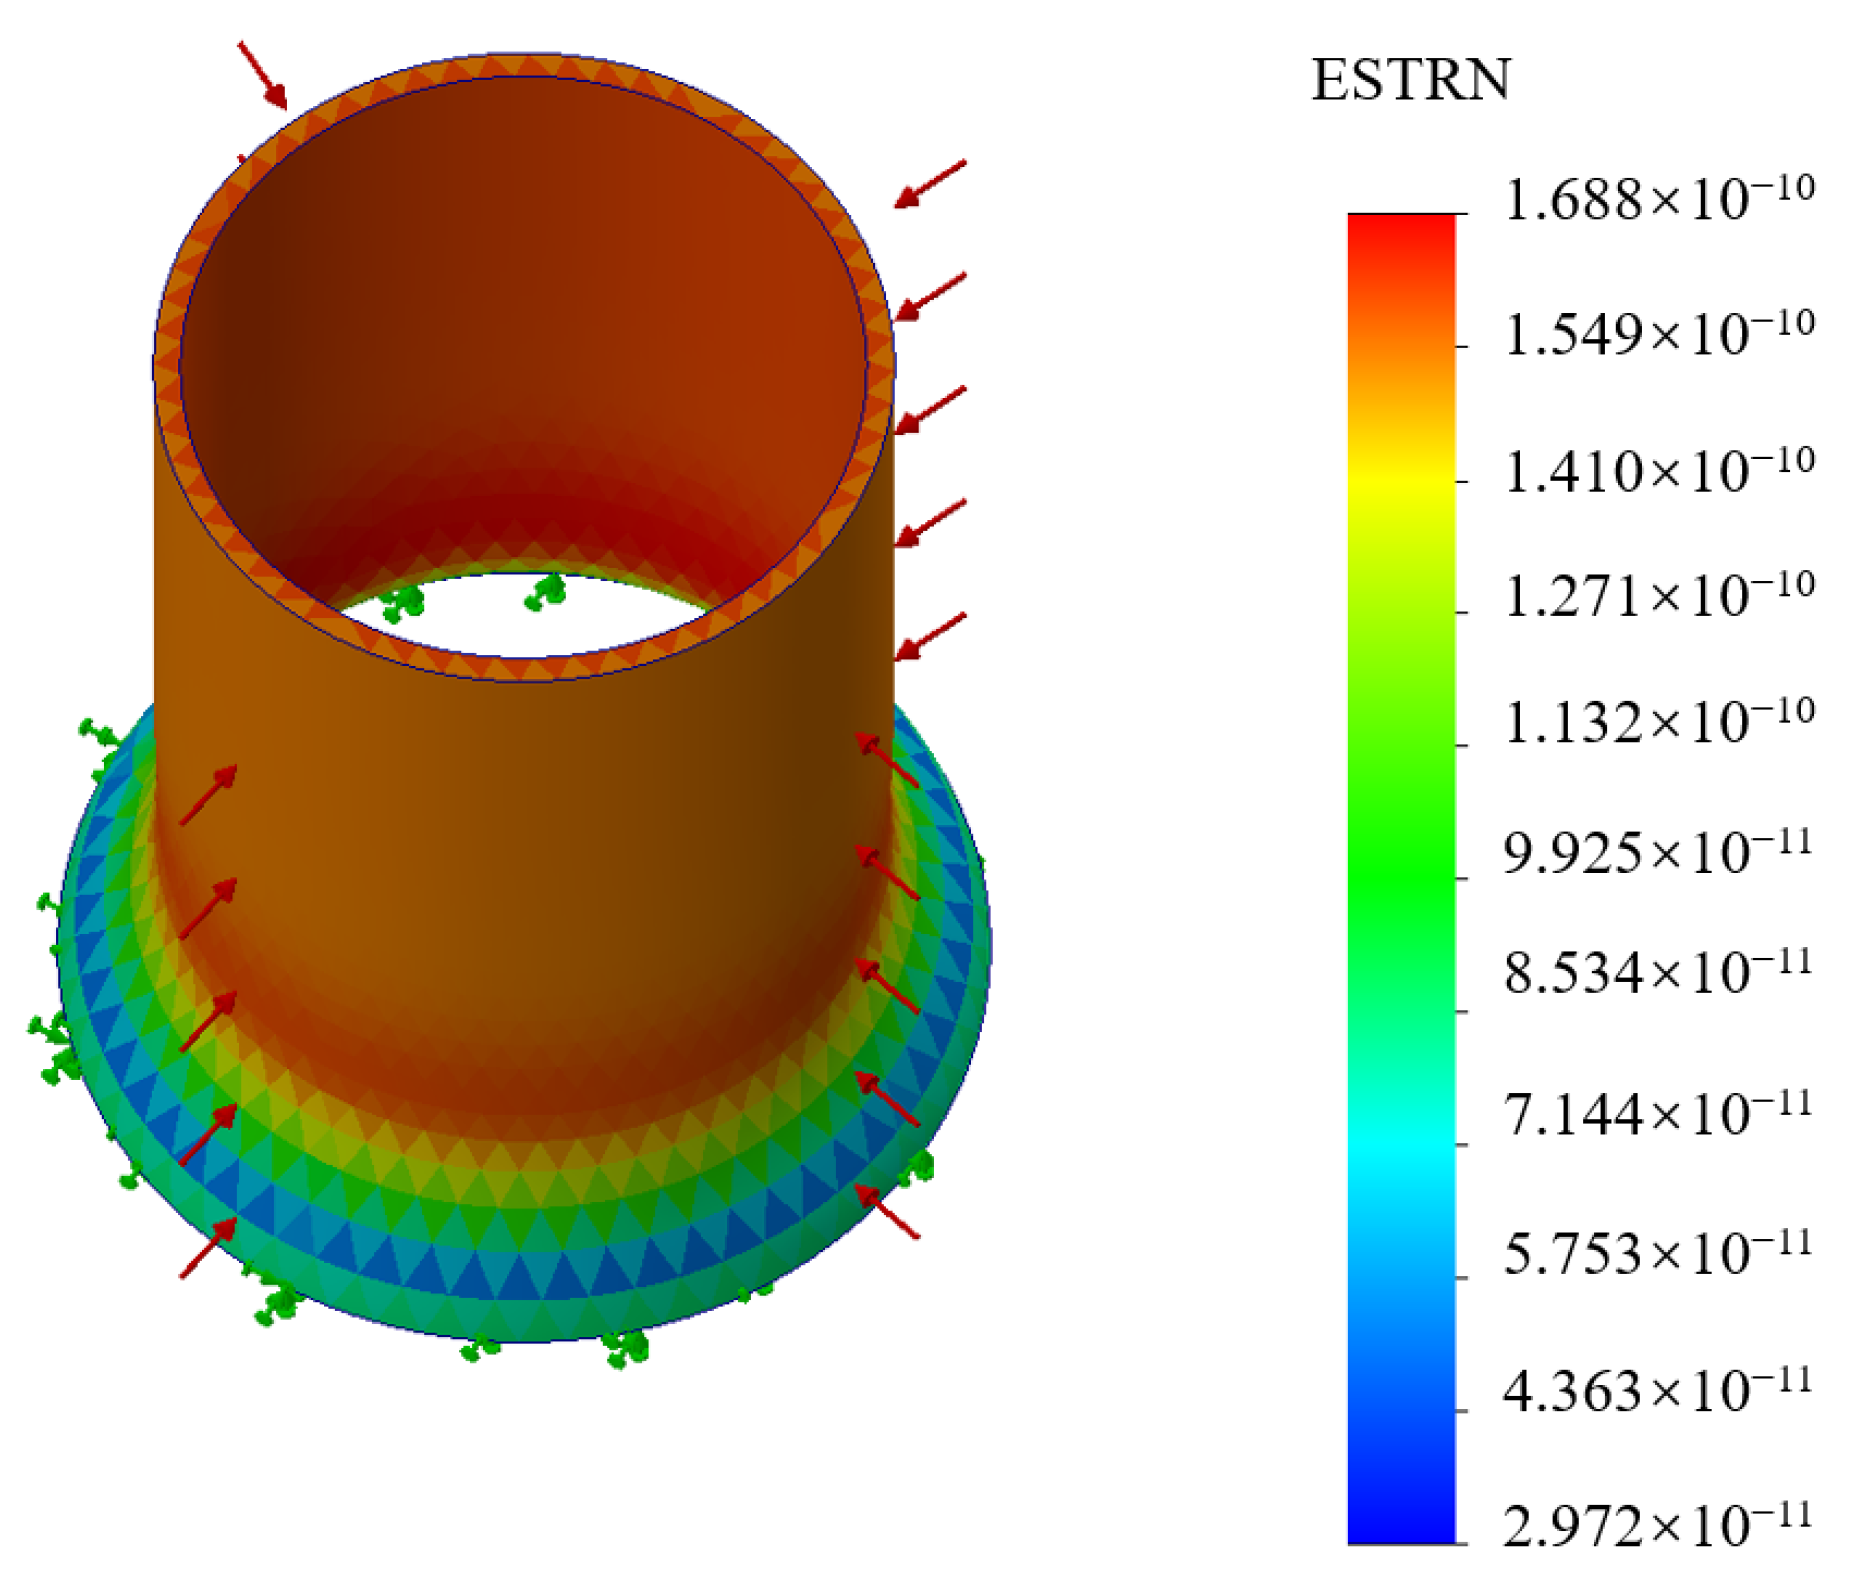
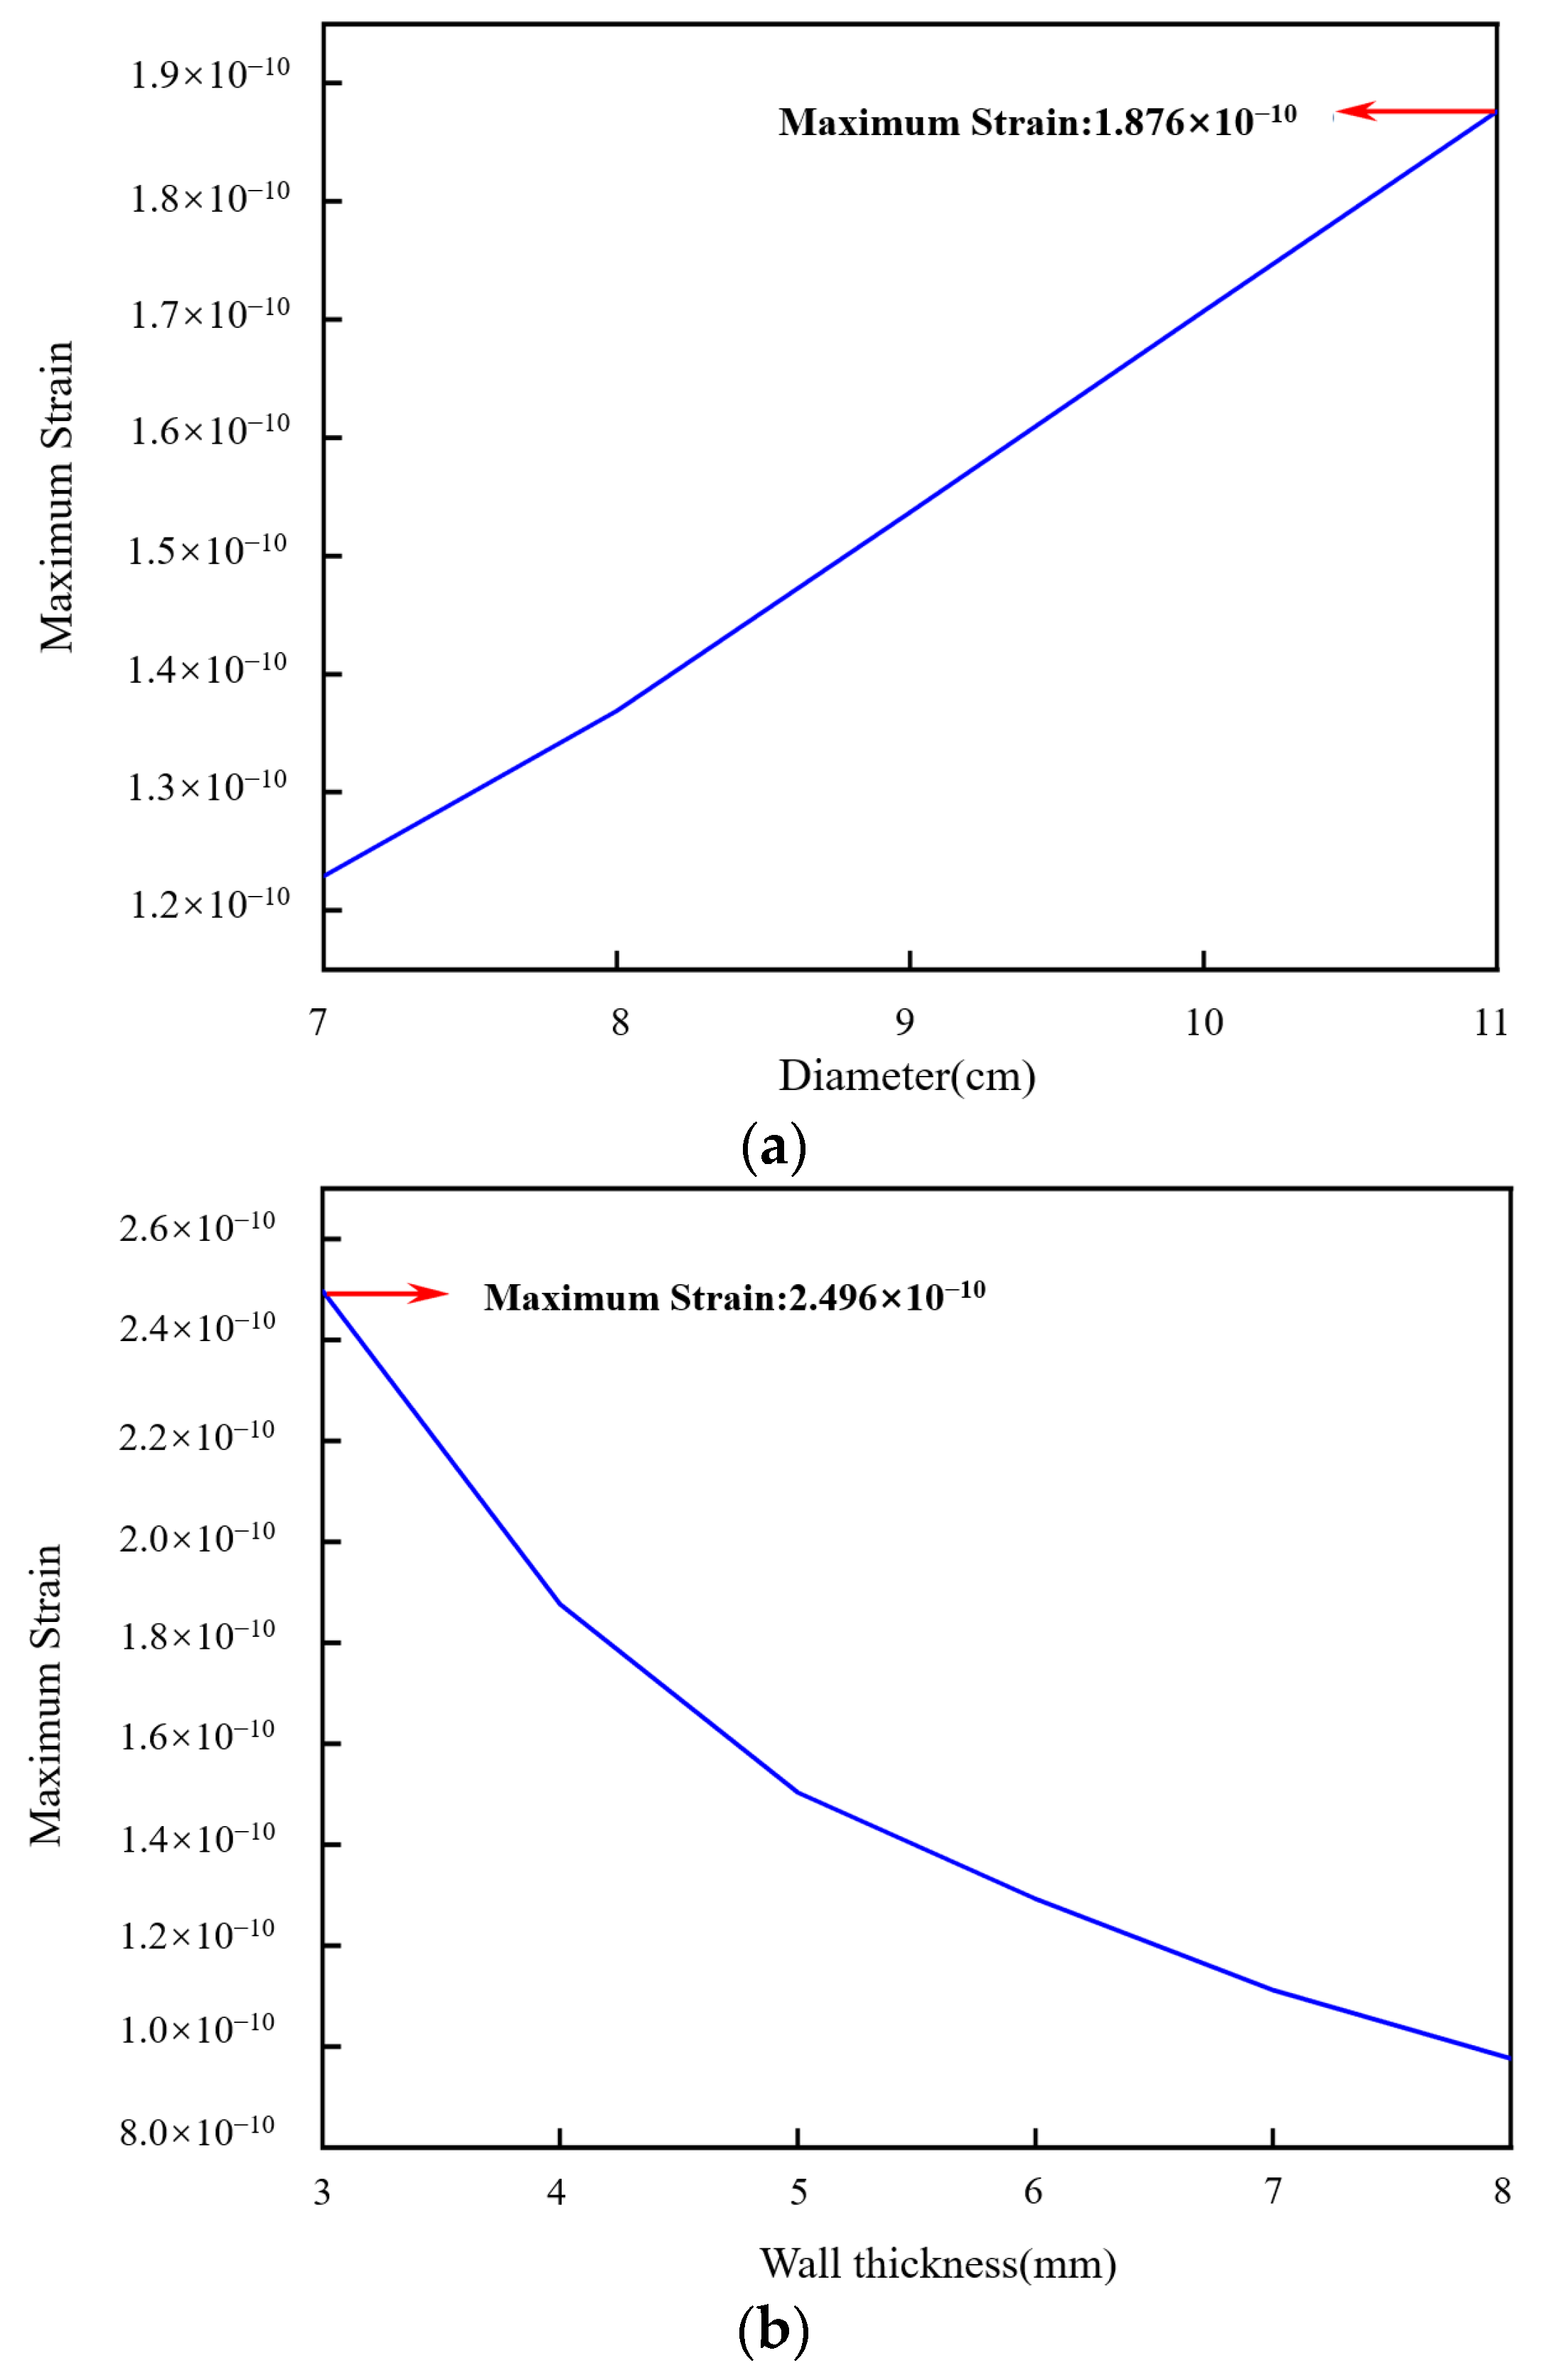
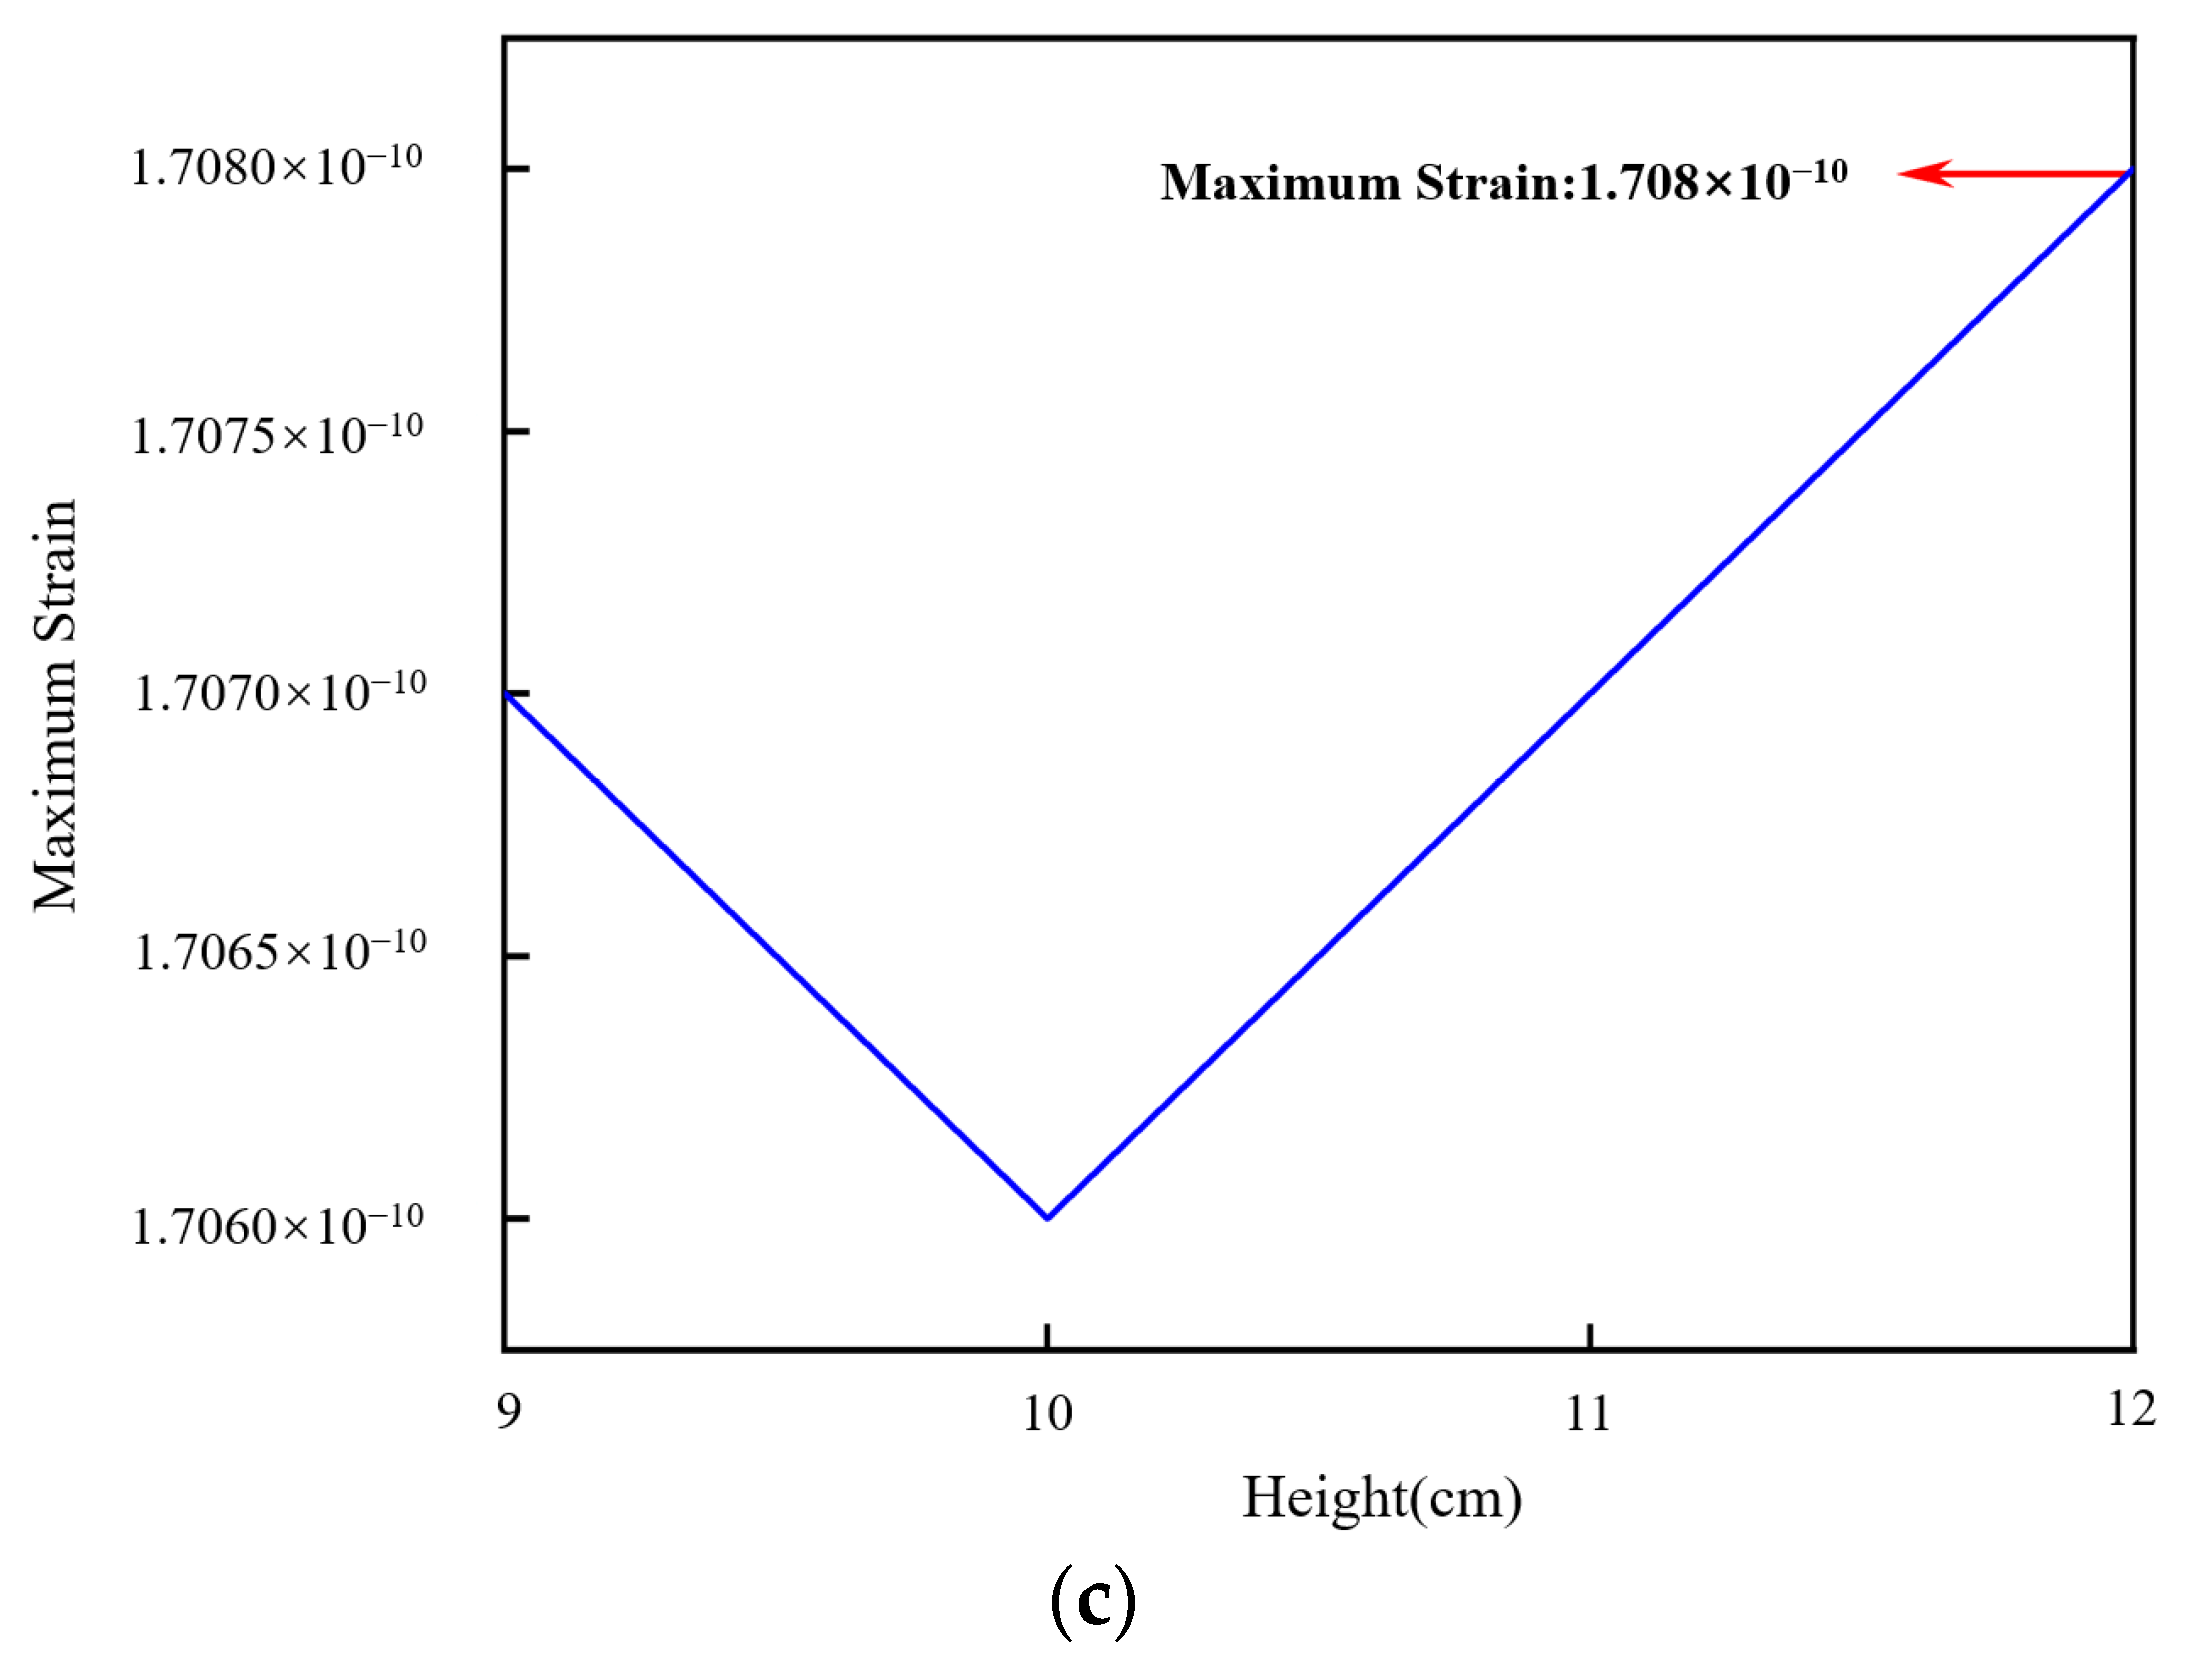
3.1. The Basic Elastomer Cylinder
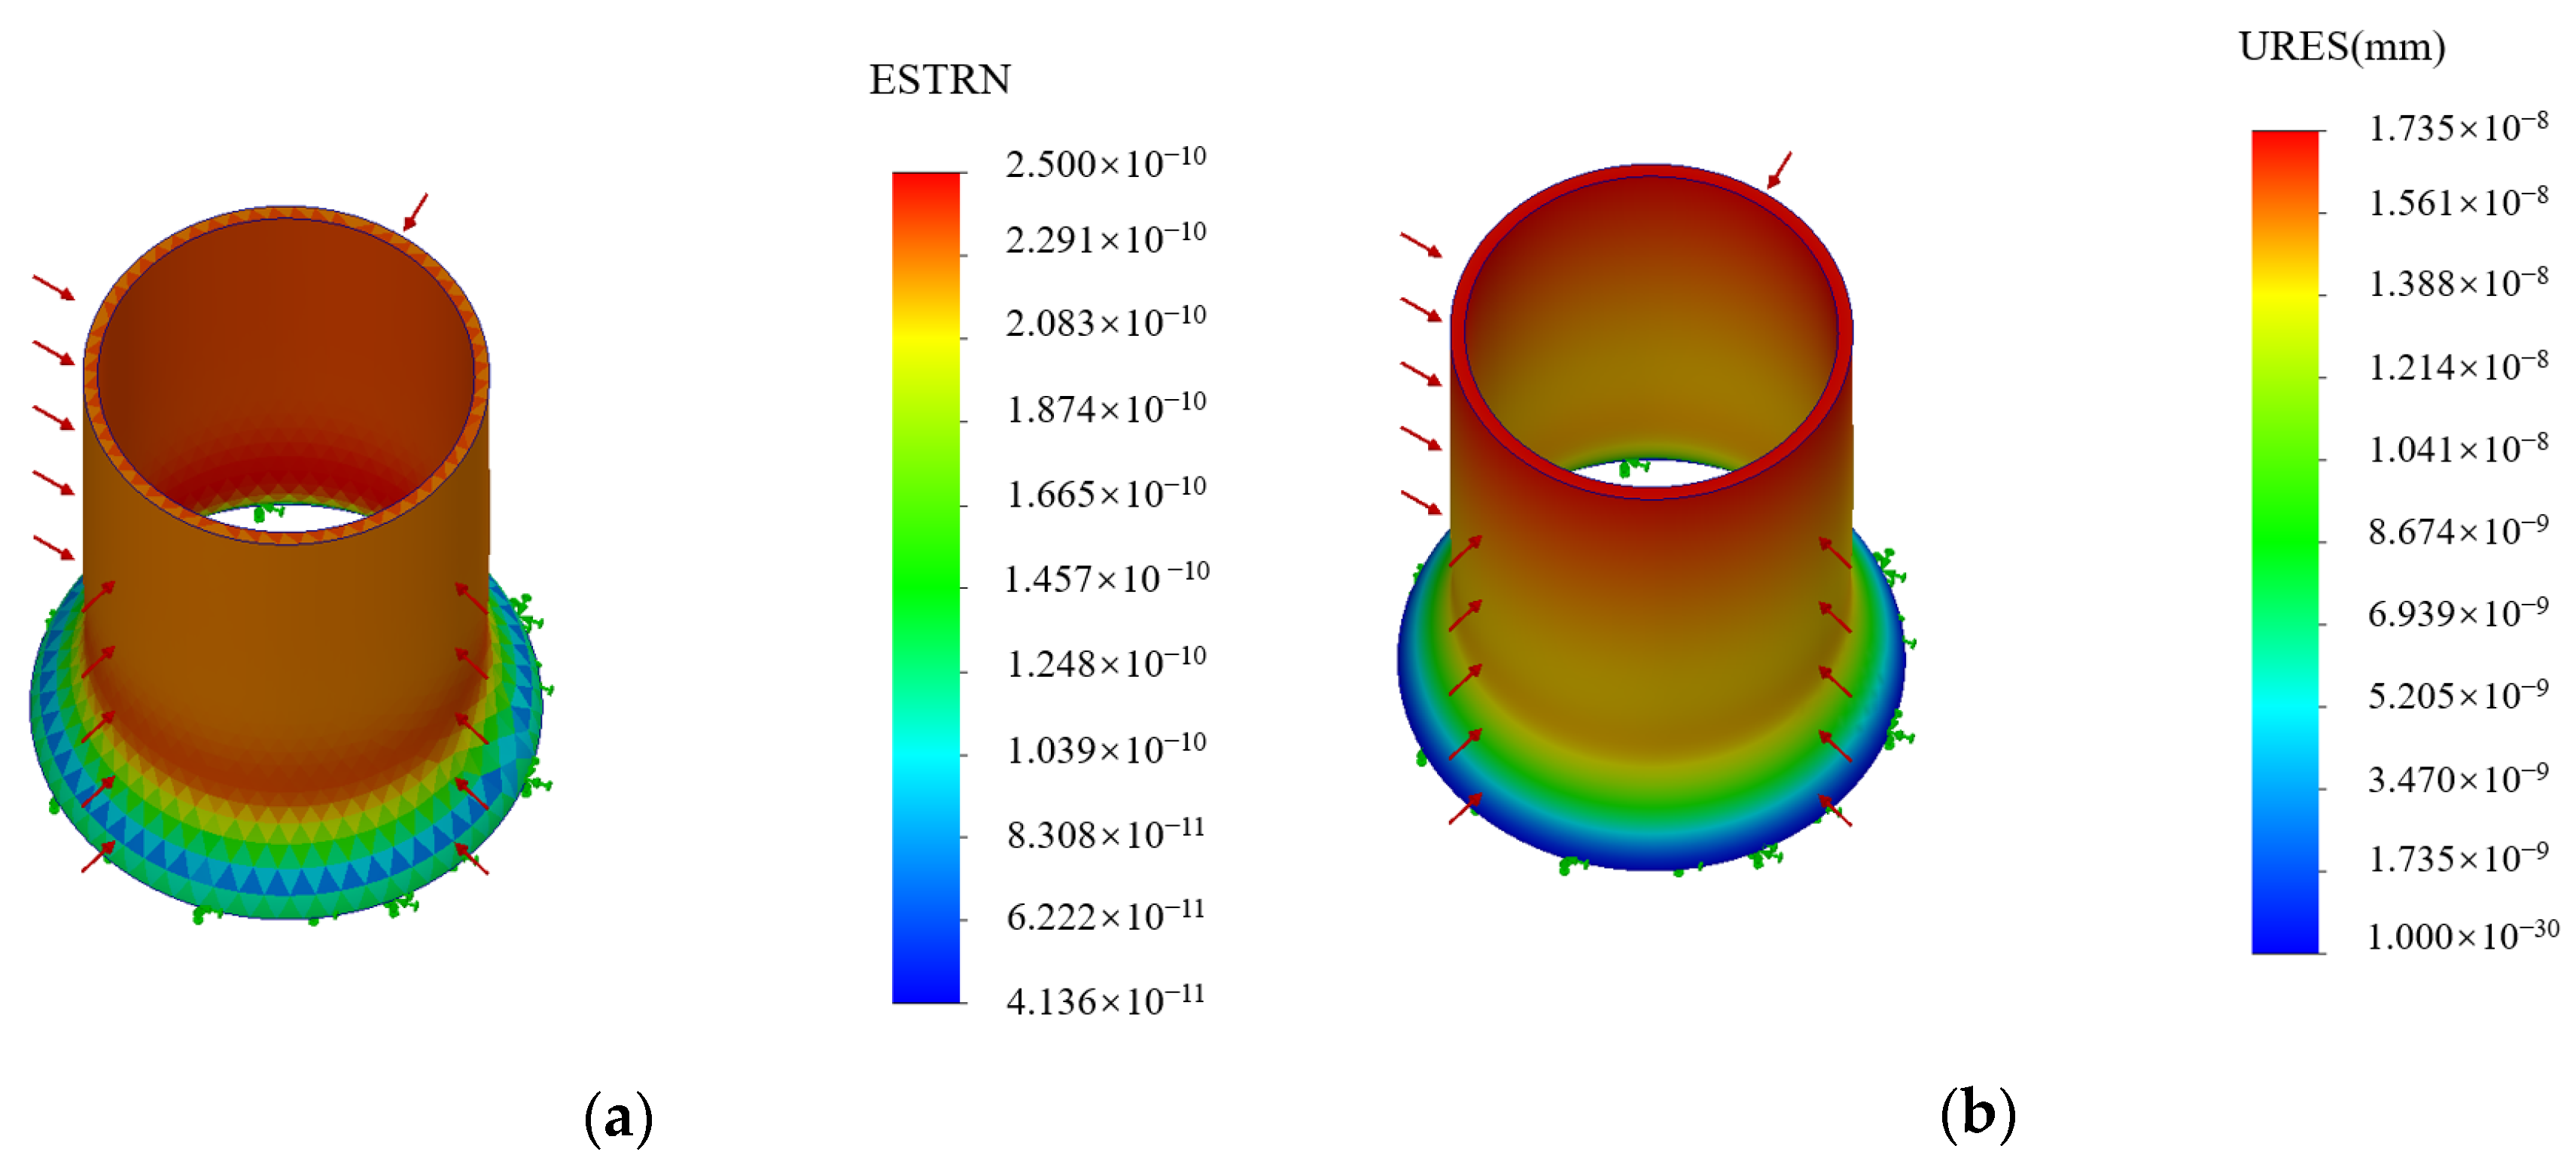
3.2. Improved Elastomer Cylinder
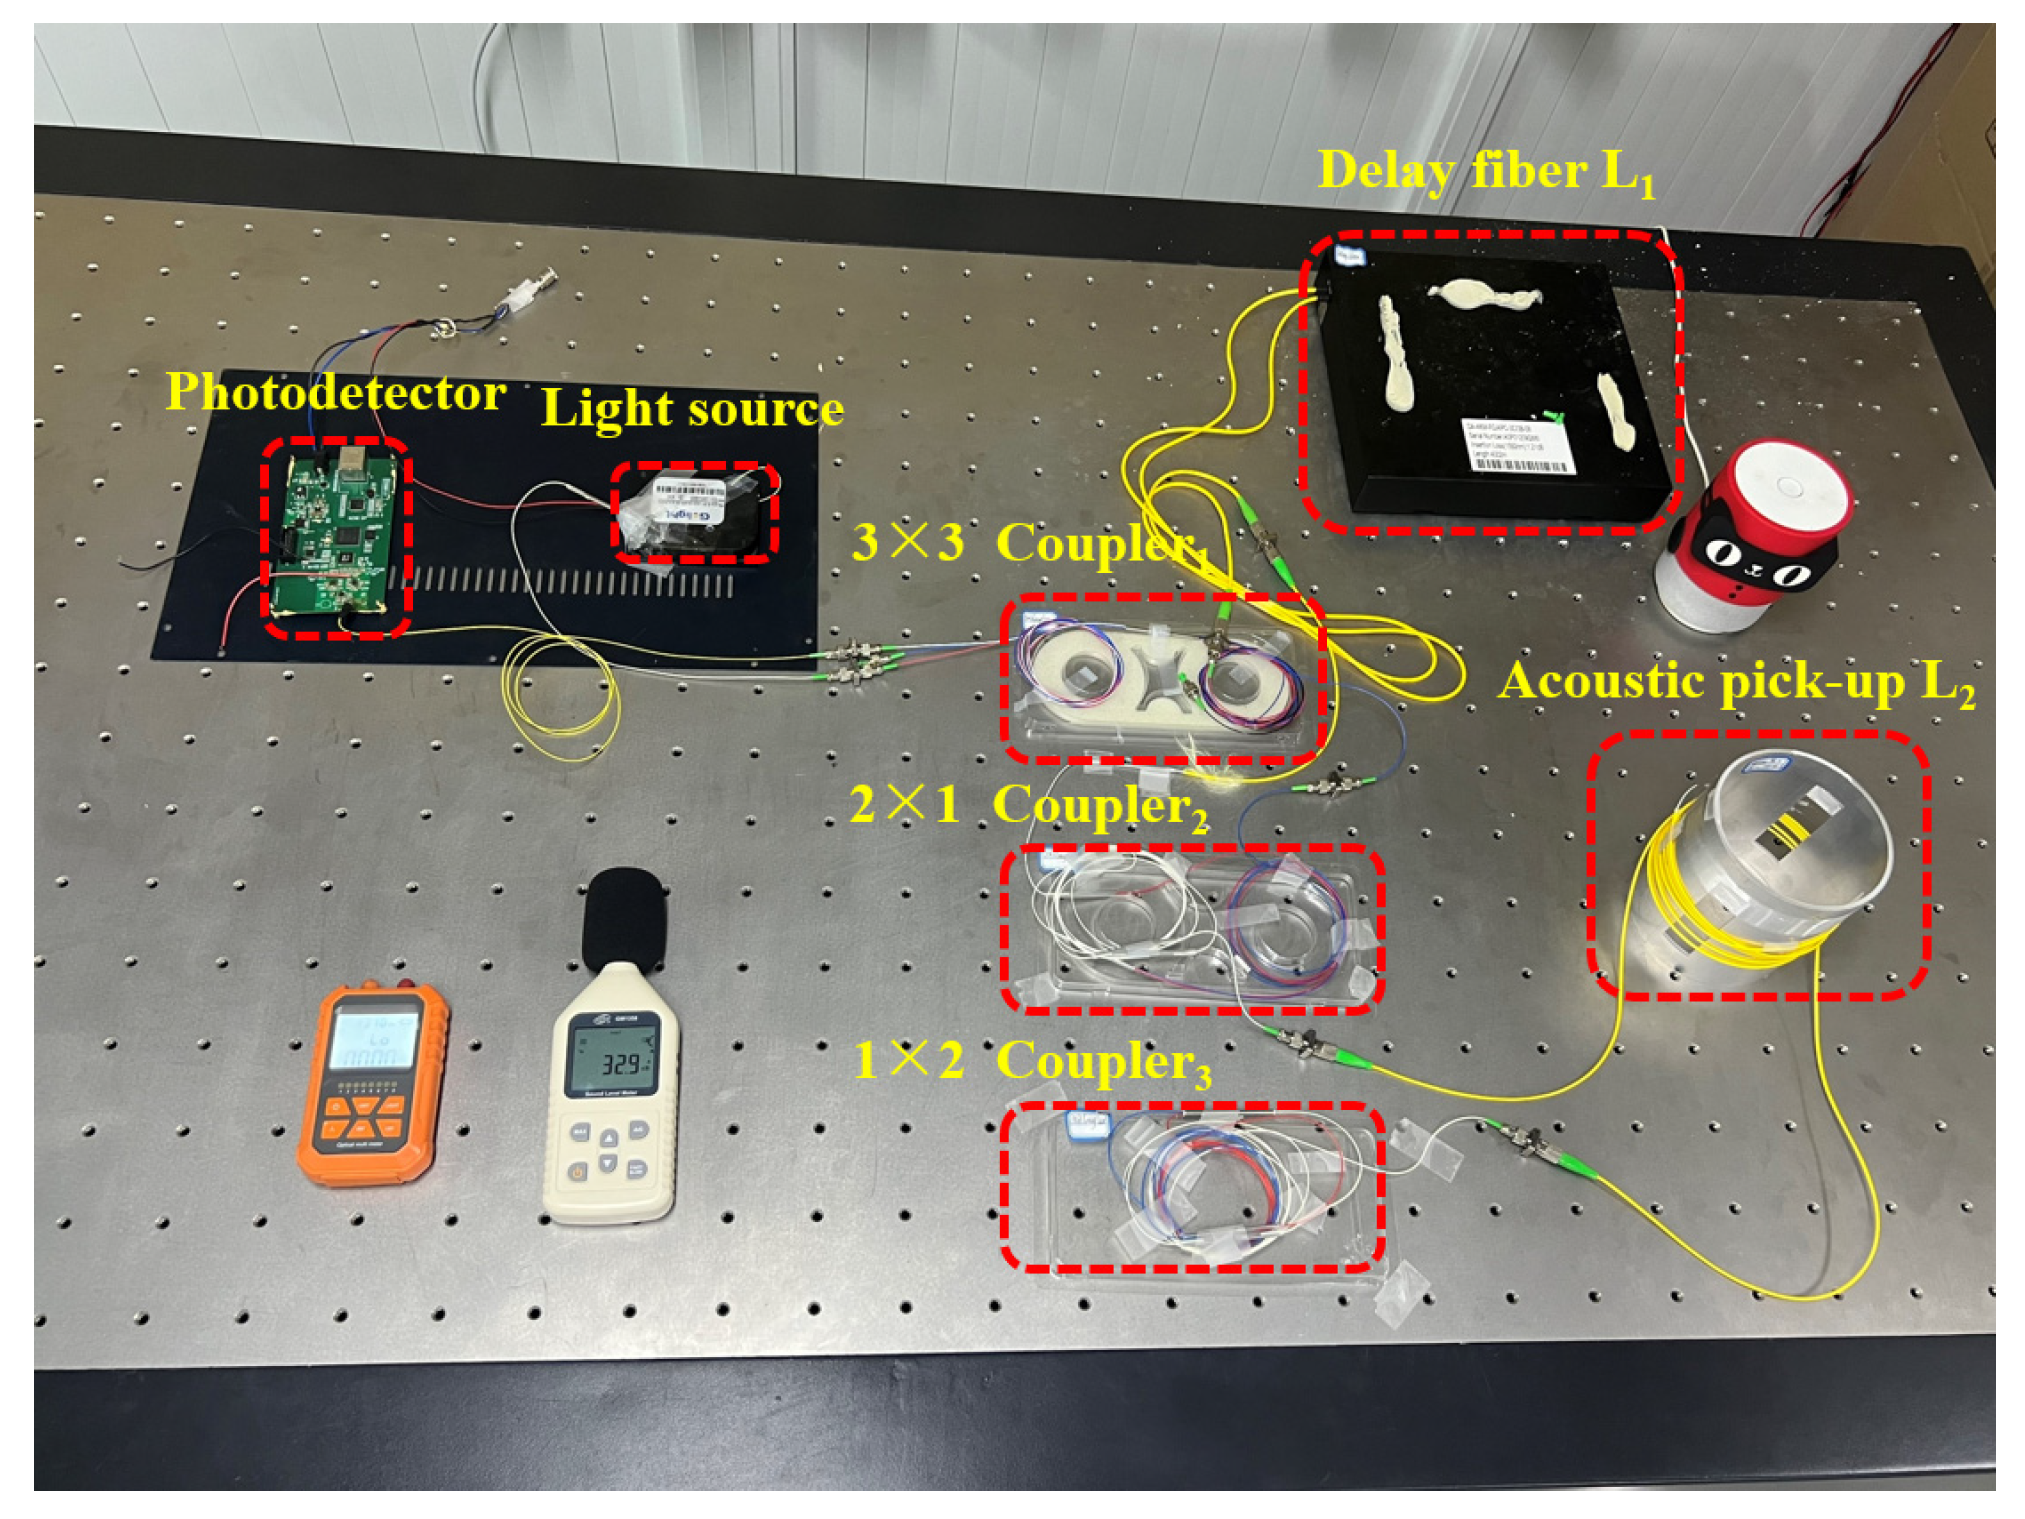
4. Experiments
5. Conclusions
Author Contributions
Funding
Institutional Review Board Statement
Informed Consent Statement
Data Availability Statement
Conflicts of Interest
References
- Fischer, B. Optical microphone hears ultrasound. Nat. Photonics 2016, 10, 356–358. [Google Scholar] [CrossRef]
- Preisser, S.; Rohringer, W.; Liu, M.; Kollmann, C.; Zotter, S.; Fischer, B.; Drexler, W. All-optical highly sensitive akinetic sensor for ultrasound detection and photoacoustic imaging. Biomed. Opt. Express 2016, 7, 4171–4186. [Google Scholar] [CrossRef]
- Wang, L.; Fang, N.; Wu, C.; Qin, H.; Huang, Z. A fiber optic PD sensor using a balanced Sagnac interferometer and an EDFA-based DOP tunable fiber ring laser. Sensors 2014, 14, 8398–8422. [Google Scholar] [CrossRef] [PubMed]
- Zhu, H.H.; Liu, W.; Wang, T.; Su, J.W.; Shi, B. Distributed acoustic sensing for monitoring linear infrastructures: Current status and trends. Sensors 2022, 22, 7550. [Google Scholar] [CrossRef] [PubMed]
- Liu, X.; Jin, B.; Bai, Q.; Wang, Y.; Wang, D.; Wang, Y. Distributed fiber-optic sensors for vibration detection. Sensors 2016, 16, 1164. [Google Scholar] [CrossRef] [PubMed]
- Gorshkov, B.G.; Yüksel, K.; Fotiadi, A.A.; Wuilpart, M.; Korobko, D.A.; Zhirnov, A.A.; Lobach, I.A. Scientific applications of distributed acoustic sensing: State-of-the-art review and perspective. Sensors 2022, 22, 1033. [Google Scholar] [CrossRef] [PubMed]
- Ma, Y.X.; Song, Y.C.; Song, Q.H.; Xiao, Q.; Jia, B. MI-SI Based Distributed Optical Fiber Sensor for No-Blind Zone Location and Pattern Recognition. J. Light. Technol. 2022, 40, 3022–3030. [Google Scholar] [CrossRef]
- Lu, Y.; Zhu, T.; Chen, L.; Bao, X. Distributed vibration sensor based on coherent detection of phase-OTDR. J. Light. Technol. 2010, 28, 3243–3249. [Google Scholar]
- Miliou, A. In-fiber interferometric-based sensors: Overview and recent advances. Photonics 2021, 8, 265. [Google Scholar] [CrossRef]
- Vasiljević-Toskić, M.M.; Bajić, J.S.; Manojlović, L.M.; Đonlagić, D. A simple fiber optic sensing system based on dual Sagnac interferometer for disturbance location detection. Opt. Laser Technol. 2024, 170, 110240. [Google Scholar] [CrossRef]
- Zhu, X.; Pan, Y.; Sun, A.; Liu, W.; Song, M.; Liu, X.; Wu, W. High sensitivity Mach–Zehnder interferometer based on peanut-shaped hollow-core fiber. Opt. Commun. 2023, 542, 129566. [Google Scholar] [CrossRef]
- Lee, B.H.; Kim, Y.H.; Park, K.S.; Eom, J.B.; Kim, M.J.; Rho, B.S.; Choi, H.Y. Interferometric fiber optic sensors. Sensors 2012, 12, 2467–2486. [Google Scholar] [CrossRef] [PubMed]
- Pizzaia, J.P.L.; Castellani, C.E.S.; Leal-Junior, A.G. Highly sensitive temperature sensing based on a birefringent fiber Sagnac loop. Opt. Fiber Technol. 2022, 72, 102949. [Google Scholar] [CrossRef]
- Gritsenko, T.V.; Dyakova, N.V.; Zhirnov, A.A.; Stepanov, K.V.; Khan, R.I.; Koshelev, K.I.; Karasik, V.E. Study of Sensitivity Distribution Along the Contour of a Fiber-Optic Sensor Based on a Sagnac Interferometer. Instrum. Exp. Tech. 2023, 66, 788–794. [Google Scholar] [CrossRef]
- Wang, H.; Sun, Q.; Li, X.; Wo, J.; Shum, P.P.; Liu, D. Improved location algorithm for multiple intrusions in distributed Sagnac fiber sensing system. Opt. Express 2014, 22, 7587–7597. [Google Scholar] [CrossRef] [PubMed]
- Shao, L.; Hu, J.; Lu, H.; Du, J.; Wu, T.; Wang, Y. High-sensitivity temperature sensor based on polarization maintaining fiber Sagnac loop. Photonic Sens. 2019, 9, 25–32. [Google Scholar] [CrossRef]
- Chen, J.; Wang, J.; Wang, N.; Ruan, J.; Zhang, J.; Zhu, Y. An Improved Acoustic Pick-Up for Straight Line-Type Sagnac Fiber Optic Acoustic Sensing System. Sensors 2022, 22, 8193. [Google Scholar] [CrossRef] [PubMed]
- Wang, J.; Tang, R.; Chen, J.; Wang, N.; Zhu, Y.; Zhang, J.; Ruan, J. Study of Straight-Line-Type Sagnac Optical Fiber Acoustic Sensing System. Photonics 2023, 10, 83. [Google Scholar] [CrossRef]
- Landau, L.D.; Pitaevskii, L.P.; Kosevich, A.M.; Lifshitz, E.M. Theory of Elasticity; Elsevier: Amsterdam, The Netherlands, 2012; Volume 7, pp. 185–187. [Google Scholar]
- Niu, X.; Huang, Y.; Zhang, L.; Wang, L.; Hu, C.; Deng, C.; Wu, P.; Lu, Y.; Li, Q.; Zhang, Q.; et al. A sensitivity-enhanced fiber optic Fabry-Perot acoustic sensor based on grooved diaphragm. IEEE Photonics Technol. Lett. 2023, 35, 422–425. [Google Scholar] [CrossRef]

| Material | Maximum Strain |
|---|---|
| Iron | 9.673 × 10⁻¹¹ |
| Stainless steel | 6.024 × 10⁻¹¹ |
| Copper | 1.100 × 10⁻¹⁰ |
| Aluminum | 1.706 × 10⁻¹⁰ |
| Titanium | 1.153 × 10⁻¹⁰ |
| Sizes of the Pickups | Average Peak-To-Peak Sensitivity of the Ungrooved Pickup (mV/Pa) | Average Peak-to-Peak Sensitivity of Grooved Pickups (mV/Pa) | Percentage of Growth |
|---|---|---|---|
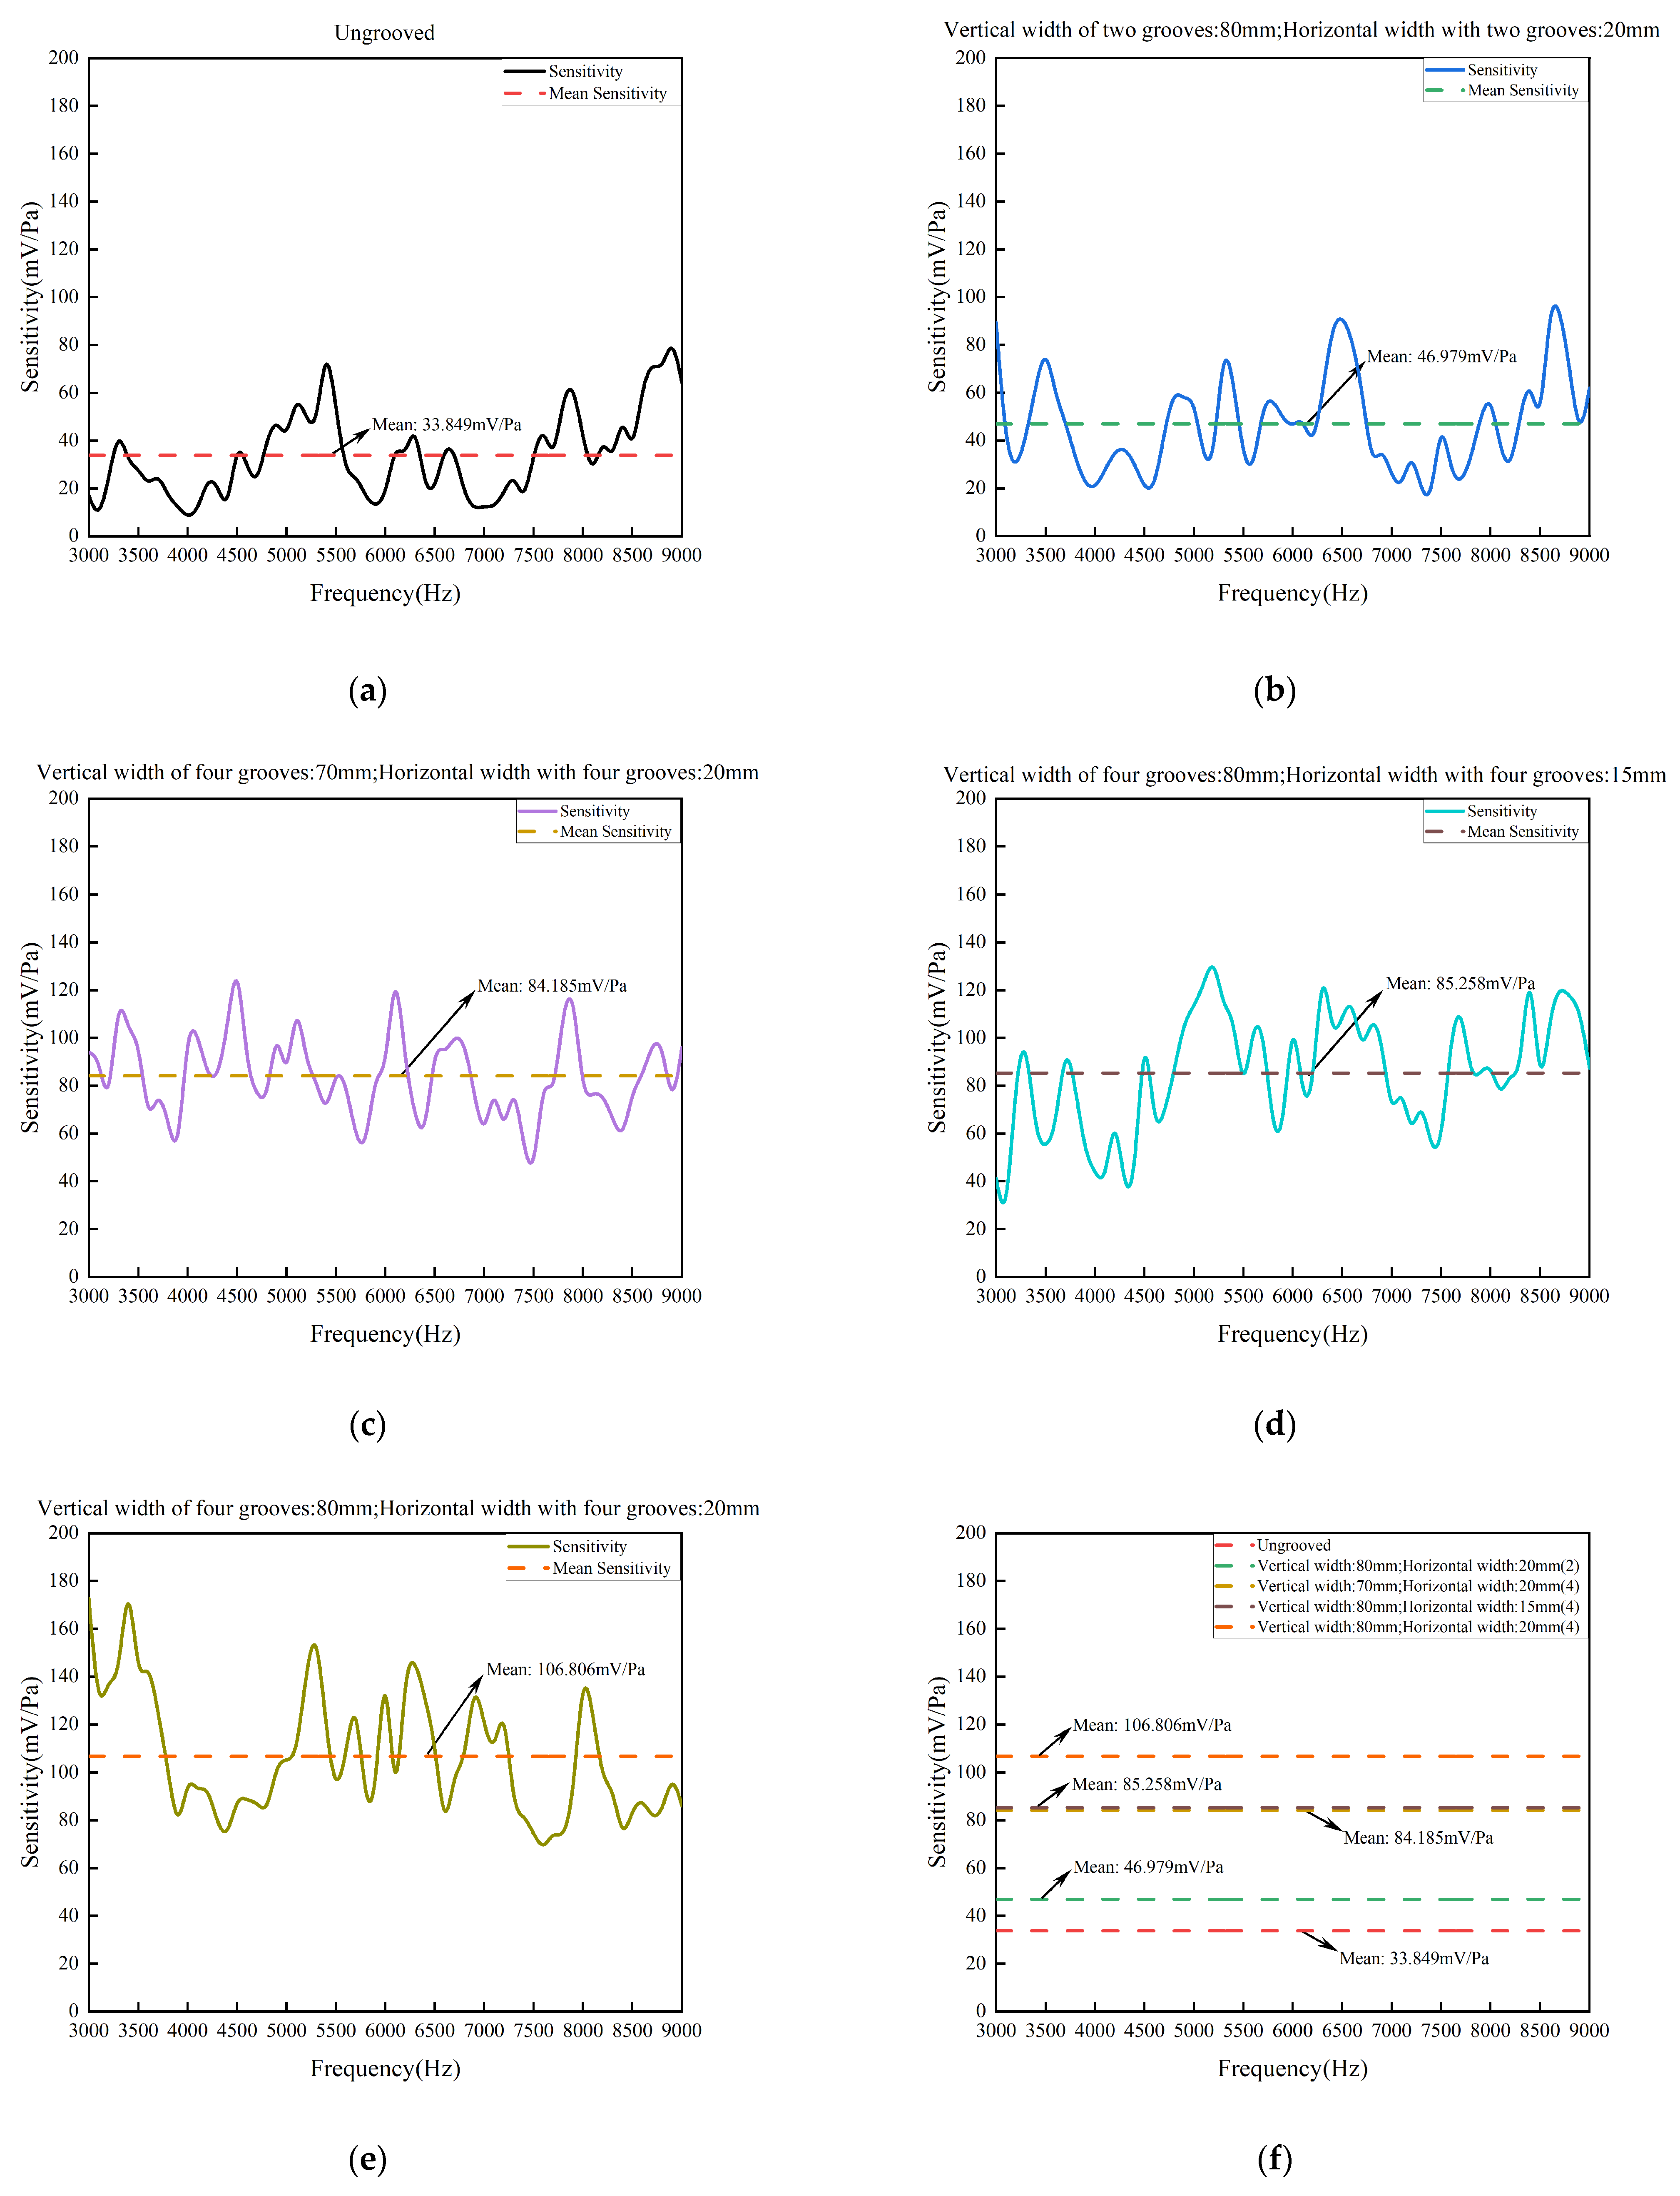
| Ungrooved | 33.849 | / | / |
| V: 80 mm; H: 20 mm (2) | 33.849 | 46.979 | 38.79% |
| V: 70 mm; H: 20 mm (4) | 33.849 | 84.185 | 148.71% |
| V: 80 mm; H: 15 mm (4) | 33.849 | 85.258 | 151.88% |
| V: 80 mm; H: 20 mm (4) | 33.849 | 106.806 | 215.54% |
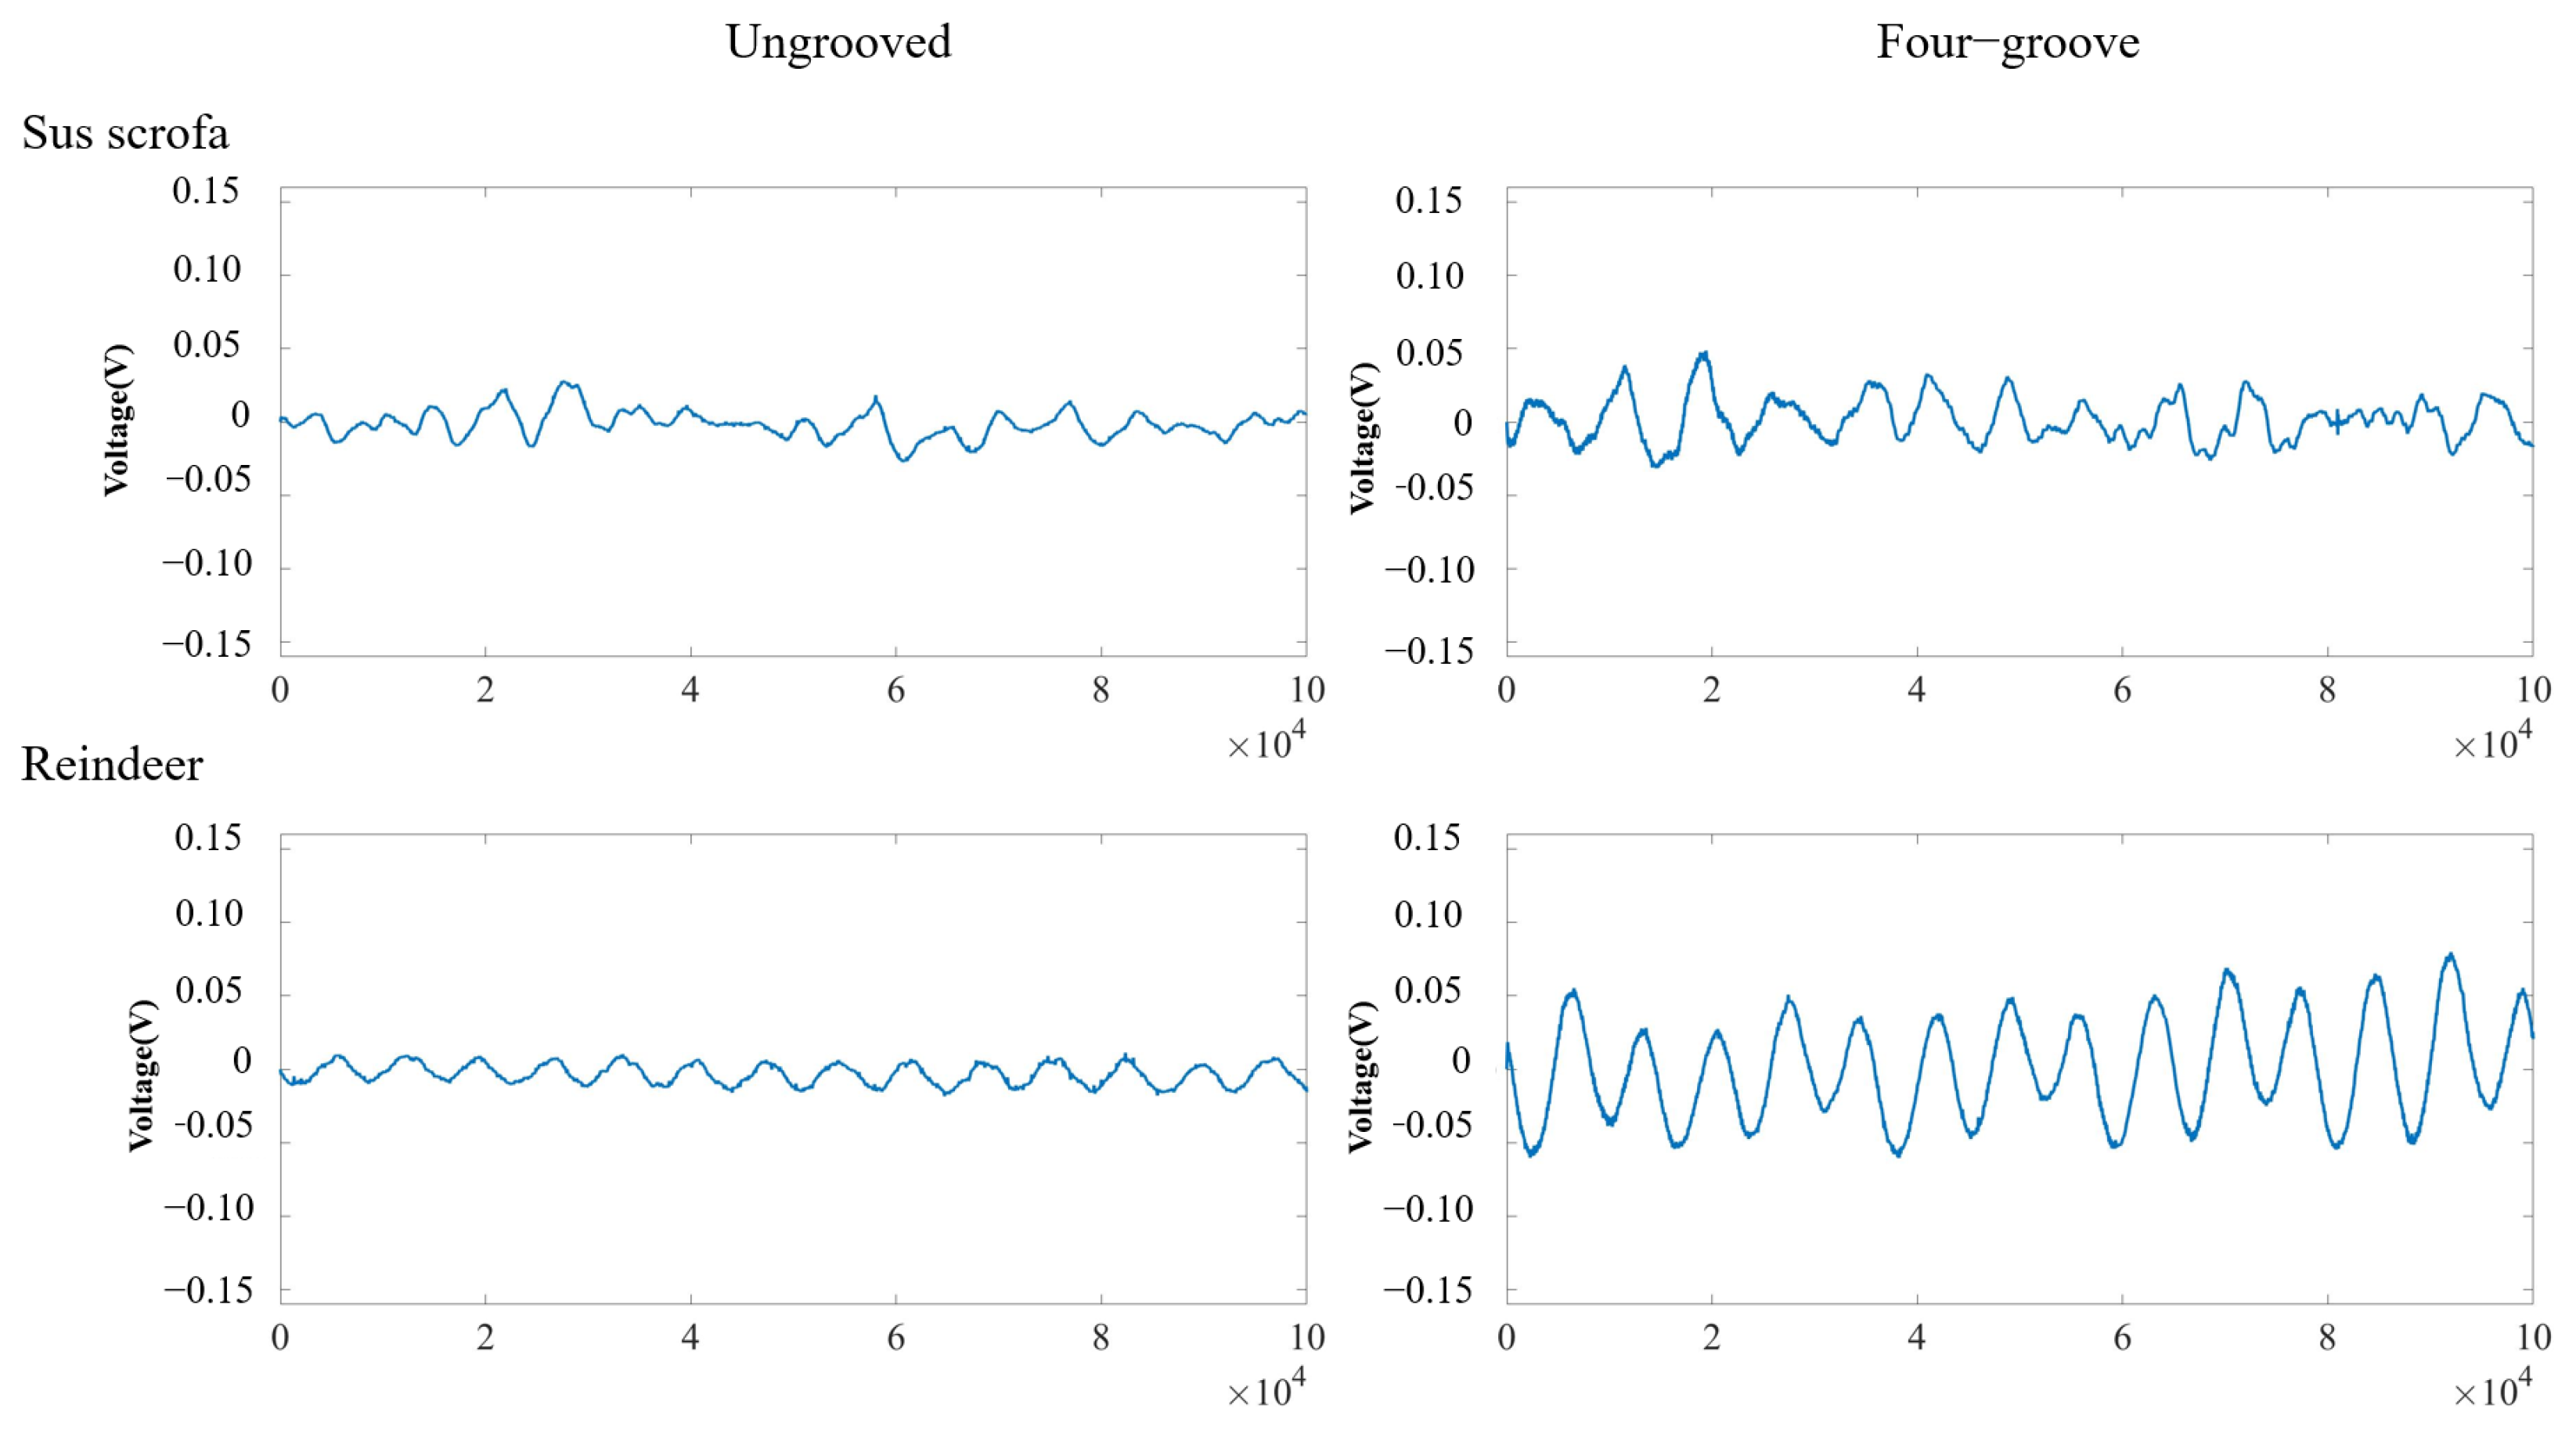
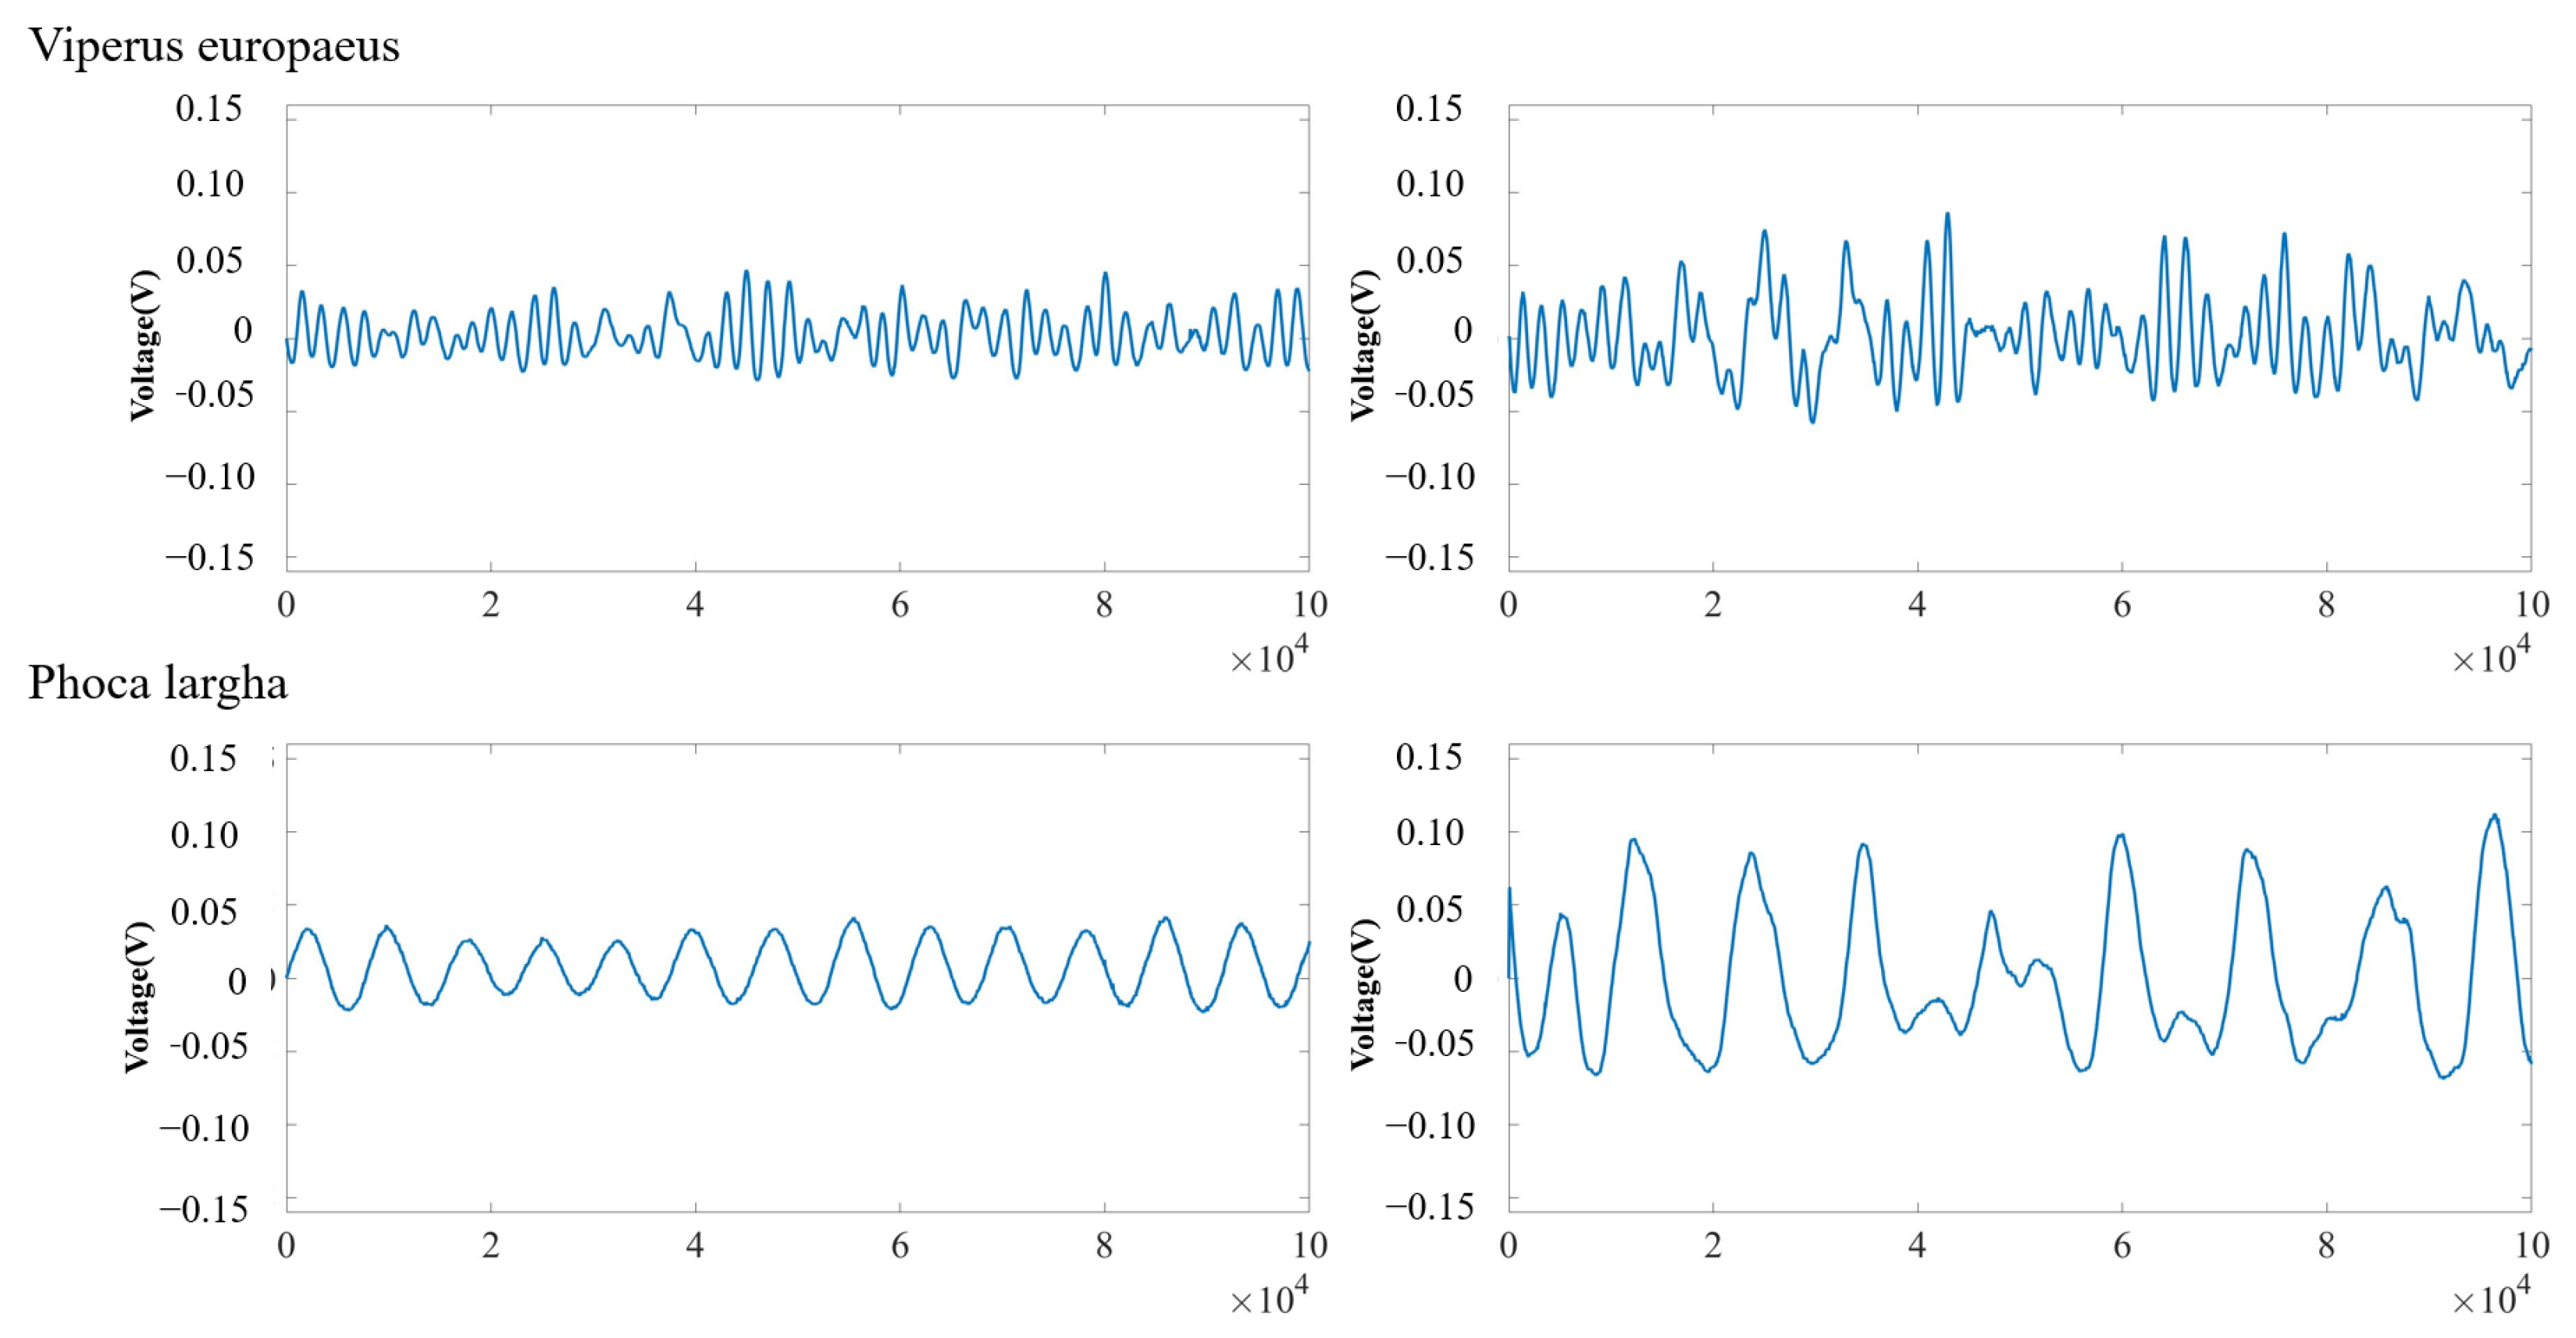
| Natural Sounds | Peak-To-Peak Value of the Ungrooved Pickup (V) | Peak-To-Peak Value of the Four-Groove Pickup (V) | Percentage of Growth |
|---|---|---|---|
| Sus scrofa | 0.055 | 0.080 | 45.45% |
| Reindeer | 0.029 | 0.140 | 382.76% |
| Viperus europaeus | 0.076 | 0.145 | 90.79% |
| Phoca largha | 0.065 | 0.182 | 180.00% |
Disclaimer/Publisher’s Note: The statements, opinions and data contained in all publications are solely those of the individual author(s) and contributor(s) and not of MDPI and/or the editor(s). MDPI and/or the editor(s) disclaim responsibility for any injury to people or property resulting from any ideas, methods, instructions or products referred to in the content. |
© 2024 by the authors. Licensee MDPI, Basel, Switzerland. This article is an open access article distributed under the terms and conditions of the Creative Commons Attribution (CC BY) license (https://creativecommons.org/licenses/by/4.0/).
Share and Cite
Tang, R.; Zhao, H.; Feng, J.; Wang, J.; Wang, N.; Ruan, J.; Chen, J. A Study on Sensitivity Improvement of the Fiber Optic Acoustic Sensing System Based on Sagnac Interference. Sensors 2024, 24, 6188. https://doi.org/10.3390/s24196188
Tang R, Zhao H, Feng J, Wang J, Wang N, Ruan J, Chen J. A Study on Sensitivity Improvement of the Fiber Optic Acoustic Sensing System Based on Sagnac Interference. Sensors. 2024; 24(19):6188. https://doi.org/10.3390/s24196188
Chicago/Turabian StyleTang, Ruixi, Hongcheng Zhao, Juqin Feng, Jiang Wang, Ning Wang, Jun Ruan, and Jianjun Chen. 2024. "A Study on Sensitivity Improvement of the Fiber Optic Acoustic Sensing System Based on Sagnac Interference" Sensors 24, no. 19: 6188. https://doi.org/10.3390/s24196188