Article

Combined Filtering Method for Offshore Oil and Gas Platform Point Cloud Data Based on KNN_PCF and Hy_WHF and Its Application in 3D Reconstruction

1
College of Ocean Science and Engineering, Shandong University of Science and Technology, Qingdao 266590, China
2
College of Geodesy and Geomatics, Shandong University of Science and Technology, Qingdao 266590, China
*
Author to whom correspondence should be addressed.
These authors contributed equally to this work.
Sensors 2024, 24(2), 615; https://doi.org/10.3390/s24020615
Submission received: 25 December 2023 / Revised: 10 January 2024 / Accepted: 16 January 2024 / Published: 18 January 2024
(This article belongs to the Section Sensing and Imaging)

Abstract

:
With the increasing scale of deep-sea oil exploration and drilling platforms, the assessment, maintenance, and optimization of marine structures have become crucial. Traditional detection and manual measurement methods are inadequate for meeting these demands, but three-dimensional laser scanning technology offers a promising solution. However, the complexity of the marine environment, including waves and wind, often leads to problematic point cloud data characterized by noise points and redundancy. To address this challenge, this paper proposes a method that combines K-Nearest-Neighborhood filtering with a hyperbolic function-based weighted hybrid filtering. The experimental results demonstrate the exceptional performance of the algorithm in processing point cloud data from offshore oil and gas platforms. The method improves noise point filtering efficiency by approximately 11% and decreases the total error by 0.6 percentage points compared to existing technologies. Not only does this method accurately process anomalies in high-density areas—it also removes noise while preserving important details. Furthermore, the research method presented in this paper is particularly suited for processing large point cloud data in complex marine environments. It enhances data accuracy and optimizes the three-dimensional reconstruction of offshore oil and gas platforms, providing reliable dimensional information for land-based prefabrication of these platforms.

1. Introduction

The application of 3D laser scanning technology on offshore oil and gas platforms has garnered increasing attention from the industrial sector due to advancements in engineering technology [1]. By utilizing 3D point cloud data obtained from scanning, a more accurate representation of real objects and scene information can be achieved, yielding precise inputs for subsequent tasks such as structural analysis, fault prediction, and other related analyses [2]. Moreover, this technology establishes a robust data foundation for the “prefabrication on land, installation at sea” strategy [3]. However, the collection of data on offshore oil and gas platforms is challenged by the complex and adverse marine environment [4], characterized by water surface fluctuations, sea breezes, and changes in environmental lighting [5]. These environmental factors often result in the presence of isolated noise points, surface reflection noise points, and noise points in coefficient areas within the data [6]. Such noise significantly diminishes the effectiveness of the technology on offshore oil and gas platforms, emphasizing the critical importance of implementing effective filtering techniques [7].
In their early research, Orts-Escolano et al. [8] introduced a filtering method based on a voxel grid to effectively reduce the volume of point cloud data. However, Moorfield et al. [9] raised concerns about the possible loss of important information, particularly in handling intricate parts. To address this limitation, some filtering methods incorporated normal information into the filtering process to achieve more detailed manipulation of the point cloud data. Nonetheless, these approaches still encountered challenges when processing large-scene point cloud data and lacked the ability to emphasize local point cloud density. Subsequent studies introduced radius filtering [10] and statistical filtering [11] as alternative techniques. While these methods addressed the low computational efficiency in handling large scenes and were capable of removing most outlier noise points, they still had shortcomings. For instance, radius filtering exhibited inaccuracies in sparse areas, while statistical filtering struggled to eliminate densely-clustered noise points [12].
In order to effectively address the challenges presented by complex scenarios involving large-scale point cloud data exhibiting diverse noise types and uneven point cloud density distribution, researchers have started exploring the integration of multiple filtering strategies [13,14,15,16,17,18,19] to develop more stable and computationally efficient methods. However, it is important to note that the effectiveness of these combined approaches varies depending on the specific application scenario. In the case of offshore oil and gas platforms, which encompass structures such as pipelines and flanges, the data volumes are significant, and the data collection environments are complex [20]. These factors not only increase the complexity of processing the point cloud data but also have the potential to impact the accuracy of subsequent analysis and decision-making processes.
To address these challenges, this paper presents a novel filtering algorithm that combines the KNN_PCF approach [21] with the Hy_WHF algorithm scheme [22]. The KNN_PCF algorithm effectively discriminates between noise and the genuine structure of the platform by taking into account the relative positions and densities of data points. On the other hand, the Hy_WHF, offers a flexible means of weight distribution. This enables the adaptive enhancement or attenuation of the influence of specific data points in varying scenarios and data densities, thereby achieving superior filtering outcomes.
Although both the KNN_PCF algorithm and the Hy_WHF algorithm demonstrate strong performance in processing point cloud data from offshore oil and gas platforms, each algorithm possesses specific advantages and limitations. Relying solely on a single filtering algorithm may not fully exploit its potential or yield optimal filtering outcomes in certain situations. To address this, this paper recognizes the complementary nature of these filtering techniques and proposes the exploration of an effective combination between the KNN_PCF algorithm and the Hy_WHF approach. This integration aims to develop a weighted mixed filtering algorithm that can deliver more efficient and accurate filtering results.
In addition to proposing and validating filtering algorithms, this research goes beyond and examines the practical application effects of these algorithms on offshore oil and gas platforms. To achieve this, the Poisson implicit surface reconstruction algorithm [23] is employed for 3D reconstruction of point cloud data obtained from offshore oil and gas platforms [24]. The main objective is to address the challenge of land-based prefabrication for these platforms [25] by providing more reliable dimensional information for the engineering model of “prefabrication on land, installation at sea”. This approach aims to enhance the accuracy and efficiency of construction processes, ultimately contributing to the improved execution of offshore oil and gas platform projects [26].

2. Materials and Methods

2.1. Data Collection

To address issues such as isolated points, surface noise, and surface reflection noise in the point cloud data sets of offshore oil and gas platforms, this study—on 10 August 2022—used an xFARO s350 model 3D laser scanner (FARO, Lake Mary, FL, USA) to acquire point cloud data from three offshore platforms in the Xi Jiang oil field. The study presents the overall point cloud data of the offshore oil and gas platforms (Figure 1) the partial point cloud data of an offshore oil and gas platform (Figure 2). This approach demonstrates how modern 3D scanning technology can capture intricate details of such large-scale industrial structures, providing a comprehensive dataset for further analysis and application in structural assessment and planning.

2.2. Methods

To mitigate challenges associated with isolated points, surface noise, and surface reflection noise in point cloud datasets of marine engineering equipment, this paper proposes the utilization of a combination of filtering algorithms, namely KNN_PCF (K-Nearest-Neighborhood point cloud filtering) and Hy_WHF (hyperbolic weighted hybrid filtering). By implementing this approach, the objective is to achieve a smoother representation of the point cloud data while effectively removing noise points.

2.2.1. K-Nearest-Neighborhood Point Cloud Filtering

In the KNN_PCF step, point cloud data are processed to remove outliers and isolated points. The flowchart of the KNN_PCF algorithm is shown in Figure 3.
Initially, to efficiently locate the Kn nearest neighbors for each point, a binary tree data structure is constructed. The KD-tree, a binary tree structure, is employed to partition data points in multi-dimensional space. In the context of a three-dimensional point cloud, we set the dimensionality to n = 6, taking into account the x, y, z coordinates, as well as the r, g, b color information of each point. For every point in the point cloud, the binary tree is utilized to identify its Kn nearest neighbors. Taking the central point p c , i as an example, its set of Kn nearest neighbors is { p c , i 1 , p c , i 2 , , p c , i K n } . The Euclidean distance, ρ c , i o j , between p c , i and its nearest neighbors p c , i o j ,   o j = 1 , 2 , , K n is computed using Equation (1), where x c , i ,   y c , i ,   z c , i represent the three-dimensional coordinates of Pc and respectively represent the three-dimensional coordinates of p c , i o j .
ρ c , i o j = ( x c , i x c , i o j ) 2 + ( y c , i y c , i o j ) 2 + ( z c , i z c , i o j ) 2 ,
After obtaining the Kn nearest neighbors for each point, the average distance to these neighbors is computed, reflecting the compactness of the local structure around the point. Once the average distances for all points are calculated, a location-based sorting algorithm is employed. Specifically, the largest number, max_num, among all average distances is identified, and its number of digits, max_digits, is recorded. Starting from the least significant digit, the numbers are sorted in descending order based on their value at that digit. This process continues, moving to higher digits, until all numbers are sorted on the max_digits digit. Subsequently, the top per% of points based on max_digits are removed, where per represents the percentage of data to be deleted, with per being in the range (0, 100). Points with larger distances are considered outliers, and their removal aids in reducing the overall noise level in the data.
Within the KNN_PCF algorithm, the parameter Kn denotes the number of nearest neighbors. A larger Kn value results in more accurate average distance calculations but at a higher computational cost. Conversely, a smaller Kn might yield less accurate average distances, making the results more susceptible to noise, but with reduced computational overhead. The parameter per indicates the percentage of points to be removed from the point cloud. A larger per value results in more points being deleted, potentially leading to loss of information in the filtered point cloud. Conversely, a smaller per value retains more points, making the filtered point cloud closer to the original, but with noise points preserved.

2.2.2. Hyperbolic Function Weighted Fusion Point Cloud Filtering

The hyperbolic function weighted fusion point cloud filtering algorithm aims to eliminate surface noise points in the point cloud and achieve a smoothing effect. The flowchart of this algorithm is depicted in Figure 4.
To perform the weighted mixed filtering, a new point cloud data file is first created to store the point cloud data processed through weighted averaging. During this filtering process, the weight assigned to each point influences its contribution in the weighted average computation. To determine the weight for each point, its local density is estimated. Specifically, the average distance of each point to its nearest neighbors is calculated to gauge the density of points surrounding it. Using a binary tree-based nearest neighbor search algorithm, the indices and squared distances, d_i2, of the Kh nearest neighbors around each point are identified, where d_i represents the distance between the ith point and its Kh nearest neighbors. The value of Kh, representing the number of neighboring points considered for each point, can be adjusted based on the specific requirements of the application.
To compute the weight factor for each point, a hyperbolic function is defined. This function interpolates between two limit values within its domain. The weight factor, d_w, for points in the point cloud is calculated using Equation (2), accepting a parameter φ, where φ and d_w’s value ranges are φ ∈ [0,1] and d_w ∈ [0,1], respectively. Here, d_i represents the average distance between a point and its nearest neighbors, while φ is a parameter of the hyperbolic function, adjusting the distribution of the weight factor. The value of φ, ranging between 0 and 1, can be adjusted based on the characteristics of the denoised data.
d_w = 1 1 + d _ i 2 ϕ 2 ,
Once the weight factors for the points are obtained, they are applied to the position and color information of the points to compute the new position and color values. Specifically, a weighted average of the position and color information of neighboring points is taken to derive the new position and color values for each point. This weighted averaging process aids in eliminating surface noise points and achieving smoother data representation.
Finally, the new points obtained through weighted averaging are added to the previously filtered point cloud data, replacing the points in the original point cloud. The result is a point cloud data set that has undergone weighted fusion filtering, containing smoothed point information.
The hyperbolic function-based weighted fusion filtering algorithm, by introducing weight factors and weighted averaging, can reduce surface noise points in point cloud data while maintaining data smoothness. The core idea of this algorithm is to estimate point weights based on local density and adjust the weight factor distribution using a hyperbolic function, achieving effective data processing. Through this algorithm, point cloud data is smoothed and denoised while retaining local features.
In the hyperbolic function-based weighted fusion filtering algorithm, a larger Kh value means more neighboring points are considered, resulting in a smoother outcome but at a higher computational cost. A smaller Kh value retains more details, preserving more noise points. The parameter φ, which controls the rate of weight decline, when larger, means weights decline more slowly, and distant points have a more significant influence, leading to a smoother result. A smaller φ value means weights decline faster, and only points near the center have a significant influence, leading to a sharper result but retaining more noise points.

2.2.3. Combined Filtering

To leverage the strengths of both the KNN_PCF algorithm and the Hy_WHF algorithm, this paper proposes a combined filtering approach. This method first employs the KNN_PCF algorithm for preliminary processing, eliminating points with low local density or isolated points. Subsequently, the data filtered through KNN_PCF are passed to the Hy_WHF algorithm, further smoothing the data while retaining features with geometric and topological continuity. The combined filtering technique’s flowchart is illustrated in Figure 5.
This combined filtering approach capitalizes on the strengths of both filtering algorithms, compensating for the limitations of each. While the KNN_PCF algorithm effectively removes outliers and isolated points, it might lead to excessive smoothing in certain areas. On the other hand, the Hy_WHF algorithm can smooth data while retaining details but might not perform well with larger noise points. By integrating both algorithms, the point cloud data retains its geometric shape and local features while eliminating most noise points, resulting in cleaner, smoother, and higher fidelity point cloud data.

3. Experiments

3.1. Experimental Environment

All experiments in this paper were conducted on workstations with uniform standard configurations. The hardware and software configurations used for the experiments are detailed in Table 1. These configurations are common industry standards and not specially customized or experimental in nature, ensuring the generality and reproducibility of the experimental results.

3.2. Experimental Evaluation Parameters

This study introduces several key performance indicators, such as the target point retention rate [27], noise point screening rate, denoising rate, and total error rate [28]. These indicators are utilized to assess the important performance of filtering algorithms in effectively removing noise points and preserving target points. Additionally, a consistency assessment metric [29] is employed to evaluate the similarity between the point cloud data and the three-dimensional reconstruction model.
In the point cloud filtering analysis, the original point cloud (denoted as O) is divided into target point cloud (Ot) and noise point cloud (On). The point cloud obtained after filtering (denoted as R) is also divided into two subsets: retained target point cloud (Rt) and residual noise point cloud (Rn). Meanwhile, the points removed during the filtering process (denoted as D) are divided into mistakenly removed target point cloud (Dt) and successfully removed noise point cloud (Dn).
(1)
Target Point Retention Rate (TR): The target point retention rate is an indicator measuring the completeness of the retained target point cloud. A higher TR indicates that the filtering algorithm performs better in retaining essential information. Its formula is:
T R = R t D t + R t + R n × 100 % ,
(2)
Noise Point Screening Rate (NSR): The noise point screening rate measures the efficiency of noise point removal. A higher NSR indicates that the filtering algorithm performs better in noise removal, retaining more useful information. Its formula is:
N S R = D n D n + D t + R n × 100 % ,
(3)
Denoising Rate (Rd): The denoising rate indicates the proportion of noise points successfully removed by the filtering algorithm. A higher Rd suggests better algorithm performance. Its formula is:
R d = D n O n × 100 % ,
(4)
Total Error (Et): The total error indicates the combined error from the filtering algorithm mistakenly removing target points as noise and retaining noise points as target points. A smaller Et indicates better algorithm performance. Its formula is:
E t = D t + R n O × 100 % ,
These evaluation metrics can be employed to assess the noise removal effectiveness of filtering algorithms and the degree to which the morphology of the offshore equipment point cloud is maintained, facilitating the selection of the most suitable filtering algorithm and parameters for specific application scenarios.
In the analysis of point cloud three-dimensional reconstruction, consistency assessment focuses on measuring the distance between the point cloud and the surface of the reconstructed model. The process involves obtaining the three-dimensional reconstruction model of the input point cloud and calculating the distance from each point in the point cloud to the surface of the reconstructed model. This is typically achieved by calculating the Euclidean distance [30] to the nearest point (or triangle) on the surface. Finally, the mean distance and the standard deviation [31] of all points to the surface are computed. The mean distance provides an indication of the overall consistency between the point cloud and the reconstruction model, while the standard deviation reflects the variability in the distribution of distances. Generally, lower mean distances and standard deviations signify a higher level of consistency.

3.3. Experimental Process and Results

The experimental method of this study is systematically structured into three main parts to evaluate and compare the effectiveness of various filtering algorithms in processing point cloud data for offshore oil and gas platforms.
In the first part, two conventional filtering algorithms, the statistical filtering algorithm and the radius filtering algorithm, were applied to a section of the point cloud data from the same offshore oil and gas platform. In addition, this study introduced two novel algorithms: the KNN_PCF (K-Nearest-Neighborhood point cloud filtering) algorithm and the Hy_WHF (hyperbolic weighted hybrid filtering) algorithm. To optimize their performance, we employed a controlled variable method for parameter tuning. Each algorithm’s parameters were systematically adjusted, and multiple comparative experiments were conducted. The primary objective of this phase was to identify the most effective parameter settings for each algorithm, especially to assess the KNN_PCF algorithm’s suitability for this specific dataset.
In the second part, building on the findings from the previous experiments, we established the optimal parameter settings for each algorithm when applied to offshore oil and gas platform data. This phase involved experimenting with both individual and combined applications of the KNN_PCF and Hy_WHF algorithms as well as exploring the synergy between the radius and statistical filtering algorithms. The focus was to validate the efficiency of the combined filtering approach, particularly comparing the noise reduction capabilities of the KNN_PCF and Hy_WHF method against the radius–statistical filtering method.
Finally, the third part of the study utilized the Poisson algorithm to perform 3D reconstruction of the offshore oil and gas platform datasets, pre- and post-denoising. The reconstructions were meticulously compared to evaluate the impact of the various filtering algorithms on the final 3D model quality. This comparative analysis aimed to provide insights into the efficacy of the filtering techniques in enhancing the accuracy and detail of the 3D models of offshore platforms.

3.3.1. Individual Filtering Algorithms

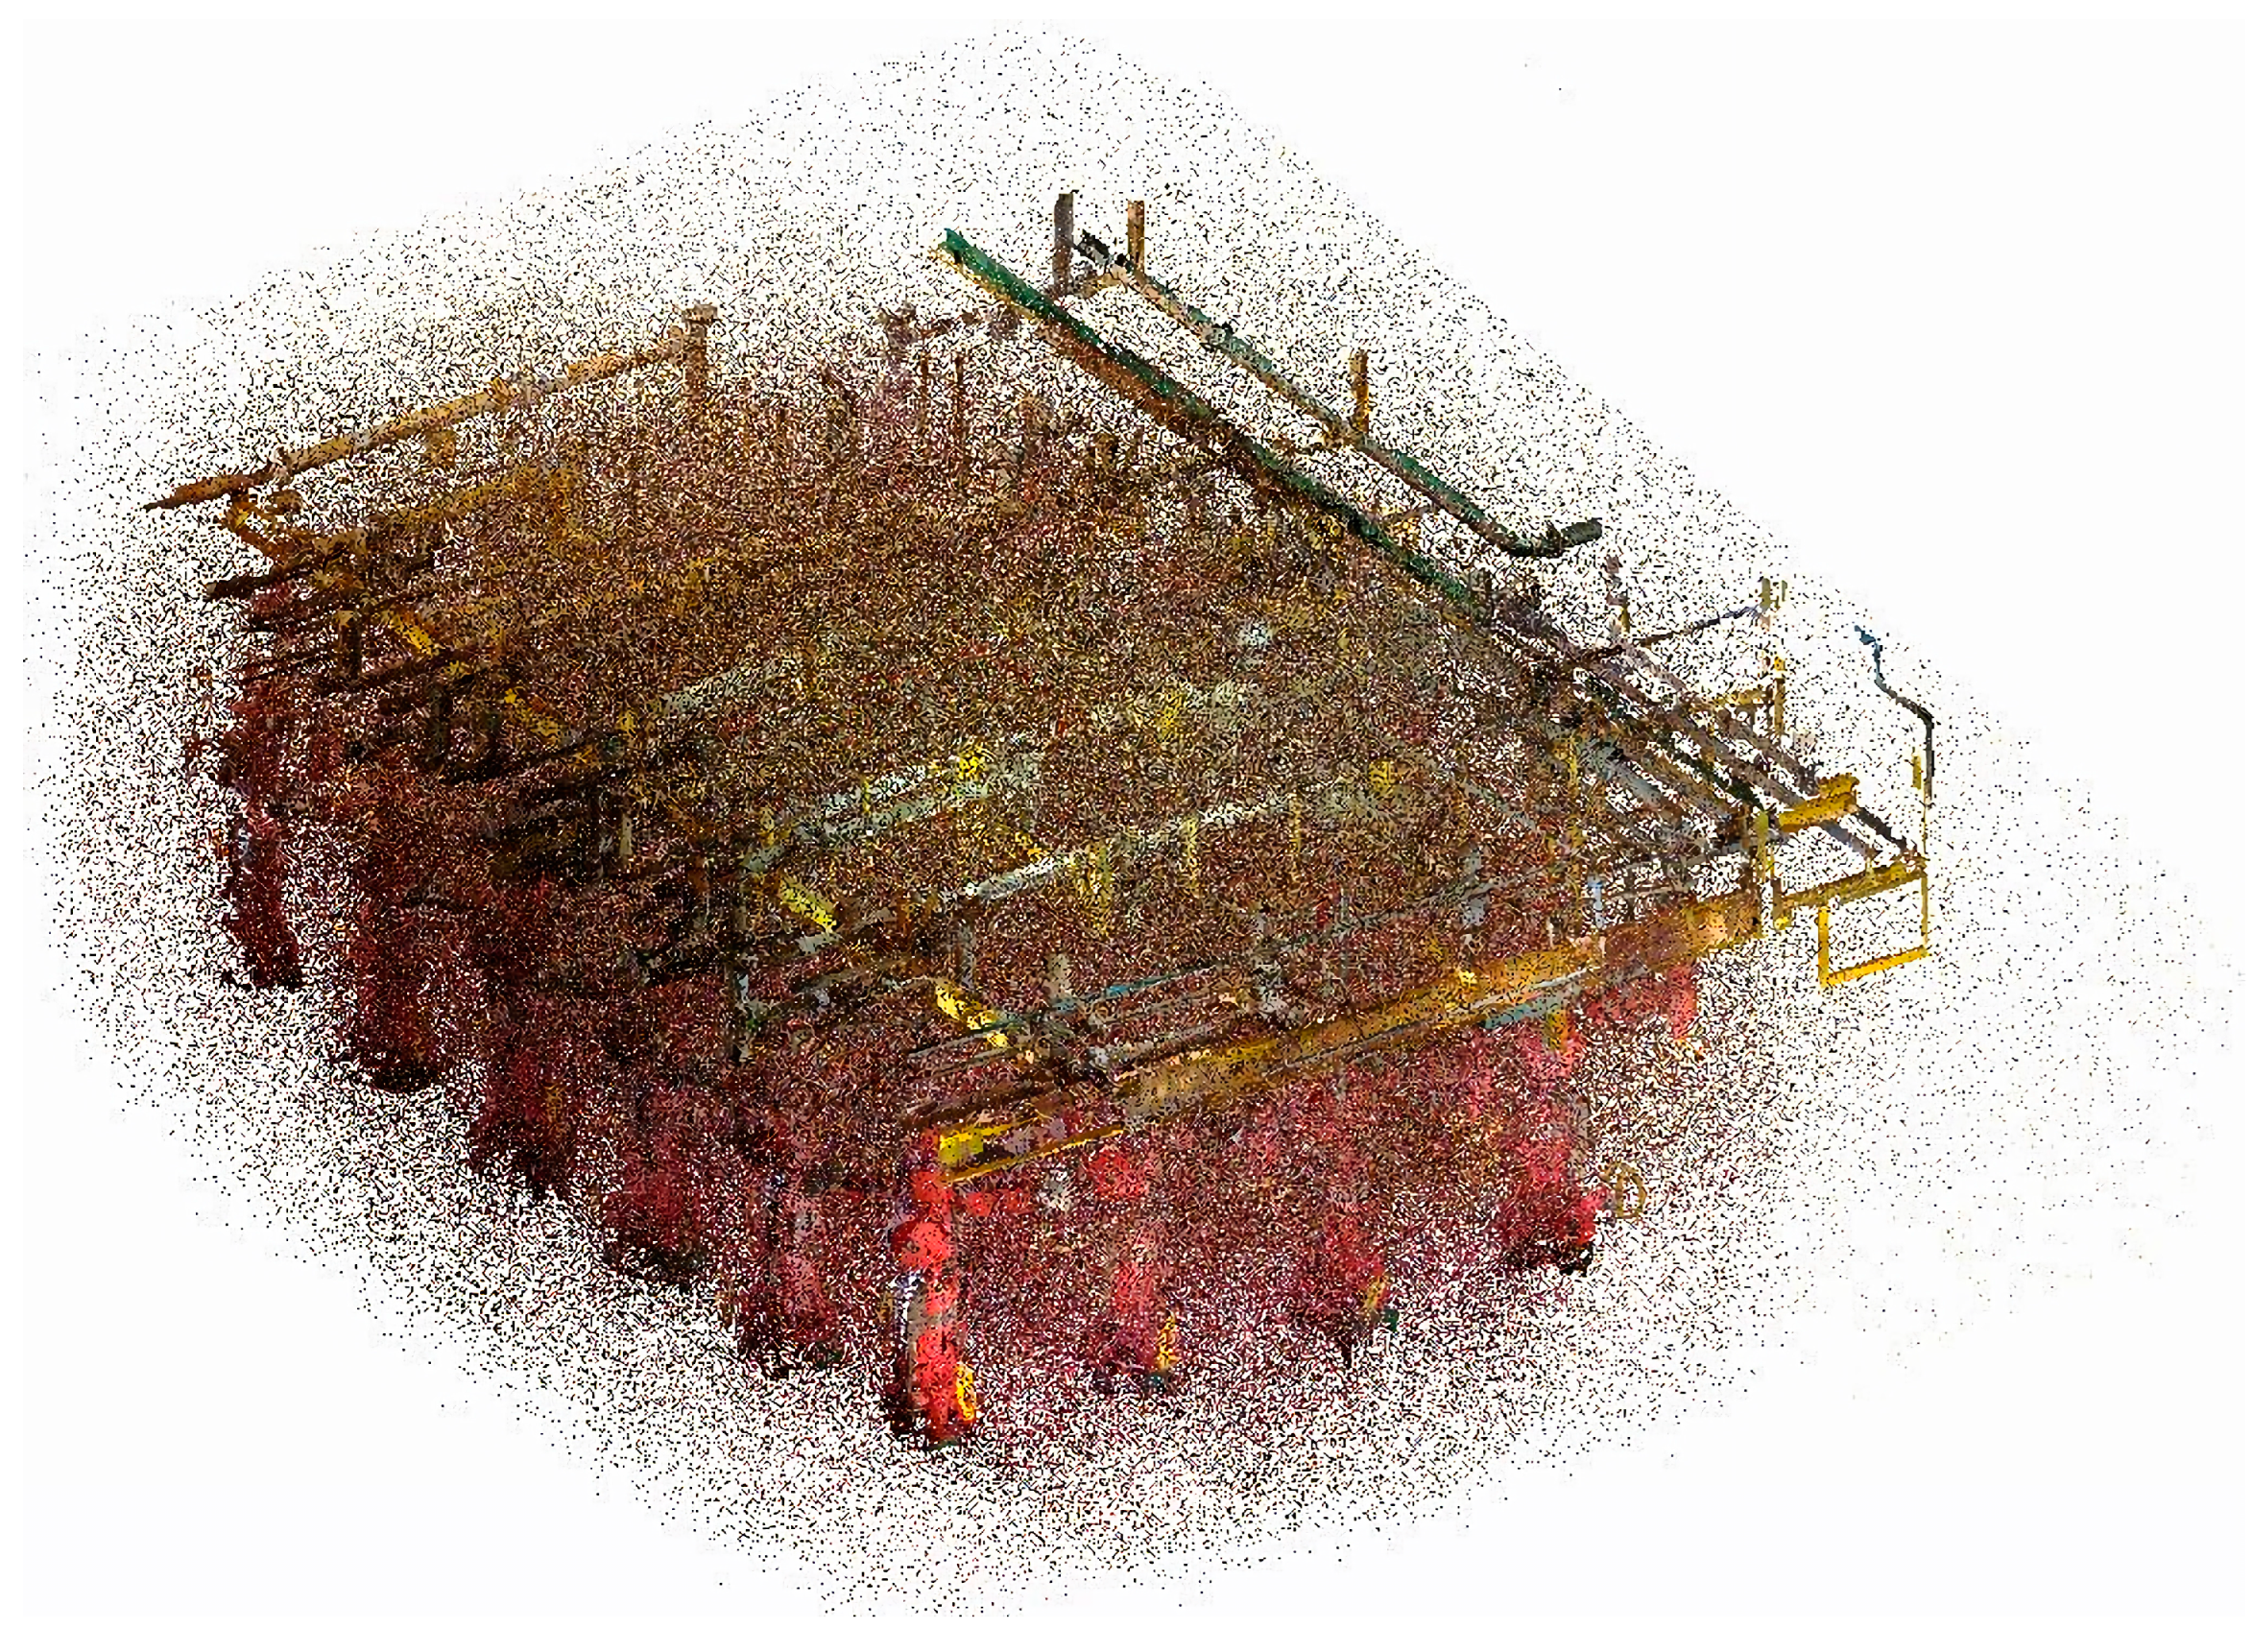
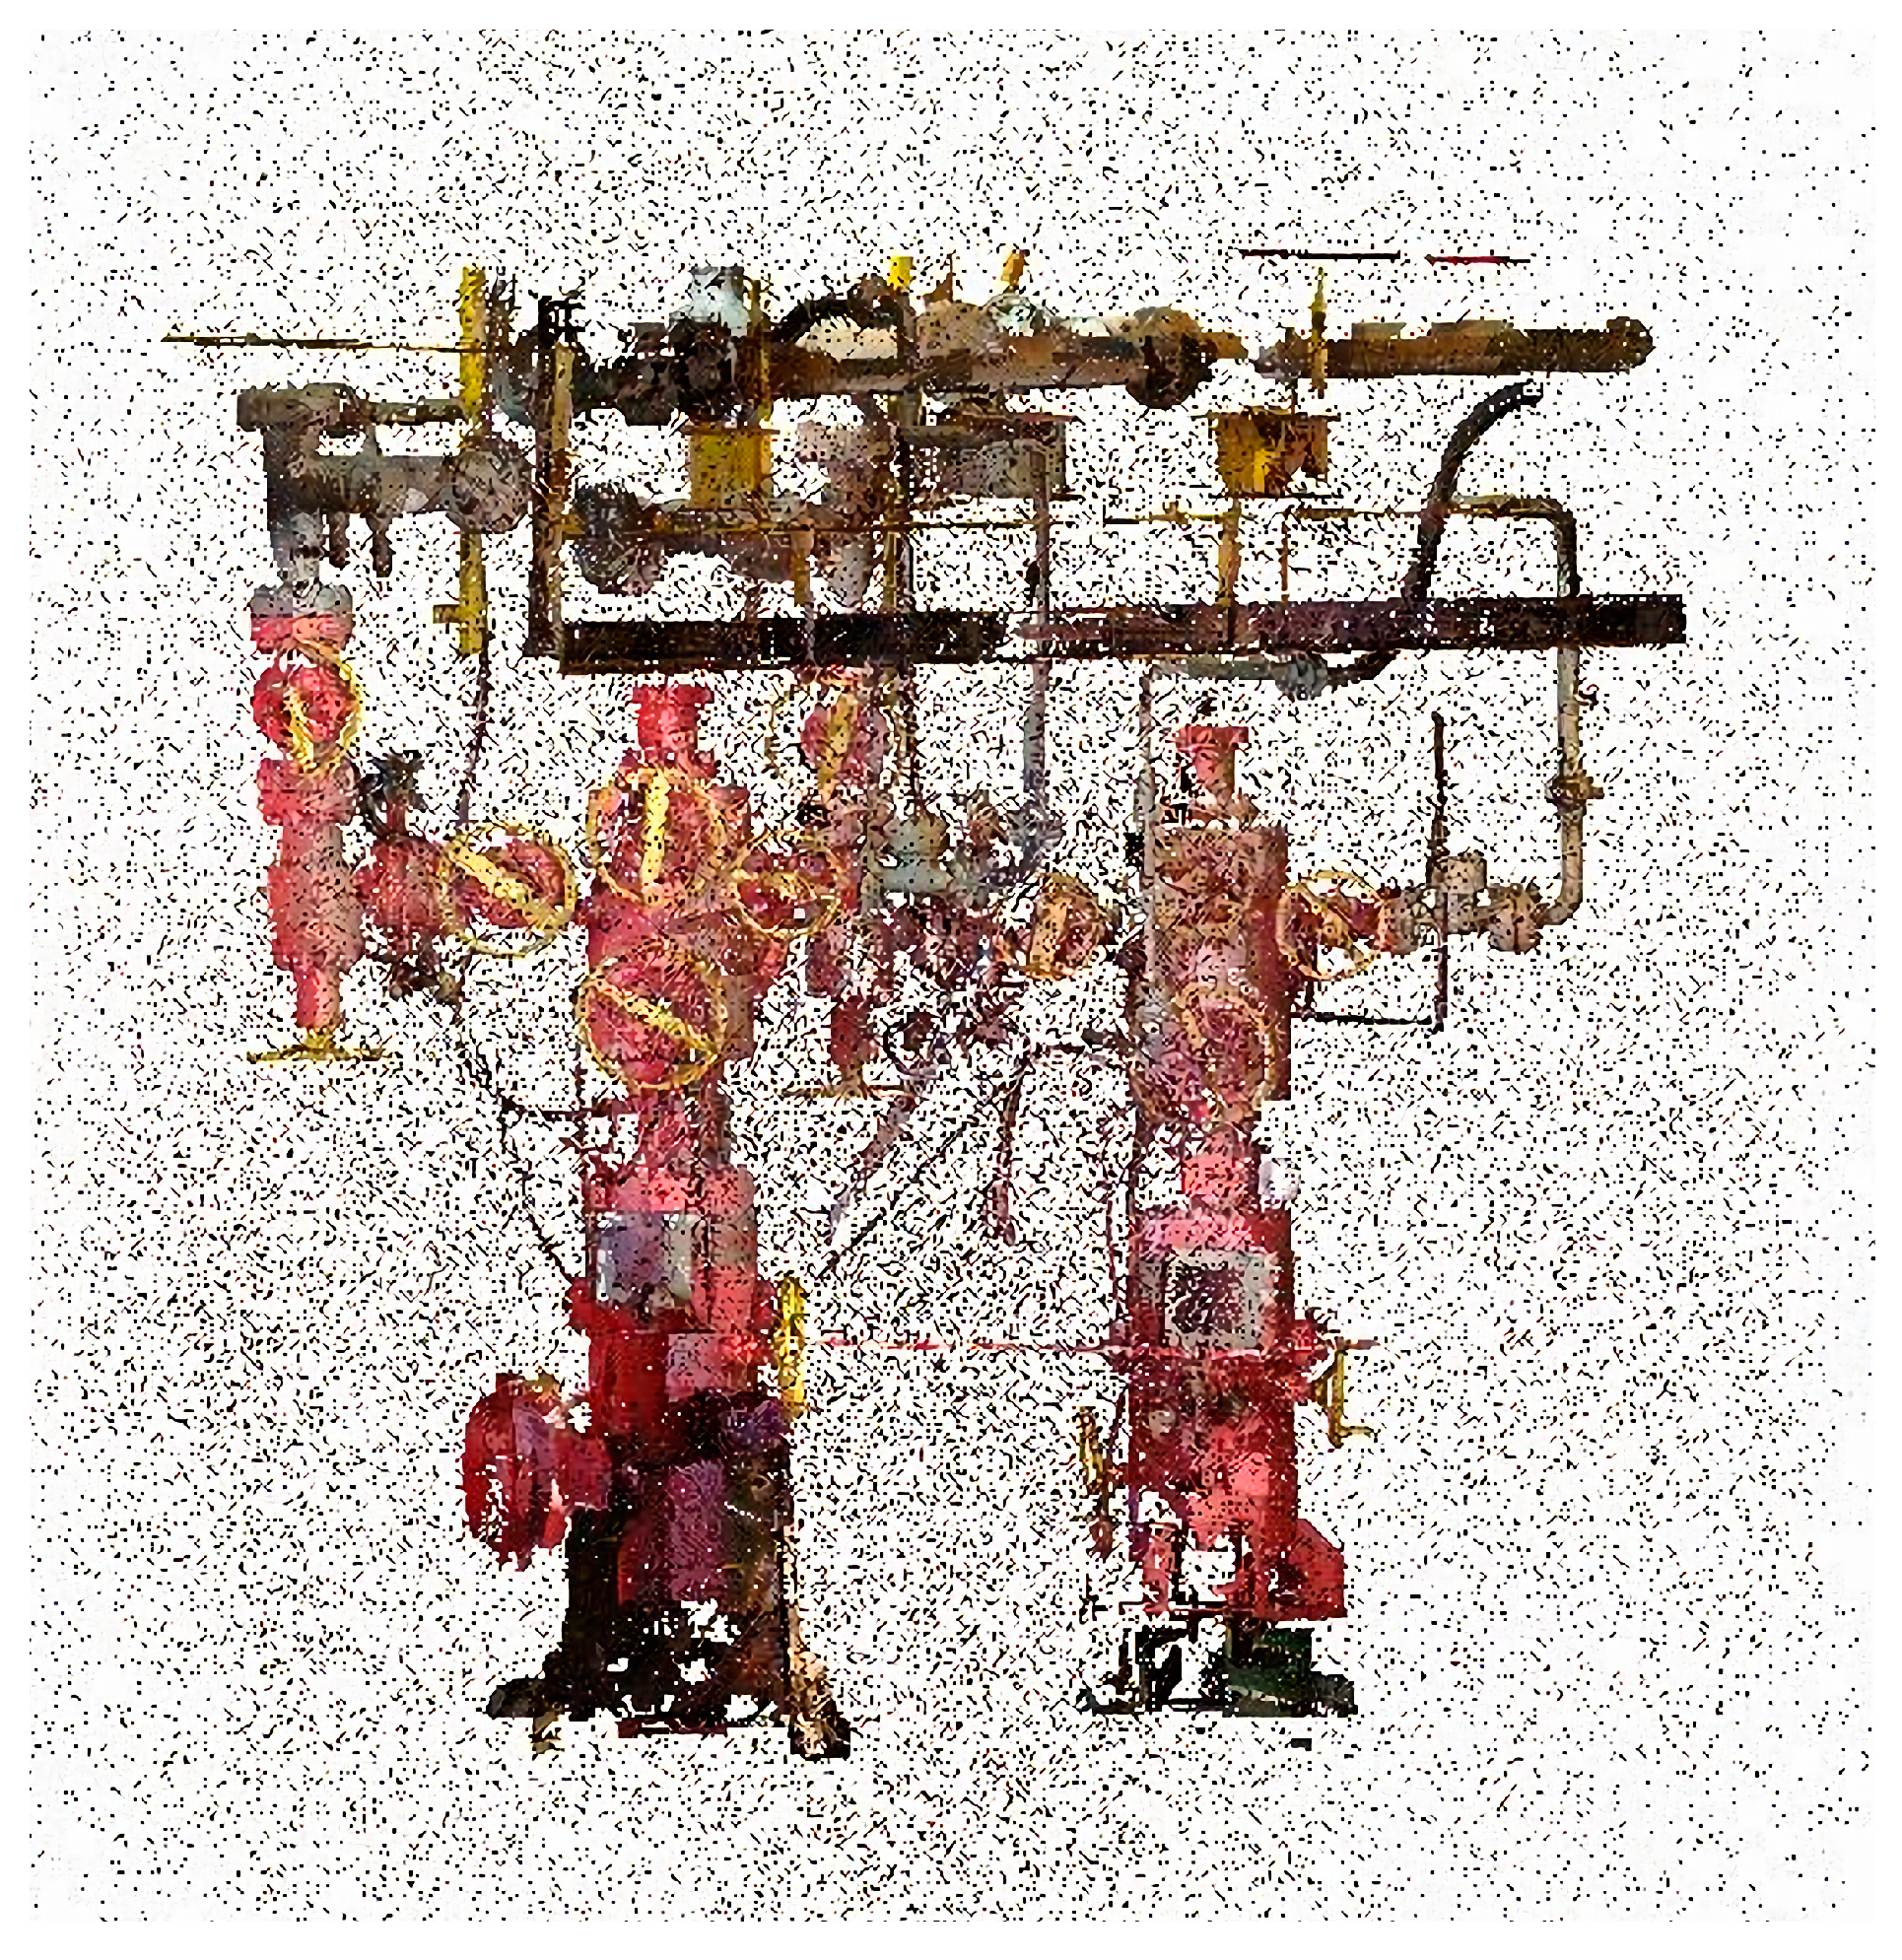
To precisely determine the optimal parameter settings for the offshore oil and gas platform point cloud dataset under different algorithms, this study conducted detailed comparative experiments on statistical filtering, radius filtering, the KNN_PCF algorithm, and the Hy_WHF algorithm, using the part of the offshore oil and gas platform point cloud data shown in Figure 2. The experiments with these four algorithms were compared horizontally, verifying the efficiency of the KNN_PCF algorithm in removing noise from the point cloud data of offshore oil and gas platforms.
  • Algorithm Parameterization
(1) Statistical Filtering
Initially, the standard deviation multiple σ is fixed at 1.5, and the range for the number of neighborhood search points Ks is set between 6 and 10, with a step size of 2. This allows for a quantitative estimation of the denoising effect under these parameter settings. Through this process, the optimal value for Ks can be determined. Subsequently, to further optimize the parameter settings, the range for σ is set between 1.0 and 2.0—with a step size of 0.5—to ultimately ascertain the best value for σ. Using this method, we can employ various parameter combinations to achieve the best performance of statistical filtering on the offshore oil and gas platform point cloud data. For each parameter combination of statistical filtering, its precision evaluation parameter values are calculated (Table 2) (Note: In all tables, bolded rows represent the best algorithm parameters and their corresponding evaluation values, following the same convention).
The table shows the evaluated parameter values of statistical filtering algorithms with different parameter combinations under the point cloud data of offshore oil and gas platforms, and it can be seen from Table 2 that the denoising of point cloud data is best when the number of neighborhood search points Ks is 8 and the standard deviation multiplier σ is 1.5.
(2) Radius Filtering
In the analysis of radius filtering, we first fixed the radius r to be 0.08 and set the range of the threshold of the number of neighboring points Kr to be between 60 and 120 with a step size of 30 as a way to quantitatively estimate the denoising effect under different parameters and to determine the optimal value of Kr. Subsequently, in order to further optimize the parameters, we adjusted the value of r to a range of 0.06 to 0.10 with a step size of 0.02 so as to finally determine the optimal value of r. In this way, we are able to use individual parameter combinations to obtain the best performance of radius filtering on offshore oil and gas platform point cloud data. For each parameter combination result of the radius filtering, its accuracy evaluation parameter value was calculated (Table 3).
The table shows in detail the values of various performance parameters of the radius filtering algorithm under different parameter combinations. As can be seen from Table 3, when Kr is 90 and r is 0.08, the denoising of point cloud data is the best, its target point retention rate is 99.069%, the noise point filtering rate is 82.357%, the denoising rate is 86.082%, and the total error rate is 0.892%.
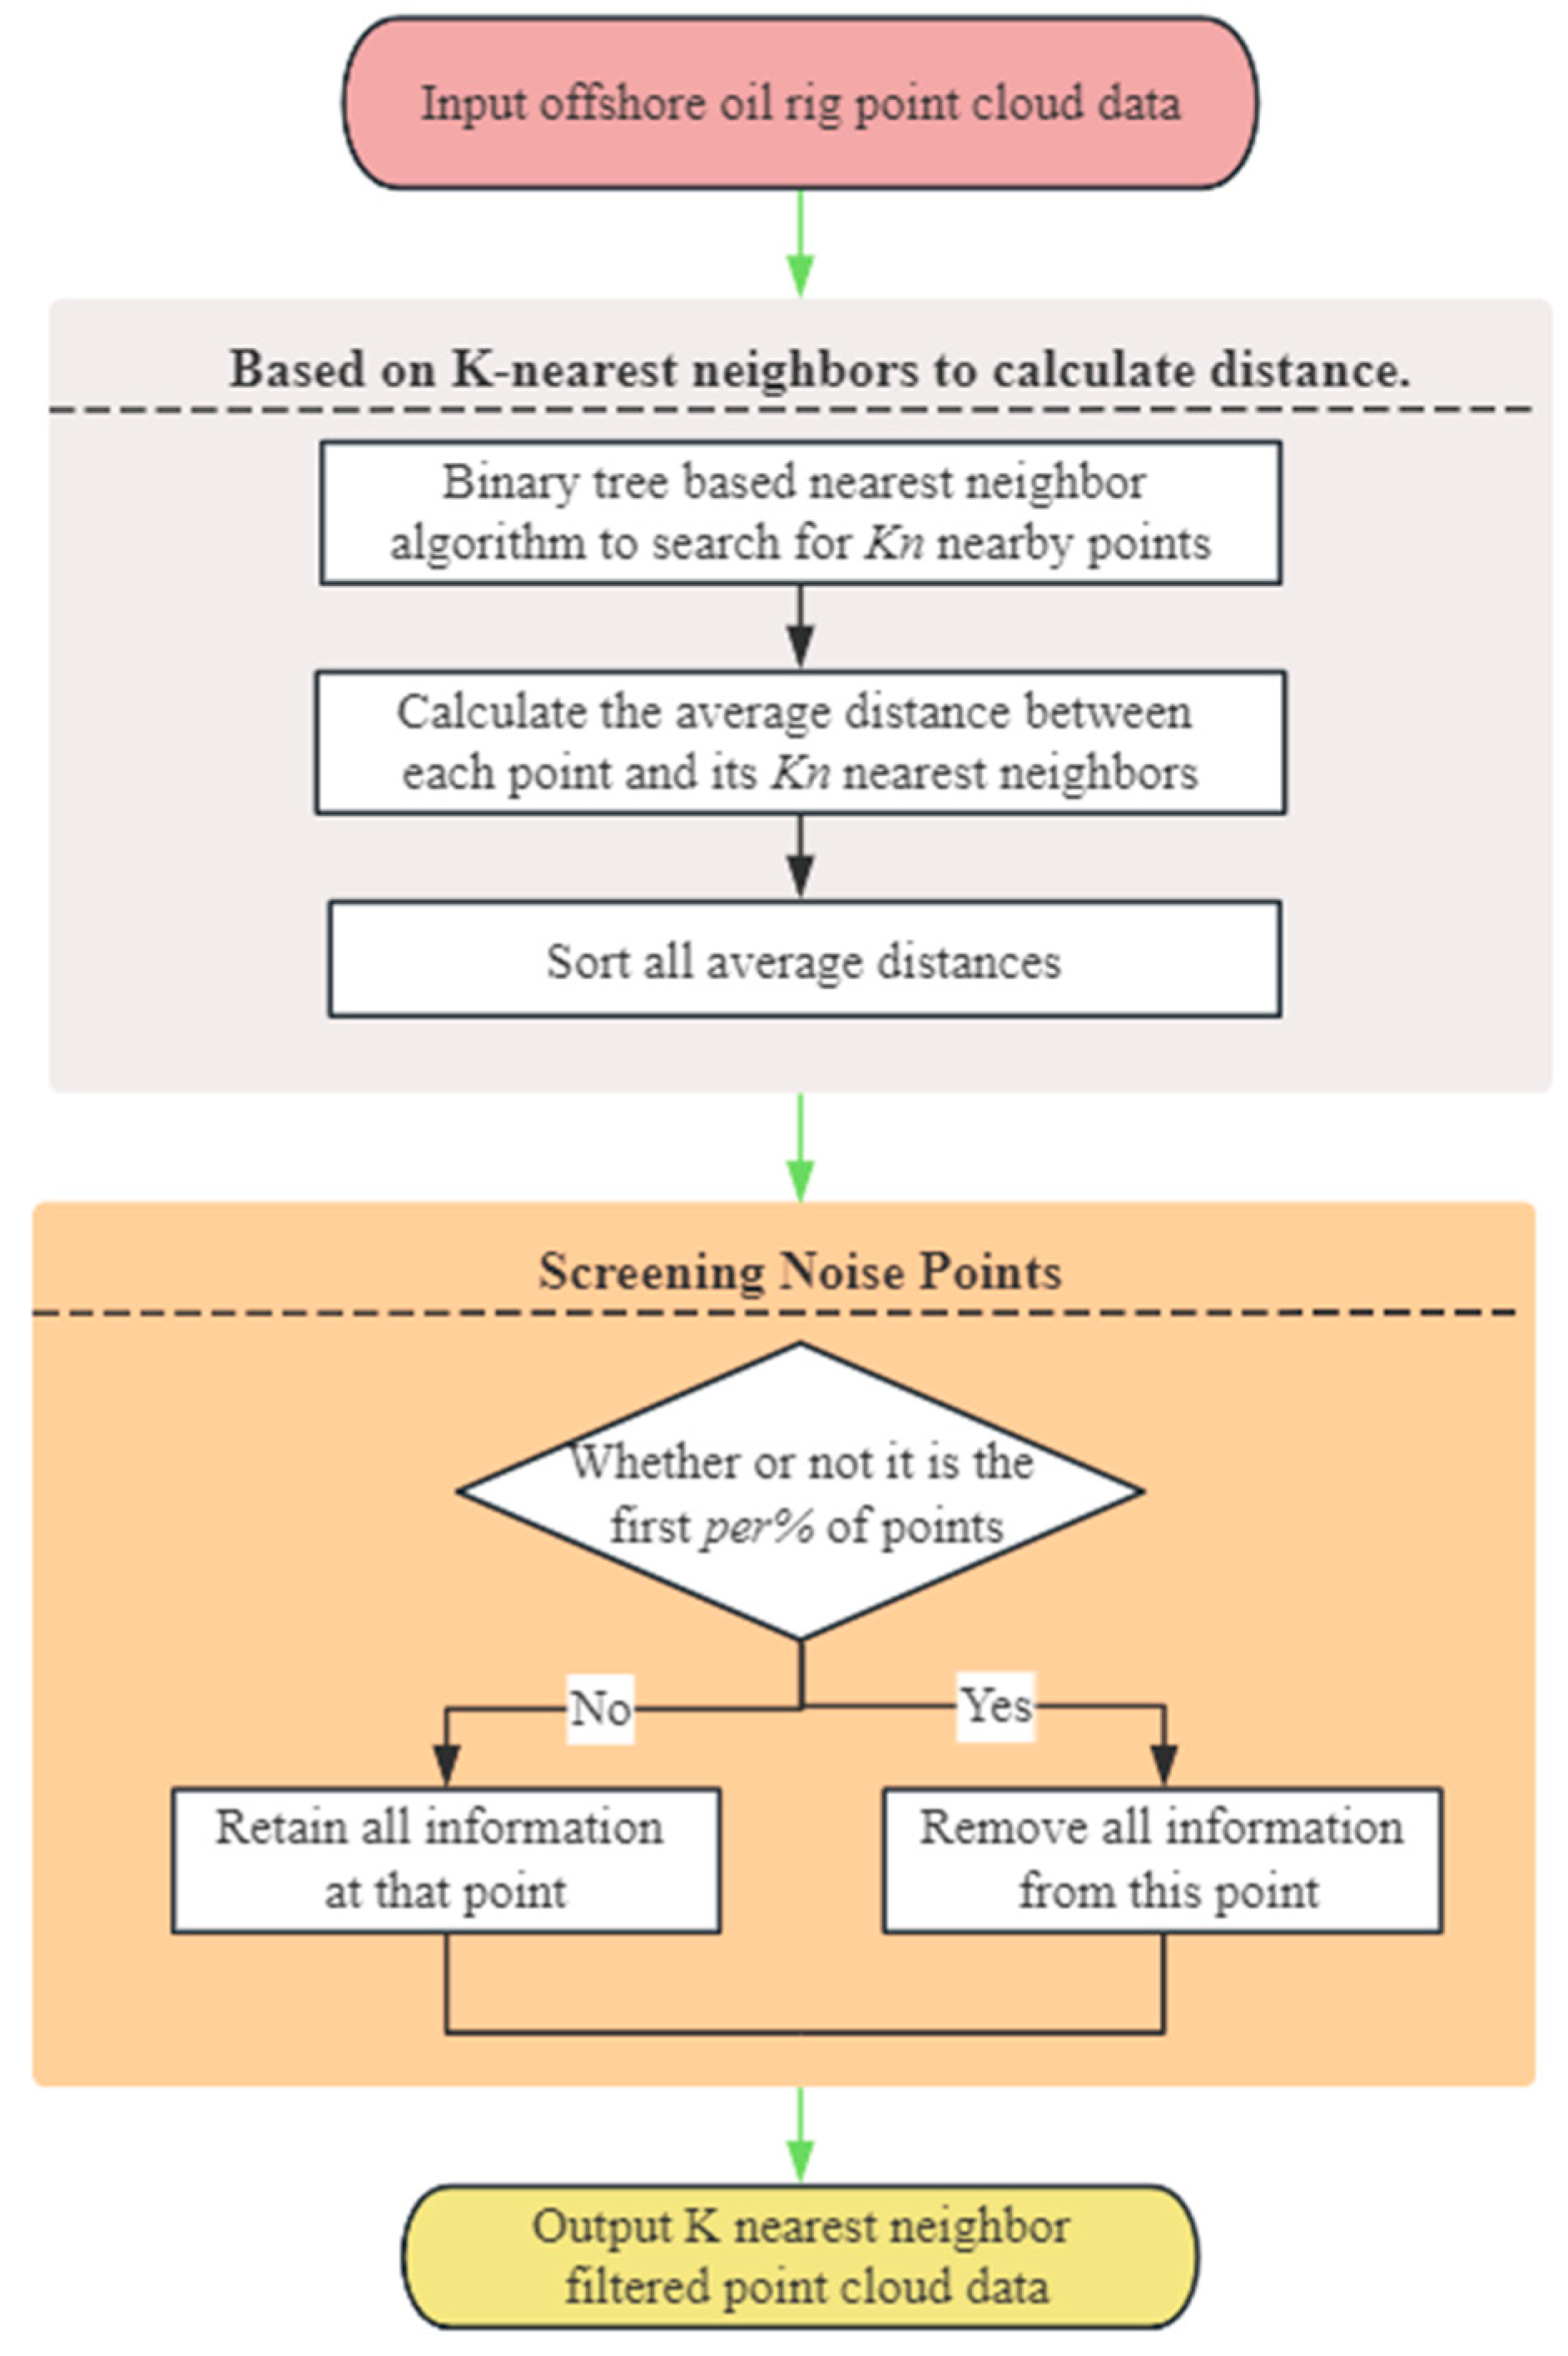
(3) K-Nearest-Neighborhood Point Cloud Filtering (KNN_PCF)
During the experiment of denoising offshore oil and gas platform point cloud data with the KNN_PCF algorithm, the percentage (per) was initially set at 4.5, and the range for the number of nearest neighbors (Kn) was set between 70 and 90, with a step size of 10. Through these settings, we could quantitatively estimate the denoising effects under different parameters and thus determine the optimal value for Kn. Subsequently, we adjusted the range of per to be between 4.0 and 5.0, with a step size of 1.0, to find the most suitable value for per. Using this method, we could employ various parameter combinations to achieve the best performance of the KNN_PCF algorithm on the offshore oil and gas platform point cloud data. For each combination of parameters, we calculated its precision evaluation parameter values (Table 4).
The table shows the evaluation parameter values of the KNN_PCF algorithm with different parameter combinations for point cloud data of offshore oil and gas platforms. From Table 4, it can be seen that when the number of nearest neighbors (Kn) is 80 and the fixed percentage (per) is set at 4.5, the denoising effect on the point cloud data is the best.
(4) Hyperbolic Weighted Hybrid Filtering (Hy_WHF)
During the Hy_WHF (hyperbolic weighted hybrid filtering) algorithm experiment, we initially fixed the parameter φ at 0.1 and set the range for the number of nearest neighbors (Kh) between 15 and 25, with a step size of 5. This was done to quantitatively estimate the denoising effects under different parameters and to determine the best value for Kh. Then, we adjusted the range of φ to be between 0.08 and 0.12, with a step size of 0.02, to ultimately find the most suitable value for φ. Through this process, we could use various parameter combinations to achieve the best performance of the Hy_WHF algorithm on the point cloud data of offshore oil and gas platforms. For each combination of parameters, we calculated its precision evaluation parameter values (Table 5).
The table provides detailed performance parameter values for the Hy_WHF algorithm under different parameter settings. From Table 5, it is evident that when the number of nearest neighbors (Kh) is 20 and the parameter φ is set at 0.1, the denoising effect on the offshore oil and gas platform point cloud data is the best.
2.
Comparison of Different Algorithms
To more thoroughly validate the effectiveness of the KNN_PCF algorithm in removing noise from point cloud data of offshore oil and gas platforms, this study employed a precise experimental method. We used the optimal parameters for each algorithm as determined by meticulous experiments earlier in the paper as a benchmark. Specifically, we selected statistical filtering with parameters Ks = 8, σ = 1.5; radius filtering with parameters Kr = 90, r = 0.08; KNN_PCF algorithm with parameters Kn = 80, per = 4.5; and Hy_WHF algorithm with parameters Kh = 20, φ = 0.1. We conducted a detailed comparison of their filtering effects using various indicators and visual analysis. A table of filtering evaluation parameters based on different algorithms was also provided (
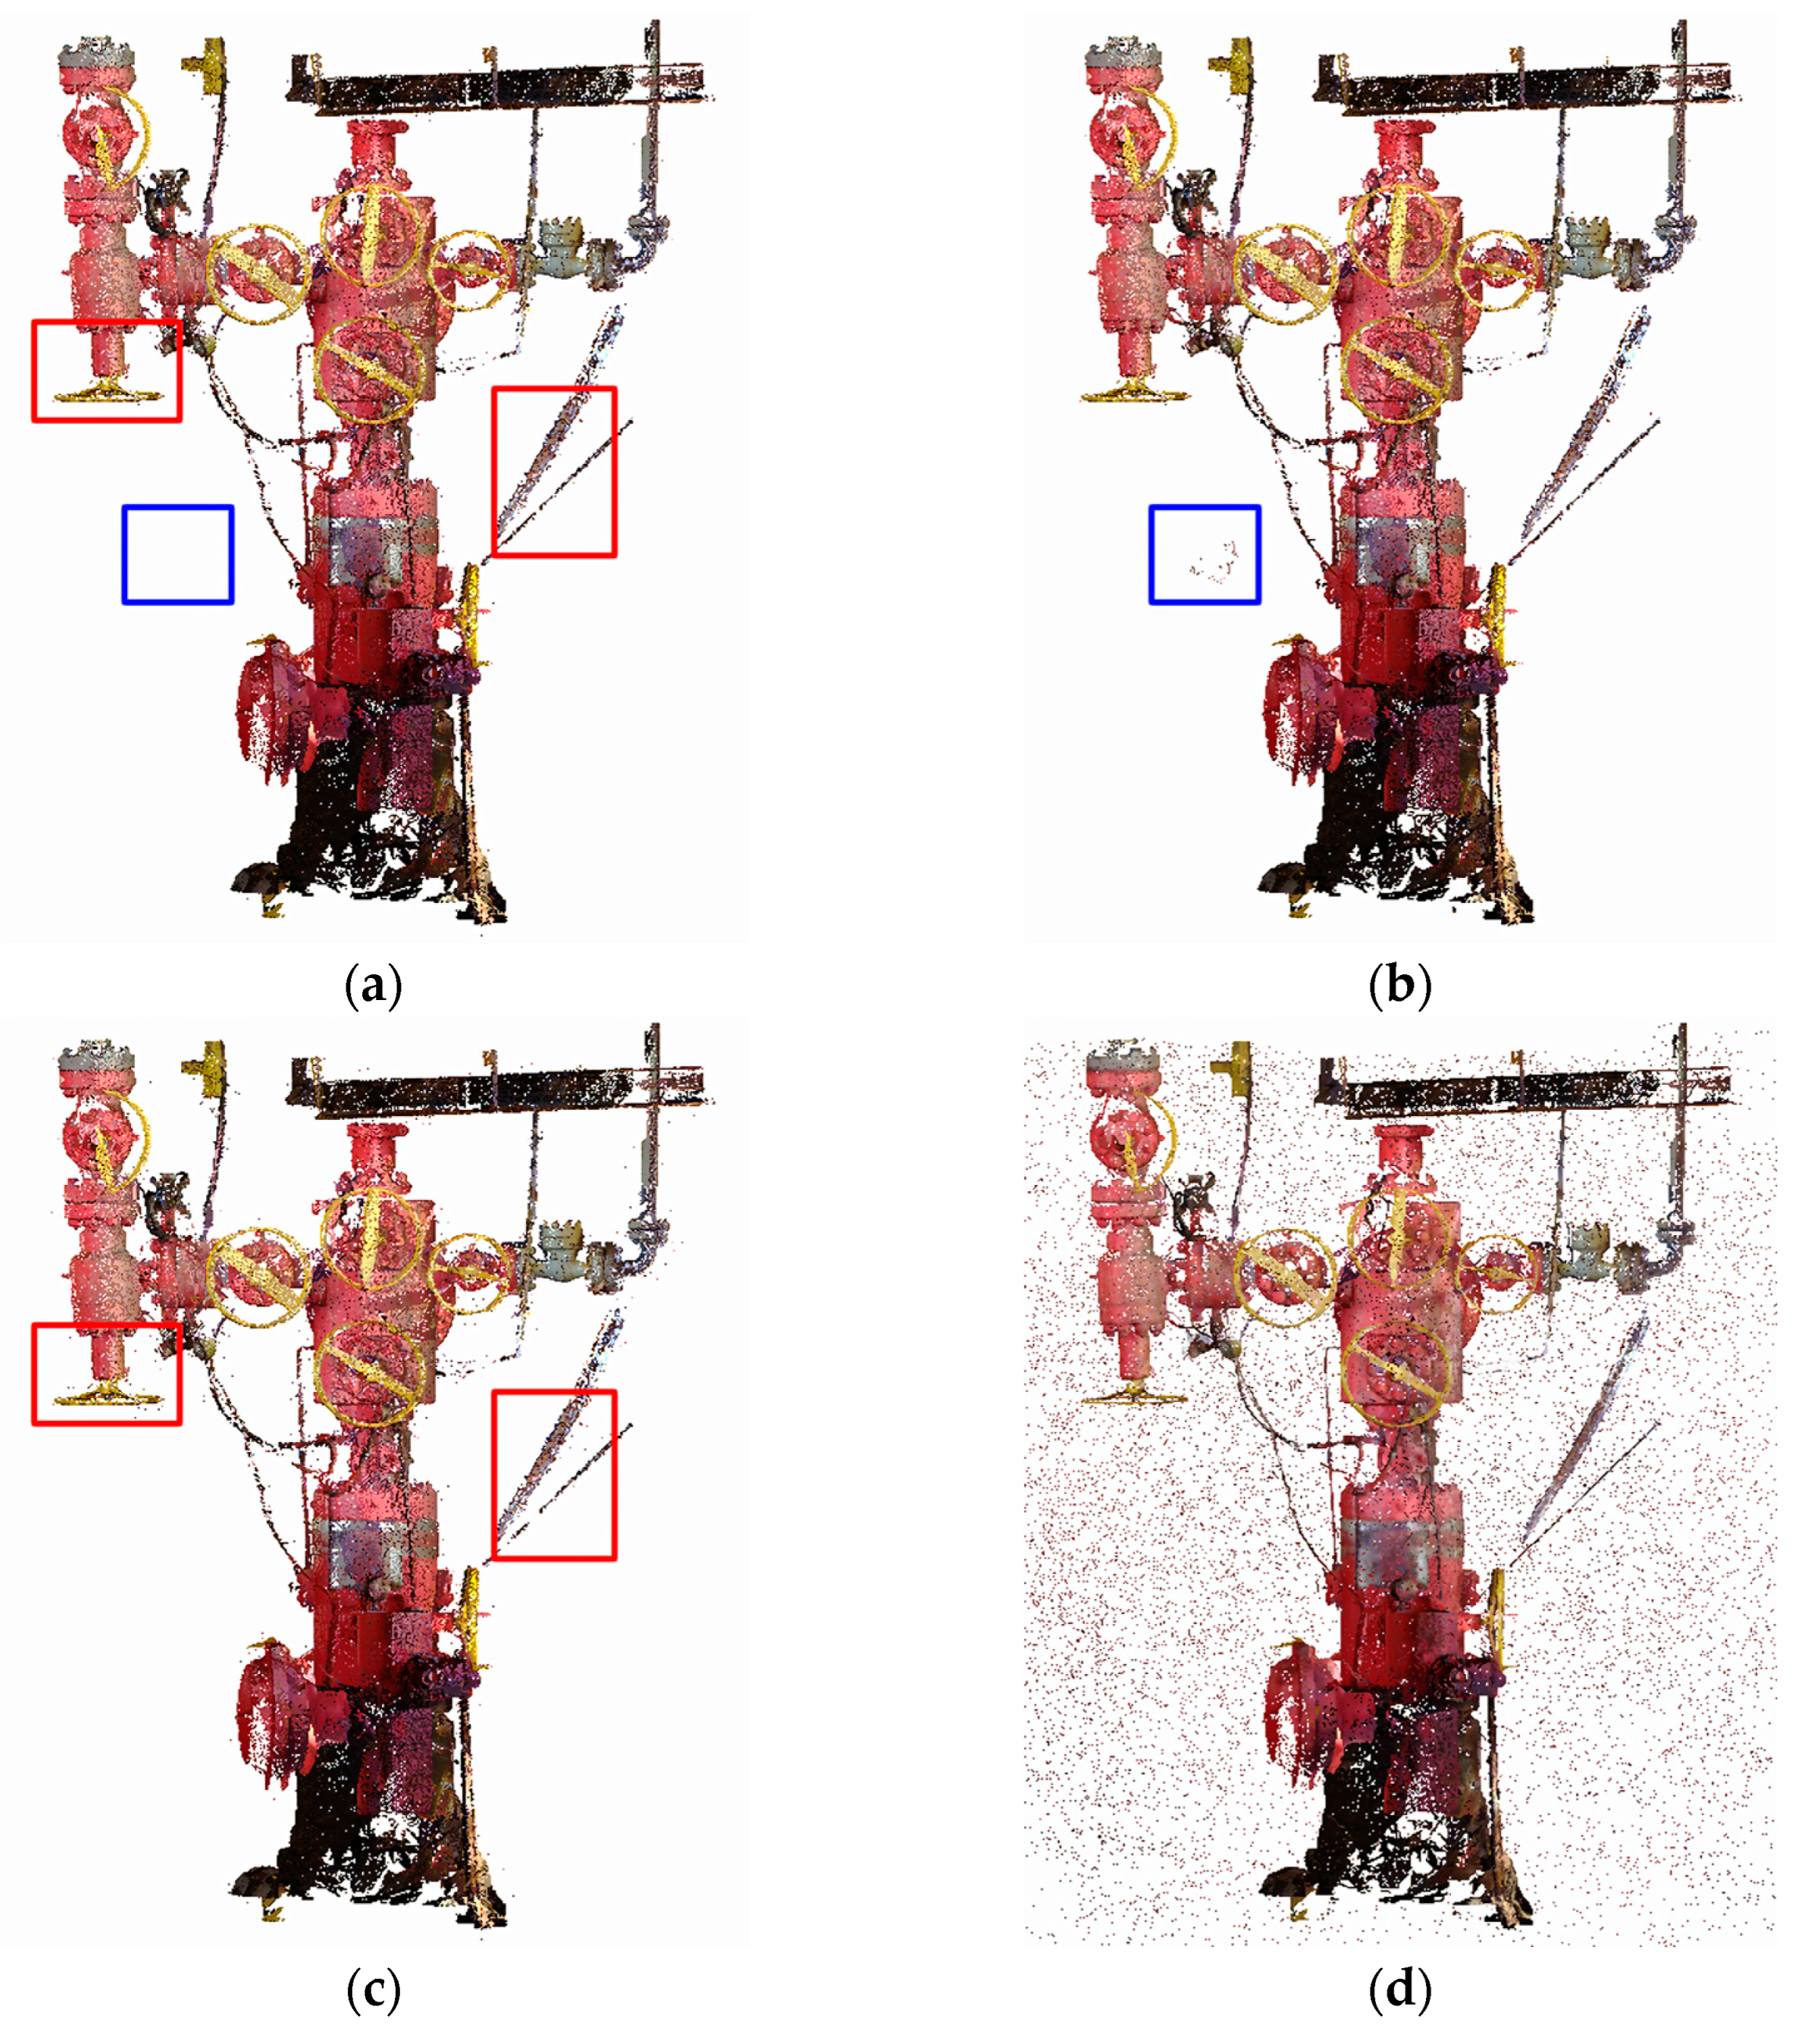
Table 6). To visually demonstrate the denoising effects of different filtering algorithms on point cloud data, the denoising results were visualized (Figure 6).
From the evaluation parameter Table 6 in the comparative experiments, it is apparent that the KNN_PCF algorithm excels in terms of target point retention rate (TR), noise point screening rate (NSR), and denoising rate (Rd), achieving 99.485%, 89.987%, and 91.417%, respectively. It has the smallest total error of only 0.492. Moreover, the noise point screening rate obtained using the KNN_PCF algorithm is about 7 percentage points higher than that of the radius filtering algorithm, with a total error result that is 0.4 percentage points lower. However, when using the Hy_WHF algorithm alone, its denoising effect is comparatively poorer.
Figure 6 illustrates the selection of regions using blue boxes to highlight the presence of noise points that are not effectively eliminated through statistical filtering but can be successfully removed using the KNN_PCF algorithm. Moreover, red boxes are employed to identify areas where noise persists despite the application of radius filtering but can be effectively addressed by utilizing the KNN_PCF algorithm. By comparing the visualization results of different filtering algorithms in Figure 6, we can see that statistical filtering effectively removes most noise points, but its handling of dense clustered noise and surface noise is less satisfactory. Radius filtering improves the processing of densely clustered noise points, but also lacks in preserving surface detail of the data. The KNN_PCF algorithm combines the advantages of radius filtering and statistical filtering, effectively removing both dense clustered noise and surface noise.

3.3.2. Combined Filtering Algorithms

Based on the outcomes of previous experiments, it was observed that the KNN_PCF algorithm demonstrated superior performance in comparison to radius and statistical filtering methods in processing point cloud data from offshore oil and gas platforms. However, while the Hy_WHF algorithm individually showed less favorable results than the other algorithms, its combination with the KNN_PCF algorithm was explored to potentially enhance overall filtering effectiveness. Additionally, experiments were conducted to combine radius and statistical filtering methods, aiming to investigate their synergistic effects in different scenarios. This approach also served to provide a comparative benchmark for the combined use of the KNN_PCF and Hy_WHF algorithms.
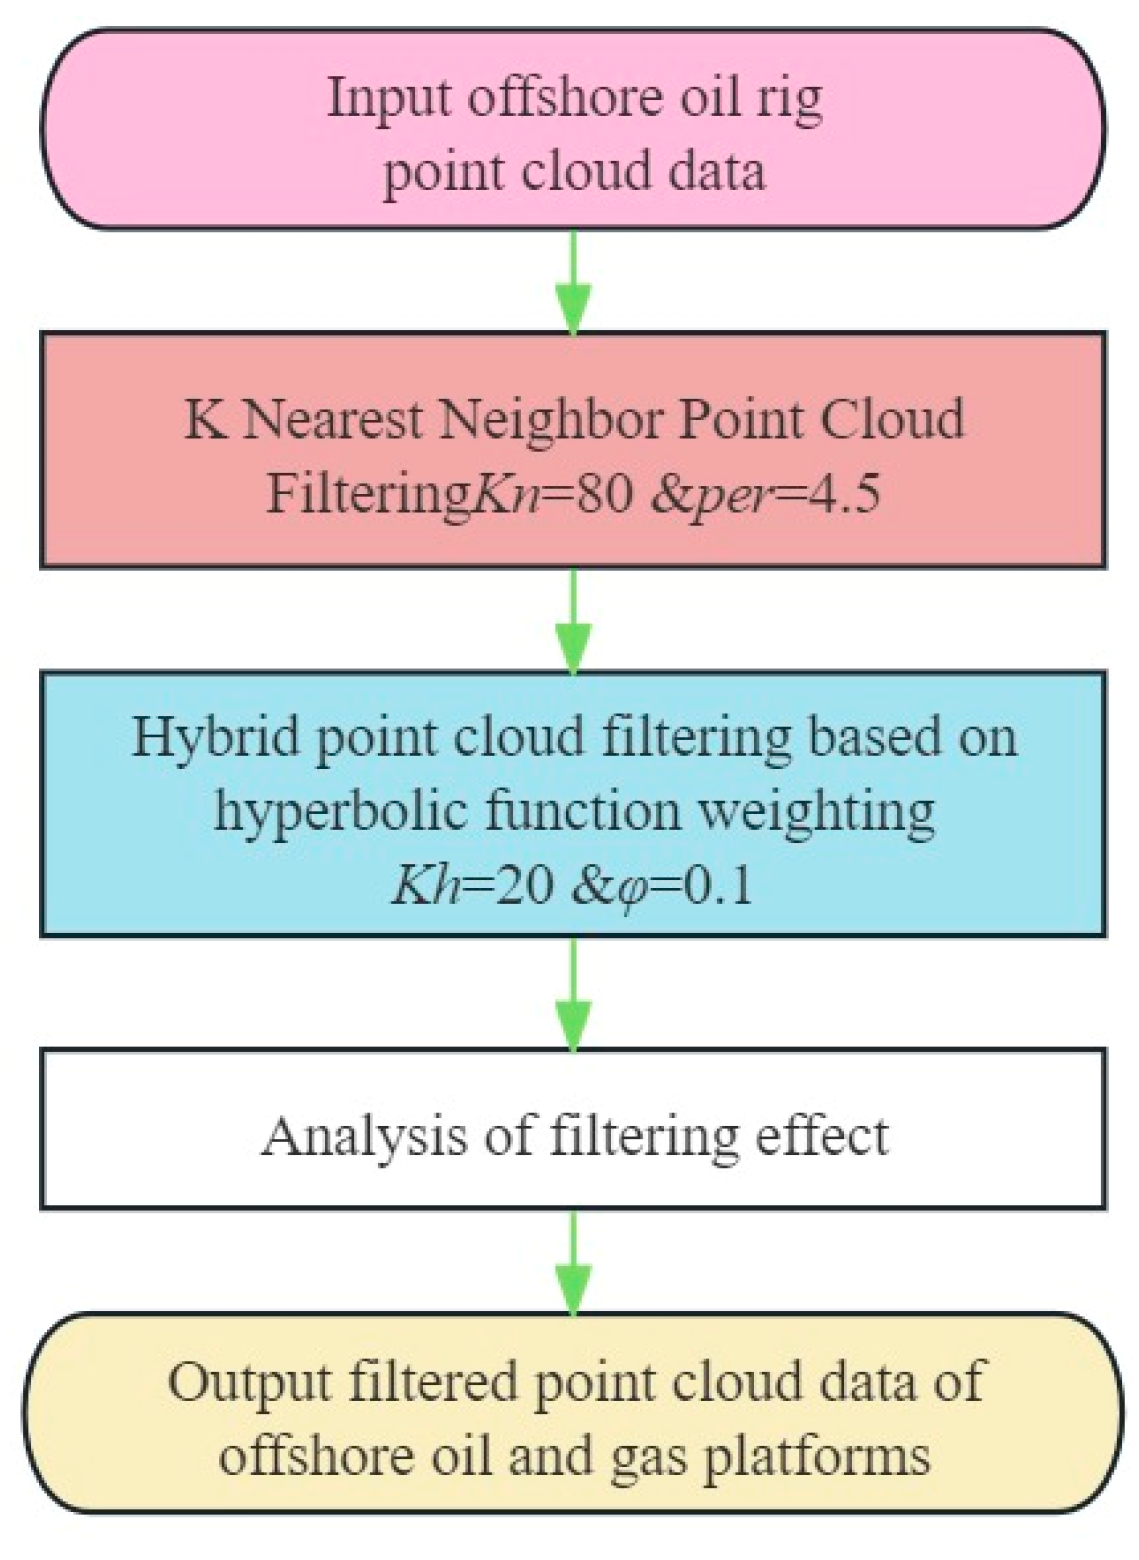
In this experiment, we used the optimal parameters of each algorithm, as determined through meticulous previous experiments, as a benchmark. We further validated the combined filtering method based on KNN_PCF and Hy_WHF (selecting parameters Kn = 80, per = 4.5, and Kh = 20, φ = 0.1) for its effectiveness in filtering point cloud data of offshore oil and gas platforms. Additionally, we compared this method to the combined filtering method based on radius and statistics (selecting parameters Ks = 8, σ = 1.5, and Kr = 90, r = 0.08) in terms of denoising effects.
To clearly demonstrate the differences between different combined filtering algorithms, we conducted a detailed comparison of their filtering effects using various indicators and visual analysis. A table of filtering evaluation parameters based on different combined algorithms (Table 7) was listed. The denoising effects of different filtering algorithms on point cloud data were visually demonstrated, with areas of noise points not removed after filtering highlighted in red rectangular frames (Figure 7). Additionally, a visualization of the offshore oil and gas platform point cloud data after combined filtering based on the KNN_PCF and Hy_WHF algorithms was shown (Figure 8).
From Table 7, it is evident that the combined filtering of point cloud data based on the KNN_PCF and Hy_WHF algorithms performs better than the combined filtering algorithm based on statistics and radius in three evaluation parameters: target point retention rate (TR), noise point screening rate (NSR), and denoising rate (Rd). Specifically, in terms of noise point screening rate (NSR), the combined filtering effect of the KNN_PCF and Hy_WHF algorithms is significantly superior to the method based on statistics and radius, with the former being about 11% higher. In terms of the error rate (Et) evaluation parameter, the performance of the combined filtering based on KNN_PCF and Hy_WHF algorithms (0.206%) far exceeds that of the combined method based on statistics and radius (0.781%).
The regions selected using the red boxes indicate noise points that cannot be rejected by the combined radius- and statistical-filtering-based algorithm but can be rejected by the combined KNN_PCF- and Hy_WHF-based algorithm, and the smoothing effect of the combined KNN_PCF- and Hy_WHF-based algorithm is clearly visible in these regions. The visualization results in Figure 7 clearly demonstrate the superiority of the combined filtering algorithm based on KNN_PCF and Hy_WHF over traditional combined methods. The significant reduction of noise points in the areas highlighted by red rectangular frames and the better preservation of details are evident.
Figure 8 shows the denoising effect of the combined filtering algorithm based on KNN_PCF and Hy_WHF on the entire offshore oil and gas platform dataset. We can see that the combined algorithm of this study can almost remove all dense clustered noise, surface noise points, and discrete points as well as eliminate light reflection noise, resulting in more accurate color information in the point cloud data.

3.3.3. Three-Dimensional Reconstruction of Point Cloud Data

First, we extracted the point cloud data of pipes and flanges from both the original point cloud data and the data processed by the optimal combined filtering algorithm and then used the Poisson reconstruction algorithm for 3D reconstruction [32]. Since the actual scanned data of the offshore oil and gas platform did not have corresponding real model data of the components, we selected visual analysis and consistency assessment as two indicators to validate the modeling effects.
Using pipes and flanges as examples, we performed 3D reconstructions of the data before and after filtering. The results of the 3D reconstruction precision evaluation parameters for different point cloud data sources are shown in Table 8. We visually presented the point cloud images of marine equipment components (Figure 9) and the reconstruction results of marine equipment component point cloud data (Figure 10).
From Table 8, it can be seen that the consistency of the results reconstructed from the filtered point cloud data is relatively high. After processing with the filtering algorithms of this study, the average distance and standard deviation for the pipe decreased by 3.28 mm and 0.047, respectively, while for the flange, they reduced from 8.26 mm to 1.85 mm, with the standard deviation decreasing to 0.002.
As can be seen in Figure 9, the point cloud data before denoising with the filtering algorithm have more noise points. This has a greater impact on the post-processing of the point cloud data.
From Figure 10, it is evident that the models reconstructed from unfiltered point cloud data have rough and uneven surfaces with many protrusions and depressions, especially at the edges and in detailed parts of the model. In contrast, the 3D reconstruction results after processing with the filtering algorithms of this study show a much smoother and finer surface as well as clear structural edges.

4. Discussion

The previous sections conducted experiments on point cloud data obtained from offshore oil and gas platforms. Individual filtering algorithms were employed to process the data, validating the suitability of the KNN_PCF algorithms for this specific dataset. Additionally, point cloud data filtering techniques were combined to enhance the quality of the dataset, and 3D surface reconstruction experiments were conducted on point cloud data captured from equipment components. In the following section, we will present and analyze the results obtained from these experiments.

4.1. Discussion on Individual Filtering Algorithm Experiments

In these experiments, we initially evaluated various filtering algorithms on offshore oil and gas platforms to identify the optimal parameter settings for each algorithm. Subsequently, we assessed the effectiveness of KNN_PCF algorithms in noise removal from offshore oil and gas platform point cloud data. In the following section, we will discuss the individual experiments in detail.
(1)
When selecting the optimal parameters for each algorithm, it becomes crucial to ensure the choice of neighboring points that are relatively appropriate, accurately assess the density and noise levels of the local area, minimize misjudgments, and maintain structural integrity to avoid losing important surface details during the denoising process [33].
(2)
This experiment aimed to compare the effectiveness of four distinct point cloud filtering methods in denoising offshore oil and gas platform data. Based on the obtained results (Table 5), the KNN_PCF algorithm demonstrated superior performance compared to the other algorithms. It exhibited higher rates of target point retention, noise point screening, and denoising, leading to the lowest total error rate. The superiority of the KNN_PCF method can be attributed to its ability to leverage local structural information [34]. By considering the density and distribution of neighboring points, this method can more accurately differentiate between noise points and target points.
(3)
Statistical filtering performs well in noise removal but is less effective in handling dense clustered noise and surface noise [35]. This is due to the fact that statistical filtering is mainly based on the global statistical information of the point cloud and cannot distinguish local dense noise in detail [36]. Global statistical filtering ignores local details [33].
(4)
Radius filtering has demonstrated improvements in handling densely clustered noise; however, it falls short in preserving data surface details. The underlying reason for this limitation is that radius filtering utilizes the count of points within a fixed radius to identify noise. Consequently, when dealing with point clouds of uneven density, radius filtering could mistakenly remove fine surface details [19].
(5)
When utilized independently, the Hy_WHF algorithms demonstrate unsatisfactory performance in scenarios with a high volume of noise points. This limitation primarily stems from the algorithm’s weighted hybrid principle, which is easily disrupted in environments with dense noise. However, the Hy_WHF algorithm is particularly adept in contexts in which noise points are relatively fewer and closer to the target point cloud. In such scenarios, its approach to balancing noise removal with the preservation of target points proves to be more effective. This is because the Hy_WHF algorithm is designed to handle surface noise points adeptly, excelling in environments where noise points are not overwhelmingly dense but are proximal to the target data [37].

4.2. Discussion on Combined Filtering Algorithm Experiments

This study revealed that the integrated approach, combining both radius filtering and statistical filtering algorithms, outperforms the usage of individual algorithms such as radius filtering or statistical filtering alone when processing point cloud data in large and complex scenes. The strength of this combined method lies in its ability to leverage the spatial consistency offered by radius filtering and the data distribution characteristics provided by statistical filtering. Consequently, this integrated approach facilitates the efficient identification of complex structures and effective removal of noise [38].
The experimental results additionally demonstrate that the Hy_WHF algorithm exhibits noteworthy effectiveness in environments with a minimal number of noise points. It particularly excels in eliminating noise points that are adjacent to the target point cloud, yielding noticeable smoothing effects. Moreover, it presents distinct advantages in handling noise points originating from light reflection and successfully restores color information in point clouds [39]. Consequently, combining this algorithm with the KNN_PCF algorithm not only safeguards the detailed information of the point cloud but also substantially enhances the efficiency of denoising operations.
Further comparative experiments have revealed that the KNN_PCF algorithm surpasses traditional radius and statistical filtering algorithms in terms of retention rate and noise screening efficiency. Therefore, combining the KNN_PCF with the Hy_WHF algorithm forms a combined approach that exhibits exceptional performance in processing point cloud data of offshore oil and gas platforms. This combined method proves to be more efficient in recognizing complex structures and handling noise compared to the simple combination of radius and statistical filtering algorithms. The combined approach showcases superior denoising results and preservation of structural details.

4.3. Discussion on 3D Reconstruction of Point Cloud Data Experiment

The experimental results clearly demonstrate that the optimal combined filtering algorithm used in this study played a key role in enhancing the accuracy of the 3D reconstructed models. This enhancement is evident not only in the reduction of average distance error and standard deviation but also, more importantly, in the significant improvement in the consistency of the reconstruction results [40]. The improvement is underpinned by the ability of the filtering algorithm to effectively remove noise while preserving key structural details of the model [41]. This is particularly crucial in the reconstruction of complex components such as pipes and flanges, where preserving details and removing noise is essential. As a result, the 3D models exhibit not only smoother and finer surfaces but also clearer edges, more accurately reflecting the actual shape and size of objects during the reconstruction process.
Further analysis reveals that the meticulous execution of the filtering algorithm in handling model edges and details effectively mitigates surface roughness and geometric distortion caused by noise points. This is particularly evident in the comparison of models reconstructed from unfiltered point cloud data with those processed in Figure 10. Models reconstructed from unfiltered data exhibit rough and uneven surfaces, with many protrusions and depressions at the edges and in detailed parts. In contrast, models processed through the filtering algorithm show much smoother surfaces and clear structural edges. This contrast highlights the importance of the filtering algorithm in 3D reconstruction, especially its ability to accurately reconstruct details and remove noise in large-scale point cloud data.

5. Conclusions

This study successfully implemented several point cloud filtering algorithms for offshore oil and gas platforms and rigorously evaluated their performance through a series of experiments. The following conclusions were drawn:
(1)
The study conducted a comprehensive evaluation of commonly used statistical and radius filtering algorithms, as well as the KNN_PCF and Hy_WHF algorithms proposed in this paper. The results indicate that while traditional filtering algorithms are generally effective, they have limitations in handling complex structures present in point cloud data from offshore oil and gas platforms. Specifically, traditional filtering approaches struggle to effectively address noise in densely populated areas of complex scenes, maintain the preservation of fine structural details, and adapt to the heterogeneity of point cloud data;
(2)
The combined filtering algorithm, which integrates KNN_PCF and Hy_WHF, offers substantial advantages compared to other single or combined filtering methods. It demonstrates superior performance in noise removal, enhancing smoothness, preserving the fidelity of point cloud data, addressing light reflection noise, and restoring the original colors of objects;
(3)
In denoising point cloud data of complex scenes, the effectiveness of combined filtering is more pronounced compared to single filtering methods;
(4)
Point cloud data processed with the combined filtering method can generate high-quality 3D models, showing advantages in complex 3D reconstruction of offshore oil and gas platforms.
While the current research has made notable progress, challenges in processing point cloud data for large scenes such as offshore oil and gas platforms, which are prone to various types of noise, still remain unresolved. Further research and exploration are therefore necessary. In order to enhance the accuracy and stability of filtering algorithms, future studies could explore the combination of deep learning techniques and other advanced computational methods. This approach would allow for the extraction of deeper features and patterns from the data, ultimately leading to improved algorithm performance.

Author Contributions

Conceptualization, C.R. and J.Y.; methodology, C.R. and X.Z.; software, H.Y.; validation, Z.W.; formal analysis, C.R. and X.Z.; investigation, C.R; resources, H.Y.; data curation, X.Z.; writing—original draft preparation, C.R.; writing—review and editing, Z.W. and H.Y.; visualization, J.Y. and C.R.; supervision, Z.W.; project administration, S.W.; funding acquisition, X.Z. All authors have read and agreed to the published version of the manuscript.

Funding

This research was funded by the National Natural Science Foundation of China (No. 42106072) and the Shandong Provincial Natural Science Foundation (No. ZR2020QD071).

Institutional Review Board Statement

Not applicable.

Informed Consent Statement

Not applicable.

Data Availability Statement

The data presented in this study are available on request from the corresponding author.

Acknowledgments

The authors would like to express their gratitude to the editors and the reviewers for their substantive and effective comments for the improvement of this paper.

Conflicts of Interest

The authors declare no conflicts of interest.

References

  1. Dominicis, L.D.; Fornetti, G.; Guarneri, M.; Collibus, M.F.D.; Mcstay, D. Structural Monitoring of Offshore Platforms by 3d Subsea Laser Profilers. In Proceedings of the 2013—Offshore Mediterranean Conference (OMC), Ravenna, Italy, 21–23 March 2013; p. OMC-2013-004. [Google Scholar]
  2. Chen, J.; Kira, Z.; Cho, Y.K. Deep learning approach to point cloud scene understanding for automated scan to 3D reconstruction. J. Comput. Civ. Eng. 2019, 30, 04019027.1–04019027.10. [Google Scholar] [CrossRef]
  3. Guo, Y.; Wang, H.; Lian, J. Review of integrated installation technologies for offshore wind turbines: Current progress and future development trends. Energy Convers. Manag. 2022, 255, 115319. [Google Scholar] [CrossRef]
  4. Mancini, F.; Dubbini, M.; Gattelli, M.; Stecchi, F.; Fabbri, S.; Gabbianelli, G. Using unmanned aerial vehicles (UAV) for high-resolution reconstruction of topography: The structure from motion approach on coastal environments. Remote Sens. 2013, 5, 6880–6898. [Google Scholar]
  5. Meribout, M.; Khezzar, L.; Azzi, A.; Ghendour, N. Leak detection systems in oil and gas fields: Present trends and future prospects. Flow Meas. Instrum. 2020, 75, 101772. [Google Scholar]
  6. Chandrasekaran, S. Dynamic Analysis and Design of Offshore Structures, 1st ed.; Springer: New Delhi, India, 2015. [Google Scholar]
  7. Zhu, H.; Jia, G.; Zhang, Q.; Zhang, S.; Lin, X.; Shuai, Y. Detecting Offshore Drilling Rigs with Multitemporal NDWI: A Case Study in the Caspian Sea. Remote Sens. 2021, 13, 1576. [Google Scholar]
  8. Orts-Escolano, S.; Morell, V.; García-Rodríguez, J.; Cazorla, M. Point cloud data filtering and downsampling using growing neural gas. In Proceedings of the 2013 International Joint Conference on Neural Networks (IJCNN), Dallas, TX, USA, 4–9 August 2013; pp. 1–8. [Google Scholar]
  9. Moorfield, B.; Haeusler, R.; Klette, R. Bilateral filtering of 3D point clouds for refined 3D roadside reconstructions. In Proceedings of the Computer Analysis of Images and Patterns: 16th International Conference (CAIP), Valletta, Malta, 2–4 September 2015; pp. 394–402. [Google Scholar]
  10. Zhang, D.; Lu, X.; Qin, H.; He, Y. Pointfilter: Point cloud filtering via encoder-decoder modeling. IEEE Trans. Vis. Comput. Graph. 2020, 27, 2015–2027. [Google Scholar] [CrossRef]
  11. Charron, N.; Phillips, S.; Waslander, S.L. De-noising of lidar point clouds corrupted by snowfall. In Proceedings of the 2018 15th Conference on Computer and Robot Vision (CRV), Toronto, ON, Canada, 8–10 May 2018; pp. 254–261. [Google Scholar]
  12. Jiao, C.; Wang, B.; Yi, Y. Research on point cloud data filtering algorithms. Foreign Electron. Meas. Technol. 2019, 38, 18–22. [Google Scholar]
  13. Yan, L.; Liu, H.; Tan, J.; Li, Z.; Chen, C. A multi-constraint combined method for ground surface point filtering from mobile lidar point clouds. Remote Sens. 2017, 9, 958. [Google Scholar] [CrossRef]
  14. Hu, C.; Pan, Z.; Li, P. 3D point cloud filtering method for leaves based on manifold distance and normal estimation. Remote Sens. 2019, 11, 198. [Google Scholar] [CrossRef]
  15. Anders, N.; Valente, J.; Masselink, R.; Keesstra, S. Comparing filtering techniques for removing vegetation from UAV-based photogrammetric point clouds. Drones 2019, 3, 61. [Google Scholar]
  16. Wang, W.; You, X.; Chen, L.; Tian, J.; Tang, F.; Zhang, L. A scalable and accurate de-snowing algorithm for LiDAR point clouds in winter. Remote Sens. 2022, 14, 1468. [Google Scholar]
  17. Klápště, P.; Fogl, M.; Barták, V.; Gdulová, K.; Urban, R.; Moudrý, V. Sensitivity analysis of parameters and contrasting performance of ground filtering algorithms with UAV photogrammetry-based and LiDAR point clouds. Int. J. Digit. Earth 2020, 13, 1672–1694. [Google Scholar] [CrossRef]
  18. Chen, M.; Tang, Y.; Zou, X.; Huang, K.; Li, L.; He, Y. High-accuracy multi-camera reconstruction enhanced by adaptive point cloud correction algorithm. Opt. Lasers Eng. 2019, 122, 170–183. [Google Scholar]
  19. Yang, L.; Liu, Y.; Peng, J.; Liang, Z. A novel system for off-line 3D seam extraction and path planning based on point cloud segmentation for arc welding robot. Robot. Comput.-Integr. Manuf. 2020, 64, 101929. [Google Scholar] [CrossRef]
  20. Chemisky, B.; Menna, F.; Nocerino, E.; Drap, P. Underwater survey for oil and gas industry: A review of close range optical methods. Remote Sens. 2021, 13, 2789. [Google Scholar] [CrossRef]
  21. Sun, S.; Huang, R. An adaptive k-nearest neighbor algorithm. In Proceedings of the 2010 Seventh International Conference on Fuzzy Systems and Knowledge Discovery, Yantai, China, 10–12 August 2010; pp. 91–94. [Google Scholar]
  22. Li, C.; Jin, G.; Liu, H.; Li, J. Active Impulsive Noise Control Algorithm Based on Adjustable Hyperbolic Tangent Function. Circuits Syst. Signal Process. 2023, 42, 5559–5578. [Google Scholar] [CrossRef]
  23. Kazhdan, M.; Chuang, M.; Rusinkiewicz, S.; Hoppe, H. Poisson Surface Reconstruction with Envelope Constraints. Comput. Graph. Forum 2020, 39, 173–182. [Google Scholar]
  24. Shang, H.; Liu, C.; Wang, R. Measurement methods of 3D shape of large-scale complex surfaces based on computer vision: A review. Measurement 2022, 197, 111302. [Google Scholar]
  25. Lv, D. Construction of Marine Environmental Management Information Sharing Platform Under the Background of Big Data. In Proceedings of the 2022 2nd International Conference on Education, Information Management and Service Science (EIMSS 2022), Changsha, China, 22–24 December 2022; Atlantis Press: Amsterdam, The Netherlands, 2022; pp. 437–447. [Google Scholar]
  26. Ma, B.; Liu, Y.; Han, Z. Learning signed distance functions from noisy 3d point clouds via noise to noise mapping. In Proceedings of the International Conference on Ma chine Learning ICML, Honolulu, HI, USA, 23–29 July 2023; Volume 2. [Google Scholar]
  27. Wang, X.; He, J.; Ma, L. Exploiting local and global structure for point cloud semantic segmentation with contextual point representations. Adv. Neural Inf. Process. Syst. 2019, 32. [Google Scholar] [CrossRef]
  28. Zhu, J.; Hu, X.; Zhang, Z.; Xiong, X. Hierarchical Outlier Fetection for Point Cloud Data Using a Density Analysis Method. Acta Geod. Cartogr. Sin. 2015, 44, 282–291. [Google Scholar]
  29. Dawood, K.A.; Sharif, K.Y.; Ghani, A.A.; Zulzalil, H.; Zaidan, A.A.; Zaidan, B.B. Towards a unified criteria model for usability evaluation in the context of open source software based on a fuzzy Delphi method. Inf. Softw. Technol. 2021, 130, 106453. [Google Scholar] [CrossRef]
  30. Wang, S.; Tian, Z.; Dong, K.; Xie, Q. Inconsistency of neighborhood based on Voronoi tessellation and Euclidean distance. J. Alloys Compd. 2021, 854, 156983. [Google Scholar]
  31. Hübner, P.; Clintworth, K.; Liu, Q.; Weinmann, M.; Wursthorn, S. Evaluation of HoloLens tracking and depth sensing for indoor mapping applications. Sensors 2020, 20, 1021. [Google Scholar] [CrossRef] [PubMed]
  32. Peng, S.; Jiang, C.; Liao, Y.; Niemeyer, M.; Pollefeys, M.; Geiger, A. Shape as points: A differentiable poisson solver. Adv. Neural Inf. Process. Syst. 2021, 34, 13032–13044. [Google Scholar]
  33. Ren, Y.; Li, T.; Xu, J.; Hong, W.; Zheng, Y.; Fu, B. Overall filtering algorithm for multiscale noise removal from point cloud data. IEEE Access 2021, 9, 110723–110734. [Google Scholar] [CrossRef]
  34. Yu, Z.; Chen, H.; Liu, J.; You, J.; Leung, H.; Han, G. Hybrid k-nearest neighbor classifier. IEEE Trans. Cybern. 2015, 46, 1263–1275. [Google Scholar] [CrossRef] [PubMed]
  35. Schall, O.; Belyaev, A.; Seidel, H.P. Robust filtering of noisy scattered point data. In Proceedings of the Eurographics/IEEE VGTC Symposium Point-Based Graphics, Stony Brook, NY, USA, 21–22 June 2005; pp. 71–144. [Google Scholar]
  36. Mattei, E.; Castrodad, A. Point cloud denoising via moving RPCA. Comput. Graph. Forum 2016, 36, 123–137. [Google Scholar] [CrossRef]
  37. Cunningham, P.; Delany, S.J. k-Nearest neighbour classifiers-A Tutorial. ACM Comput. Surv. CSUR 2021, 54, 1–25. [Google Scholar] [CrossRef]
  38. Zheng, Z.; Zha, B.; Zhou, Y.; Huang, J.; Chen, Y.; Zhang, H. Single-stage adaptive multi-scale point cloud noise filtering algorithm based on feature information. Remote Sens. 2022, 14, 367. [Google Scholar] [CrossRef]
  39. Tan, R.T.; Nishino, K.; Ikeuchi, K. Separating reflection components based on chromaticity and noise analysis. IEEE Trans. Pattern Anal. Mach. Intell. 2004, 26, 1373–1379. [Google Scholar]
  40. Yang, Q.; Yan, P.; Zhang, Y.; Yu, H.; Shi, Y.; Mou, X.; Wang, G. Low-dose CT image denoising using a generative adversarial network with Wasserstein distance and perceptual loss. IEEE Trans. Med. Imaging 2018, 37, 1348–1357. [Google Scholar] [PubMed]
  41. Treece, G. Morphology-based noise reduction: Structural variation and thresholding in the bitonic filter. IEEE Trans. Image Process. 2019, 29, 336–350. [Google Scholar] [CrossRef] [PubMed]
Figure 1. Point cloud data of offshore oil and gas platforms.
Sensors 24 00615 g001
Figure 2. Point cloud data of selected offshore oil and gas platforms.
Sensors 24 00615 g002
Figure 3. Flowchart of K-Nearest-Neighborhood point-cloud-filtering-based algorithm.
Sensors 24 00615 g003
Figure 4. Flowchart of hyperbolic weighted hybrid filtering algorithm.
Sensors 24 00615 g004
Figure 5. Technical route to a combinatorial filtering algorithm based on a hybrid of K-Nearest-Neighborhood and hyperbolic weighting.
Sensors 24 00615 g005
Figure 6. Visualization results based on different filtering algorithms. (a) KNN_PCF algorithm filtered point cloud data; (b) statistical filtered point cloud data; (c) radius-filtered point cloud data; (d) Hy_WHF algorithm filtered point cloud data.
Sensors 24 00615 g006
Figure 7. Visualization results based on different combined filtering algorithms. (a) Combined filtering algorithm based on the KNN_PCF and Hy_WHF; (b) combined based on the statistics and radius filtering.
Sensors 24 00615 g007
Figure 8. Offshore oil rig point cloud data after combined filtering algorithm based on KNN_PCF and Hy_WHF.
Sensors 24 00615 g008
Figure 9. Marine engineering equipment components original point cloud. (a) Pipeline original point cloud; (b) pipeline post-filter point cloud; (c) flange original point cloud; (d) flange post-filter point cloud.
Sensors 24 00615 g009
Figure 10. Three-dimensional reconstruction results of offshore engineering equipment components. (a) Pipeline original point cloud reconstruction results; (b) pipeline filtered point cloud reconstruction results; (c) flange original point cloud reconstruction results; (d) flange filtered point cloud reconstruction results.
Sensors 24 00615 g010
Table 1. Software and hardware configuration.
NameConfiguration
Operating SystemUbuntu 18.04
ProcessorIntel@Xeon(R)W-2235 [email protected] GHz x 12
Graphics CardNVIDIA Quadro RTX4000 (Santa Clara, CA, USA)
Video Memory8 GB
Development EnvironmentAnaconda 3
Compilation EnvironmentPyCharm 2022.2.1
Python Version3.7.3
PCL Version1.9.1
VTK Version8.2.0
QtCreator Version5.9.7
Table 2. Evaluation for different parameters of statistical filtering algorithm.
Algorithm ParameterizationTR (%)NSR (%)Rd (%)Et (%)
Ks = 8 and σ = 1.598.55271.34471.8921.397
Ks = 6 and σ = 1.598.41068.85970.1881.536
Ks = 10 and σ = 1.598.32967.10968.1201.615
Ks = 8 and σ = 1.098.42268.96569.9931.524
Ks = 8 and σ = 2.098.28566.06766.7591.659
Table 3. Evaluation for different parameters of the radius filtering algorithm.
Algorithm ParameterizationTR (%)NSR (%)Rd (%)Et (%)
Kr = 90 and r = 0.0899.06982.35786.0820.892
Kr = 60 and r = 0.0898.78376.87680.3251.169
Kr = 120 and r = 0.0898.24871.92888.7851.676
Kr = 90 and r = 0.0698.26171.08484.6901.668
Kr = 90 and r = 0.198.70976.46583.1551.238
Table 4. Evaluation based on different parameters of KNN_PCF algorithm.
Algorithm ParameterizationTR (%)NSR (%)Rd (%)Et (%)
Kn = 80 and per = 4.599.48589.98791.4170.492
Kn = 90 and per = 4.599.45889.48191.1440.518
Kn = 70 and per = 4.599.44389.15090.3370.532
Kn = 80 and per = 4.099.11882.52282.5880.846
Kn = 80 and per = 5.098.84287.52190.0431.317
Table 5. Evaluation for different parameters of the Hy_WHF algorithm.
Algorithm ParameterizationTR (%)NSR (%)Rd (%)Et (%)
Kh = 20 and φ = 0.198.67373.60773.7491.279
Kh = 15 and φ = 0.198.51070.26470.2651.439
Kh = 25 and φ = 0.197.60771.22272.2281.344
Kh = 20 and φ = 0.0898.38267.68067.7121.565
Kh = 20 and φ = 0.1298.613172.39272.5221.438
Table 6. Filtering evaluation parameters for different algorithms.
Algorithm ParameterizationTR (%)NSR (%)Rd (%)Et (%)
KNN_PCF99.48589.98791.4170.492
Hy_WHF98.67373.60773.7491.279
Statistical filtering98.55271.34471.8921.397
Radius filtering99.06982.35786.0820.892
Table 7. Filtering evaluation parameters based on different combined algorithms.
AlgorithmTR (%)NSR (%)Rd (%)Et (%)
Combined Filtering Based on
the KNN_PCF and Hy_WHF Algorithms
99.78495.73695.7420.206
Combined Filtering Based on
the Radius and Statistical Filtering
99.18384.58488.6130.781
Table 8. Accuracy evaluation of 3D reconstruction.
Part TypeSource of Point Cloud DataMean Distance/mmStandard Deviation
PipelineOriginal Point Cloud7.300.078
Post-Filter Point Cloud4.020.031
FlangeOriginal Point Cloud8.260.091
Post-Filter Point Cloud1.850.002
Disclaimer/Publisher’s Note: The statements, opinions and data contained in all publications are solely those of the individual author(s) and contributor(s) and not of MDPI and/or the editor(s). MDPI and/or the editor(s) disclaim responsibility for any injury to people or property resulting from any ideas, methods, instructions or products referred to in the content.

