


GLFNet: Combining Global and Local Information in Vehicle Re-Recognition


Abstract
1. Introduction
2. Related Work
3. Proposed Method
3.1. Feature Extraction
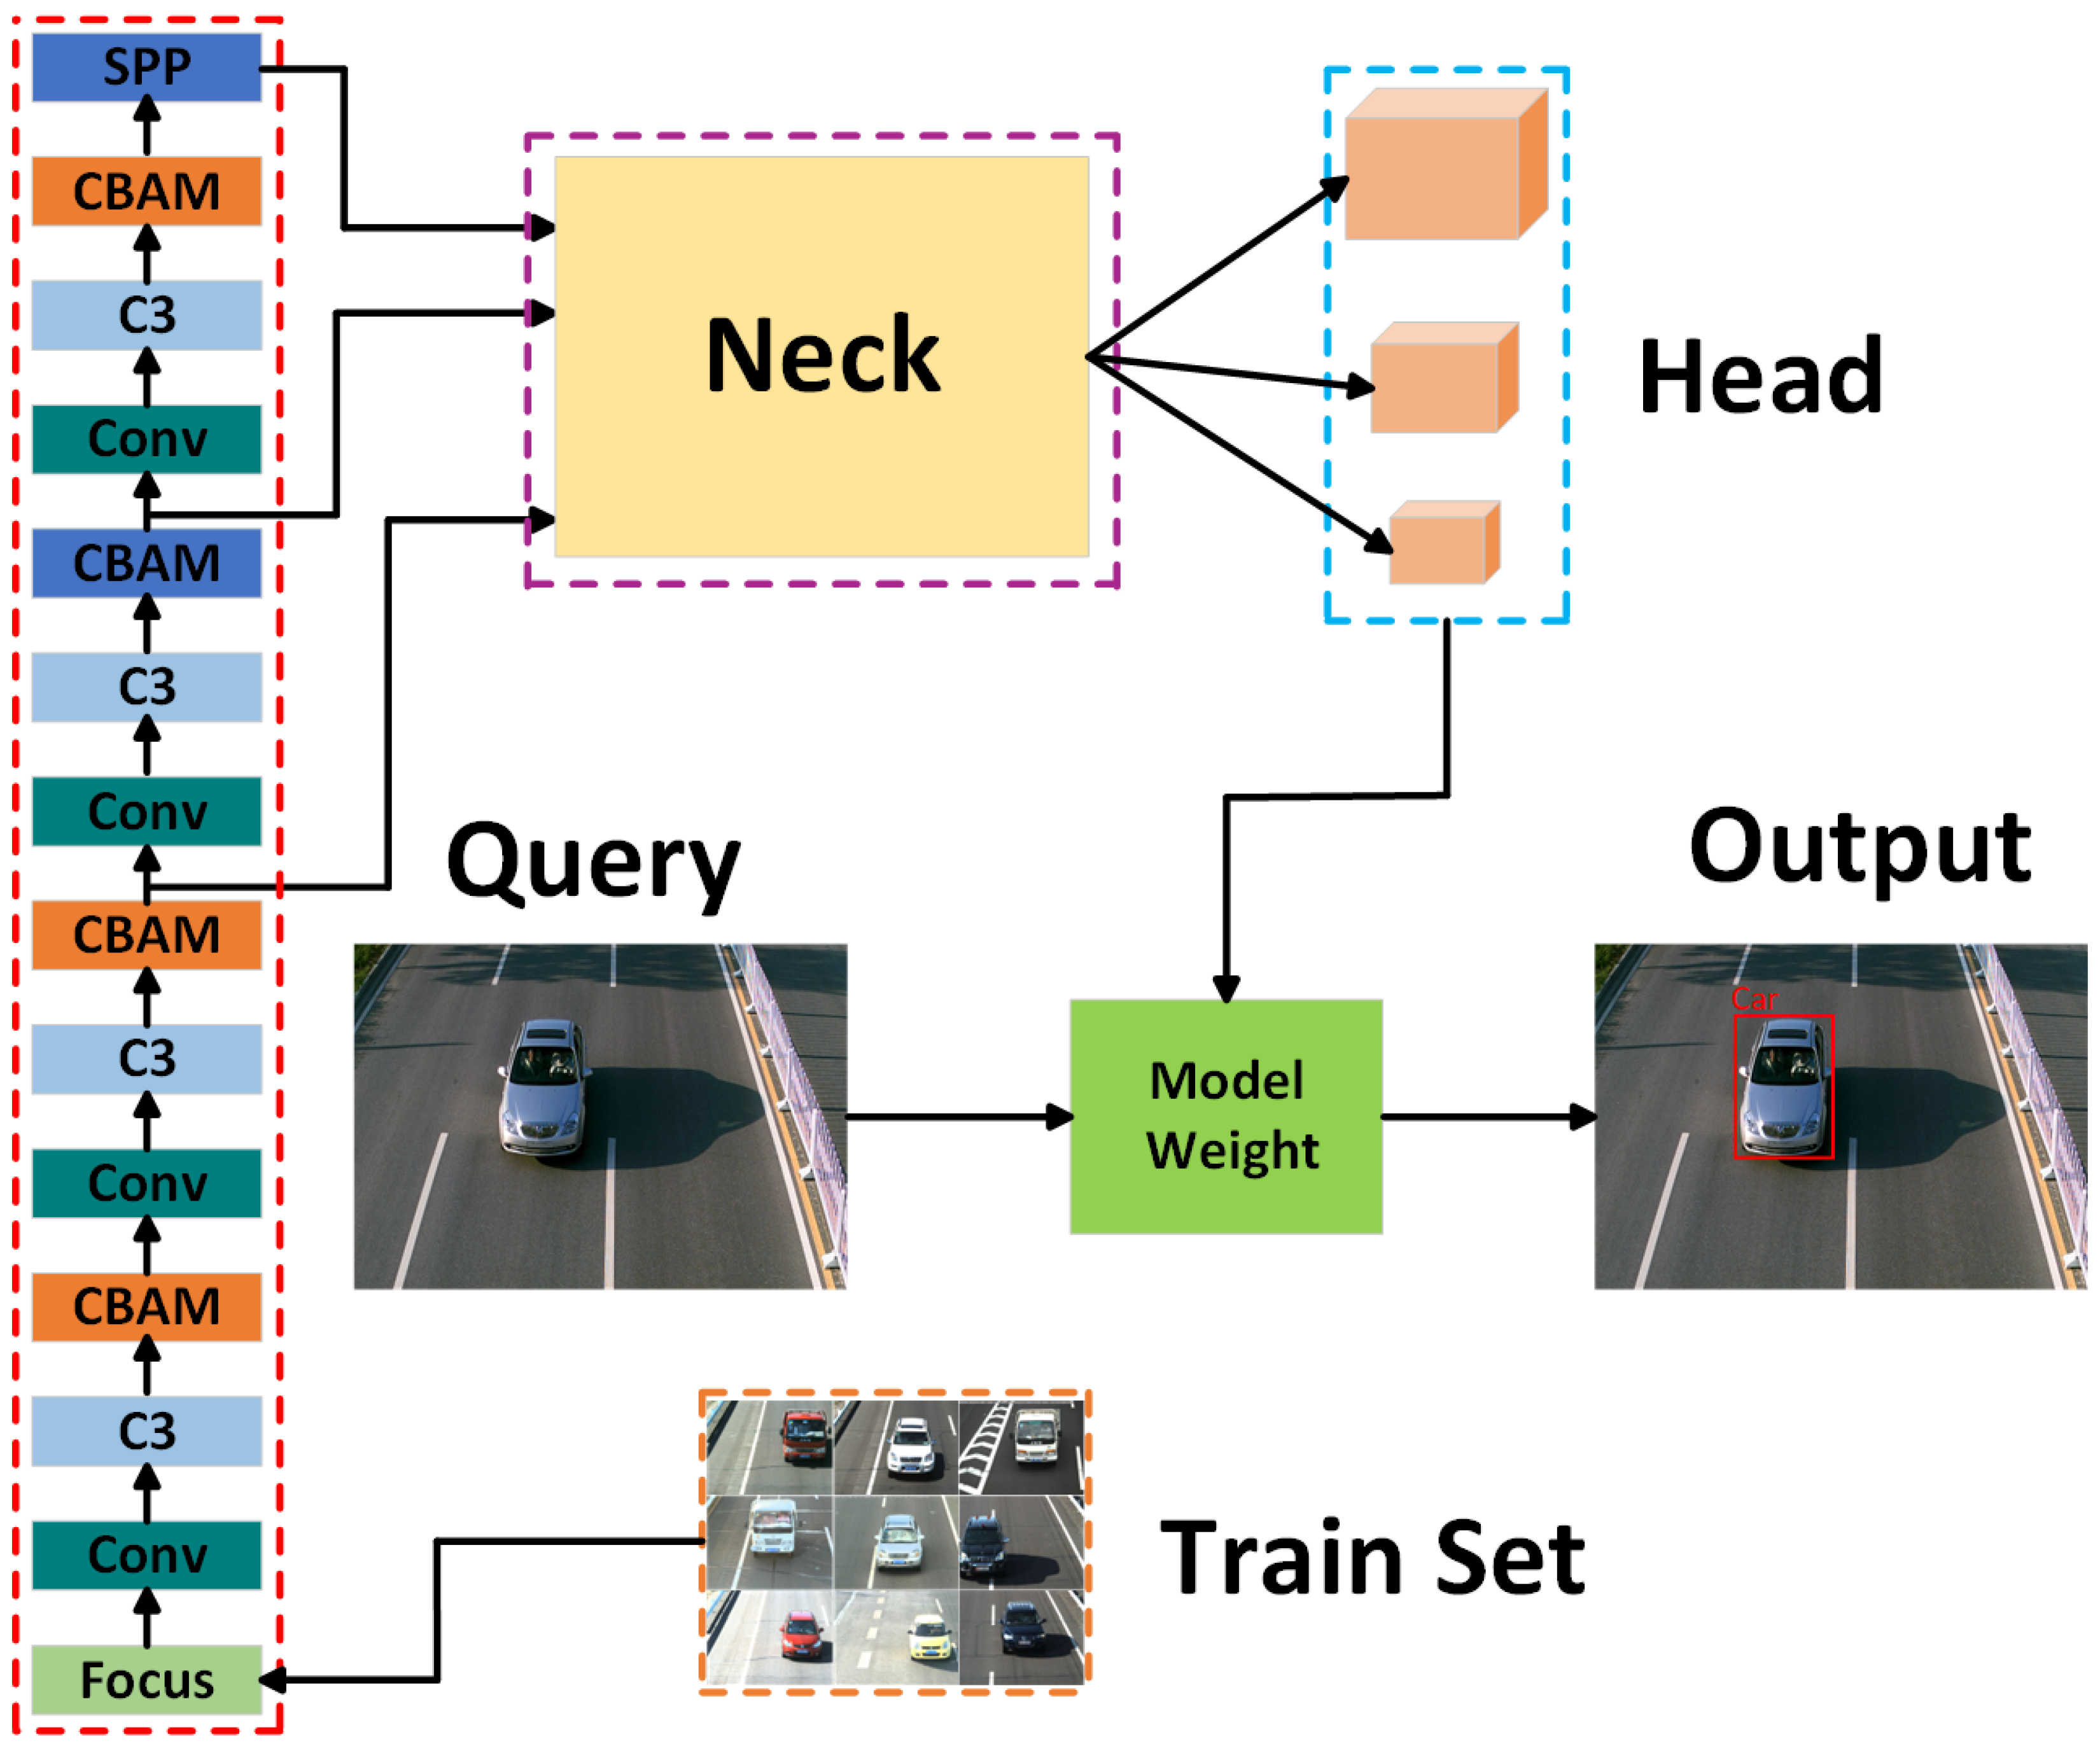
3.1.1. Global Network-YOLOv5 Detection Algorithm Improved
- (1)
- Backbone network
- (2)
- Target detection loss function
- (3)
- NMS phase
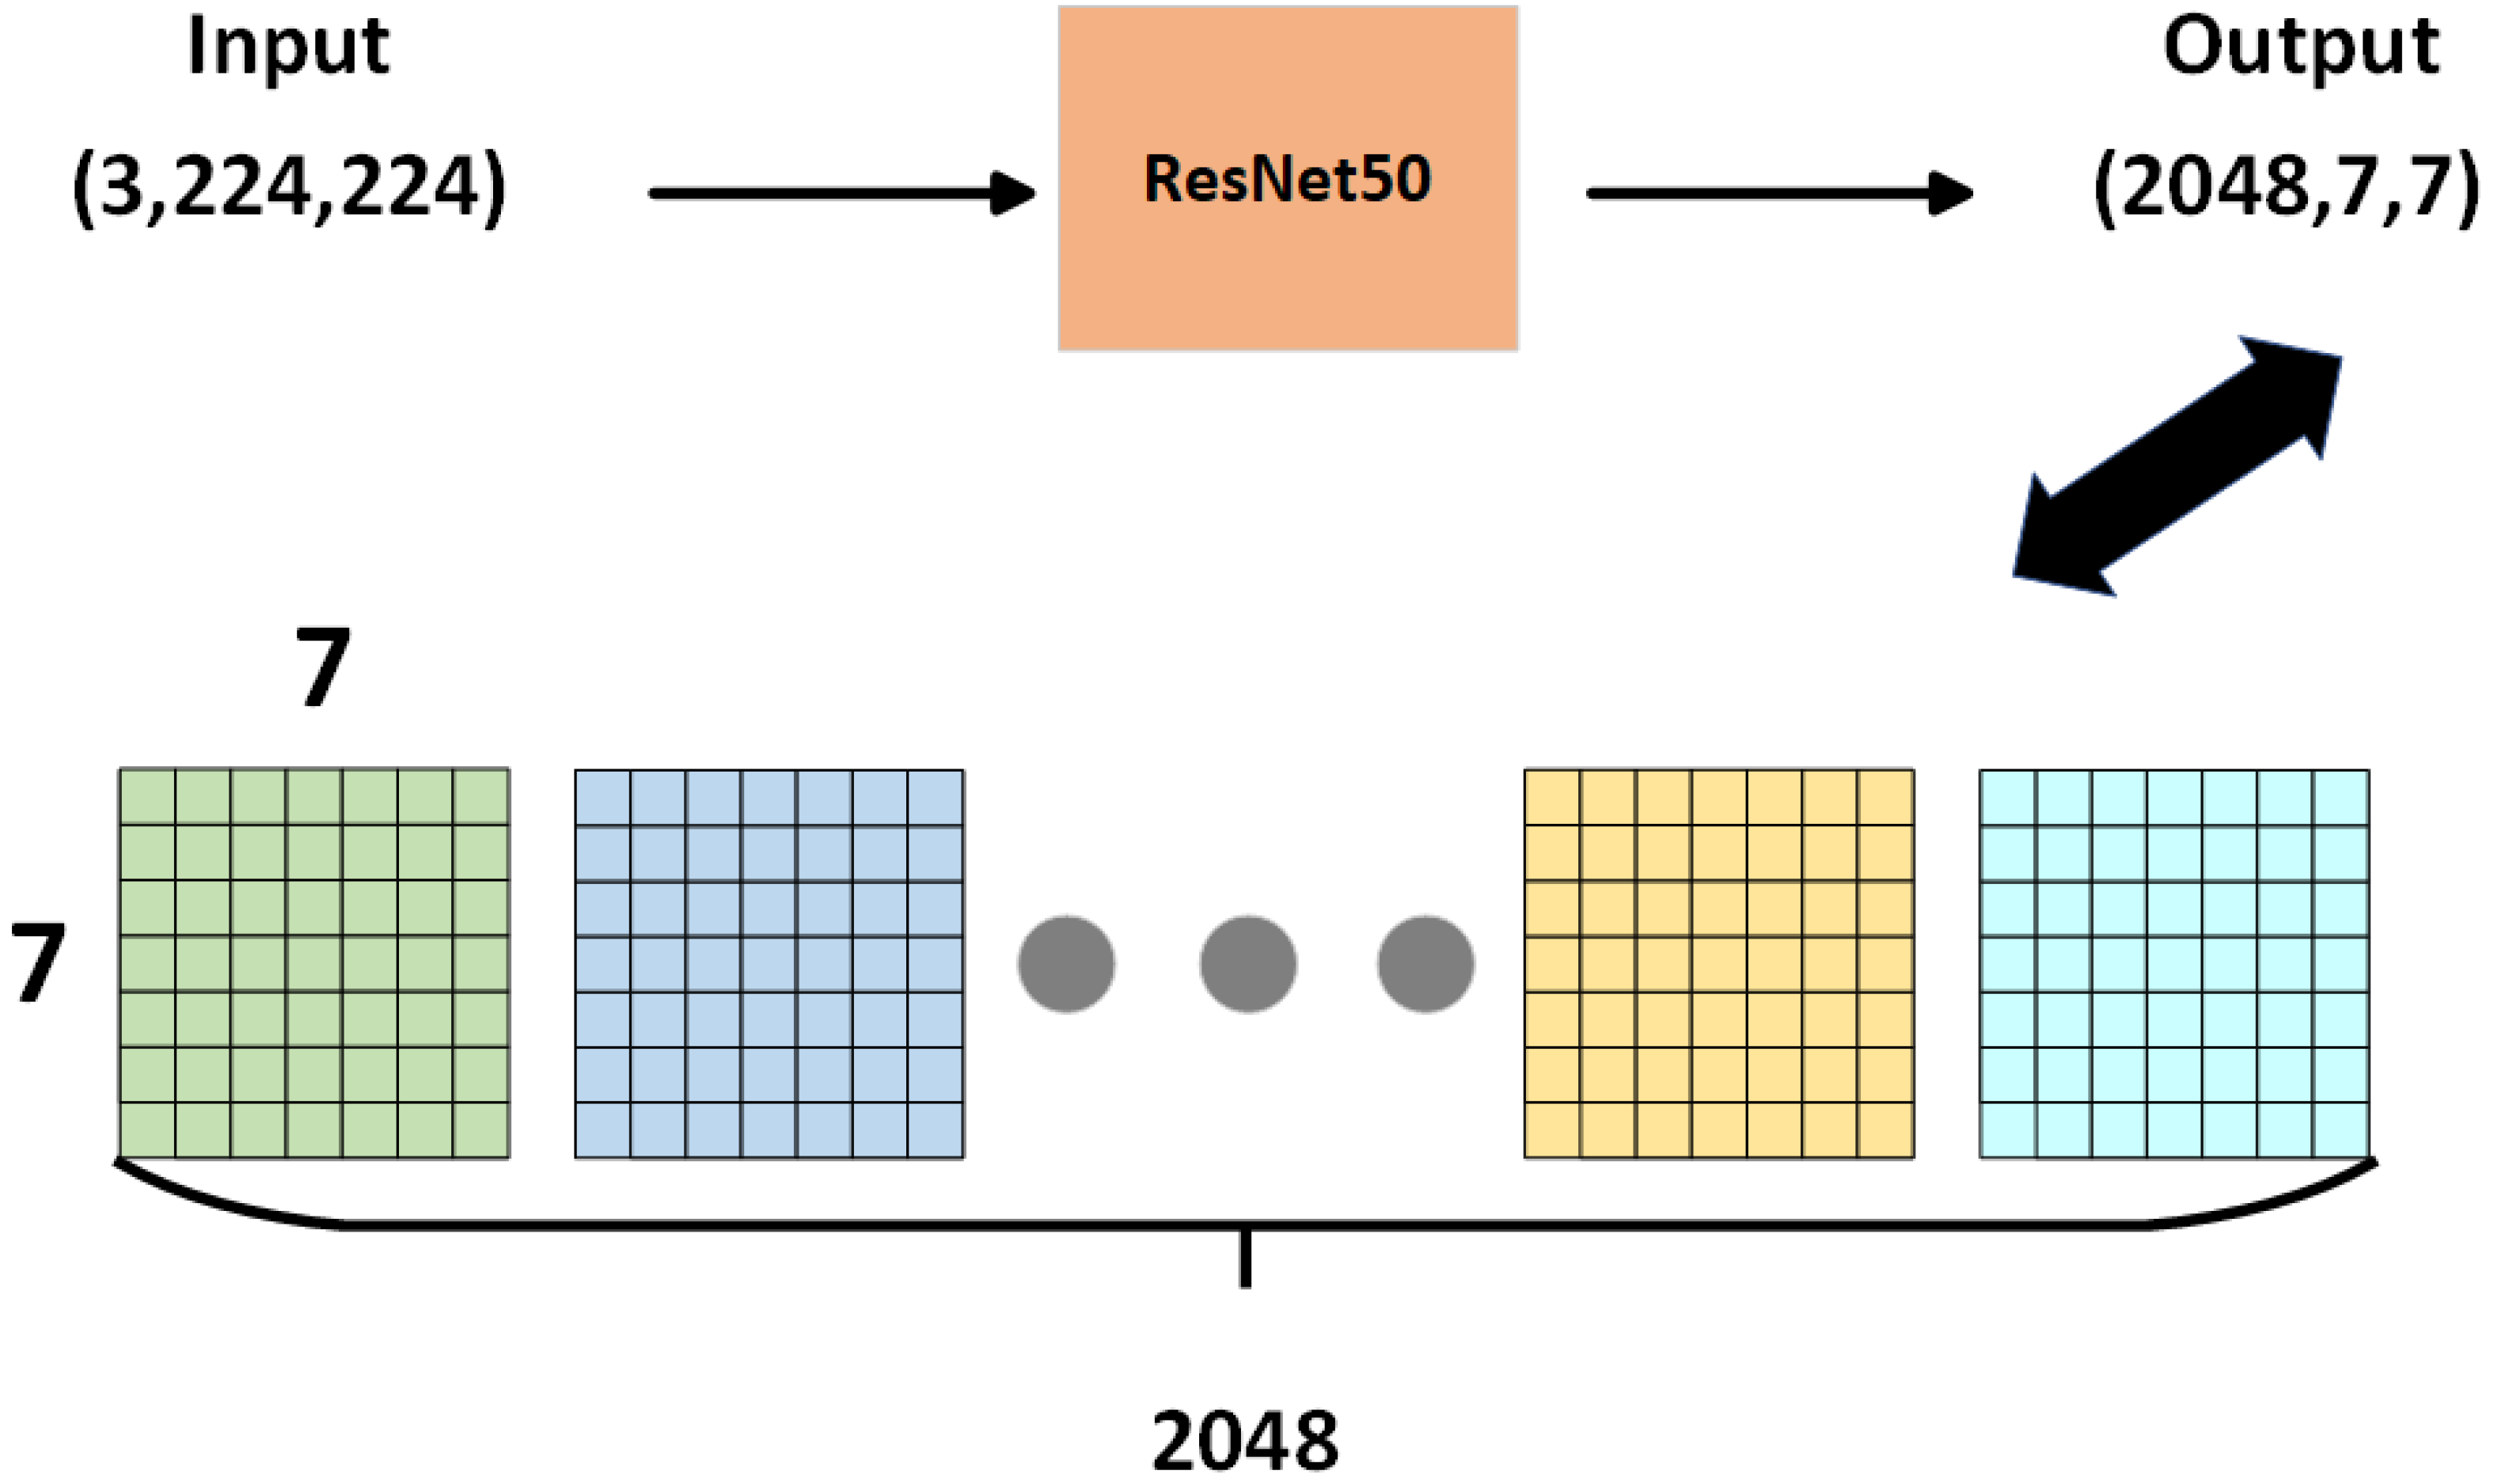
3.1.2. Local Network-ResNet50 Improved
- (1)
- Network architecture
- (2)
- Local loss
3.2. Loss Function
4. Performance Comparison
4.1. Experimental Data Set
4.2. Experimental Detail
4.3. Evaluation on VeRi-776
4.4. Evaluation on VehicleID
4.5. Evaluation on VERI-Wild
5. Ablation Experiment
- VeRi-776 Dataset:
- VehicleID Dataset:
- VERI-Wild Dataset:
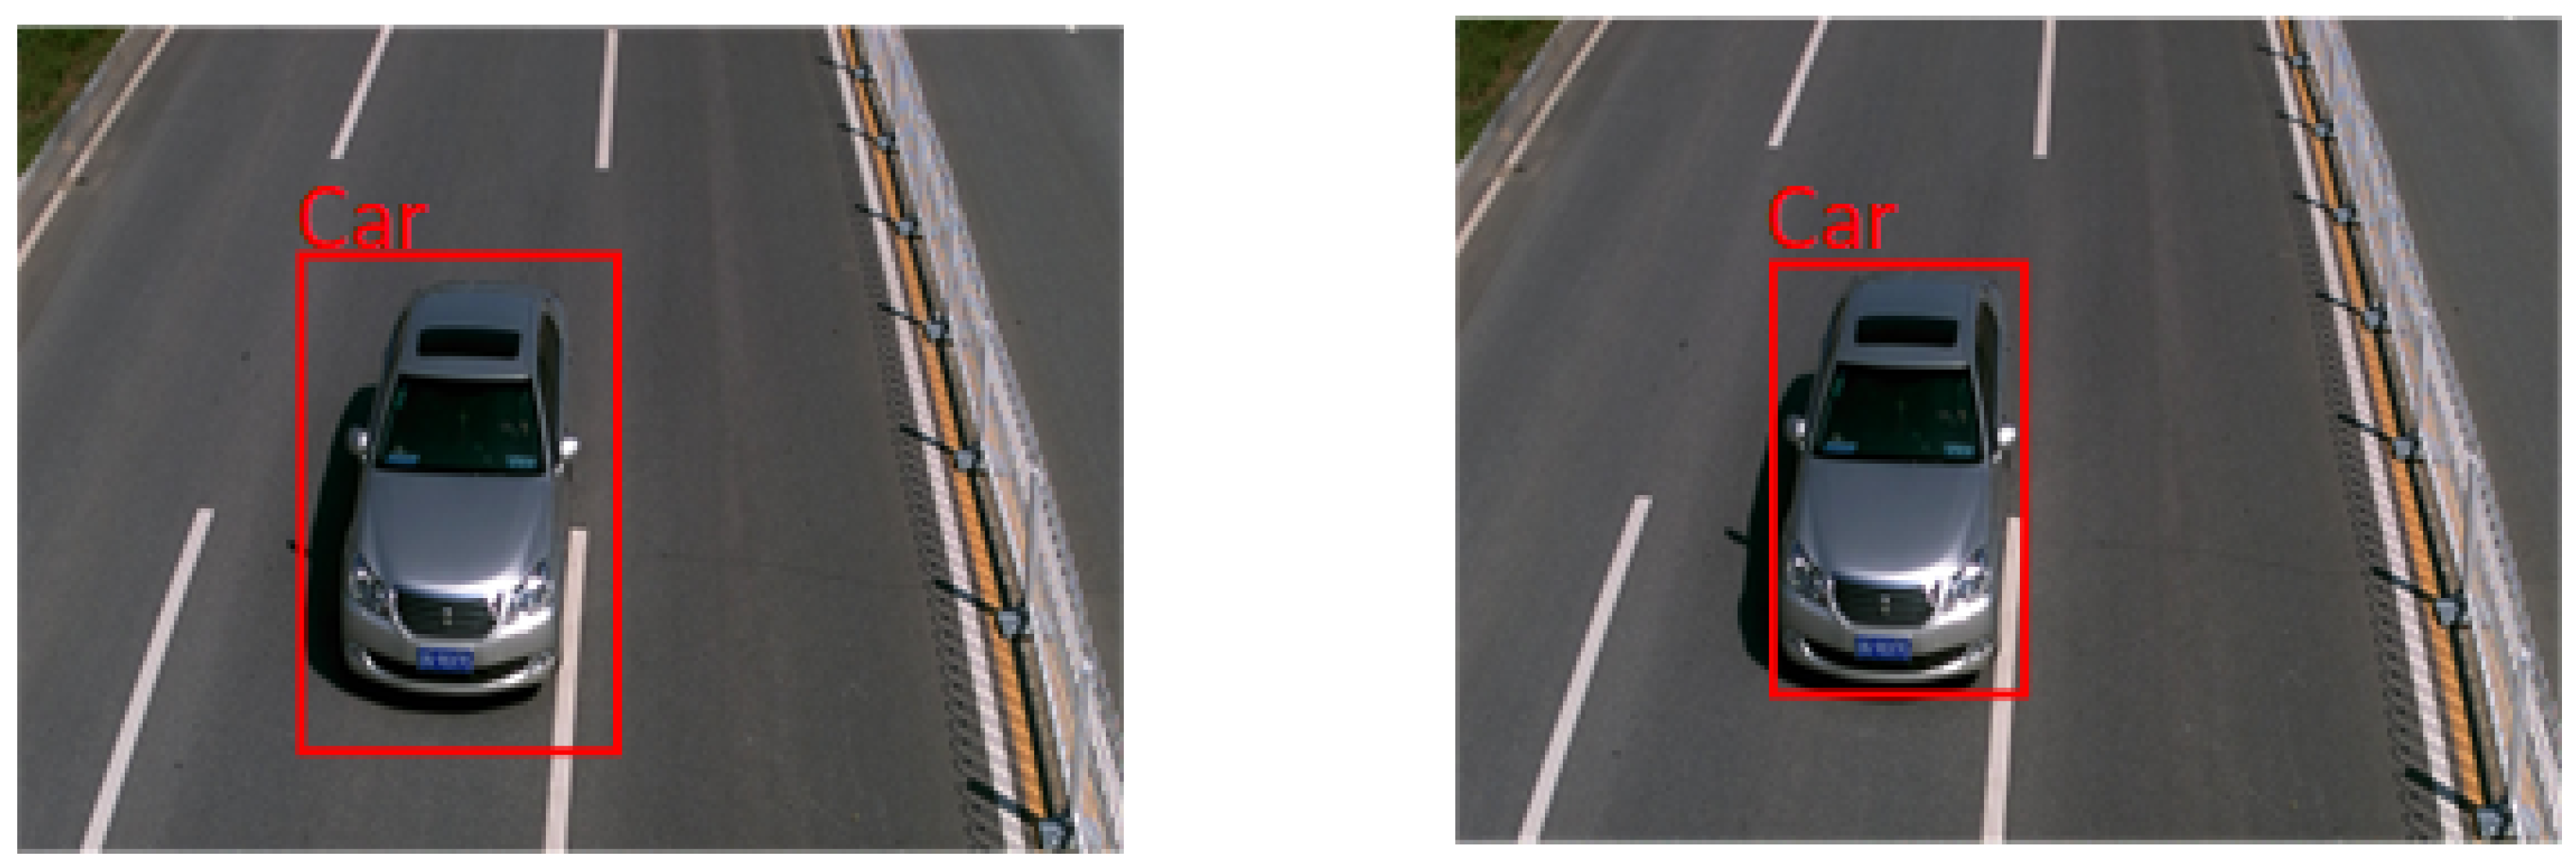
6. Case Study
7. Conclusions
Author Contributions
Funding
Data Availability Statement
Conflicts of Interest
References
- Regragui, Y.; Moussa, N. A real-time path planning for reducing vehicles traveling time in cooperative-intelligent transportation systems. Simul. Model. Pract. Theory 2023, 123, 102710. [Google Scholar] [CrossRef]
- Wu, Y.; Wu, L.; Cai, H. A deep learning approach to secure vehicle to road side unit communications in intelligent transportation system. Comput. Electr. Eng. 2023, 105, 108542. [Google Scholar] [CrossRef]
- Zuo, J.; Dong, L.; Yang, F.; Guo, Z.; Wang, T.; Zuo, L. Energy harvesting solutions for railway transportation: A comprehensive review. Renew. Energy 2023, 202, 56–87. [Google Scholar]
- Sharma, P.; Singh, A.; Singh, K.K.; Dhull, A. Vehicle identification using modified region based convolution network for intelligent transportation system. Multimed. Tools Appl. 2022, 81, 34893–34917. [Google Scholar] [CrossRef]
- Pirgazi, J.; Sorkhi, A.G.; Kallehbasti, M.M.P. An efficient robust method for accurate and real-time vehicle plate recognition. J. Real-Time Image Process. 2021, 18, 1759–1772. [Google Scholar] [CrossRef]
- Hua, J.; Shi, Y.; Xie, C.; Zhang, H.; Zhang, J. Pedestrian- and Vehicle-Detection Algorithm Based on Improved Aggregated Channel Features. IEEE Access 2021, 9, 25885–25897. [Google Scholar] [CrossRef]
- Won, M. Intelligent Traffic Monitoring Systems for Vehicle Classification: A Survey. IEEE Access 2020, 8, 73340–73358. [Google Scholar] [CrossRef]
- Zhou, J.; Dong, Q.; Zhang, Z.; Liu, S.; Durrani, T.S. Cross-modality person re-identification via local paired graph attention network. Sensors 2023, 23, 4011. [Google Scholar]
- Pan, W.; Huang, L.; Liang, J.; Hong, L.; Zhu, J. Progressively Hybrid Transformer for Multi-Modal Vehicle Re-Identification. Sensors 2023, 23, 4206. [Google Scholar]
- Lv, K.; Du, H.; Hou, Y.; Deng, W.; Sheng, H.; Jiao, J.; Zheng, L. Vehicle Re-Identification with Location and Time Stamps. In Proceedings of the CVPR Workshops, Long Beach, CA, USA, 16–20 June 2019; pp. 399–406. [Google Scholar]
- Sheng, H.; Lv, K.; Liu, Y.; Ke, W.; Lyu, W.; Xiong, Z.; Li, W. Combining pose invariant and discriminative features for vehicle reidentification. IEEE Internet Things J. 2020, 8, 3189–3200. [Google Scholar]
- Lv, K.; Sheng, H.; Xiong, Z.; Li, W.; Zheng, L. Pose-based view synthesis for vehicles: A perspective aware method. IEEE Trans. Image Process. 2020, 29, 5163–5174. [Google Scholar] [CrossRef]
- Zhu, J.; Zeng, H.; Huang, J.; Liao, S.; Lei, Z.; Cai, C.; Zheng, L. Vehicle Re-Identification Using Quadruple Directional Deep Learning Features. IEEE Trans. Intell. Transp. Syst. 2020, 21, 410–420. [Google Scholar] [CrossRef]
- Wang, H.; Hou, J.; Chen, N. A Survey of Vehicle Re-Identification Based on Deep Learning. IEEE Access 2019, 7, 172443–172469. [Google Scholar] [CrossRef]
- Zhang, Y.; Liu, D.; Zha, Z.J. Improving triplet-wise training of convolutional neural network for vehicle re-identification. In Proceedings of the 2017 IEEE International Conference on Multimedia and Expo, ICME 2017, Hong Kong, China, 10–14 July 2017; pp. 1386–1391. [Google Scholar] [CrossRef]
- Liu, X.; Liu, W.; Mei, T.; Ma, H. A Deep Learning-Based Approach to Progressive Vehicle Re-identification for Urban Surveillance. In Proceedings of the ECCV 2016, Amsterdam, The Netherlands, 11–14 October 2016; Springer International Publishing: Cham, Switzerland, 2016. [Google Scholar]
- Yan, K.; Tian, Y.; Wang, Y.; Zeng, W.; Huang, T. Exploiting Multi-grain Ranking Constraints for Precisely Searching Visually-similar Vehicles. In Proceedings of the IEEE International Conference on Computer Vision, Venice, Italy, 22–29 October 2017. [Google Scholar]
- Liu, H.; Tian, Y.; Yang, Y.; Pang, L.; Huang, T. Deep relative distance learning: Tell the difference between similar vehicles. In Proceedings of the IEEE Conference on Computer Vision and Pattern Recognition, Las Vegas, NV, USA, 27–30 June 2016; pp. 2167–2175. [Google Scholar]
- Lin, Y.; Zheng, L.; Zheng, Z.; Wu, Y.; Hu, Z.; Yan, C.; Yang, Y. Improving person re-identification by attribute and identity learning. Pattern Recognit. 2019, 95, 151–161. [Google Scholar] [CrossRef]
- Li, H.; Li, C.; Zheng, A.; Tang, J.; Luo, B. Attribute and State Guided Structural Embedding Network for Vehicle Re-Identification. IEEE Trans. Image Process. 2022, 31, 5949–5962. [Google Scholar] [CrossRef] [PubMed]
- Tu, J.; Chen, C.; Huang, X.; He, J.; Guan, X. DFR-ST: Discriminative feature representation with spatio-temporal cues for vehicle re-identification. Pattern Recognit. 2022, 131, 108887. [Google Scholar] [CrossRef]
- Huang, W.; Zhong, X.; Jia, X.; Liu, W.; Feng, M.; Wang, Z.; Satoh, S. Vehicle Re-Identification with Spatio-Temporal Model Leveraging by Pose View Embedding. Electronics 2022, 11, 1354. [Google Scholar] [CrossRef]
- Lu, Z.; Lin, R.; Lou, X.; Zheng, L.; Hu, H. Identity-Unrelated Information Decoupling Model for Vehicle Re-Identification. IEEE Trans. Intell. Transp. Syst. 2022, 23, 19001–19015. [Google Scholar] [CrossRef]
- Wang, S.; Wang, Q.; Min, W.; Han, Q.; Gai, D.; Luo, H. Trade-off background joint learning for unsupervised vehicle re-identification. Vis. Comput. 2023, 39, 3823–3835. [Google Scholar] [CrossRef]
- Li, W.; Xu, J.; Huo, J.; Wang, L.; Gao, Y.; Luo, J. Distribution consistency based covariance metric networks for few-shot learning. In Proceedings of the AAAI Conference on Artificial Intelligence, Honolulu, HI, USA, 29–31 January 2019; Volume 33, pp. 8642–8649. [Google Scholar]
- Li, W.; Wang, L.; Xu, J.; Huo, J.; Gao, Y.; Luo, J. Revisiting Local Descriptor Based Image-To-Class Measure for Few-Shot Learning. In Proceedings of the IEEE Conference on Computer Vision and Pattern Recognition, CVPR 2019, Long Beach, CA, USA, 16–20 June 2019; pp. 7260–7268. [Google Scholar] [CrossRef]
- Feris, R.S.; Siddiquie, B.; Petterson, J.; Zhai, Y.; Datta, A.; Brown, L.M.; Pankanti, S. Large-scale vehicle detection, indexing, and search in urban surveillance videos. IEEE Trans. Multimed. 2011, 14, 28–42. [Google Scholar] [CrossRef]
- Wang, Z.; Tang, L.; Liu, X.; Yao, Z.; Yi, S.; Shao, J.; Yan, J.; Wang, S.; Li, H.; Wang, X. Orientation invariant feature embedding and spatial temporal regularization for vehicle re-identification. In Proceedings of the IEEE International Conference on Computer Vision, Venice, Italy, 22–29 October 2017; pp. 379–387. [Google Scholar]
- Shen, Y.; Xiao, T.; Li, H.; Yi, S.; Wang, X. Learning deep neural networks for vehicle re-id with visual-spatio-temporal path proposals. In Proceedings of the IEEE International Conference on Computer Vision, Venice, Italy, 22–29 October 2017; pp. 1900–1909. [Google Scholar]
- Lou, Y.; Bai, Y.; Liu, J.; Wang, S.; Duan, L.Y. Embedding adversarial learning for vehicle re-identification. IEEE Trans. Image Process. 2019, 28, 3794–3807. [Google Scholar] [CrossRef] [PubMed]
- Meng, D.; Li, L.; Liu, X.; Li, Y.; Yang, S.; Zha, Z.J.; Gao, X.; Wang, S.; Huang, Q. Parsing-based view-aware embedding network for vehicle re-identification. In Proceedings of the IEEE/CVF Conference on Computer Vision and Pattern Recognition, Seattle, WA, USA, 13–19 June 2020; pp. 7103–7112. [Google Scholar]
- He, B.; Li, J.; Zhao, Y.; Tian, Y. Part-regularized near-duplicate vehicle re-identification. In Proceedings of the IEEE/CVF Conference on Computer Vision and Pattern Recognition, Long Beach, CA, USA, 15–20 June 2019; pp. 3997–4005. [Google Scholar]
- Khorramshahi, P.; Peri, N.; Chen, J.c.; Chellappa, R. The devil is in the details: Self-supervised attention for vehicle re-identification. In Proceedings of the Computer Vision–ECCV 2020: 16th European Conference, Glasgow, UK, 23–28 August 2020; pp. 369–386. [Google Scholar]
- Peng, J.; Wang, H.; Zhao, T.; Fu, X. Learning multi-region features for vehicle re-identification with context-based ranking method. Neurocomputing 2019, 359, 427–437. [Google Scholar] [CrossRef]
- Shen, F.; Xie, Y.; Zhu, J.; Zhu, X.; Zeng, H. GiT: Graph Interactive Transformer for Vehicle Re-Identification. IEEE Trans. Image Process. 2023, 32, 1039–1051. [Google Scholar] [CrossRef]
- Tao, H.; Duan, Q. A Spatial-Channel Feature-Enriched Module Based On Multi-Context Statistics Attention. IEEE Internet Things J. early access. 2023. [Google Scholar] [CrossRef]
- Zhu, W.; Wang, Z.; Wang, X.; Hu, R.; Liu, H.; Liu, C.; Wang, C.; Li, D. A Dual Self-Attention mechanism for vehicle re-Identification. Pattern Recognit. 2023, 137, 109258. [Google Scholar] [CrossRef]
- Tao, H.; Duan, Q.; An, J. An Adaptive Interference Removal Framework for Video Person Re-Identification. IEEE Trans. Circuits Syst. Video Technol. 2023, 33, 5148–5159. [Google Scholar] [CrossRef]
- Gevorgyan, Z. SIoU loss: More powerful learning for bounding box regression. arXiv 2022, arXiv:2205.12740. [Google Scholar]
- He, K.; Zhang, X.; Ren, S.; Sun, J. Deep residual learning for image recognition. In Proceedings of the IEEE Conference on Computer Vision and Pattern Recognition, Las Vegas, NV, USA, 27–30 June 2016; pp. 770–778. [Google Scholar]
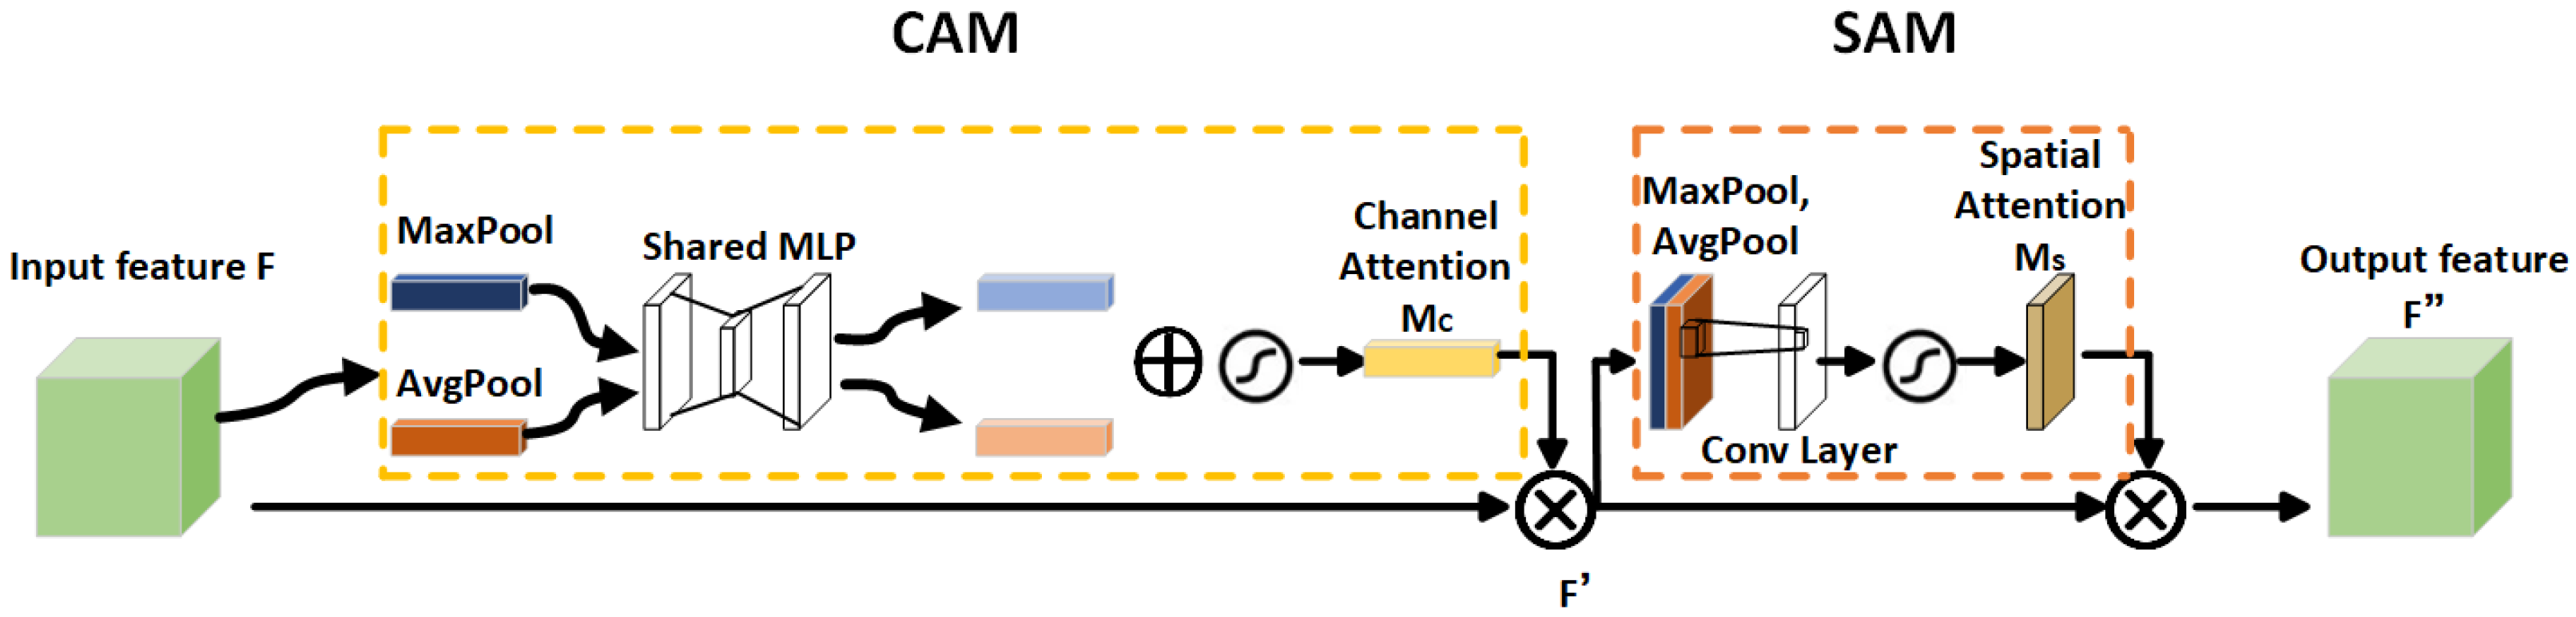
- Woo, S.; Park, J.; Lee, J.Y.; Kweon, I.S. Cbam: Convolutional block attention module. In Proceedings of the European Conference on Computer Vision (ECCV), Munich, Germany, 8–14 September 2018; pp. 3–19. [Google Scholar]
- Zheng, Z.; Wang, P.; Liu, W.; Li, J.; Ye, R.; Ren, D. Distance-IoU loss: Faster and better learning for bounding box regression. In Proceedings of the AAAI Conference on Artificial Intelligence, New York, NY, USA, 7–12 February 2020; Volume 34, pp. 12993–13000. [Google Scholar]
- Rezatofighi, H.; Tsoi, N.; Gwak, J.; Sadeghian, A.; Reid, I.; Savarese, S. Generalized intersection over union: A metric and a loss for bounding box regression. In Proceedings of the IEEE/CVF Conference on Computer Vision and Pattern Recognition, Long Beach, CA, USA, 15–20 June 2019; pp. 658–666. [Google Scholar]
- Li, X.; Wu, J.; Sun, Z.; Ma, Z.; Cao, J.; Xue, J.H. BSNet: Bi-similarity network for few-shot fine-grained image classification. IEEE Trans. Image Process. 2020, 30, 1318–1331. [Google Scholar] [CrossRef]
- Lou, Y.; Bai, Y.; Liu, J.; Wang, S.; Duan, L. Veri-wild: A large dataset and a new method for vehicle re-identification in the wild. In Proceedings of the IEEE/CVF Conference on Computer Vision and Pattern Recognition, Long Beach, CA, USA, 15–20 June 2019; pp. 3235–3243. [Google Scholar]
- Liao, S.; Hu, Y.; Zhu, X.; Li, S.Z. Person re-identification by local maximal occurrence representation and metric learning. In Proceedings of the IEEE Conference on Computer Vision and Pattern Recognition, Boston, MA, USA, 7–12 June 2015; pp. 2197–2206. [Google Scholar]
- Xiao, T.; Li, H.; Ouyang, W.; Wang, X. Learning deep feature representations with domain guided dropout for person re-identification. In Proceedings of the IEEE Conference on Computer Vision and Pattern Recognition, Las Vegas, NV, USA, 27–30 June 2016; pp. 1249–1258. [Google Scholar]
- Yang, L.; Luo, P.; Change Loy, C.; Tang, X. A large-scale car dataset for fine-grained categorization and verification. In Proceedings of the IEEE Conference on Computer Vision and Pattern Recognition, Boston, MA, USA, 7–12 June 2015; pp. 3973–3981. [Google Scholar]
- Zhou, Y.; Shao, L. Cross-view GAN based vehicle generation for re-identification. In Proceedings of the BMVC, London, UK, 4–7 September 2017; Volume 1, pp. 1–12. [Google Scholar]
- Bai, Y.; Lou, Y.; Gao, F.; Wang, S.; Wu, Y.; Duan, L.Y. Group-Sensitive Triplet Embedding for Vehicle Reidentification. IEEE Trans. Multimed. 2018, 20, 2385–2399. [Google Scholar] [CrossRef]
- Tumrani, S.; Ali, W.; Kumar, R.; Khan, A.A.; Dharejo, F.A. View-aware attribute-guided network for vehicle re-identification. Multimed. Syst. 2023, 29, 1853–1863. [Google Scholar] [CrossRef]
- Qiao, W.; Ren, W.; Zhao, L. Vehicle re-identification in aerial imagery based on normalized virtual Softmax loss. Appl. Sci. 2022, 12, 4731. [Google Scholar] [CrossRef]
- Liu, Y.; Hu, H.; Chen, D. Attentive Part-Based Alignment Network for Vehicle Re-Identification. Electronics 2022, 11, 1617. [Google Scholar] [CrossRef]
- Zhou, Y.; Shao, L. Aware attentive multi-view inference for vehicle re-identification. In Proceedings of the IEEE Conference on Computer Vision and Pattern Recognition, Salt Lake City, UT, USA, 18–23 June 2018; pp. 6489–6498. [Google Scholar]
- Guo, H.; Zhu, K.; Tang, M.; Wang, J. Two-level attention network with multi-grain ranking loss for vehicle re-identification. IEEE Trans. Image Process. 2019, 28, 4328–4338. [Google Scholar] [CrossRef] [PubMed]
- Liu, X.; Zhang, S.; Huang, Q.; Gao, W. Ram: A region-aware deep model for vehicle re-identification. In Proceedings of the 2018 IEEE International Conference on Multimedia and Expo (ICME), San Diego, CA, USA, 23–27 July 2018; pp. 1–6. [Google Scholar]
- Song, Z.; Li, D.; Chen, Z.; Yang, W. Unsupervised Vehicle Re-Identification Method Based on Source-Free Knowledge Transfer. Appl. Sci. 2023, 13, 11013. [Google Scholar] [CrossRef]
- Wang, H.; Peng, J.; Jiang, G.; Xu, F.; Fu, X. Discriminative feature and dictionary learning with part-aware model for vehicle re-identification. Neurocomputing 2021, 438, 55–62. [Google Scholar] [CrossRef]
- Schroff, F.; Kalenichenko, D.; Philbin, J. Facenet: A unified embedding for face recognition and clustering. In Proceedings of the IEEE Conference on Computer Vision and Pattern Recognition, Boston, MA, USA, 7–12 June 2015; pp. 815–823. [Google Scholar]
- Yuan, Y.; Yang, K.; Zhang, C. Hard-aware deeply cascaded embedding. In Proceedings of the IEEE International Conference on Computer Vision, Venice, Italy, 22–29 October 2017; pp. 814–823. [Google Scholar]
- Khorramshahi, P.; Kumar, A.; Peri, N.; Rambhatla, S.S.; Chen, J.C.; Chellappa, R. A dual-path model with adaptive attention for vehicle re-identification. In Proceedings of the IEEE/CVF International Conference on Computer Vision, Seoul, Republic of Korea, 27 October–2 November 2019; pp. 6132–6141. [Google Scholar]


| Reference | Method Type | Advantage | Limitation |
|---|---|---|---|
| [19,20] | Deep learning | High recognition accuracy | High cost; poor interpretability |
| [21,22] | Spatiotemporal information | Works well for hard samples | Additional complex spatiotemporal labels are required |
| [16,17] | Metrics learning | High recognition accuracy | High cost |
| [23,24] | Multidimensional information based | Sensitivity to the special appearance of vehicles | Susceptible to changes in viewpoints and illuminations |
| Methods | mAP | rank1 | rank5 |
|---|---|---|---|
| LOMO [46] | 9.62 | 25.42 | 46.51 |
| DGD [47] | 18.35 | 49.84 | 67.45 |
| GoogLeNet [48] | 17.81 | 52.12 | 66.78 |
| FACT [16] | 18.73 | 51.85 | 67.16 |
| XVGAN [49] | 24.65 | 60.20 | 77.03 |
| OIFE [28] | 48.21 | 65.92 | 87.66 |
| FDA-Net [45] | 55.60 | 84.27 | 91.41 |
| GSTE [50] | 59.43 | 92.21 | 96.25 |
| SAVER [33] | 79.65 | 93.42 | 95.66 |
| VAAG [51] | 65.23 | 91.35 | 94.76 |
| NVSL [52] | 67.58 | 91.52 | 94.83 |
| APANet [53] | 78.61 | 93.35 | 96.49 |
| Ours | 86.49 | 94.43 | 98.60 |
| Methods | Small | Medium | Large | |||
|---|---|---|---|---|---|---|
| rank1 | rank5 | rank1 | rank5 | rank1 | rank5 | |
| LOMO [46] | 19.84 | 32.21 | 18.94 | 29.12 | 15.36 | 25.23 |
| GoogLeNet [48] | 47.52 | 67.23 | 43.56 | 63.82 | 38.23 | 59.63 |
| VAMI [54] | 63.56 | 83.21 | 52.86 | 75.13 | 47.36 | 70.32 |
| TAMR [55] | 66.89 | 79.75 | 62.93 | 76.86 | 59.35 | 73.68 |
| FACT [16] | 49.53 | 68.01 | 44.56 | 64.59 | 40.24 | 60.35 |
| EALN [30] | 75.56 | 88.23 | 71.83 | 83.92 | 68.92 | 81.46 |
| PRN [32] | 78.65 | 92.35 | 75.02 | 88.35 | 74.23 | 86.42 |
| RAM [56] | 75.35 | 91.56 | 72.36 | 87.60 | 67.26 | 84.56 |
| KPEV [22] | 72.23 | 87.41 | 68.93 | 84.52 | 63.92 | 78.29 |
| Transfer [57] | 52.76 | 67.29 | 47.65 | 63.83 | 43.87 | 62.43 |
| TCPM [58] | 81.95 | 94.81 | 77.66 | 92.91 | 73.19 | 90.35 |
| Ours | 83.56 | 96.23 | 79.56 | 93.66 | 77.89 | 91.65 |
| Methods | Small | Medium | Large | ||||||
|---|---|---|---|---|---|---|---|---|---|
| mAP | rank1 | rank5 | mAP | rank1 | rank5 | mAP | rank1 | rank5 | |
| GoogLeNet [48] | 24.27 | 57.16 | 75.13 | 24.15 | 53.16 | 71.13 | 21.53 | 44.61 | 63.55 |
| Triplet [59] | 15.69 | 44.67 | 63.33 | 13.34 | 40.34 | 58.98 | 9.93 | 33.46 | 51.36 |
| CCL [18] | 22.50 | 56.96 | 75.36 | 19.28 | 46.16 | 69.88 | 14.81 | 37.94 | 59.89 |
| HDC [60] | 29.14 | 57.23 | 78.93 | 24.76 | 49.64 | 72.28 | 18.30 | 43.98 | 64.95 |
| GSTE [50] | 31.42 | 60.48 | 80.13 | 26.18 | 52.13 | 74.98 | 19.50 | 45.36 | 66.53 |
| FDA-Net [45] | 35.11 | 64.23 | 82.95 | 29.80 | 57.83 | 78.64 | 22.78 | 49.43 | 70.48 |
| AAVER [61] | 62.35 | 75.86 | 92.76 | 53.56 | 68.23 | 88.79 | 41.62 | 58.63 | 81.65 |
| SAVER [33] | 80.92 | 92.56 | 96.56 | 75.35 | 90.56 | 95.48 | 67.78 | 85.65 | 95.86 |
| Ours | 83.56 | 95.78 | 98.69 | 78.36 | 94.23 | 98.89 | 71.56 | 91.36 | 98.35 |
| Methods | VeRi-776 | VehicleID | VERI-Wild | ||||||
|---|---|---|---|---|---|---|---|---|---|
| rank1 | rank5 | mAP | Large | Large | |||||
| rank1 | rank5 | mAP | rank1 | rank5 | mAP | ||||
| YOLO+G | 87.43 | 92.60 | 75.49 | 70.36 | 84.65 | 75.62 | 82.45 | 92.51 | 65.28 |
| YOLO+L | 83.43 | 90.60 | 78.49 | 73.88 | 86.65 | 72.95 | 81.27 | 91.78 | 69.84 |
| YOLO+G+L | 94.43 | 98.60 | 86.49 | 77.89 | 91.65 | 82.70 | 91.36 | 98.35 | 71.56 |
Disclaimer/Publisher’s Note: The statements, opinions and data contained in all publications are solely those of the individual author(s) and contributor(s) and not of MDPI and/or the editor(s). MDPI and/or the editor(s) disclaim responsibility for any injury to people or property resulting from any ideas, methods, instructions or products referred to in the content. |
© 2024 by the authors. Licensee MDPI, Basel, Switzerland. This article is an open access article distributed under the terms and conditions of the Creative Commons Attribution (CC BY) license (https://creativecommons.org/licenses/by/4.0/).
Share and Cite
Yang, Y.; Liu, P.; Huang, J.; Song, H. GLFNet: Combining Global and Local Information in Vehicle Re-Recognition. Sensors 2024, 24, 616. https://doi.org/10.3390/s24020616
Yang Y, Liu P, Huang J, Song H. GLFNet: Combining Global and Local Information in Vehicle Re-Recognition. Sensors. 2024; 24(2):616. https://doi.org/10.3390/s24020616
Chicago/Turabian StyleYang, Yinghan, Peng Liu, Junran Huang, and Hongfei Song. 2024. "GLFNet: Combining Global and Local Information in Vehicle Re-Recognition" Sensors 24, no. 2: 616. https://doi.org/10.3390/s24020616
APA StyleYang, Y., Liu, P., Huang, J., & Song, H. (2024). GLFNet: Combining Global and Local Information in Vehicle Re-Recognition. Sensors, 24(2), 616. https://doi.org/10.3390/s24020616