Article

Influence of Coal-Fired Fly Ash on Measurement Error of NO2 Electrochemical Sensors

1
The Institute of Technological Sciences, Wuhan University, Wuhan 430072, China
2
School of Power and Mechanical Engineering, Wuhan University, Wuhan 430072, China
*
Author to whom correspondence should be addressed.
Sensors 2024, 24(3), 900; https://doi.org/10.3390/s24030900
Submission received: 2 January 2024 / Revised: 21 January 2024 / Accepted: 28 January 2024 / Published: 30 January 2024
(This article belongs to the Special Issue Electrochemical Sensors in Environment, Food and Healthcare)

Abstract

:
To overcome the limitations of NO2 electrochemical sensors, including their inaccurate measurements and short working life, when used around coal-fired power plants, we investigated the influence of coal-fired fly ash deposition on the measurement error of NO2 electrochemical sensors through experimental tests. The morphological characteristics and pellet diameter distribution of coal-fired fly ash pellets were determined via scanning electron microscopy. The sedimentation velocity of coal-fired fly ash pellets in the air was determined through theoretical calculations of aerodynamics and hydrodynamics. Additionally, the effect of the deposition of coal-fired fly ash on the measurement error of NO2 electrochemical sensors was determined through experimental tests. The test results show that the minimum and maximum measurement errors of the NO2 electrochemical gas sensor were 8.015% and 30.35%, respectively, after a deposition duration of 30 days with 30 mg/m3 coal-fired fly ash. This demonstrates that coal-fired fly ash deposition is the cause of the inaccurate measurements and short working life of these sensors. Coal-fired fly ash causes a decrease in the gas diffusion area of the sensor and the diffusion coefficient, thus increasing the sensor measurement error.

1. Introduction

In the first three quarters of 2023, China’s cumulative installed power generation capacity was approximately 2.79 billion kW, which is a year-on-year increase of 12.3%. Of this, the installed capacity of thermal power was 1.37 billion kW, accounting for 49.18% of the total installed capacity [1], indicating that China’s electricity was mainly produced from thermal power. Thermal power plants generate electricity by burning coal, which produces large quantities of soot, coal-fired fly ash [2], NO, NO2, and other pollutants and gases during combustion [3,4,5]. NO and NO2 not only form photochemical smog and acid rain and destroy ozone [6,7], they also harm the human body by affecting the central nervous system and damaging the heart and respiratory system [8,9]. The lethal concentrations of NO in humans are 2500 ppm (exposure time 30 min) and 10,000 ppm (exposure time 5 min); the lethal concentrations of NO2 in humans are 500 ppm (exposure time 30 min) and 5000 ppm (exposure time 5 min) [10,11]. Therefore, pollutant gases such as NO and NO2 in the air near coal-fired power plants must be monitored.
The NOx gas concentration in the air pollutant produced by thermal power plants is mainly calculated using the concentration of NO2 gas [12]. As NO2 gas is more toxic than NO gas, NO2 gas was selected as the object in this study. The methods commonly used for detecting NO2 gas include the metal–oxide semiconductor sensor detection [13,14], electrochemical gas sensor detection [15,16,17], and N-(1-naphthyle) ethylenediamine dihydrochloride spectrophotometric [18] methods. The limitations of metal–oxide semiconductor sensors include their poor durability, low accuracy, and low gas selectivity. The N-(1-Naphthyl)ethylenediamine dihydrochloride spectrophotometric method can be used to accurately measure NO2 gas concentrations, but the on-site manual sampling and measurement of NO2 gas are required: remote measurement is impossible. Conversely, electrochemical gas sensors are cheap, simple in structure, small, energy-efficient, and stable, and provide a fast response, strong linearity, high sensitivity, and high selectivity; as such, they are widely used for safety monitoring, environmental protection, food safety, and in industry [19,20]. Currently, studies on electrochemical sensors have mainly focused on the structure of the sensor, the material of the working electrode, and the material of the electrolyte [21,22,23,24,25]; however, few studies have been conducted on the engineering applications of electrochemical sensors. In practical engineering applications, the electrochemical sensors that are used to monitor the concentration of pollutants emitted by coal-fired power plants suffer from a low measurement accuracy and short service life.
Studies in this field on fly ash environments are scarce. Ghenadii Korotcenkov [26] showed that when electrochemical gas sensors are used in dusty areas, the diffusion membrane becomes clogged or coated, and the normal supply of the signal gas may be cut off, leading to sensor failure. However, the effects of dust clogging on the measurement error of a sensor have not been described.
Therefore, the focus of this study was a NO2 electrochemical gas sensor, and the effect of coal-fired fly ash on the measurement error of this sensor was investigated through experiments. Suggestions are provided in this paper for the use and maintenance of equipment using electrochemical sensors in coal-fired power plant areas. Firstly, the coal-fired fly ash specimens were analyzed using scanning electron microscopy to determine the morphological characteristics and pellet diameter distribution of the coal-fired fly ash pellets. Secondly, according to the theoretical aerodynamics and hydrodynamics calculations, the sedimentation velocity of coal-fired fly ash pellets in air and the deposited quantities of coal-fired fly ash at various time points were determined. Finally, the impact of coal-fired fly ash on the measurement error of NO2 electrochemical sensors was determined through experimental testing.

2. Materials and Methods

2.1. Experimental Materials

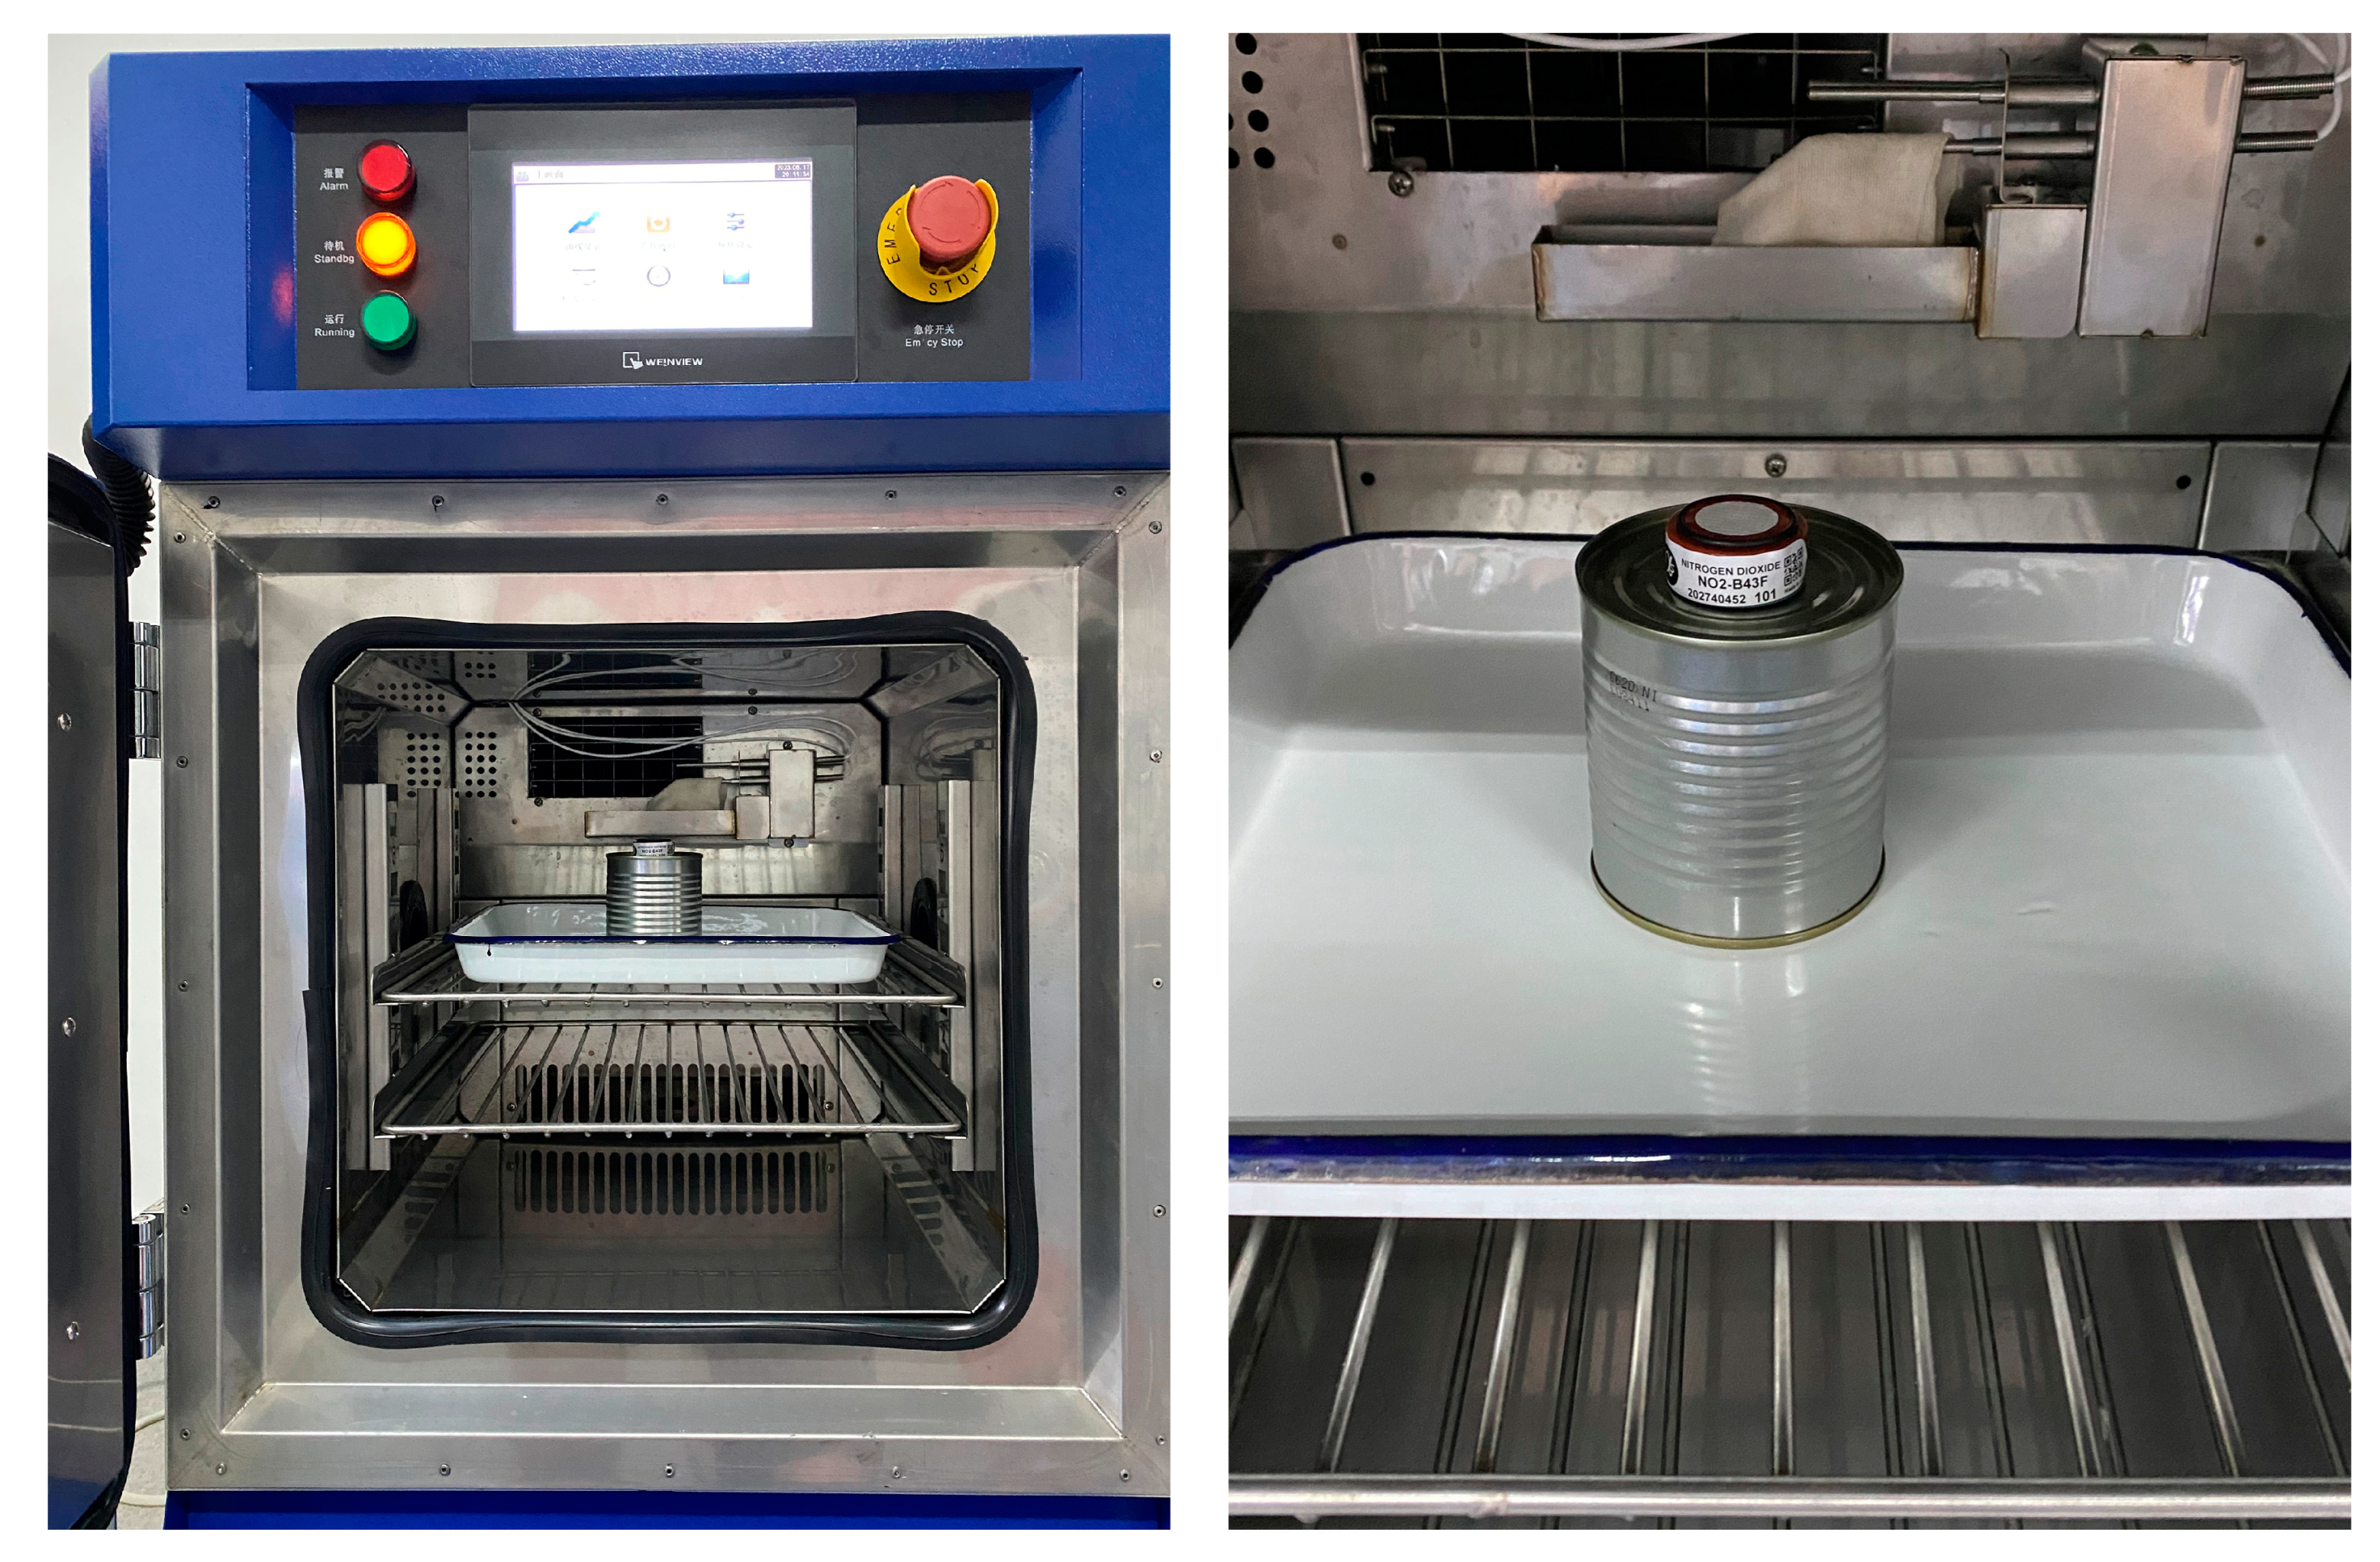
2.1.1. Experimental Equipment

A TESCAN MIRA3 field-emission scanning electron microscope (TESCAN GROUP, Brno, Czech Republic) was used to analyze the morphological characteristics, elemental composition, and pellet diameter distribution of the coal-fired fly ash, which had a resolution of 2.0 nm at 30 keV in low-vacuum mode and 1.2 nm at 30 keV or 2.5 nm at 3 keV in high-vacuum mode.

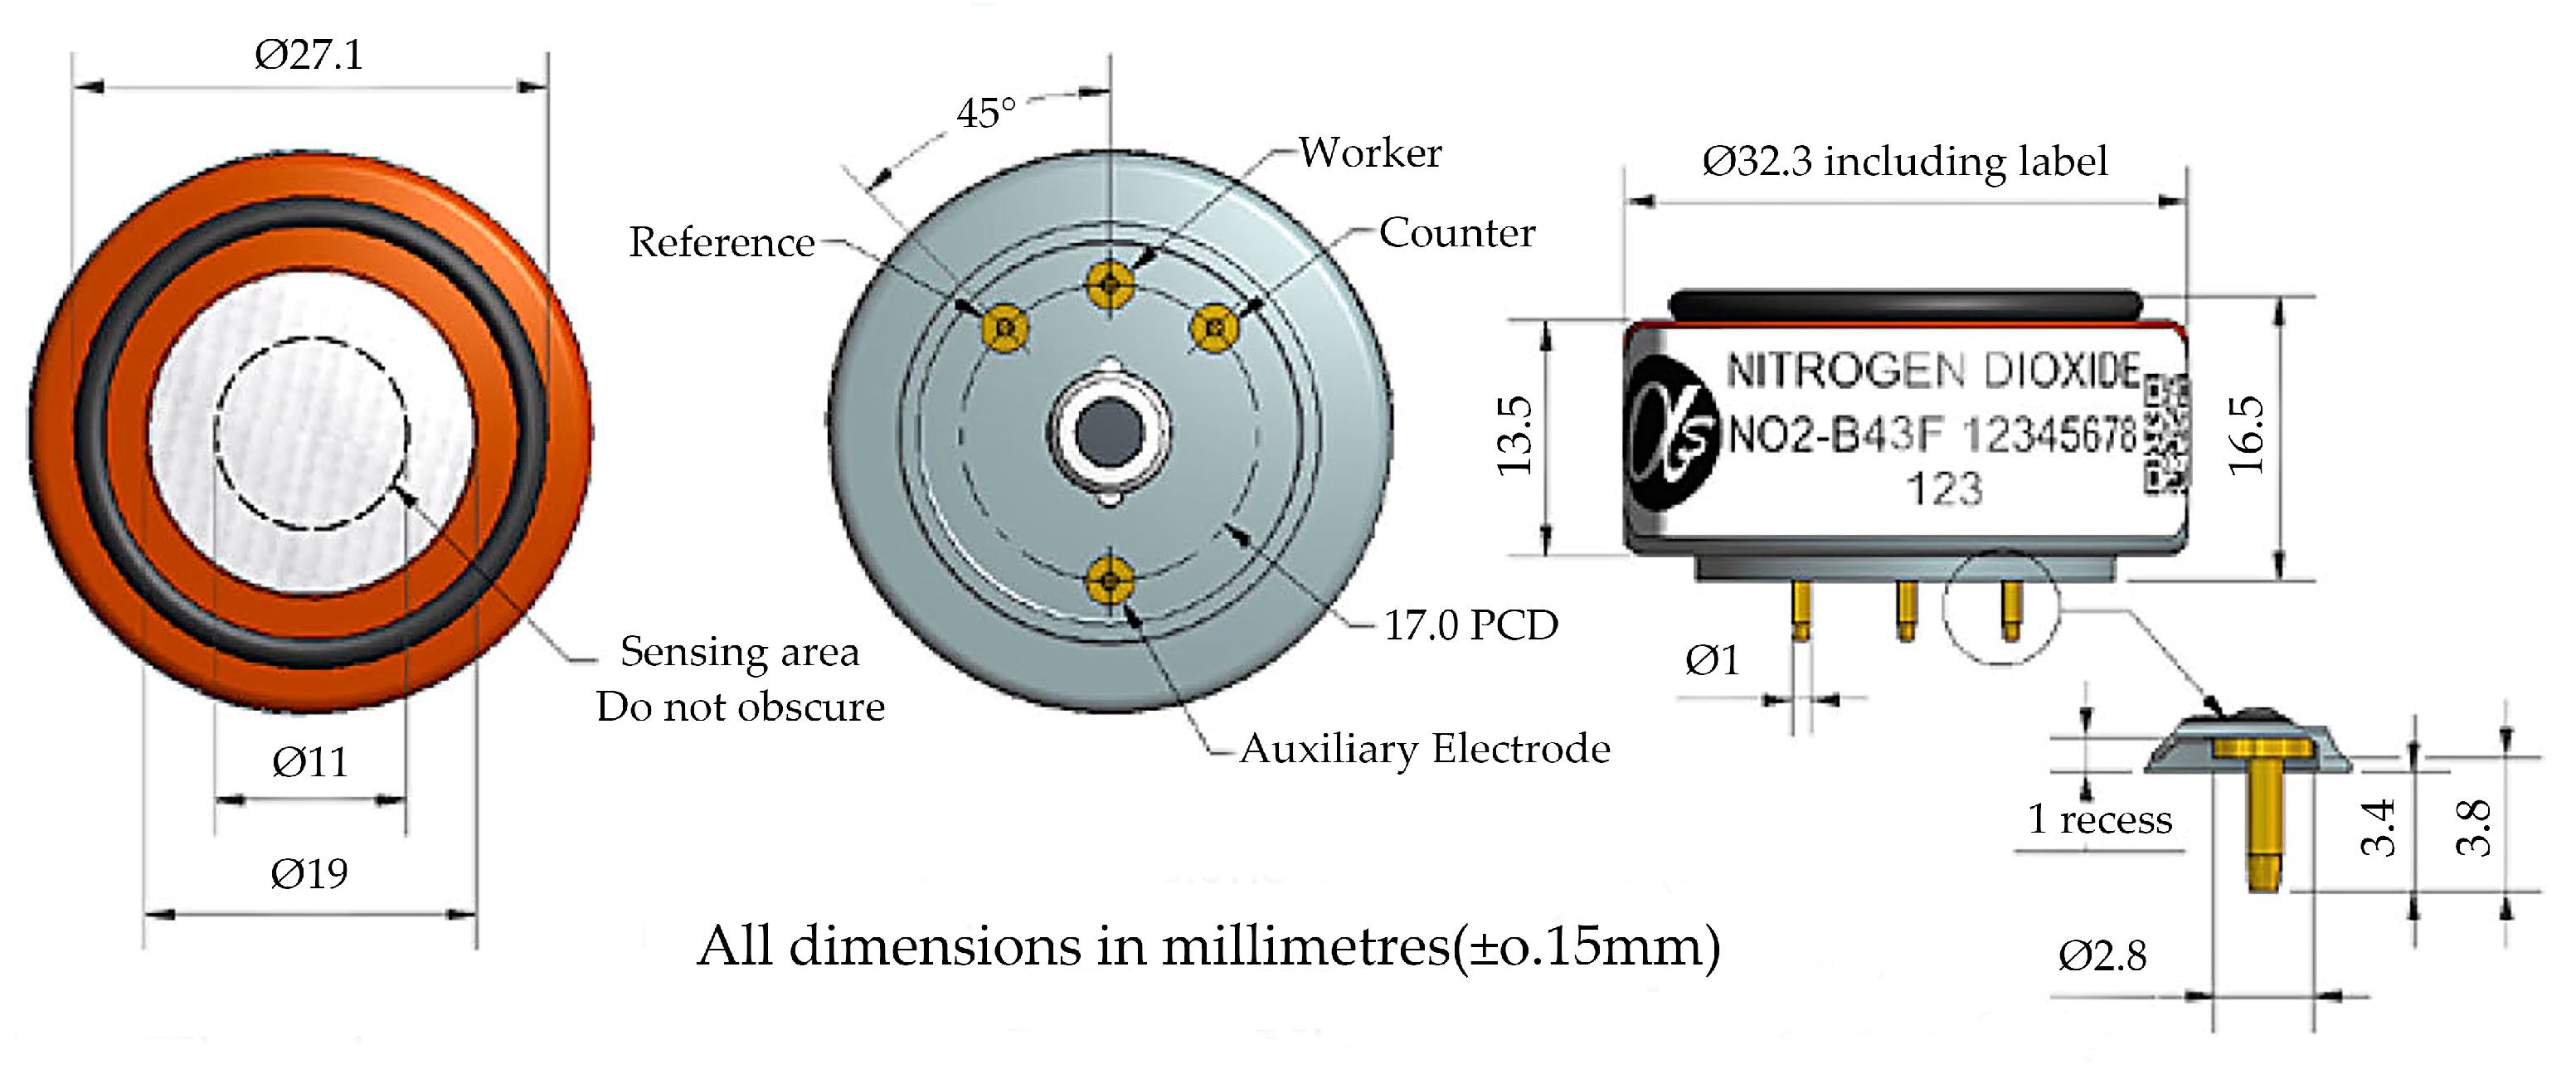
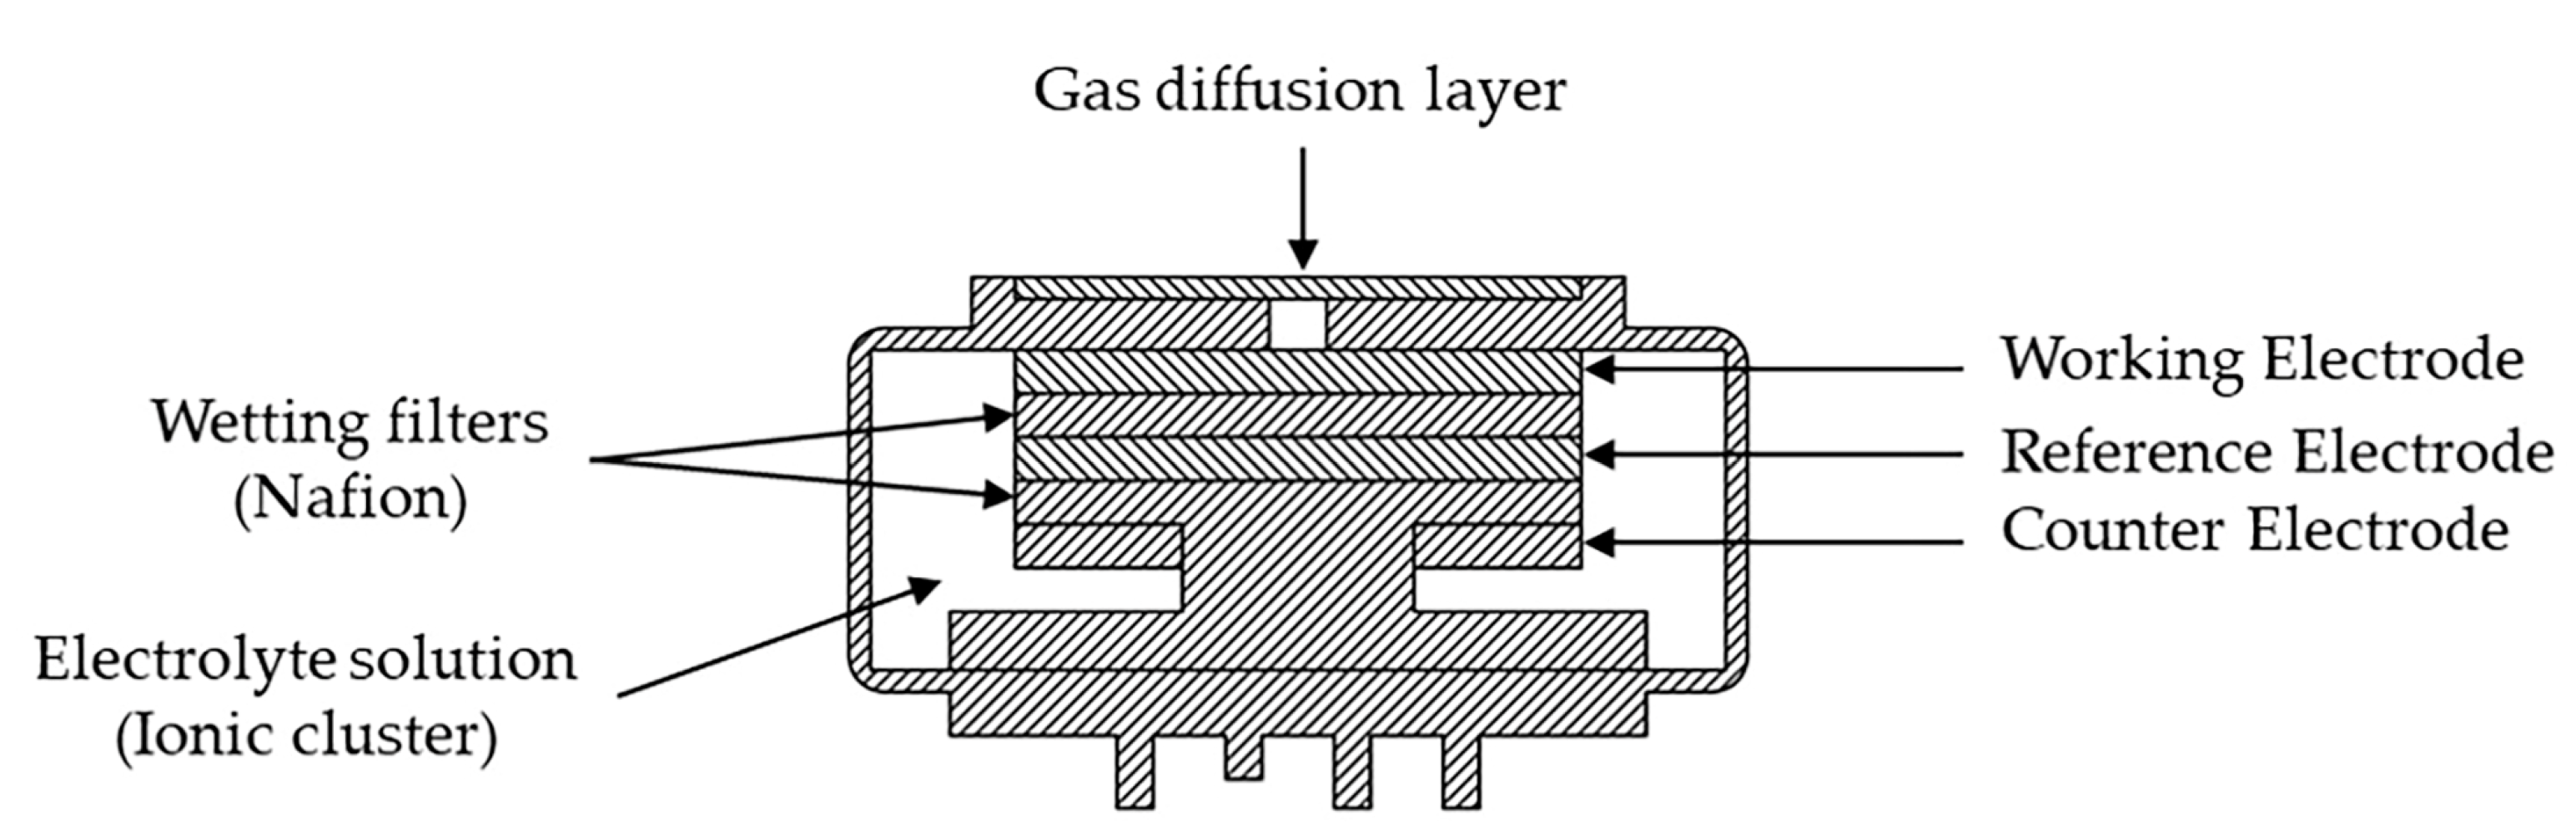
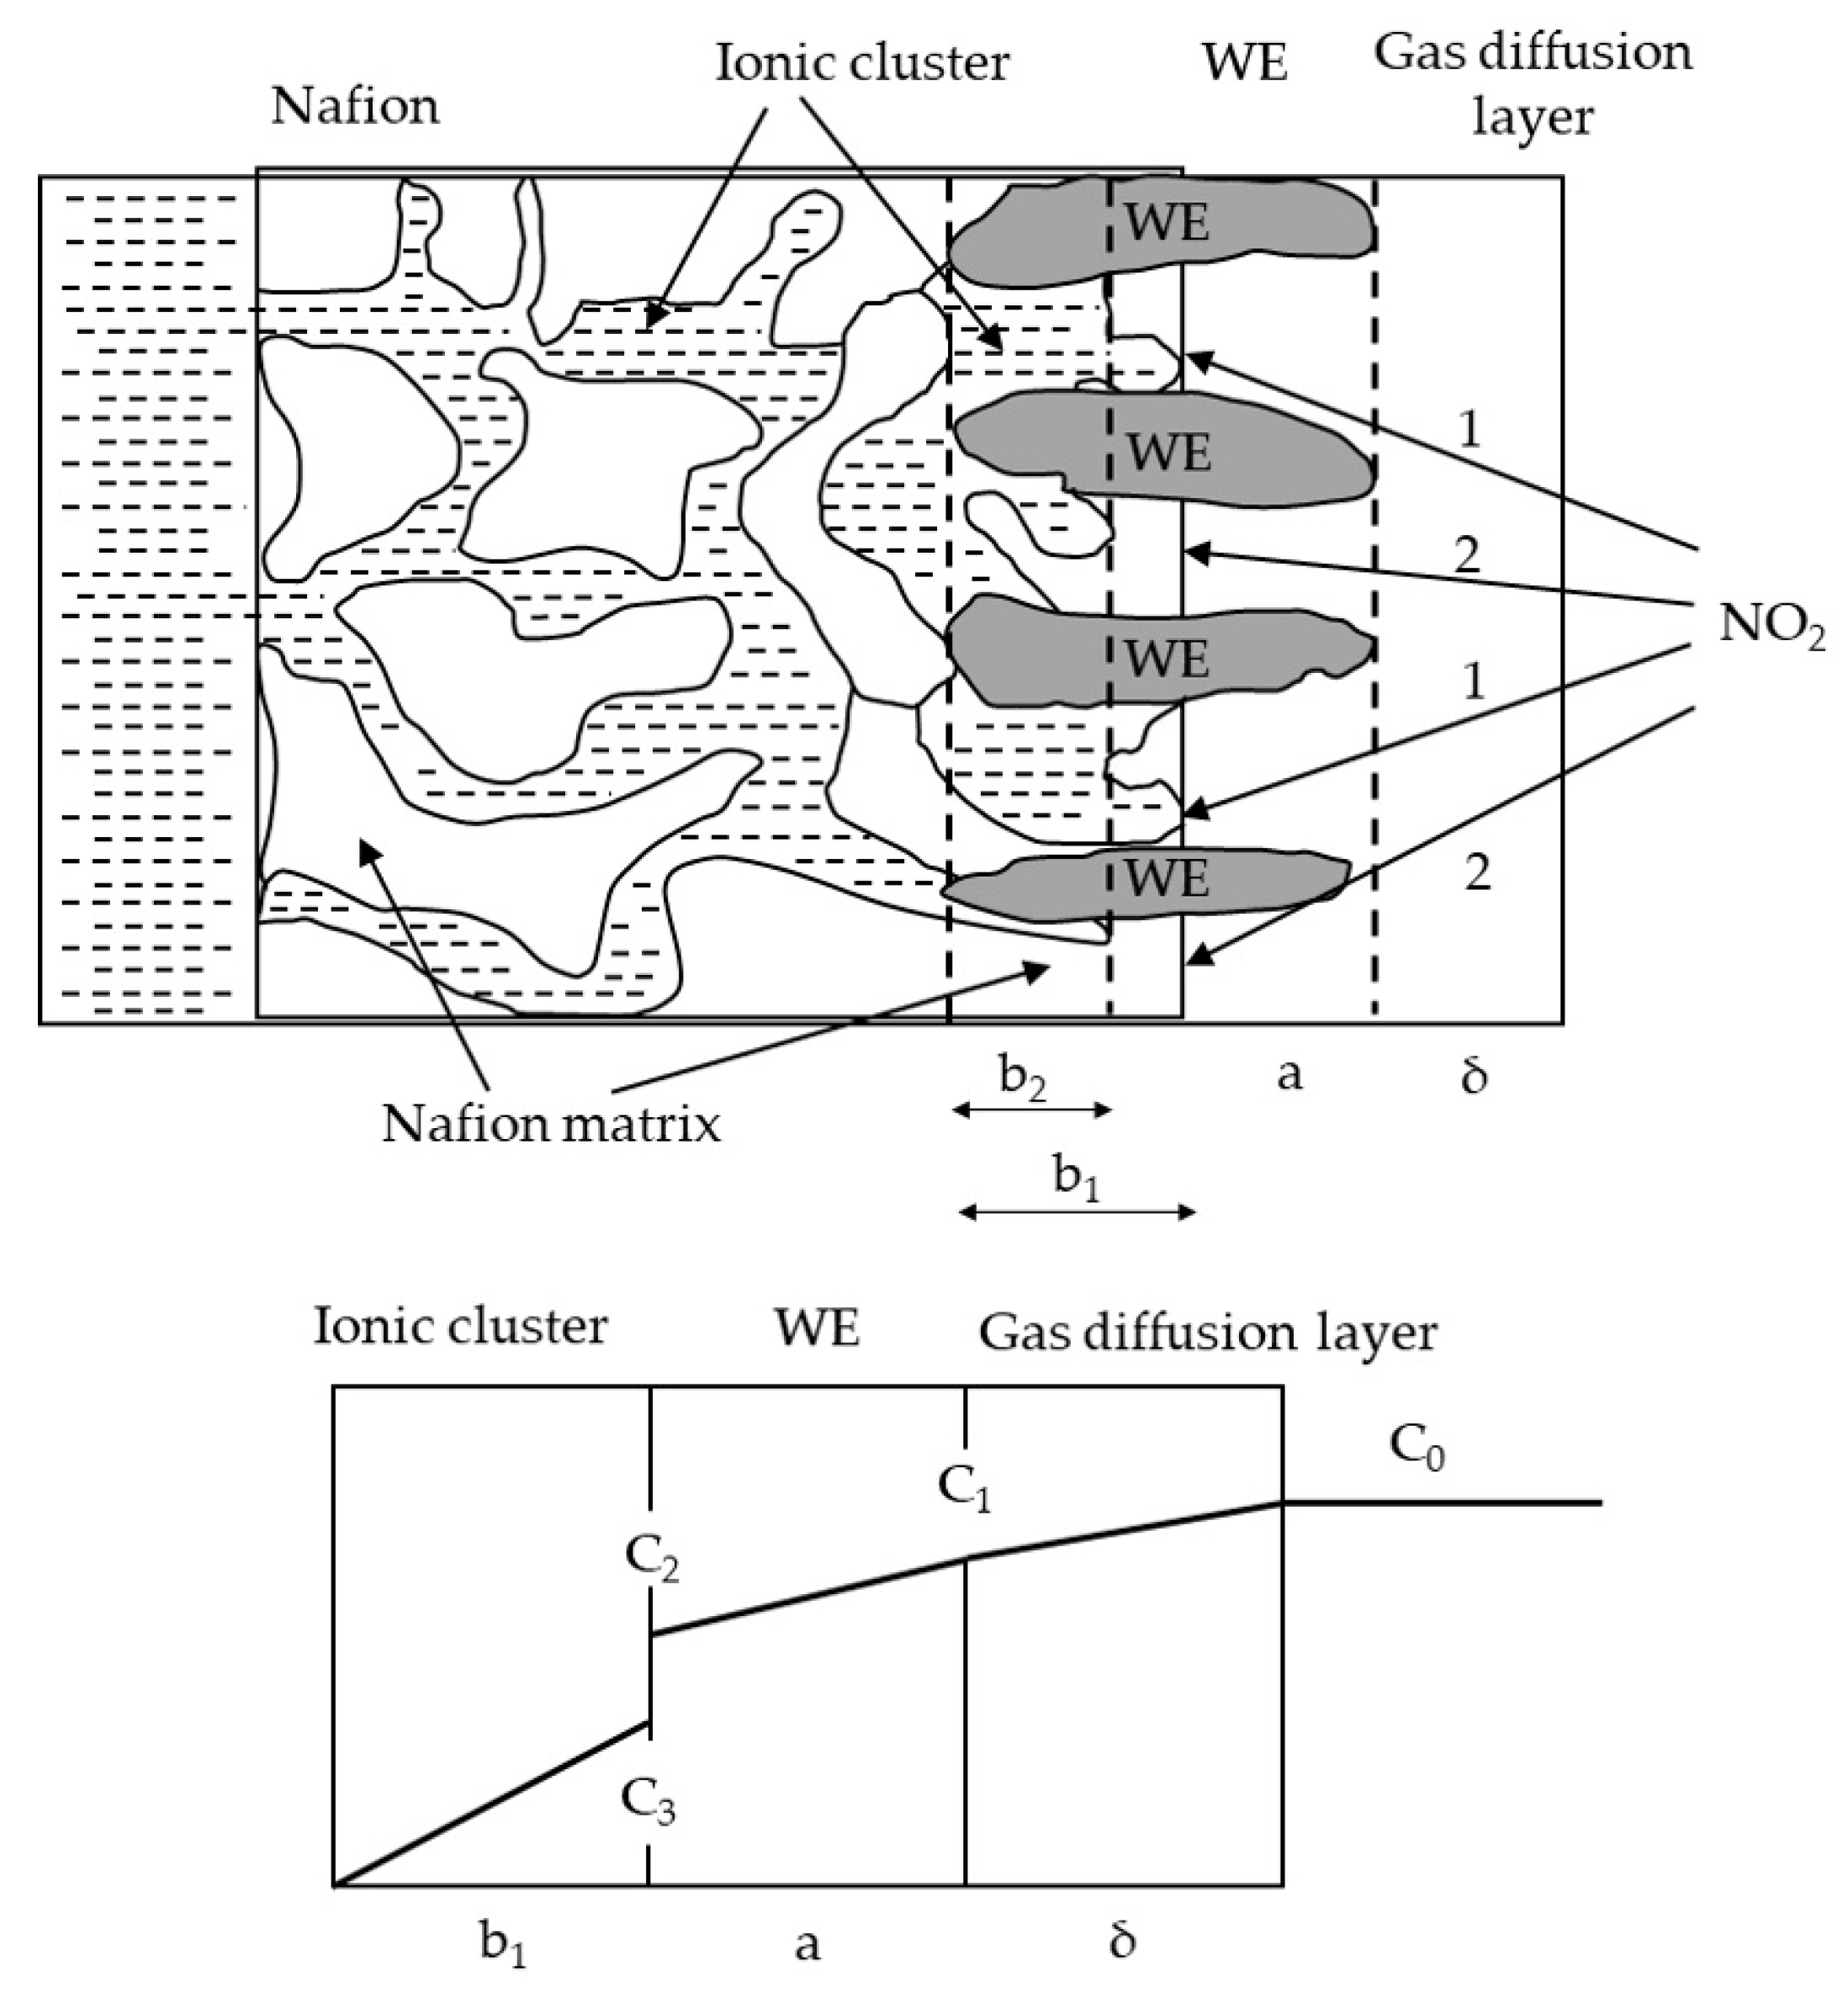
2.1.2. NO2 Electrochemical Gas Sensor

The Chinese domestic manufacturers of these sensors include Hanwei Technology Group Co., Ltd. (Zhengzhou, China), Cube Sensor and Instrument Co., Ltd. (Wuhan, China), Weihai Jingxun Tongtong Electronic Technology Co., Ltd. (Weihai, China), and Guangzhou Aosong Electronics Co., Ltd. (Guangzhou, China). The foreign manufacturers are Honeywell (Morristown, NJ, USA), Alphasense (Essex, UK), CityTech (London, UK), and Figaro (Minoo city, Osaka, Japan).
Comparing the specifications of the NO2 electrochemical sensors manufactured between Chinese and foreign manufacturers, we found that the NO2 electrochemical gas sensors from these manufacturers have the same operating principle and similar construction. Alphasense’s electrochemical sensors were the most precise and sensitive, and the company had the largest market share, so we purchased the NO2-B43F model of the NO2 electrochemical sensor from Alphasense for our experimental tests.
The appearance and dimensions of the NO2 electrochemical gas sensor are presented in Figure 1. The diameter of the gas diffusion membrane on the sensor surface was 19 mm, with an area of 283.5 × 10⁻⁶ m2, and the thickness of the membrane was 0.28 µm. The material was made of porous polytetrafluoroethylene with a porosity of 49% and a pore size of 12–16 µm. The performance parameters of the NO2 electrochemical gas sensor are listed in Table 1 [27].
Structurally, the NO2 electrochemical gas sensor included a gas diffusion layer, wetting filters, an electrolyte solution, a working electrode, a reference electrode, and a counter electrode, as illustrated in Figure 2. The gas sensing mechanism of the NO2 electrochemical gas sensor is shown in Figure 3.
The two transport paths through which NO2 gas can diffuse into the interior of the sensor are as follows: In the first path, NO2 gas passes directly through the electrolyte solution (ionic cluster) and undergoes an electrochemical reaction in the b1 plane, which satisfies the three-phase point (working electrode–electrolyte solution–gas). In the second path, NO2 gas first permeates the wetting filters membrane to the boundary of the electrolyte solution (ionic cluster) and then diffuses toward the surface of the working electrode, where an electrochemical reaction occurs in the b2 plane. The gas transport is much faster for path 1 than for path 2, so path 1 almost completely determines the value of the signal produced by the sensor. When NO2 gas with a concentration of C0 is transported along path 1, the gas concentration changes to C1 after the gas passes through the electrolyte solution (ionic clusters), owing to a small amount of gas dissolving in the electrolyte solution. Then, the gas is transferred to the working electrode, and an electrochemical reaction occurs, resulting in the gas concentration changing to C2. As the electrochemical reaction continues, the concentration of the gas changes to C3, and the gas diffuses further into the electrolyte solution, causing the concentration to continue to decrease.
NO2 gas diffuses through the gas diffusion layer to the working electrode, where an oxidation reaction occurs [28]:
N   O 2 + H 2 O N   O 2 + 2   H + + e
A diffusion current i is generated at the working electrode. In certain working situations, Faraday’s constant F , electron transfer number Z , diffusion coefficient D , gas diffusion area S , and thickness of diffusion layer δ are all constants, so that the diffusion current i is proportional to the NO2 gas concentration ( ρ ) within a certain range [29].
i = Z F S D δ × ρ

2.1.3. Coal-Fired Fly Ash Samples

The coal-fired fly ash samples were obtained from an ash hopper of the boiler dust collector of a thermal power plant, as shown in Figure 4. Clean, transparent polyethylene plastic bags were used to sample the coal-fired fly ash, which ensured that the coal-fired fly ash samples were not contaminated, at three different time periods (10:00 to 11:00, 16:00 to 17:00, and 21:00 to 22:00). A total of 3 kg of fly ash was collected at each time period to ensure the homogeneity of the coal-fired fly ash samples.

2.1.4. Experimental Gases

The experimental gas was N2 standard gas. High-purity nitrogen with 99.999% purity.
Standard NO2 gas at concentrations of 1000 ppm. The standard NO2 gas was diluted to 10 ppm, 20 ppm, 30 ppm, 40 ppm, 50 ppm, 60 ppm, 70 ppm, 80 ppm, 90 ppm, and 100 ppm using gas flow meter and N2 standard gas.

2.2. Experimental Methods

2.2.1. Drying of Coal-Fired Fly Ash Samples

The coal-fired fly ash samples were dried prior to morphology scanning. A total of 2 kg of coal-fired fly ash samples was evenly placed on a tray, which was placed into a drying oven at 120 °C [30]. After 120 min of drying, the weighing results showed that no change occurred in the mass of the coal-fired fly ash samples, indicating that the drying was complete.

2.2.2. Experimental Tests of Measurement Error of NO2 Electrochemical Gas Sensors

The experimental test device consisted of a test box body, a test box cover, an organic rubber sealing ring, connecting bolts, an inlet valve, an outlet valve, and a sensor support base, as illustrated in Figure 5. The test box body and cover were made of plexiglass. The inner diameter of the test box was 270 mm, the height was 300 mm, and the wall thickness was 15 mm. The test box body and cover were sealed with an organic rubber sealing ring, which was fastened using 6 connecting bolts, evenly distributed at an interval of 60 degrees to ensure the airtightness of the test box.
The dimensions of the test device were chosen for the following reasons: The sensors needed to be placed inside the test device, so the internal dimensions of the test device needed to be spacious enough for mounting the sensors. Additionally, if the test device size was too large, such as an inner diameter of 1000 mm and a height of 800 mm, the test box would have been heavy and difficult to handle. Finally, more NO2 gas would require the filling of a large test device, which would increase the difficulty of treating the experimental exhaust and would risk NO2 gas leakage.
The experimental test of the NO2 electrochemical gas sensor’s measurement errors involved the following steps:
Firstly, two NO2 electrochemical gas sensors were placed in the experimental test device (sensor No. 1 was a blank sensor, and sensor No. 2 was an experimental sensor). Then, coal-fired fly ash deposited for 30 days was placed on the surface of the diffusion membrane of sensor No. 2.
Secondly, the experimental test device was sealed using bolts, the inlet valve was opened, and standard NO2 gas at a concentration of 10 ppm was allowed to flow into the experimental test device.
Thirdly, the NO2 electrochemical gas sensor measurements were recorded, and the test was repeated three times. The average of the three recordings was used to calculate the sensor measurement error.
Fourthly, standard NO2 gas at a concentration of 20 ppm (or 30, 40, 50, 60, 70, 80, 90, or 100 ppm) was then introduced into the experimental test device, and the measurements of the NO2 electrochemical gas sensor were recorded.
Fifthly, the coal-fired fly ash deposited for 60 days (or 90, 120, 150, or 180 days) was placed on the surface of the diffusion membrane of sensor No. 2, and standard NO2 gas at a concentration of 10, 20, 30, 40, 50, 60, 70, 80, 90, or 100 ppm was passed through the membrane. The test was repeated three times, and the measurements of the NO2 electrochemical gas sensor were recorded.

3. Results

3.1. Morphological Characteristics, Elemental Composition, and Pellet Diameter Distribution of Coal-Fired Fly Ash

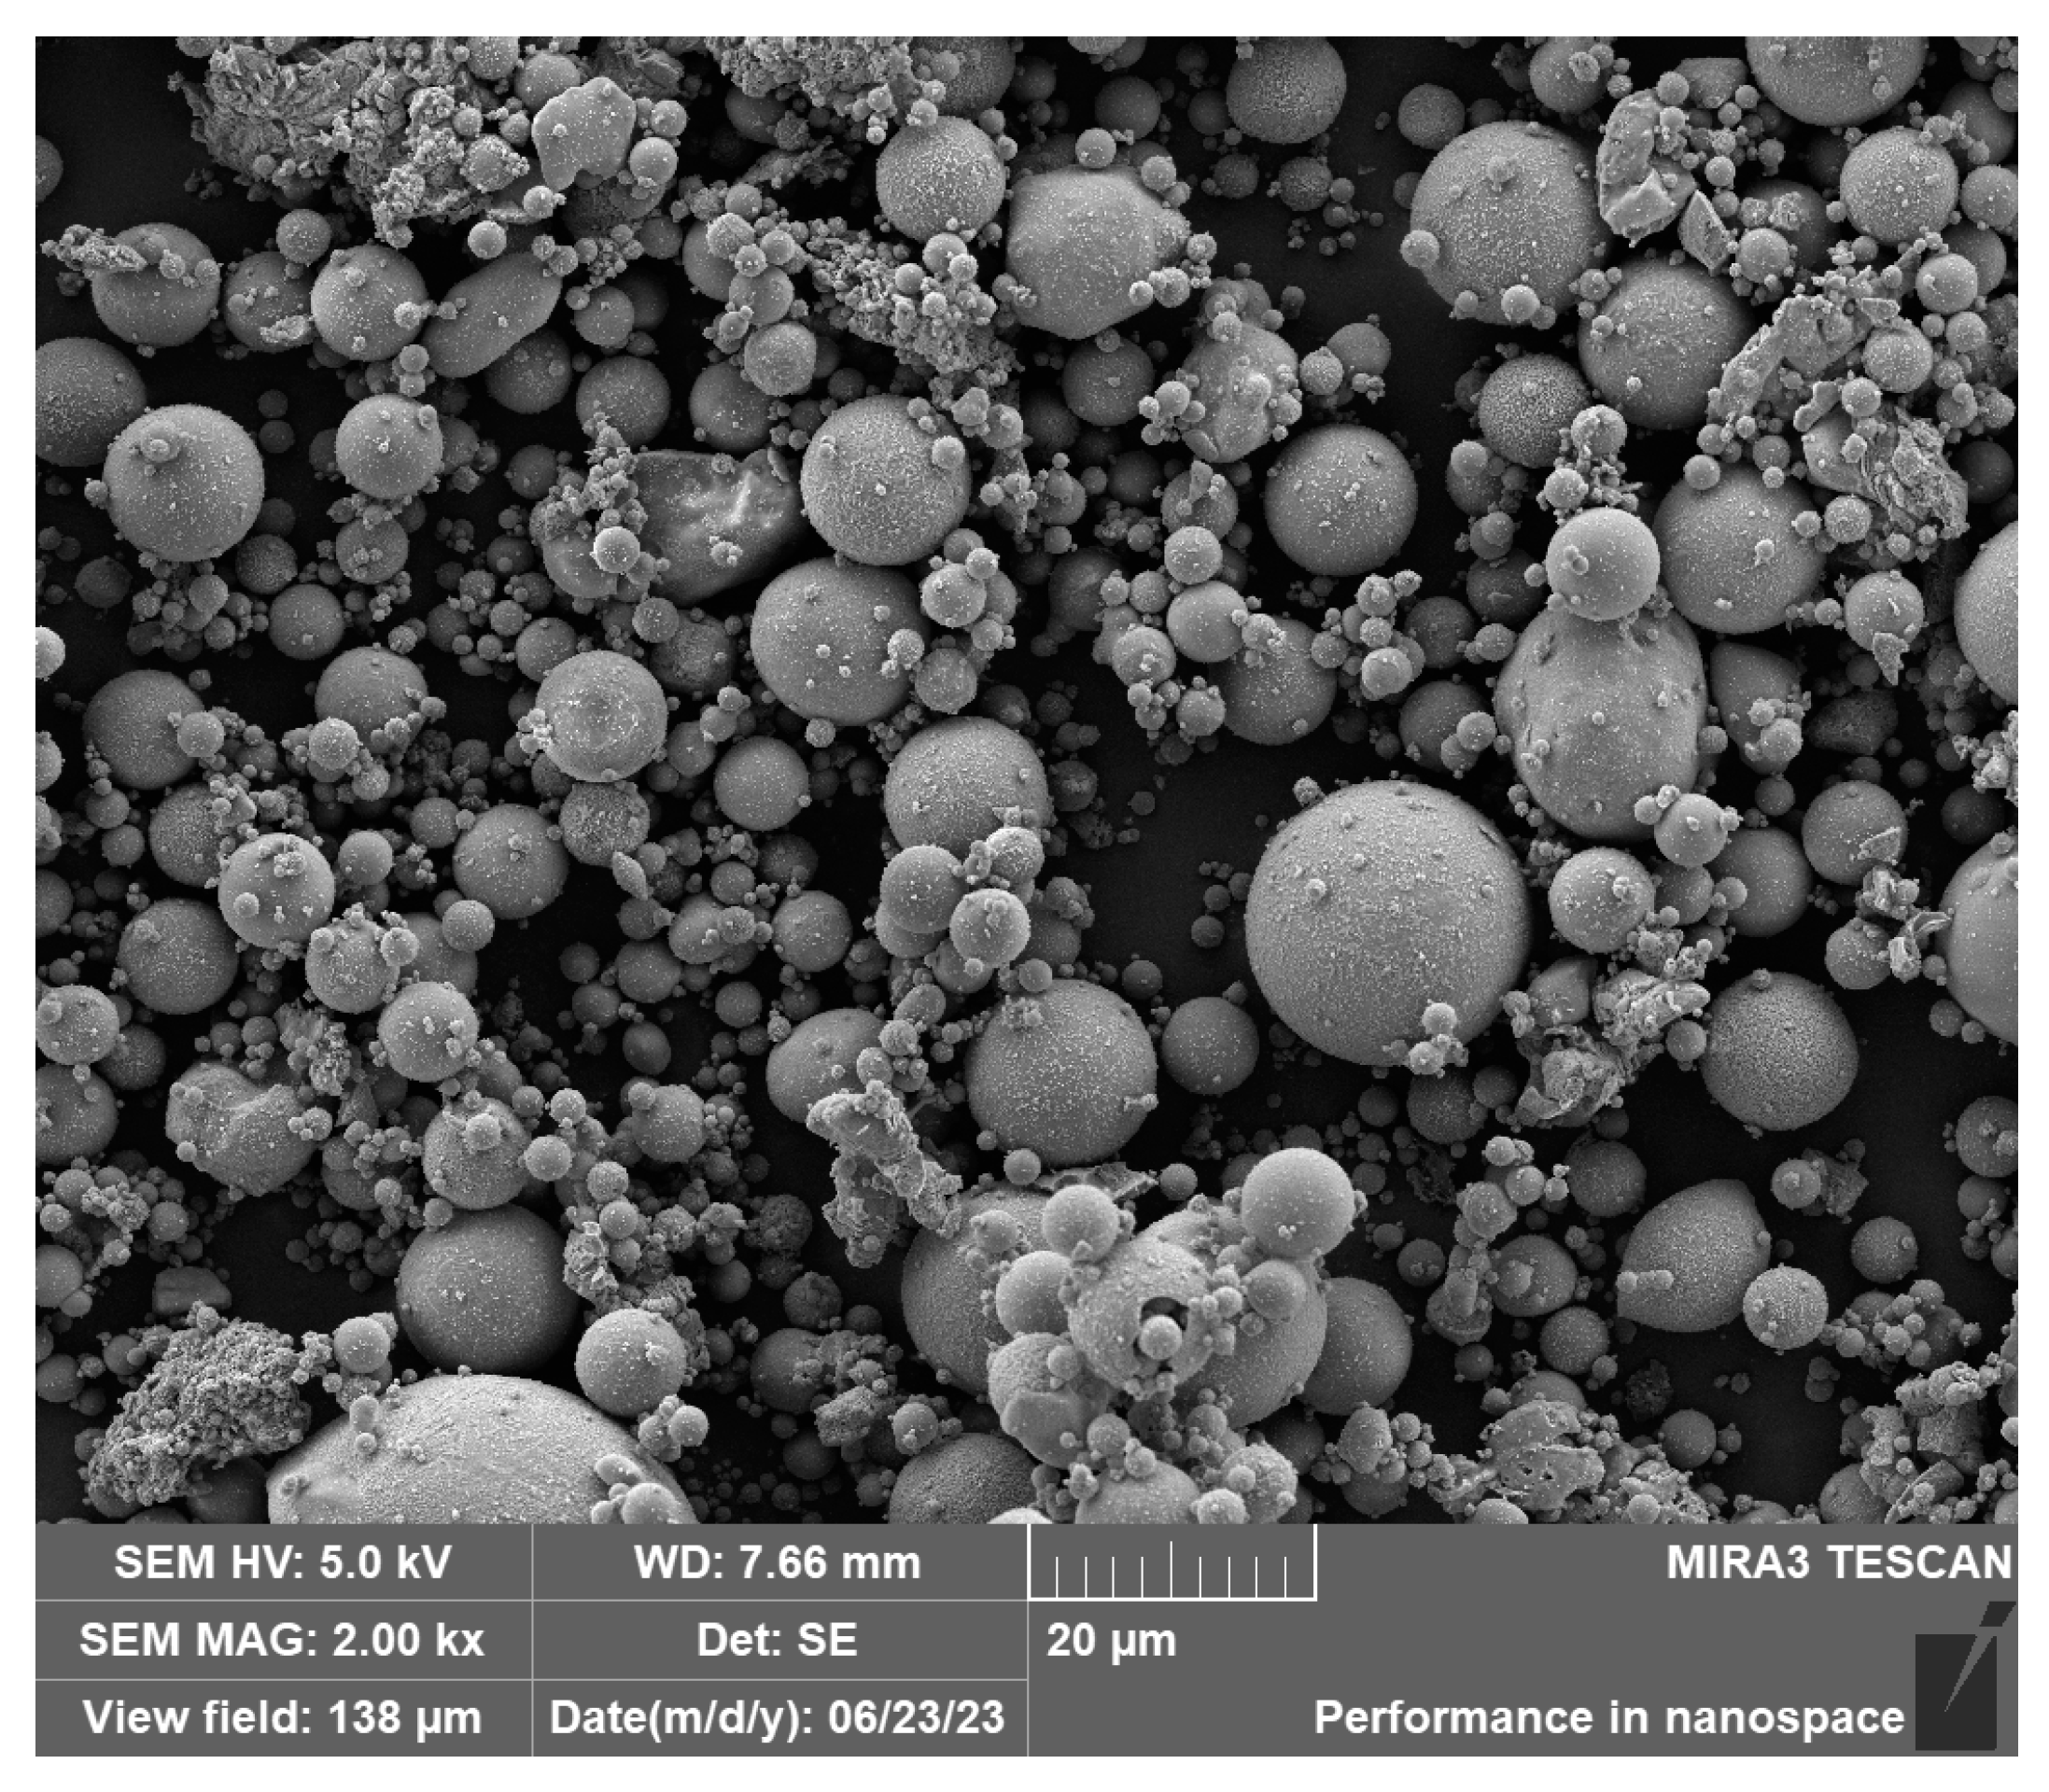
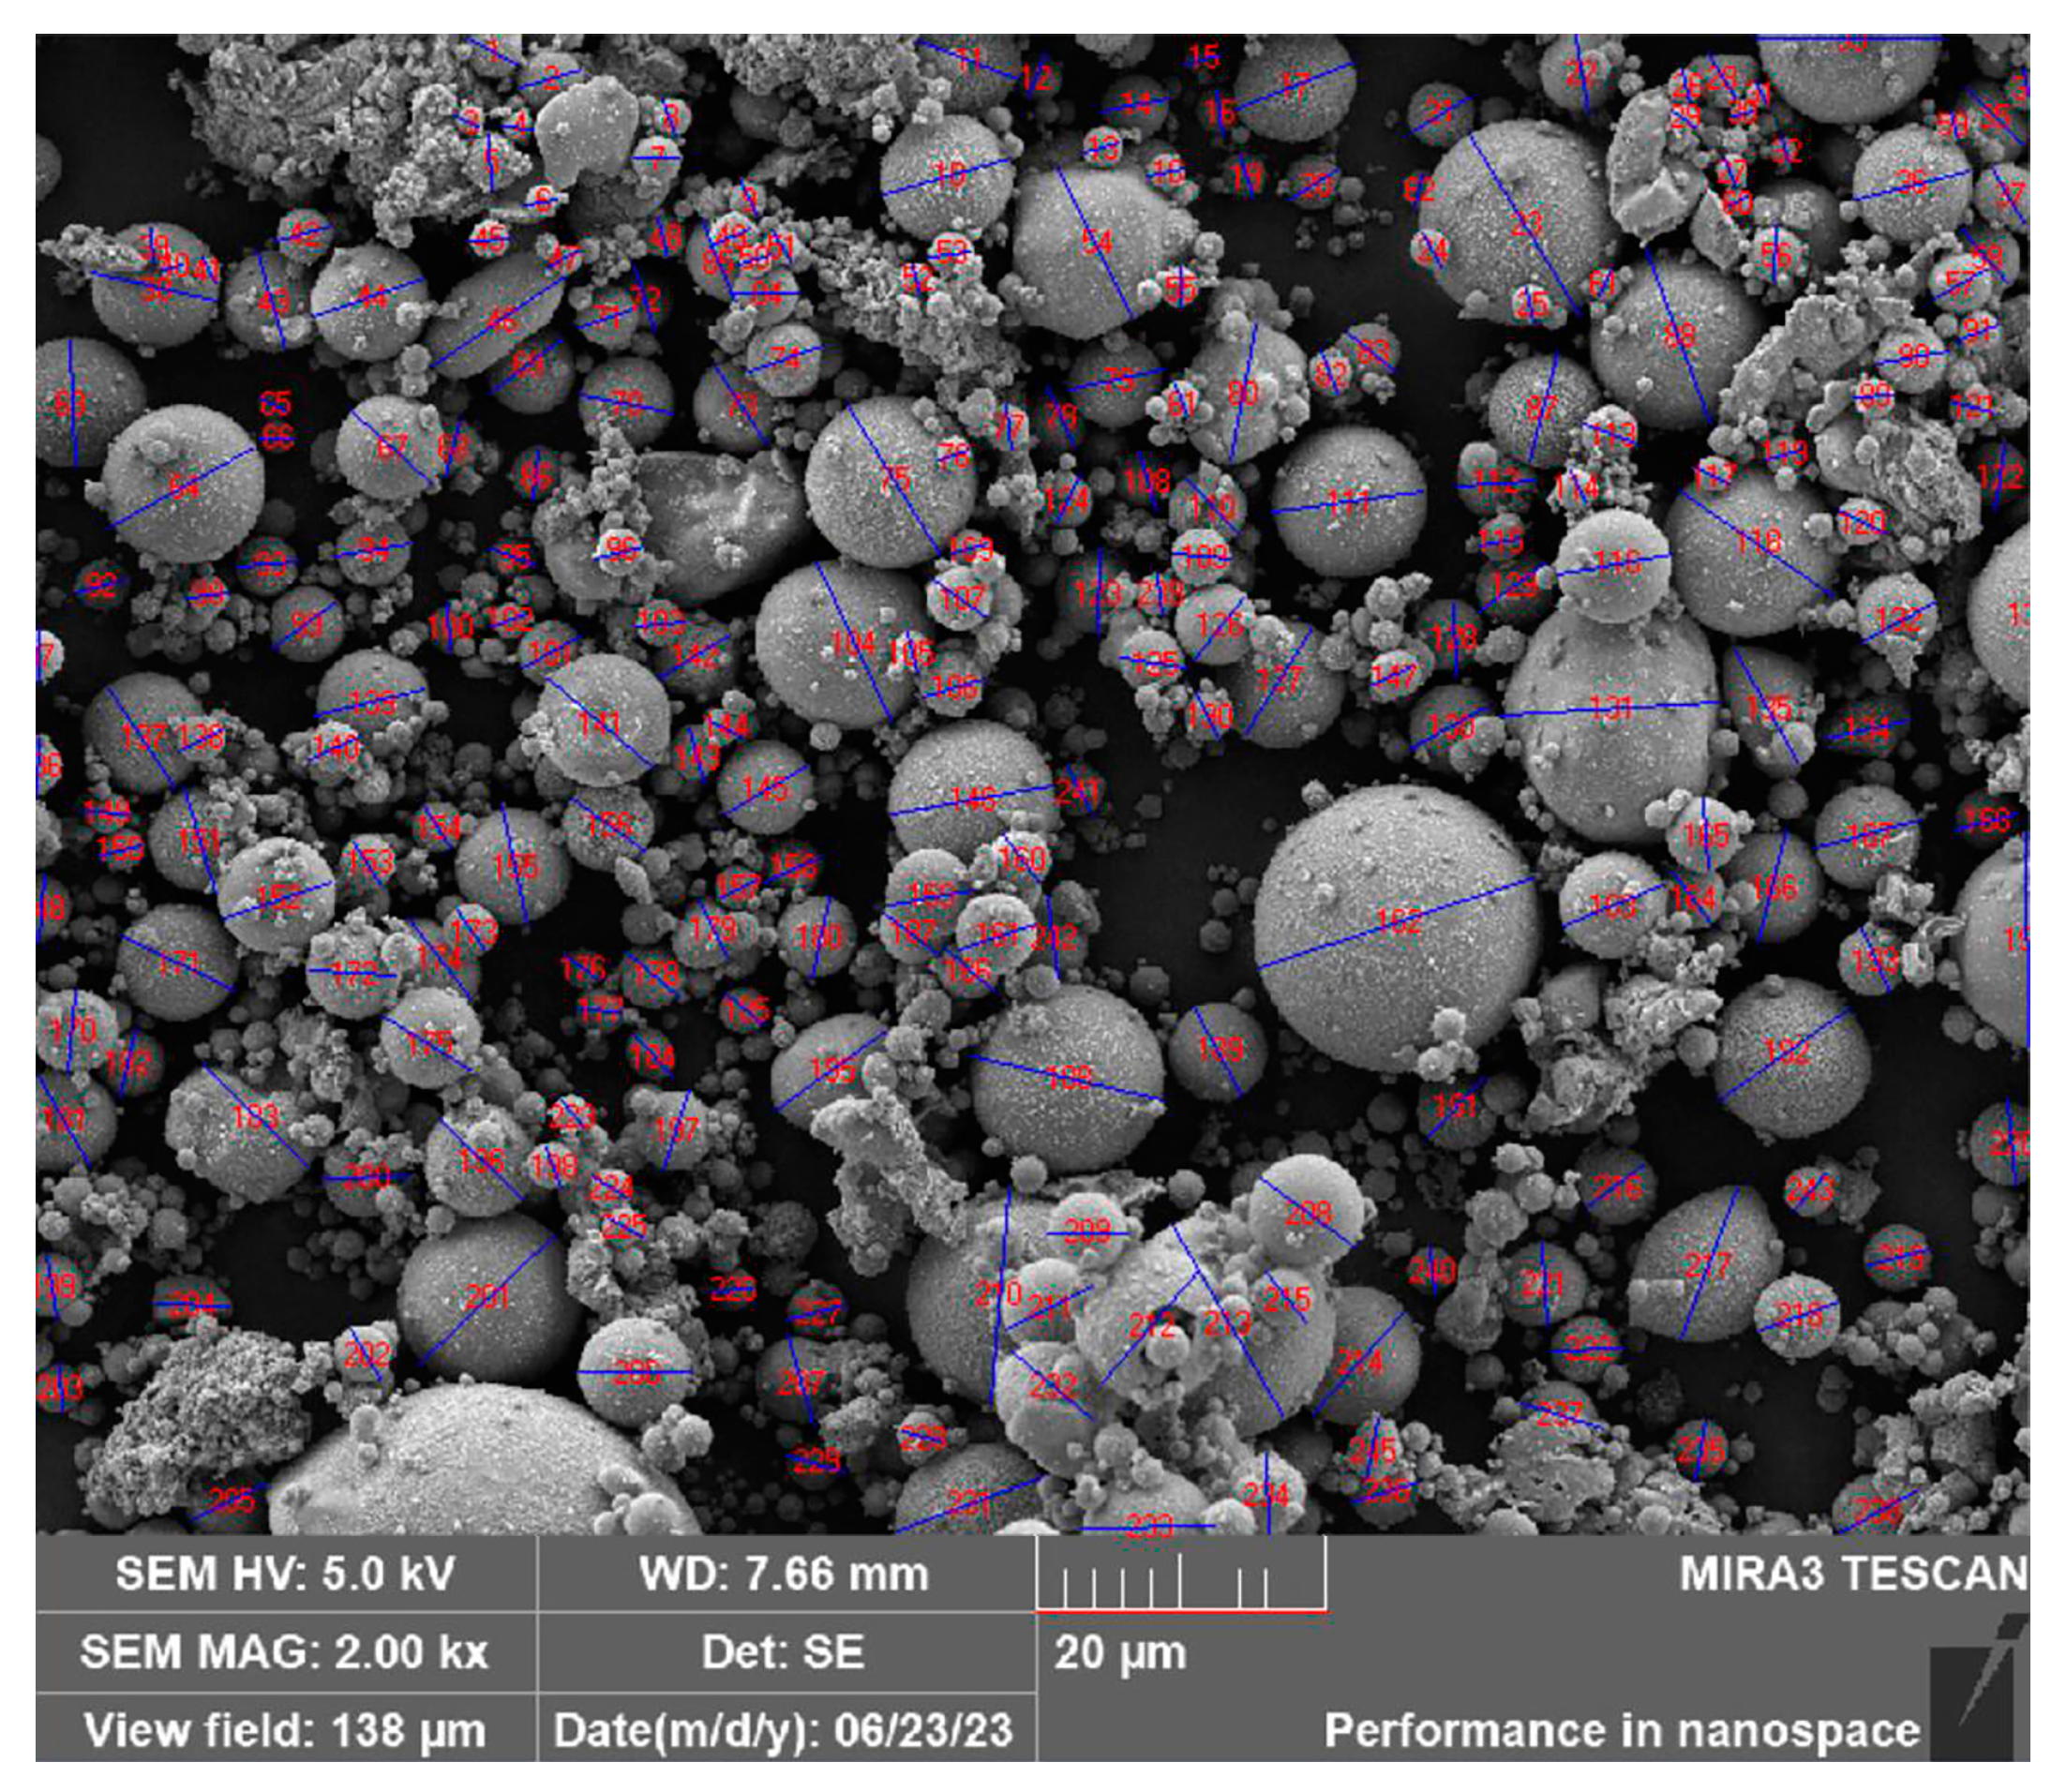
3.1.1. Morphological Characteristics of Coal-Fired Fly Ash

The dried fly ash samples were analyzed via scanning electron microscopy. The morphological characteristics of the coal-fired fly ash are depicted in Figure 6. The coal-fired fly ash pellets appeared in the form of regular spheres with different diameters. The surface of the spherical pellets was smooth, the boundary between the pellets was well defined, and some tiny pellets adhered to large pellets.

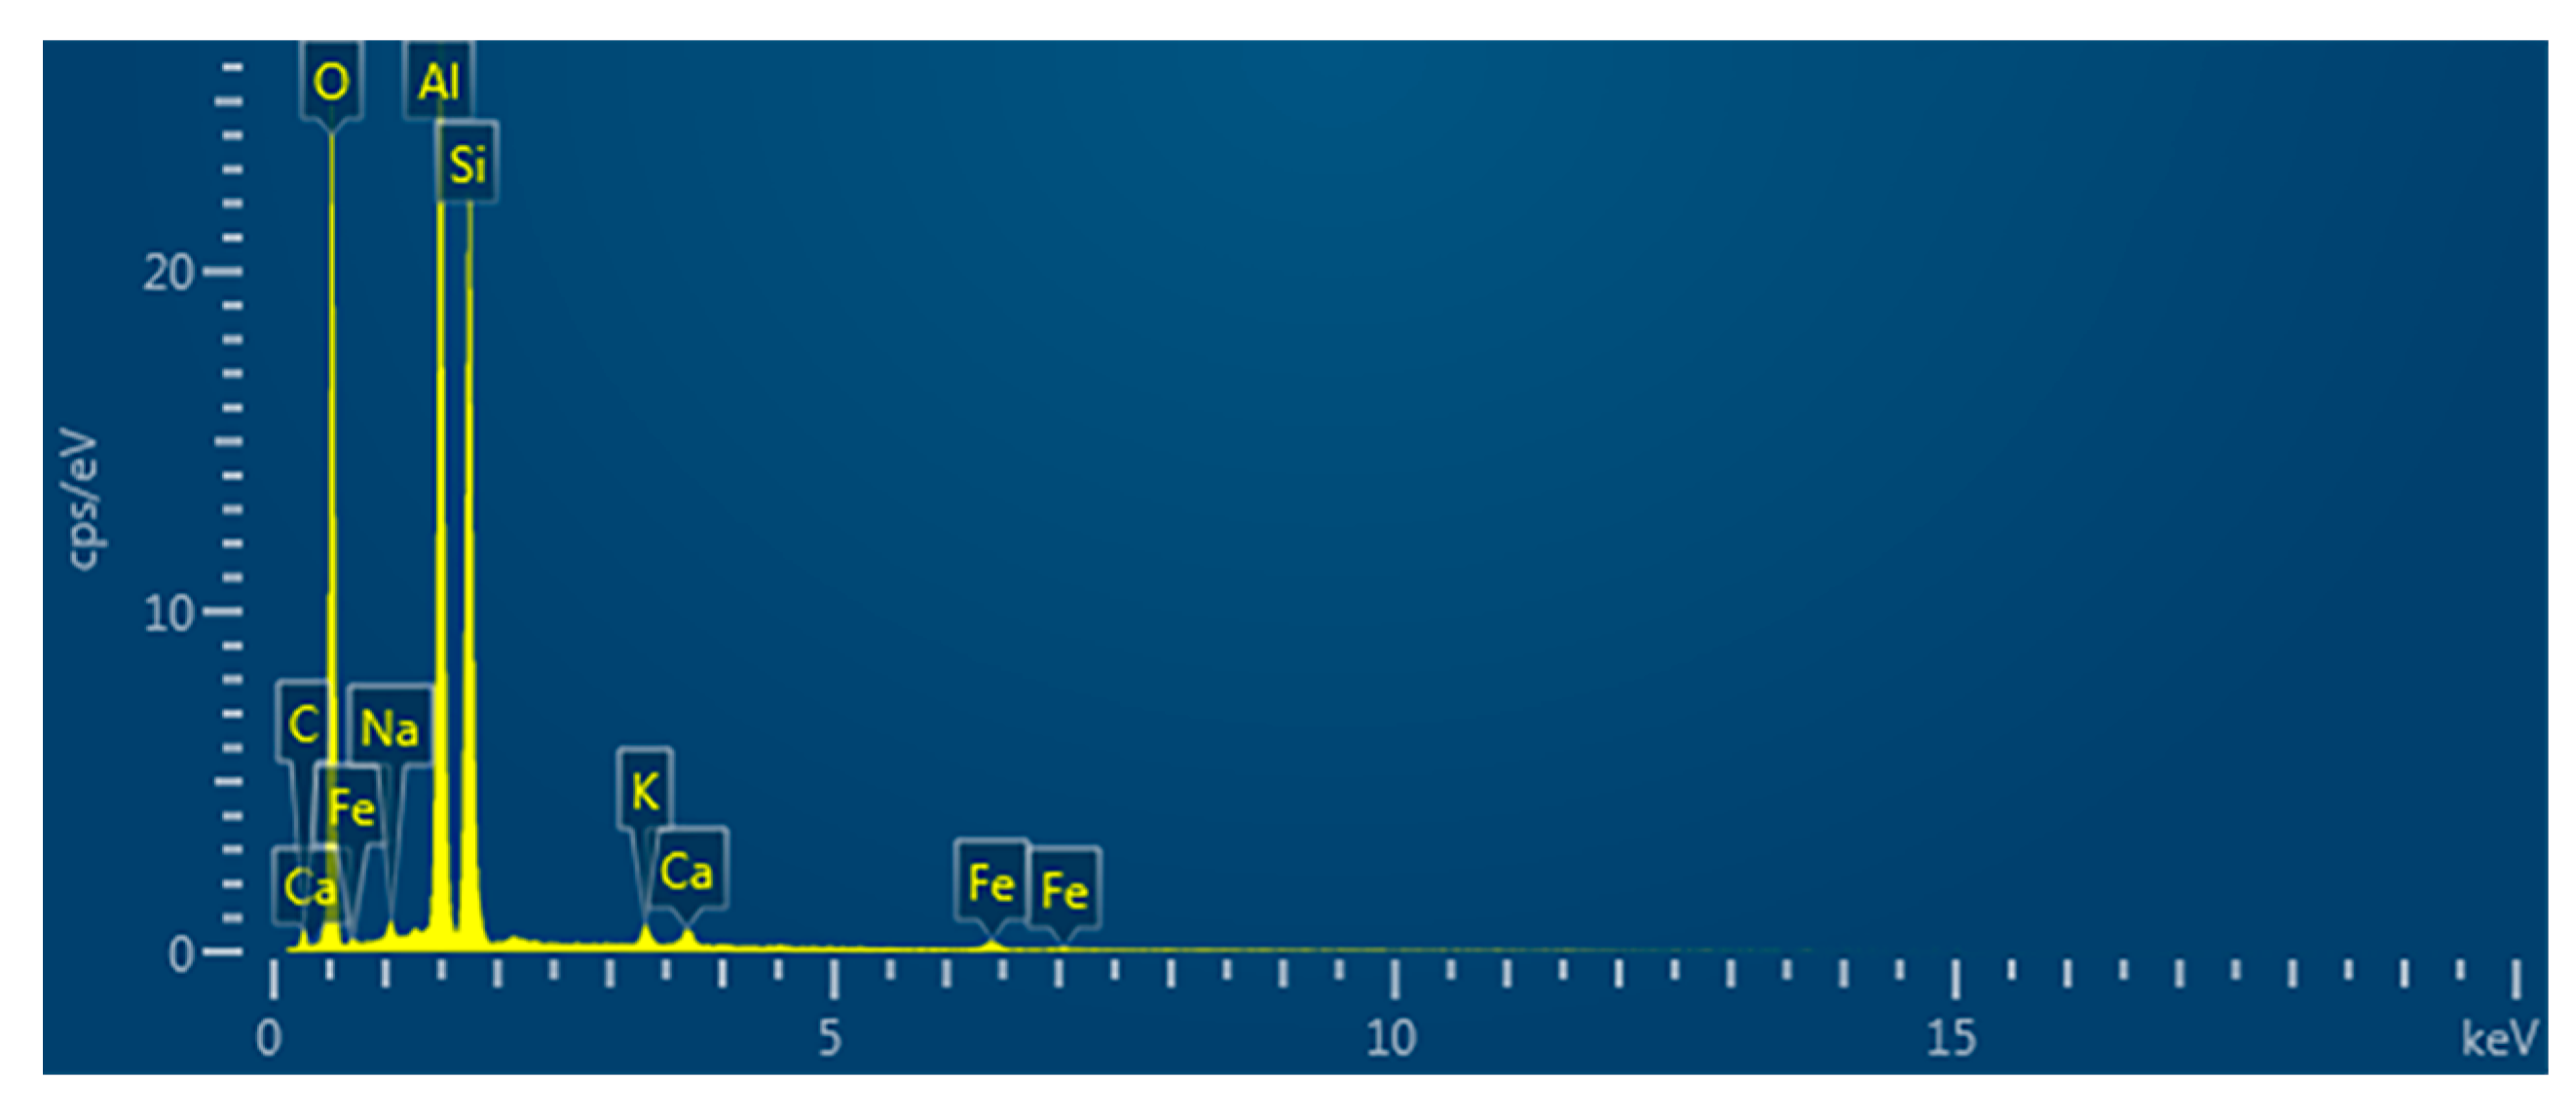
3.1.2. Elemental Composition and Proportion of Coal-Fired Fly Ash

The elemental composition of the coal-fired fly ash is shown in Figure 7, and the elemental ratios are listed in Table 2. The main elements that comprised the coal-fired fly ash were O, Si, Al, C, Fe, K, Ca, and Na; the main compounds were SiO2, Al2O3, CaO, and Fe2O3.

3.1.3. Pellet Diameter Distribution of Coal-Fired Fly Ash

The pellet diameter statistics and pellet diameter distribution of the coal-fired fly ash are described in Figure 8 and Table 3. The range of the pellet diameter distribution was 1 to 21 µm with a minimum of 1.65 µm, a maximum of 20.07 µm, and an average of 5.48 µm. Moreover, 92.18% of the pellets were less than 11 µm in diameter, whereas 79.01% of the pellets were greater than 2.5 µm in diameter.
According to the statistical results, the pellet diameter of the coal-fired fly ash was mainly 2.5–9.83 μm, categorizing it as particulate matter PM2.5 and PM10 suspended in the atmosphere environment. Because larger particles such as PM50 and PM100 tend to settle quickly and are only suspended in the atmosphere for a short time, the main particulate pollutants in the atmosphere are PM2.5 and PM10. The emissions from coal combustion in thermal power plants are an important cause of air pollution.

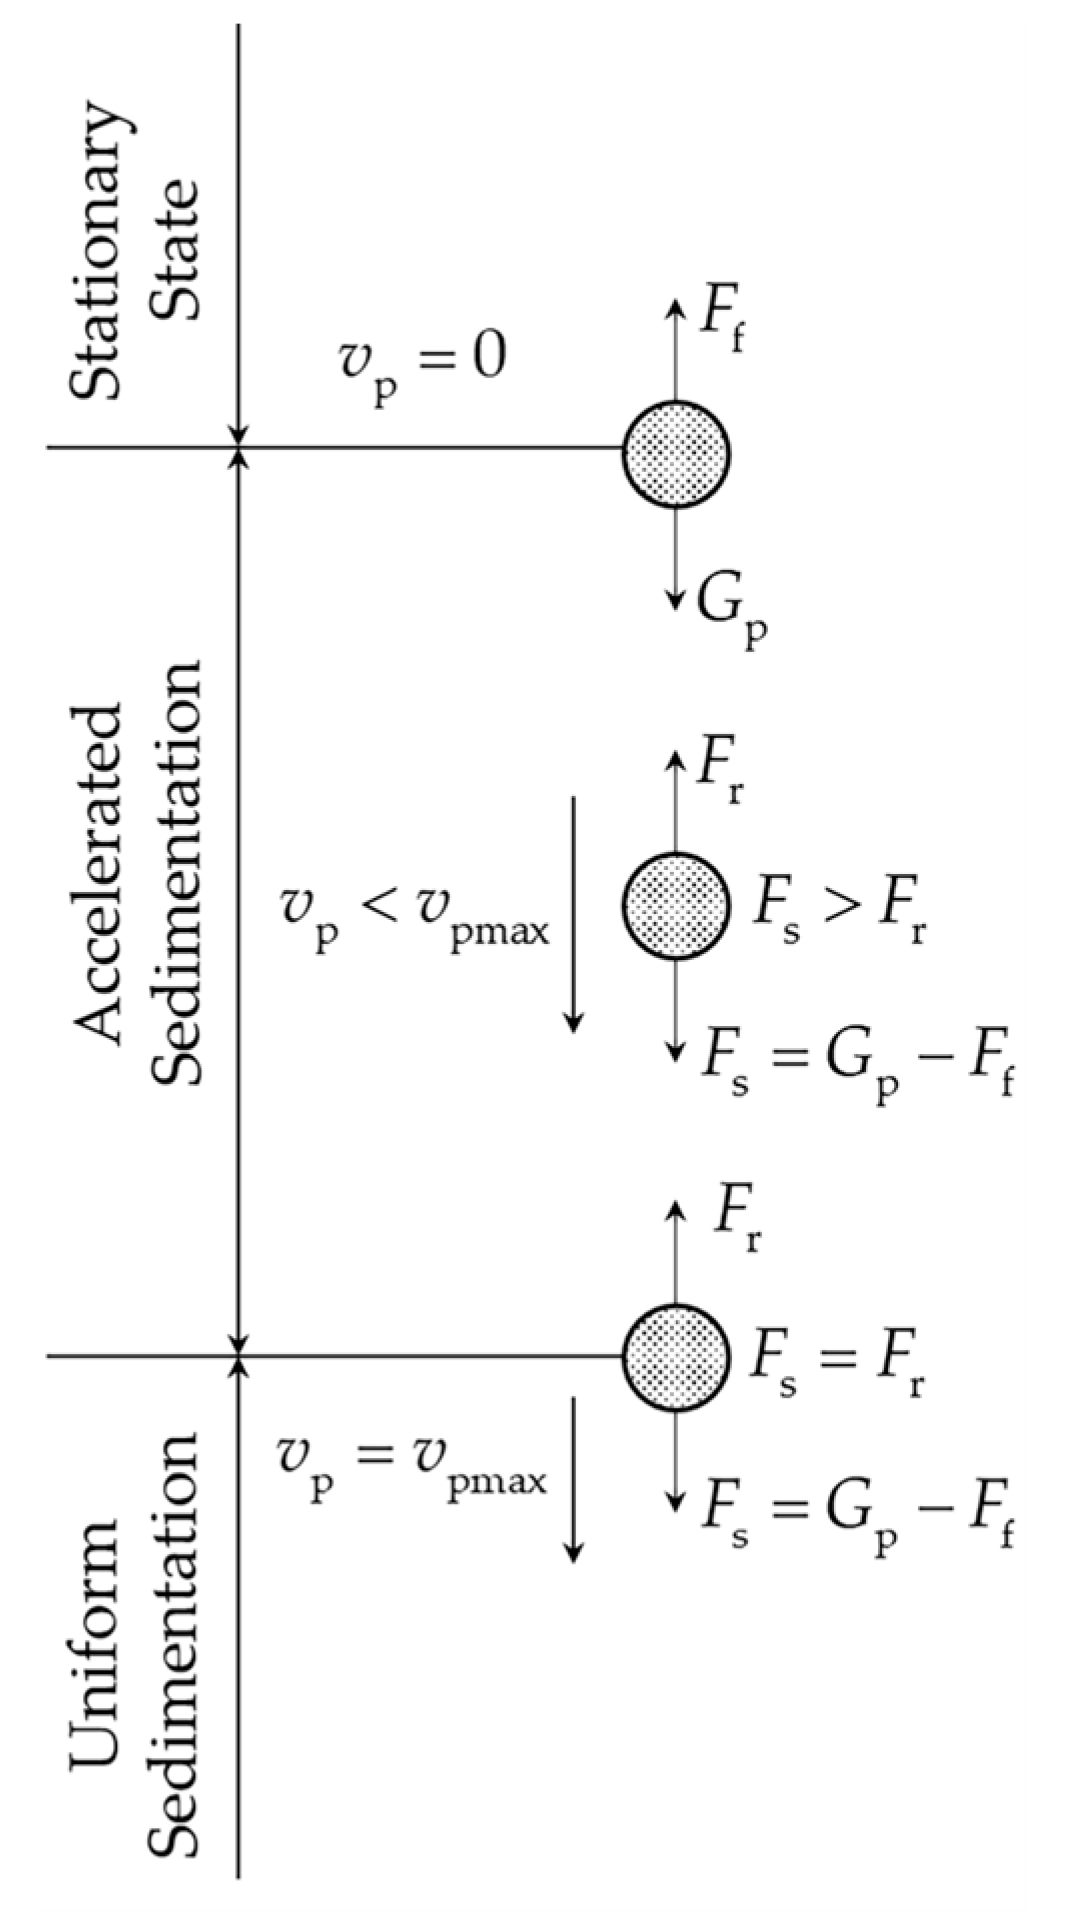
3.2. Derivation of Sedimentation Velocity of Coal-Fired Fly Ash (Appendix A: Interpretation of Formula Symbols)

The air temperature and humidity, wind speed and direction, and airflow state (laminar and turbulent flow) can affect the sedimentation process of coal-fired fly ash. Simulating field air conditions in a laboratory and conducting tests at a coal-fired power plant are difficult. Therefore, the air conditions in the laboratory were set to a relatively ideal state (20 °C, 50% RH, wind speed of 0 m/s, and laminar flow), which simplified the sedimentation process, facilitated the derivation of the sedimentation velocity, and enabled the calculation of the quantities of coal-fired fly ash on the basis of fluid mechanics and aerodynamics. The sensor’s working temperature was −30 to 40 °C, and the working humidity was 15% to 85% RH. The air conditions set up in the laboratory met the requirements of the NO2 electrochemical sensor.
The sedimentation process and force values of the coal-fired fly ash pellets in air in the laboratory are illustrated in Figure 9. The sedimentation process comprised three stages, namely, stationary, accelerated sedimentation, and uniform sedimentation, according to the sedimentation velocity of the coal-fired fly ash pellet.
In the stationary state stage, the coal-fired fly ash pellet is only subjected to the force of gravity G p and air buoyancy F f , and the sedimentation velocity of the coal-fired fly ash pellet v p is zero.
G p = m p g = ρ p V p g = 1 6 π d p 3 ρ p g
F f = ρ a V p g = 1 6 π d p 3 ρ a g
F s = G p F f = 1 6 π d p 3 ρ p ρ a g
when the air buoyancy F f is less than gravity G p , the coal-fired fly ash pellets start accelerating and progressing to the accelerated sedimentation stage. At this time, air resistance F r is generated. The kinematic formula of the coal-fired fly ash pellets is
F s F r = m p a p = m p d v p d t
The air resistance F r can be calculated as follows [31]:
F r = 1 2 C a A p ρ a v p 2
The air resistance of the coal-fired fly ash pellets with a regular spherical shape can be calculated as
F r = 1 2 C a π d p 2 4 ρ a v p 2 = C a π d p 2 ρ a v p 2 8
The expression for the sedimentation velocity of the coal-fired fly ash pellets can be obtained by substituting Formulas (5) and (8) into Formula (6):
d v p d t = ρ p ρ a g ρ p 3 C a ρ a 4 d p ρ p v p 2
The air resistance F r increases with the increase in the velocity. When the air resistance F r is equivalent to the total force F s , the sedimentation velocity of the coal-fired fly ash pellet reaches its maximum value v pmax . Then, the coal-fired fly ash pellets start falling at a uniform velocity and progress to the uniform sedimentation stage, and the acceleration is zero.
d v pmax d t = ρ p ρ a g ρ p 3 C a ρ a 4 d p ρ p v pmax 2 = 0
v p max = 4 d p ρ p ρ a g 3 C a ρ a
The air resistance coefficient C a is a function of the Reynolds number R e p [32], which can be calculated as
C a = k R e p m
when the airflow is laminar, R e p 1 , m = 1 , and k = 24 . The air resistance coefficient C a can then be calculated as
C a = 24 R e p = 24 μ a ρ a v p d p
The expression for the maximum sedimentation velocity v pmax can be obtained by substituting Formula (13) into Formula (11):
v p max = ρ p ρ a g d p 2 18 μ a
The tap density of the coal-fired fly ash pellet ρ p is 1200 kg/m3, according to calculations [33]. Referring to the standard atmosphere table [34], the density of air ρ a is 1.205 kg/m3 and the aerodynamic viscosity μ a is 1.810 × 10⁻⁵ Pa·s when the air temperature is 20 °C.
The range of the pellet diameter distribution was 1 to 21 µm, with a minimum of 1.65 µm, a maximum of 20.07 µm, and an average of 5.48 µm. Therefore, the range of v pmax was
v p max min = v d p = 1.65 μ m = 0.98 × 10 4   m / s v p max max = v d p = 20.07 μ m = 14.52 × 10 3   m / s
As 92.18% of the pellet was less than 11 µm in diameter, and 79.01% of the pellet was more than 2.5 µm in diameter, the sedimentation velocity v p was calculated based on the average of 5.48 µm.
v p = v d p = 5.48 μ m = 10.83 × 10 4   m / s
The theoretical calculation method enables the modeling of the sedimentation process of the coal-fired fly ash pellet, which is convenient for analyzing its movement state. However, the model does not consider the effects of the wind speed and direction or airflow state. Despite these shortcomings, this method is valid for measuring the sedimentation velocity of coal-fired fly ash pellets in laboratory air environments and has important engineering application value in the on-site analysis of these pellets at coal-fired power plants.

3.3. Experimental Test Results of Measurement Error of NO2 Electrochemical Sensor

The Emission Standard of Air Pollutants for Thermal Power Plants [12] in China establishes a limit of 30 mg/m3 for smoke and dust emissions from coal boilers, so we selected this limit for our study.
This concentration was chosen for the experimental tests for two reasons. Firstly, the fly ash concentration at the coal-fired power plant was too low to quickly cause a sensor measurement error. We installed a fly ash concentration monitoring device 100 m from the coal-fired power plant and found that the fly ash concentration was 1 mg/m3. Initially, we chose a fly ash concentration of 1 mg/m3 for the experimental tests and found that the low fly ash concentration resulted in zero deposition, preventing the completion of the experimental tests. Therefore, we ultimately selected 30 mg/m3 for the experimental testing. Secondly, 30 mg/m3 can realize time acceleration effects. In the laboratory atmosphere, 1 day’s deposition at 30 mg/m3 was assumed to be equal to 30 days’ deposition at 1 mg/m3.
A cube (1 m × 1 m × 1 m) was set up in the laboratory, and then 30 mg/m3 coal-fired fly ash was introduced from the top surface of the cube. The fly ash started to settle from the top surface onto the bottom surface of the cube. According to formula (16), we calculated that the time required for the coal-fired fly ash to settle on the bottom surface of the cube was 923.4 s (about 15.4 min). After the coal-fired fly ash completely settled on the bottom surface, as the bottom area was 1 m2, the mass of coal-fired fly ash that settled on the bottom surface was 30 mg.
The NO2 electrochemical sensor was placed at the bottom of the cube, and 30 mg/m3 coal-fired fly ash was also introduced from the top surface. Because the area of the sensor’s gas diffusion membrane was 283.5 × 10⁻⁶ m2, the amount of coal-fired fly ash deposited on the surface of the membrane was calculated to be 8.5 × 10⁻³ mg. The amount of coal-fired fly ash deposited on the surface of the sensor gas diffusion membrane at different times was obtained by changing the time at which the fly ash was introduced.
Table 4 shows the quantities of 30 mg/m3 coal-fired fly ash deposited on the gas diffusion membrane after various deposition durations.
The NO2 electrochemical sensor was placed in the test box, and the coal-fired fly ash samples, which were deposited for 30, 60, 90, 120, 150, or 180 days, were uniformly placed on the gas diffusion membrane of sensor No. 1. Afterward, NO2 gas (10, 20, 30, 40, 50, 60, 70, 80, 90, or 100 ppm) was introduced to the test box. The experimental measurement and sensor measurement error values are presented in Table 5 and Table 6. The data handling results are illustrated in Figure 10.
Analyzing the experimental measurements, we found that the minimum and maximum measurement errors of the NO2 electrochemical sensor, respectively, were 8.015% and 30.35% for a deposition duration of 30 days, 11.536% and 49.8% at 60 days, 13.441% and 63.18% at 90 days, 20.768% and 67.68% at 120 days, 24.03% and 78.18% at 150 days, and 30.78% and 89.49% at 180 days. The measurement error of the NO2 electrochemical sensor increased with the increasing coal-fired fly ash deposition time.
The measurement error was calculated as follows: NO2 gas concentration value minus sensor-measured value, multiplied by 100%. For example, for a deposition time of 30 days, the measurement error for 10 ppm NO2 would be 30.35% = (10 − 6.965) × 100%.
This occurs because the deposition of coal-fired fly ash on the gas diffusion membrane prevents the gas from entering the sensor, leading to measurement errors. The pellet diameter ranged from 1 to 21 µm, and the gas diffusion membrane had 49% porosity and a 12–16 µm pore diameter. As coal-fired fly ash is deposited on a gas diffusion membrane, the membrane blocks the coal-fired fly ash pellets with a diameter of less than the pore diameter from entering the sensor via electrostatic adsorption, inertial collision, and diffusion collision [35]. This results in a monolayer of fly ash forming on the gas diffusion membrane, blocking some of its pores, resulting in a decrease in S in Formula (2). This produces a negative measurement error, i.e., sensor-measured values that are lower than the actual NO2 concentration. Additionally, the thickness of the coal-fired fly ash deposition layer increases over time. The single layer of fly ash gradually becomes multiple layers, resulting in a decrease in D in Formula (2), which leads to a reduction in the measured values and an increase in the measurement error.

3.4. Impact of Humidity on Measurement Errors of NO2 Electrochemical Gas Sensors

A NO2 electrochemical gas sensor was placed in a humidity control device for humidity control, as shown in Figure 11. The humidity was 25% RH, 50% RH, 75% RH, or 98% RH, and each humidity level was maintained for 12 h. The results of the effects of the humidity on the measurement errors of the NO2 electrochemical gas sensor are shown in Table 7.
The results of the tests showed that the humidity had minimal effects on the measurement error: the higher the humidity, the smaller the measurement error. The average measurement error was 2.86% at 25% RH, 2.45% at 50% RH, 1.59% at 75% RH, and 1.08% at 98%. Therefore, the humidity essentially has a negligible effect on the sensor’s measurement error. The humidity only introduces large measurement errors if the sensor is placed in an environment with greater than 95% or less than 10% humidity for a long time. Under these conditions, the electrolyte solution inside the sensor is diluted or dries out, respectively.

3.5. Impact of Humidity-Coal Fly Ash Deposition on Measurement Errors of NO2 Electrochemical Gas Sensors

The sensors on which coal fly ash were deposited were placed in the humidity control device; the humidity levels were set to 25% RH, 50% RH, 75% RH, or 98% RH and maintained for 12 h. The test results of the effects of the humidity with coal fly ash deposition on the measurement errors of the NO2 electrochemical gas sensor are shown in Table 8.
The test results showed that the measurement error of the NO2 electrochemical gas sensor affected by the humidity and coal fly ash deposition was larger than that of the dried coal fly ash deposition, where the higher the humidity, the larger the measurement error of the sensor. In humid environments, dried coal fly ash would absorb water vapor from the air. When NO2 gas passes through the inlet membrane and enters the sensor, some part of the NO2 gas is absorbed by the moisture in the deposited coal fly ash, which leads to a decrease in the concentration of the gas and produces a measurement error. As such, the higher the humidity, the more NO2 gas is absorbed by the moisture, and the larger the measurement error.

4. Discussion

In this study, we found that coal-fired fly ash deposition reduced the diffusion coefficient D and gas diffusion area S of a sensor. The measurement error increased with the deposition time, whereas the measurement errors decreased as the gas concentration increased.
The limitation of our methodology is that the concentration of the coal-fired fly ash used in testing was higher than that measured in the field, leading to the quick failure of the sensor, which does not mimic the situation in practical applications. We installed a fly ash concentration monitoring device 100 m from a coal-fired power plant and monitored a fly ash concentration of 1 mg/m3. The device worked normally for 6 months before it failed.
We also discovered that removing the deposited fly ash from the gas diffusion membrane could reduce the measurement error. An effective method to address the decrease in the sensitivity of electrochemical sensors due to the deposition of coal-fired fly ash would involve preventing the coal-fired fly ash from being deposited on the sensor surface. Therefore, we recommend that a filter membrane be installed on the outside of the sensor’s equipment case (rather than on the outside surface of the sensor) to prevent coal-fired fly ash from entering the sensor. For example, a layer of filter membrane (polytetrafluoroethylene with a porosity of 50%, a pore size of 2–5 μm, and a thickness of 0.3 mm) could be installed at the air inlet of the equipment box, as shown in Figure 12. In addition, the periodic removal of deposited fly ash could extend the sensor’s working life and reduce the measurement error.

Author Contributions

Conceptualization, W.C. and S.W.; methodology, W.C. and D.L.; software, W.C.; validation, H.Z.; formal analysis, W.C. and D.L.; investigation, W.C. and H.Z.; writing—original draft preparation, W.C.; writing—review and editing, D.L. and W.C. All authors have read and agreed to the published version of the manuscript.

Funding

This research was funded by the Research on anti-corrosion technology of power transmission and transformation engineering equipment in high pollution areas and development and application of atmospheric monitoring system, funding number 52053020002R.

Institutional Review Board Statement

Not applicable.

Informed Consent Statement

Not applicable.

Data Availability Statement

Data are contained within the article.

Acknowledgments

The TESCAN MIRA3 SEM system is available from the School of Power and Mechanical Engineering, Wuhan University.

Conflicts of Interest

The authors declare no conflicts of interest.

Appendix A

Interpretation of formula symbols.
  • Formulas (3)–(5)
m p : Mass of coal-fired fly ash pellets, kg
ρ p : Density of coal-fired fly ash pellet, kg/m3
V p : Volume of coal-fired fly ash pellet, m3
d p : Diameter of coal-fired fly ash pellet, m
ρ a : Density of air, kg/m3
2.
Formulas (6) and (7)
C a : Air resistance coefficient, dimensionless
A p : Maximum cross-sectional area of coal-fired fly ash pellet in direction of motion, m2
v p : Velocity of motion of coal-fired fly ash pellet in air, m/s
3.
Formulas (12) and (13)
R e p = d p ρ a v p μ a
μ a : Dynamic viscosity of air, Pa s
k , m : Constants

References

  1. The National Energy Administration Released Statistical Data on the National Power Industry from January to September 2023. Available online: http://www.nea.gov.cn (accessed on 8 November 2023).
  2. Yong, Z.; Dong, M.; Tao, W.; Jia, W.; Yong, G.; Zai, Z.; Carlos, E.; Romero; Wei, P. In-Situ Capture of Mercury in Coal-Fired Power Plants Using High Surface Energy Fly Ash. Environ. Sci. Technol. 2019, 53, 7913–7920. [Google Scholar]
  3. Gao, C. Study on air pollutant emission estimation of coal boiler in thermal power plant. Environ. Sci. Manag. 2022, 47, 32–37. [Google Scholar]
  4. Huang, L.; Hu, J.; Chen, M.; Zhang, H. Impacts of power generation on air quality in China-Part I: An overview. Resour Conserv. Recycl. 2017, 121, 103–114. [Google Scholar] [CrossRef]
  5. Liu, Y.; Yan, J.; Xu, W. Emission characteristics of conventional air pollutants in coal-fired power plants after ultra-low emission transformation. Acta Sci. Circumstantiae 2020, 40, 1967–1975. [Google Scholar]
  6. Yun, H.; Xie, Y.; Zhang, X. Research on the Adsorption and Transformation of Nitrogen Oxide and Sulphur Dioxide Gases in Thermal Power Plants. Chem. Adhes. 2023, 45, 263–265. [Google Scholar]
  7. Li, G. The Harm of Nitrogen Oxides to the Environment and Pollution Control Techniques. Shanxi Chem. Ind. 2019, 5, 123–125. [Google Scholar]
  8. Liang, J.; Zheng, J.; Han, M. Hazards of nitrogen oxides and their treatment technologies. Technol. Innov. Appl. 2021, 24, 120–123. [Google Scholar]
  9. Wang, Y.; Zhang, L.; Chen, J.; Wen, X. The Harm and Treatment of Nitrogen Oxides in the Atmosphere. Technol. Innov. Appl. 2019, 7, 137–138. [Google Scholar]
  10. Li, H. Fire Combustion Science; China Machine Press: Beijing, China, 2014; p. 57. [Google Scholar]
  11. Li, X.; Yong, Y.; Ai, W. Fire and Explosion Protection Engineering; Metallurgical Industry Press: Beijing, China, 2010; p. 75. [Google Scholar]
  12. GB 13223-2011; Emission Standard of Air Pollutants for Thermal Power Plants. China Environmental Science Press: Beijing, China, 2011; p. 3.
  13. Zhang, S.; Zhou, L.; Hu, Y.; Liu, X.; Zhang, J. Metal-organic gel derived ZnO/α-Fe2O3 heterostructures for sensitive NO2 detection. Sens. Actuators B. Chem. 2023, 396, 134524. [Google Scholar] [CrossRef]
  14. Guo, Y.; Jiang, C.; Zheng, X. Research Progress of Mesoporous Metal Oxide Semiconductor NOx Gas Sensors. J. Funct. Mater. Devices 2023, 29, 141–153. [Google Scholar]
  15. Umesh, Y.; Ravindra, S.; Shaligram, A.D.; Gangal, S.A. Design, simulation, fabrication and testing of Electrochemical NO2 gas sensor. In Proceedings of the 2015 2nd International Symposium on Physics and Technology of Sensors, Pune, India, 7–10 March 2015; pp. 268–272. [Google Scholar]
  16. Lu, J.; Ling, L.; Dong, K.; Huang, Y.; Hu, R.; Li, A.; Xie, P. Monitoring of atmospheric NO2 and O3 based on electrochemical sensor. Acta Sci. Circumstantiae 2021, 41, 2633–2639. [Google Scholar]
  17. Qin, H.; Wang, Y.; Yang, Y.; Liu, Z.; Tong, Y.; Xu, H. Design and test of electrochemical NO2 gas sensor based on HTCC technology. J. Light Ind. 2019, 34, 59–63. [Google Scholar]
  18. HJ 479-2009; Ambient Air—Determination of Nitrogen Oxides—N-(1-Naphthyl)ethylene Diamine Dihydrochloride Spectrophotometric Method. China Environmental Science Press: Beijing, China, 2009; pp. 1–5.
  19. Wu, Z. Electrochemical Gas Sensor with Gelled Electrolyte. Master’s Thesis, Zhengzhou University, Zhengzhou, China, 2020. [Google Scholar]
  20. Huang, Y.; Lv, S.; Zheng, X. Progress of NASCION-based electrochemical sensors. J. Funct. Mater. Devices 2023, 29, 164–177. [Google Scholar]
  21. Md Ashfaque, H.K.; Mulpuri, V.R.; Li, Q. Recent Advances in Electrochemical sensors for Detecting Toxic Gases: NO2, SO2 and H2S. Sensors 2019, 19, 905. [Google Scholar]
  22. Wan, H.; Yin, H.; Lin, L.; Zeng, X.; Andrew, J.M. Miniaturized planar room temperature ionic liquid electrochemical gas sensor for rapid multiple gas pollutants monitoring. Sens. Actuators B Chem. 2018, 255, 638–646. [Google Scholar] [CrossRef] [PubMed]
  23. Gorbova, E.; Tzorbatzoglou, F.; Molochas, C.; Chloros, D.; Demin, A.; Tsiakaras, P. Fundamentals and Principles of Solid-State Electrochemical sensors for High Temperature Gas Detection. Catalysts 2022, 12, 1. [Google Scholar] [CrossRef]
  24. Anirban, P.; Sriram, M.; Shalini, P. Review—Room-Temperature Ionic Liquids for Electrochemical Application with Special Focus on Gas Sensors. J. Electrochem. Soc. 2020, 167, 37511. [Google Scholar]
  25. Park, C.O.; Fergus, J.W.; Miura, N.; Park, J.; Choi, A. Solid-state electrochemical sensors. Ionics 2009, 15, 261–284. [Google Scholar] [CrossRef]
  26. Korotcenkov, G. Sensors Technology Series Chemical Sensors, Comprehensive Sensors Technologies, Volume 5: Elcetrochemical and Optical Sensors; Momentum Press: New York, NY, USA, 2013; p. 73. [Google Scholar]
  27. Alphasense_NO2-B43F_datasheet. Available online: https://www.alphasense.com/products?keyword=NO2-B43F (accessed on 17 December 2023).
  28. Editorial Board of “Air and Waste Gas Monitoring and Analysis Methods”. Air and Waste Gas Monitoring and Analysis Methods, 4th ed.; China Environmental Science Press: Beijing, China, 2019; p. 128. [Google Scholar]
  29. HJ 693-2014; Stationary Source Emission—Determination of Nitrogen Oxides—Fixed Potential by Electrolysis Method. China Environmental Science Press: Beijing, China, 2014; p. 1.
  30. GB 13269-91; Atmospheric Air—Test Dust Standard Sample-Fly Ash. China Environmental Science Press: Beijing, China, 1992; pp. 1–3.
  31. Qiang, N.; Ji, X.; Xu, B. Air Pollution Control Engineering; Chemical Industry Press: Beijing, China, 2015; pp. 35–40. [Google Scholar]
  32. Zhao, B. Air Pollution Control Engineering; Chemical Industry Press: Beijing, China, 2017; pp. 31–32. [Google Scholar]
  33. GB/T 21354-2008/ISO 3935:1993; Power-Determination of Tap Density (ISO 3953:1993, Metallic Powers-Determination of tap density, IDT). China Environmental Science Press: Beijing, China, 2008; pp. 1–3.
  34. Lei, J.; Wu, X.; Wu, J. Aerodynamics; Beijing University of Technology Press: Beijing, China, 2015; p. 348. [Google Scholar]
  35. Cai, J. Air Filtration ABC; China Construction Industry Press: Beijing, China, 2002; p. 2. [Google Scholar]
Figure 1. Appearance and dimensions of the NO2 electrochemical gas sensor.
Sensors 24 00900 g001
Figure 2. Structure diagram of NO2 electrochemical sensor.
Sensors 24 00900 g002
Figure 3. The transport pathways of and concentration changes in NO2 gas.
Sensors 24 00900 g003
Figure 4. Coal-fired fly ash samples.
Sensors 24 00900 g004
Figure 5. Experimental test device used for NO2 electrochemical sensors.
Sensors 24 00900 g005
Figure 6. MIRA3 scanning result: morphological characteristics of coal-fired fly ash.
Sensors 24 00900 g006
Figure 7. The elemental composition of coal-fired fly ash.
Sensors 24 00900 g007
Figure 8. Pellet diameter distribution of coal-fired fly ash determined using Nano Measurer 1.2 software.
Sensors 24 00900 g008
Figure 9. The sedimentation process and force values of coal-fired fly ash pellet.
Sensors 24 00900 g009
Figure 10. Experimental measuring of NO2 electrochemical sensors for different gas concentrations and deposition durations.
Sensors 24 00900 g010
Figure 11. Control of humidity around NO2 electrochemical gas sensor.
Sensors 24 00900 g011
Figure 12. A filter membrane installed on the outside of a sensor’s equipment case. (a) PTFE membrane material fabricated by POREX; (b) SEM result showing morphological characteristics of the filter membrane with 2 μm scale bar.
Sensors 24 00900 g012
Table 1. Performance parameters of the NO2 electrochemical gas sensor.
CategoryIndicatorDescriptionValue
SpecificationsSensitivitynA/ppm at 2 ppm NO2−200 to −650
Response timet90(S) from 0 to 2 ppm NO2<80
Zero currentnA in zero air at 20 °C−80 to +80
Noise±2 standard deviations
(ppb equivalent)
15
Rangeppm NO2 limit of performance warranty20
Linearityppb error at full scale, linear at
zero and 20 ppm
<±0.5
Overgas limitNO2 maximum ppm for stable
response to gas pulse
50
LifetimeZero driftppb equivalent change/year in lab air0 to 20
Sensitivity drift% change/year in lab air, monthly test−20 to −40
Operating lifeMonths until 50% original signal
(24-month warranty)
>24
EnvironmentalSensitivity at −20 °C% (output at −20 °C/output at 20 °C)
at 2 ppm NO2
60 to 80
Sensitivity at 40 °C% (output at 50 °C/output at 20 °C)
at 2 ppm NO2
95 to 115
Zero at −20 °CnA0 to 25
Zero at 40 °CnA−10 to 50
Cross-sensitivityH2S% measured gas at 5 ppm<−80
NO% measured gas at 5 ppm<5
Cl2% measured gas at 5 ppm<100
SO2% measured gas at 5 ppm<−3
CO% measured gas at 5 ppm<−3
Key
specifications
Temperature range°C−30 to 40
Pressure rangekPa80 to 120
Humidity range%rh continuous15 to 85
Storage periodMonths at 3 to 20 °C 6
Load resistorΩ (ISB circuit is recommended)33 to 100
Weightg<13
Data from NO2-B43F electrochemical sensor instruction manual.
Table 2. The elemental composition of coal-fired fly ash (%).
OSiAlCFeKCaNa
50.3920.4019.946.230.920.800.720.60
Data obtained from MIRA3 scanning.
Table 3. Pellet diameter distribution of coal-fired fly ash.
Distribution/μmAverage/μmQuantityPercentage/%
1–32.505120.99
3–53.978735.80
5–75.844719.34
7–97.892610.70
9–119.83135.35
11–1312.04124.94
13–1514.4441.65
15–1715.220.82
17–19000.00
19–2120.0710.41
Data obtained from Nano Measurer software statistical results.
Table 4. Theoretical deposition quantities of coal-fired fly ash for various deposition durations.
Deposition Time1 h1 Day30 Days60 Days90 Days120 Days150 Days180 Days
Deposition Quantities/mg33.1 × 10−30.8024487296120144
Data from theoretical calculations.
Table 5. Experimental measuring of NO2 electrochemical sensors for different gas concentrations and deposition durations.
Sensor Measurement/ppmDeposition Duration/Days
0306090120150180
NO2 gas concentration/ppm00000000
109.7406.9655.0203.6823.2222.1821.051
2019.55117.14115.40914.72713.2278.5004.985
3029.31827.86923.78821.59119.97517.01515.742
4039.71736.55134.86932.09129.19227.75325.111
5049.56846.40944.23242.58637.89435.64632.641
6059.63655.47052.21751.91444.14642.27338.005
7069.64664.66259.59660.59153.47550.27845.859
8079.20774.46067.13165.20262.75359.88949.449
9089.71283.96576.43976.57668.24263.77357.939
10099.43991.98587.34383.33879.23275.97069.217
Data from experimental testing.
Table 6. Measurement errors of NO2 electrochemical sensors for different gas concentrations and deposition durations.
Sensor Measuring/ppmMeasurement Errors/%
0306090120150180
NO2 gas concentration/ppm00000000
102.60030.35049.80063.18067.78078.18089.490
202.24514.29522.95526.36533.86557.50075.075
302.2737.10320.70728.03033.41743.28347.527
400.7088.62312.82819.77327.02030.61837.223
500.8647.18211.53614.82824.21228.70834.718
600.6077.55012.97213.47726.42329.54536.658
700.5067.62614.86313.44123.60728.17434.487
800.9916.92516.08618.49821.55925.13938.189
900.3206.70615.06814.91624.17629.14135.623
1000.5618.01512.65716.66220.76824.03030.783
Data from experimental testing.
Table 7. Experimental measurement of NO2 electrochemical sensors for different humidity levels.
Sensor Measurement/ppmHumidity Level
25%RH50%RH75%RH98%RH
NO2 gas concentration/ppm00000
109.5389.5329.6479.727
2019.25119.40719.72519.891
3028.65029.12329.41429.379
4038.57138.78639.02539.449
5048.94649.09949.19749.446
6058.81858.19759.16759.217
7068.01068.61669.37969.488
8078.22779.06979.11879.808
9088.30088.71488.85289.537
10098.90698.49899.65599.828
Data obtained from experimental testing.
Table 8. Experimental measuring of NO2 electrochemical sensors at different humidity–coal fly ash deposition levels.
Sensor Measuring/ppm30 Days’ Deposition60 Days’ Deposition
25% RH50% RH75% RH98% RH25% RH50% RH75% RH98% RH
NO2 gas concentration/ppm000000000
105.4495.5305.8795.2834.813 4.692 4.187 4.005
2016.64115.88414.99514.61115.874 15.162 15.010 14.616
3024.82822.74222.17720.71223.192 22.268 22.232 22.010
4036.27335.43933.97028.57134.470 33.505 33.064 32.793
5046.34343.97541.04037.85443.672 41.793 40.066 39.081
6053.48551.38949.60149.55151.899 50.465 49.141 48.626
7064.50563.61662.68759.84861.803 61.581 60.793 59.520
8072.52571.64171.06667.26866.768 65.742 65.414 64.404
9082.51082.21782.13178.72776.455 75.192 73.212 72.990
10090.40489.72287.61684.86984.030 83.566 83.535 83.071
Data from experimental testing.
Disclaimer/Publisher’s Note: The statements, opinions and data contained in all publications are solely those of the individual author(s) and contributor(s) and not of MDPI and/or the editor(s). MDPI and/or the editor(s) disclaim responsibility for any injury to people or property resulting from any ideas, methods, instructions or products referred to in the content.

