Abstract
In Internet of Things-based smart grids, smart meters record and report a massive number of power consumption data at certain intervals to the data center of the utility for load monitoring and energy management. Energy theft is a big problem for smart meters and causes non-technical losses. Energy theft attacks can be launched by malicious consumers by compromising the smart meters to report manipulated consumption data for less billing. It is a global issue causing technical and financial damage to governments and operators. Deep learning-based techniques can effectively identify consumers involved in energy theft through power consumption data. In this study, a hybrid convolutional neural network (CNN)-based energy-theft-detection system is proposed to detect data-tampering cyber-attack vectors. CNN is a commonly employed method that automates the extraction of features and the classification process. We employed CNN for feature extraction and traditional machine learning algorithms for classification. In this work, honest data were obtained from a real dataset. Six attack vectors causing data tampering were utilized. Tampered data were synthetically generated through these attack vectors. Six separate datasets were created for each attack vector to design a specialized detector tailored for that specific attack. Additionally, a dataset containing all attack vectors was also generated for the purpose of designing a general detector. Furthermore, the imbalanced dataset problem was addressed through the application of the generative adversarial network (GAN) method. GAN was chosen due to its ability to generate new data closely resembling real data, and its application in this field has not been extensively explored. The data generated with GAN ensured better training for the hybrid CNN-based detector on honest and malicious consumption patterns. Finally, the results indicate that the proposed general detector could classify both honest and malicious users with satisfactory accuracy.
1. Introduction
The development of the Internet has enabled more effective and widespread use of Internet of Things (IoT) applications. IoT enables the connection of different objects to the Internet and the ability to communicate with devices in distant networks [1]. Critical infrastructures such as electricity grids have become IoT-based [2]. Electricity generation, transmission, distribution, and consumption processes have become more manageable in this way. IoT-based electricity systems are called the smart grid. The advanced metering infrastructure (AMI) is the communication network of smart grid applications [3]. The AMI carries sensitive information, making it a potential target for attackers. Due to the inherent vulnerabilities of communication networks, cyber-security emerges as a leading problem in smart grid systems [4].
The daily life of humankind depends on electricity and requires effective management. AMI helps this management by using control commands and real-time transmission of the data to utilities, customers, and third parties. Generally, an AMI system consists of smart meters, gateways, communication networks, and a headend system [5]. The most prominent component of AMI is smart meters. Smart meters increase the frequency of collection of energy consumption data, enabling advanced data analysis that was not possible before [6]. A smart meter records and transmits energy consumption of the customers at specific intervals for billing and management [7]. Unauthorized access to a smart meter may result in data tampering attacks called energy theft [8]. Energy theft is a significant challenge for smart grid applications as malicious actors continue to exploit potential vulnerabilities [9]. Unethical customers represent the highest probability of threats to the AMI and smart meters. In the past, energy theft mainly involved physical disruptions like cut-offs or damage. However, contemporary instances may encompass sophisticated attacker models, including erasing log events, false data injection (FDI) attacks, intercepting communication, and data manipulation [10].
Energy theft is a significant concern for utilities, and it has emerged as a global issue, resulting in technical and economic losses for operators and governments [11]. Deep learning (DL)-based models play a prominent role in the design of effective intrusion detection systems (IDSs). Such IDSs are used to identify abnormal activities such as FDI and data tampering [12]. Energy theft is an important issue that needs to be solved to improve smart grid applications. Also, information and communication technologies (ICTs) and correlated cyber-threats necessitate proactive measures. There are various studies on energy theft detection handling the consumption data to achieve a high detection rate (DR) and accurate results [13,14,15,16,17]. Many methods are used for energy theft detection, such as statistics, data mining, machine learning (ML), and DL techniques [18]. DL-based IDSs play a critical role in identifying energy theft attacks [19].
We focus on further investigating CNN-based architecture for energy theft detection within real smart meter consumption data. We also discuss balanced dataset generation, which is important to increase performance in DL with GAN. We proposed a CNN-based deterministic model to detect energy theft based on consumption patterns. The symptom state parameters were used to assess the likelihood of energy theft incidents. Our model monitors energy consumption patterns and performs with high accuracy in detecting maliciously changed data in experimental results. Also, it can learn normal/abnormal behaviors obtained from the consumption data of the smart meters and detect anomalies based on deviation from the probability.
Unpredictable attack vectors may be considered zero-day attacks [15]. We address the challenges posed by zero-day attacks and imbalanced data by generating synthetic attack datasets, leveraging the predictable nature of theft patterns. Extensive trials demonstrate a notable enhancement in the DR and the capability to detect various types of attacks. In addition to detecting a thief, the proposed IDSs can also precisely identify the time of the theft.
In this study, we employ a hybrid structure by combining CNN with shallow ML techniques to develop an energy theft detector. This hybrid approach is applied to the energy consumption dataset, addressing the classification problem and allowing us to exploit irregular and abnormal consumption patterns for energy theft detection. The hybrid structure includes CNN combined with Support Vector Machine (SVM), Random Forest (RF), Decision Tree (DT), k-Nearest Neighbors (KNN), and Logistic Regression (LR). CNN is used for feature extraction, while the other techniques are employed for classification.
1.1. Research Contributions
The main contributions of this paper can be summarized as follows:
- Data-driven energy theft detection solutions are reviewed for comparison. The results verify the effectiveness of the proposed approach.
- An integrated CNN-based architecture is used to tackle miss-classification and high False Positive Rate (FPR) issues.
- Real honest data are exposed to six attack vectors to create theft classes.
- GAN technique is used to eliminate the imbalanced data issue.
- To overcome the over-fitting problem, k-fold cross-validation technique is opted for.
- Six balanced datasets containing the characteristics of only one attack vector were created. Additionally, a single dataset combining these six attack vectors was designed. Thus, both attack-vector-specific solutions and a general solution have been proposed.
- The performance of the hybrid CNN-based model was evaluated by comparing it with other up-to-date approaches.
1.2. Organization of the Paper
This study emphasizes the importance of smart grid security, non-technical loss (NTL), the design of a CNN-based energy theft detector, and the generation of a balanced dataset. The structure of the remaining paper is as follows. Related works in the relevant literature are presented in Section 2. Next, Section 3 presents the dataset, attack vectors, and GAN methodology, along with a CNN-based hybrid approach. Then, Section 4 deals with the experimentation and the results of the proposed model, providing detailed insights into their outcomes and conducting a comparative analysis with other algorithms and studies. Finally, Section 5 provides a conclusion after performing the experiments in this paper and presents future work.
2. Related Works
Many vulnerabilities inherited from communication networks exist in AMI. The basic requirements of cyber-security are availability, integrity, and confidentiality [20]. In this study, we have examined data tampering attacks specifically designed to undermine the integrity of consumption data. We aimed to detect attack vectors that reduce smart meter readings. DL-based IDSs have provided high accuracy in detecting these attack vectors in the literature [21].
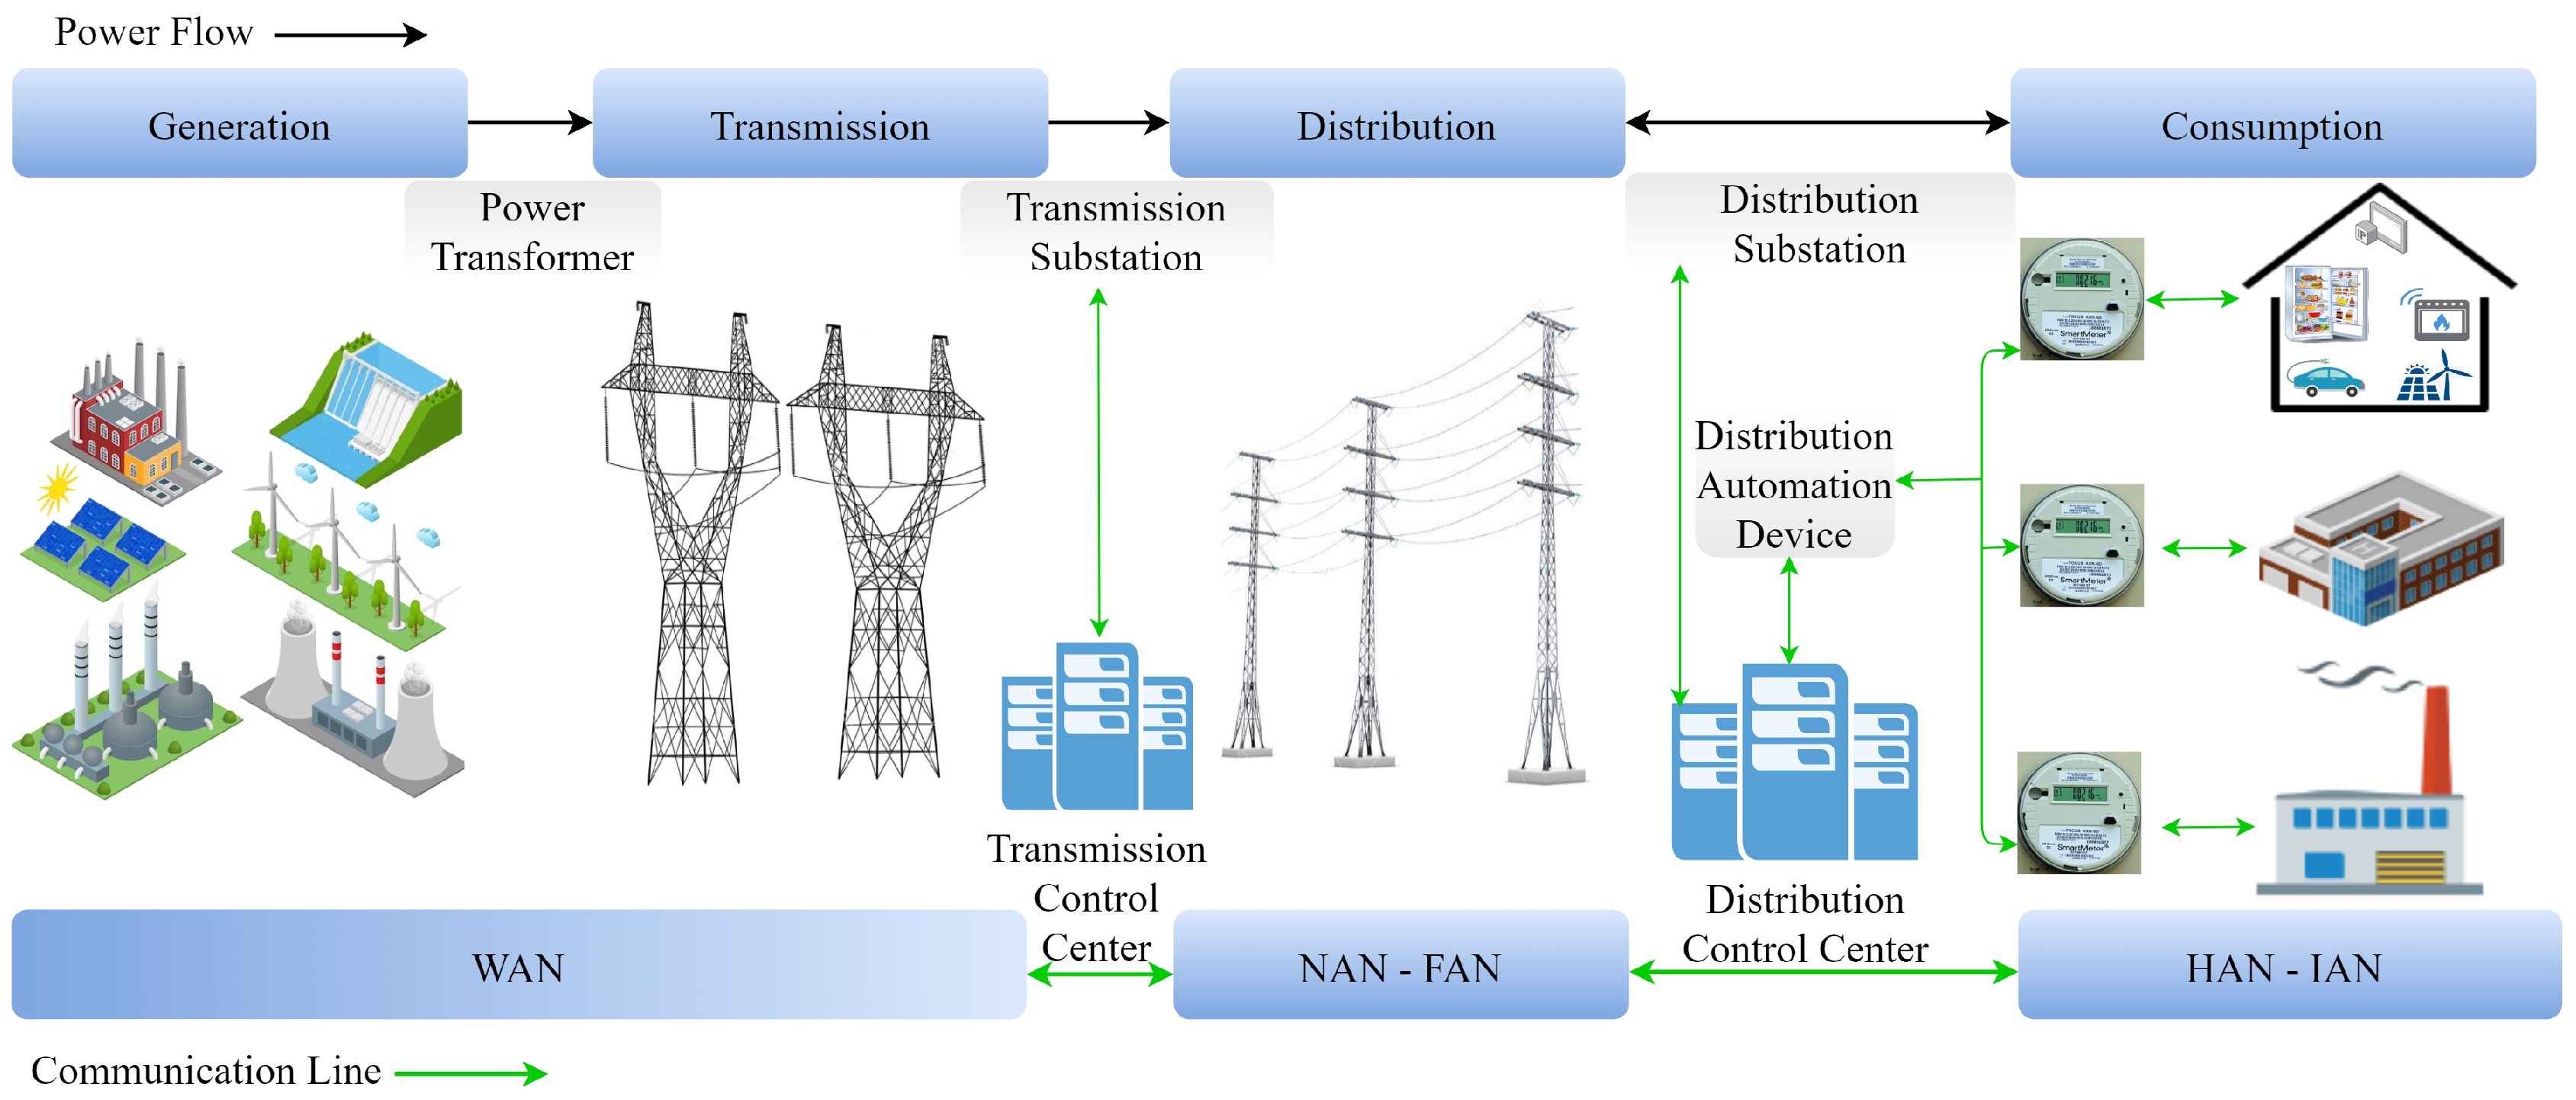
Understanding the data flow in smart grid applications is significant, and this can be achieved by examining their general structure. The overall structure of the smart grid environment is shown in Figure 1. Energy generated from diverse sources is transmitted over long distances through transmission lines and distributed to consumers via distribution lines. Data transmission is provided through AMI in the context of the energy infrastructure. While the Wide Area Network (WAN) is used in generation and transmission domains, the Neighborhood Area Network (NAN) and Field Area Network (FAN) are used in the distribution domain. Lastly, the Home Area Network (HAN) and Industrial Area Network (IAN) are used in the consumption domain.
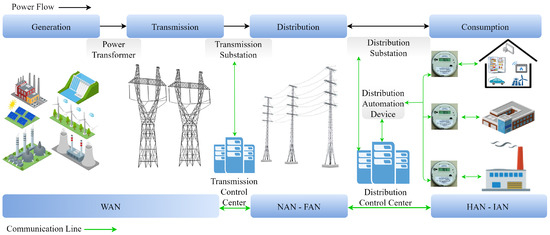
Figure 1.
Overall structure of the smart grid environment [20].
Energy theft detection in smart grids has been an active research area in recent years. The literature has introduced various strategies for detecting energy theft. These strategies include state estimation, game theory, and data-driven strategies. Data-driven strategies [22] are more prevalent due to their scalability for handling large systems and their cost-effectiveness in computational resources. Statistics, data mining, ML, and DL are among the prominent data-driven methods extensively employed to extract knowledge from consumption patterns, enabling inferential assessments. While detecting NTLs involves challenges, smart meters allow the extensive storage of energy data, enabling various analytical approaches. This has led to the development of various classification techniques.
In this section, we critically reviewed notable studies on energy theft detection that utilize smart meter consumption data to identify potential attack vectors and malicious customers. Due to their higher performance, we focused on the ML and DL approaches.
Jokar et al. [23] propose an energy theft detector within AMI based on consumption patterns, utilizing the SVM approach. The detector enhances the classification accuracy to 94%. Moreover, it addresses a range of cyber-attack vectors associated with energy theft, and these are widely acknowledged in the literature. The authors of [24] introduced a two-step energy-theft-detection system utilizing DT and SVM, achieving an accuracy of 92.5%. However, there is no information on whether the dataset is balanced or imbalanced. The researchers in [25] present an energy-theft-detection method utilizing ensemble ML models. The concept behind the models involves combining various ML methodologies into a unified predictive model to increase DR and decrease the error rate. The results indicate that a bagging-type ensemble ML approach, which aggregates the outcomes of independent ML models in parallel through averaging, outperforms a boosting approach. However, when compared to other approaches, the recommended model has not demonstrated better success.
Despite the absence of a real dataset in [26], notable achievements in performance were attained through the application of a neural network. They achieved an overall DR of 93%. The authors of [27] have devised a novel approach for identifying and detecting energy theft within distribution systems, employing the multilayer perceptron artificial neural network (MP- ANN). They achieved a successful differentiation between malicious and honest users, averaging a detection rate of 93.4%. However, there is no information on whether the dataset is balanced or imbalanced. In [28], a hybrid deep neural network (DNN) approach is proposed. The gated recurrent unit (GRU) technique was used, which is an evolved variant of LSTM belonging to the category of recurrent neural networks (RNNs). The hybrid DNN combines CNN, GRU, and particle swarm optimization (PSO). However, when compared to other approaches, the recommended hybrid model has not quite demonstrated better accuracy, and the proposed model tends to overfit. The work referenced as [29] employed a deep RNN classifier using GRU to catch temporal correlations within individual customer load profiles, thereby introducing a detector with a DR reaching up to 93%. However, it is not clear whether the dataset is balanced or imbalanced. In [30], the authors present a CNN model to detect energy theft, utilizing the State Grid Corporation of China (SGCC) dataset. They illustrate energy consumption over four weeks for randomly selected honest and malicious consumers. Initially, consumption is displayed by dates and later by weeks. Date-based representation fails to differentiate between honest users and thieves, but the weekly representation distinguishes them. Honest consumers show periodic energy usage, while the thieves display less periodicity. However, there is no information on whether the dataset is balanced or imbalanced. The researchers in [31] presented a hybrid model on energy consumption patterns to detect energy theft with CNN and long short-term memory (LSTM), using the SGCC dataset. The CNN autonomously identified and categorized features, whereas the LSTM managed the sequential nature of the time-based data. The authors solved the imbalanced dataset problem by applying the synthetic minority over-sampling technique (SMOTE) method to augment the NTL class, equalizing it with honest customer counts. While achieving an 89% accuracy, the model demonstrated a lower DR of nearly 87%. Compared to other approaches, the recommended hybrid model has not demonstrated better accuracy. Adil et al. [32] used the CNN-LSTM approach on the SGCC dataset and achieved 87.9% accuracy. However, compared to other approaches, the proposed model is not very satisfactory. Kocaman and Tümen [33] introduced an LSTM classifier for identifying malicious customers. They utilize data selection, normalization, and weight updating as preprocessing steps. The LSTM classifier architecture comprises LSTM cells, dropout layers, activation functions, and a softmax classifier. Evaluation involves precision, accuracy, and recall metrics for assessing model performance. However, it is unclear how they resolved the issue of the imbalanced dataset.
The authors in [34] used the Irish Social Science Data Archive (ISSDA) dataset. They employed cluster-based algorithms, specifically the fuzzy Gustafson–Kessel and fuzzy c-means, achieving a 74.1% area under the curve (AUC). However, they achieved low true positive rate (TPR) and high FPR, which are 63.6% and 24.3%, respectively. Lastly, the authors of [35] describe an energy-theft-detection method using data about power provider system consumption at the edge. Centralized data centers employ K-means clustering and DNN to extract features. CNN refines daily, weekly, and monthly patterns. RF at the edge data center classifies the characteristics, speeding up the edge computing processing. This approach is more accurate and computationally efficient than previous methods, making it suitable for edge data centers.
Approaches using only traditional ML models often face challenges in extracting distinct consumption patterns due to the complex structure of power consumption data. This situation leads to low performance and accuracy. On the other hand, DL models can better explore complex structures, thus achieving higher success than ML models. Table 1 summarizes prominent ML- and DL-based approaches for developing energy theft detectors.

Table 1.
Literature overview on energy theft detection based on consumption data.
Glancing at these noteworthy works, we studied novel CNN-based hybrid models for energy theft detection and proposed a CNN-based deterministic model to detect energy theft based on consumption patterns. CNN automatically captures the distinct features of consumption behaviors from the data. It is very important for the effectiveness of energy-theft-detection models. We conducted a comparative analysis using ML and sigmoid classifiers to detect consumption patterns based on extracted features, aiming to enhance detection performance. Hybrid solutions using both CNN and traditional ML methods have been observed to achieve higher TPR and lower FPR compared to pure DL solutions. Our hybrid structure achieves a higher accuracy performance rate of up to 96% compared to existing models. On the other hand, the data-balancing process is an inherently hard mission, and working with imbalanced data typically reduces the performance of the model. While the literature generally works on imbalanced datasets, our study addresses this challenge using GAN.
3. Materials and Methods
Consumption data obtained from the ISSDA dataset were subjected to data analysis and preprocessing. Malicious synthetic data were generated by exposing the real data to the attack vectors. Real and malicious data were aggregated, and the prepared datasets were used to train the proposed models. In this section, the ISSDA dataset, data analysis and preprocessing processes, attack vectors, and recommended hybrid CNN-based approaches are presented. Additionally, the GAN method used in generating synthetic data is presented.
3.1. Dataset
The dataset, released by ISSDA [44] in January 2012, comprises electricity consumption data from over 5000 Irish residential and enterprise consumers during 2009 and 2010 in kWh for 536 days. A vector of 48 readings was used to explain the everyday usage of a consumer. This dataset, presenting a lot of samples from diverse consumers, serves as an excellent resource for research in smart meter data analysis. The dataset contains only honest profiles and reports the consumed real power data at a rate of 30 min. The daily load profile of a customer is . The dataset is scalar.
One of the challenges faced by this research is the absence of malicious data needed to train the models. Applying the attack vectors described in the next section on the real dataset solved this problem. We obtained balanced datasets to ensure the accuracy of the proposed models. After data analysis, 2104 samples were selected from the ISSDA dataset.
The class distribution in a dataset associated with a classification problem should be balanced; otherwise, it leads to an imbalanced data problem. When classes exhibit significant numerical differences, it constitutes an imbalanced data issue. The issue prevents the effective training of ML models. Furthermore, it can adversely affect the generalizability of the model and performance.
The dataset denoted as H consists of 2104 samples representing honest data. When the H dataset was exposed to the attack, a final dataset was created containing 4208 samples. The final dataset includes a balanced number of both honest and malicious samples. The same scenario holds for the other five attack vectors. These six different datasets were used only in training the proposed approaches to detect the relevant attack vector. Furthermore, we aimed to design a more comprehensive IDS. So we generated a dataset containing all attack vectors along with the H dataset. The dataset is structured as . As observed, there is an imbalanced data problem since the number of H samples is 2104 and the number of attack vector samples is 6 × 2104. The imbalanced data problem was solved using the GAN approach. After that, we call the obtained dataset as the “hybrid dataset”. To the best of our knowledge, there are limited studies that solve imbalanced data problems with GAN in the energy-theft-detection field [45].
Data analysis and data preprocessing are some of the most important steps that affect the accuracy of the system. Data preprocessing refers to transforming the initial data into a standard format. It has three major phases: data cleaning, data standardization, and feature engineering. Data cleaning is the discovery of faults or null values in the dataset. Data standardization is the detection of outliers in the dataset and transforming them into acceptable types using scaling ways. We do not use data standardization because our consumption data do not have outliers. The feature engineering process is used to extract major features [46]. Since our dataset has limited attributes (SMID, readings (kWh), and output), there is no need for a feature engineering process.
Data Analysis and Cleaning: To design a general IDS capable of detecting malicious activities among residential consumers, a specific range of consumption values was chosen for the samples. Industrial users and small/medium-sized enterprises were eliminated to ensure a more normal distribution. So consumers were filtered as residential users. Consumers with missing data were not used as samples. To prevent over-fitting and under-fitting, users whose consumption data are zero for a very long time are eliminated. Therefore, every consumption data point in 30 min is chosen between kWh and 7 kWh. Consumers with a total consumption data between 536 kWh and 12,000 kWh for 536 days were selected as the samples. Additionally, consumers with missing data in the 536 days were not selected. As a result, data from 2104 customers were analyzed. A matrix of size 536 × 48 was created for each customer. The input data were given to the CNN network. Therefore, the choice of input data form in image processing [47] contributed to achieving high accuracy.
3.2. Attack Vectors
The implementation of smart meters and the integration of a cyber layer into the metering system have introduced novel attack vectors for energy theft. The main purpose of attack vectors is to reduce the bill. Theft samples rarely exist or do not exist for customers. Therefore, obtaining a real dataset with malicious samples to design an energy theft detector is a challenge.
Along with their versions, the six attack vectors proposed by Jokar et al. are remarkably well accepted in the literature [23]. We applied six attack vectors on honest consumption data. The formulation of attack vectors is given in Table 2. Each honest half-hourly reading is represented as . X represents all 536 days of a consumer’s readings as 1D and is presented as . Attack vectors are represented as . and are randomly generated numbers between and . In the literature, a common approach to prevent consumption data from dropping to zero and remaining unchanged is by generating random values for parameters and within the specified range of 0.1 to 0.8 [23].
Table 2.
Mathematical representation of cyber attack vectors.
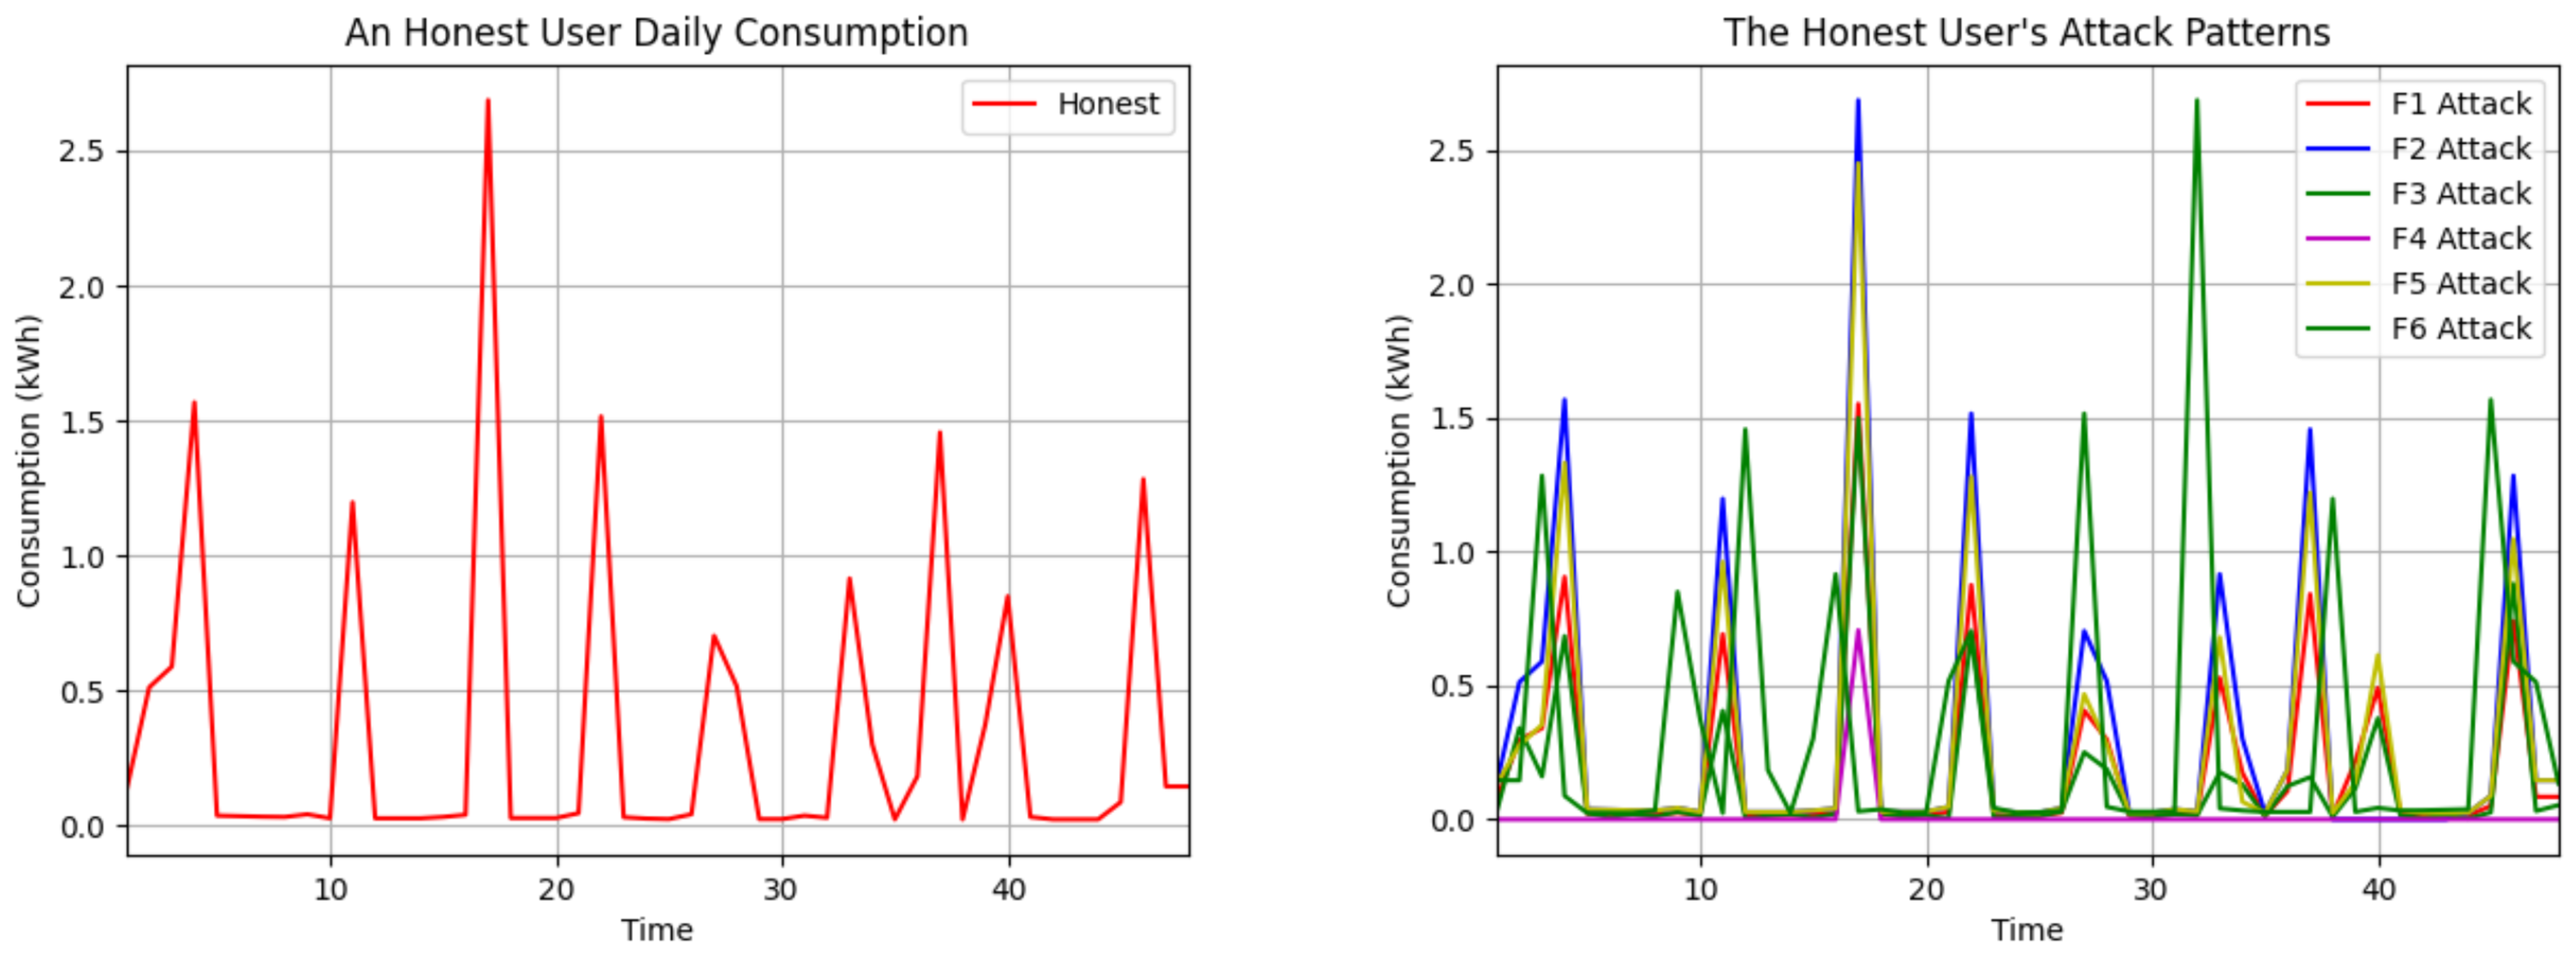
The attack multiplies all consumption readings by the same randomly chosen value . The attack assigns zero to certain time interval readings of the day, and the others remain the same actual value. We chose the time period between 38 and 43 due to the peak electricity consumption during the evening hours. The attack multiplies each meter reading by a distinct random value . The attack generates a random number between 0.1 and the max consumption value of each user. It subtracts this result from each reading for that customer. If the result value is negative, it is set to 0; if it is positive, the difference is written. The attack subtracts the mean of all consumption data of each consumer from each reading. If the result is greater than or equal to 0, the difference is written; otherwise, the consumption data remain the same. The attack reverses the order of each customer’s readings daily. Although the total consumption remains constant, the reporting of intensive usage is shifted to low-tariff periods. The impact of the six attack vectors on the daily use of an honest customer is shown in Figure 2.
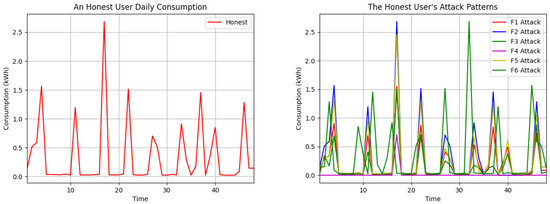
Figure 2.
Visualization of mentioned attack vectors in the daily consumption data of an honest user.
Our CNN-based approach is designed to detect anomalies within consumption patterns. Considering that every attack leads to the manipulation of meter readings, our CNN-based approach effectively detects all presented attack vectors. Furthermore, we solved the imbalanced data problem for hybrid dataset using the GAN approach described below.
Since there were fewer real samples in the mentioned honest dataset, we used GAN to produce honest samples. A GAN consists of a generator neural network and a discriminator neural network. The aim is for the generator to create synthetic data that are indistinguishable from real data, while the discriminator aims to correctly differentiate between real and synthetic data [48].
The G component maps a latent noise vector z to a synthetic honest sample. aims to produce synthetic honest samples. represents the generated synthetic honest sample.
The D component distinguishes between real honest samples and synthetic ones. represents the probability that x is a real honest sample. represents the probability that the generated instance is a real honest sample.
The objective function for the generator G and discriminator D in the context of honest sample generation can be represented as
Here, is the distribution of real honest samples. is the prior noise distribution of z. represents the expected value. x represents a real honest sample. z represents a noise vector. generates a synthetic honest sample. is the output of the discriminator for real honest samples. is the output of discriminator for synthetic honest samples.
Similar to the standard GAN setup, the objective is for the generator G to minimize the probability of the discriminator D to correctly distinguish between real and synthetic honest samples, while the discriminator aims to maximize this probability.
By training the GAN iteratively, the generator learns to produce synthetic honest samples that capture the characteristics of honest data, contributing to the mitigation of imbalanced datasets in energy theft detection.
3.3. The Novel CNN-Based Hybrid Approach
Confidentiality, integrity, and availability are the key elements of information security. Energy theft attacks target the integrity of data. In this section, our goal is to create a top-tier classifier capable of identifying cyber-attacks aimed at compromising the integrity of the readings. The design of this detector relies on CNN, enabling the capture of complex patterns within the data. We utilized the empirical method for the selection of parameters. The SVM, RF, DT, KNN and LR algorithms were used with CNN for classification.
We tested the performance of the proposed model on real data of 2104 customers against six attack vectors of energy theft. We have compared each attack vector and obtained the most successful hybrid model for that attack. This paper presents a robust model for NTL detection in a smart grid using a CNN-based approach.
The architecture of the proposed CNN-based model is shown in Figure 3. The main structure of our CNN model is given as follows:
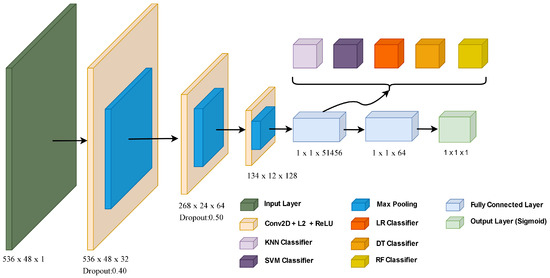
Figure 3.
The architecture of the proposed CNN-based model.
Convolution layers are used to learn feature representation of data. Also, convolution filters provide noise reduction. Filters are used to reduce network size. Thus, lower computational complexity is provided. Our CNN model is designed using an input layer, 3 convolution layers, 3 max-pooling layers, 2 dropout layers, 2 fully connected layers, and an output layer. The architecture of hybrid CNN-based model accepts consumption data with a size of 536 by 48 in the input layer. The activation function and L2 regularization layers were preferred to prevent over-fitting in the convolution layer. There are max-pooling layers from each convolution layer. After the max-pooling process, dropout is applied. Feature maps in the first fully connected layer were classified with ML algorithms. In addition, feature vectors for the pure CNN model were classified by giving them to the sigmoid activation function in the output layer.
The relevant equations of the operations are explained below. Convolution blocks are connected to the max-pooling layers. The mathematical output of the convolution layers is stated as
where and ∗ show the activation function and convolution operation, respectively. and show learnable parameters in the f-th feature filter. Dropout layers are located between two convolution layers. These layers provide dimensional reduction by reducing the number of parameters. Generally, the min-pooling and max-pooling approaches are used for this aim. Our CNN model uses max-pooling. This operation generates more efficient results. The mathematical definition of this operation is expressed as
where M and m indicate a set of activations and the index of activations in the pooling window, respectively. After the dropout layer, a fully connected layer is applied for flattening feature maps into one feature vector as follows:
where and show the weight and bias of the l-th layer. We used the sigmoid classifier for the output layer in the CNN. An example is a CNN that uses the RF classifier defined as
where is the sigmoid function. It maps malicious values to 0 and honest values to 1.
A CNN-based IDS can identify data that deviate from expected patterns, assuming that the patterns of energy theft differ from those of honest users. Achieving high accuracy and DR in anomaly detection models includes selecting proper activation functions or optimizing parameters.
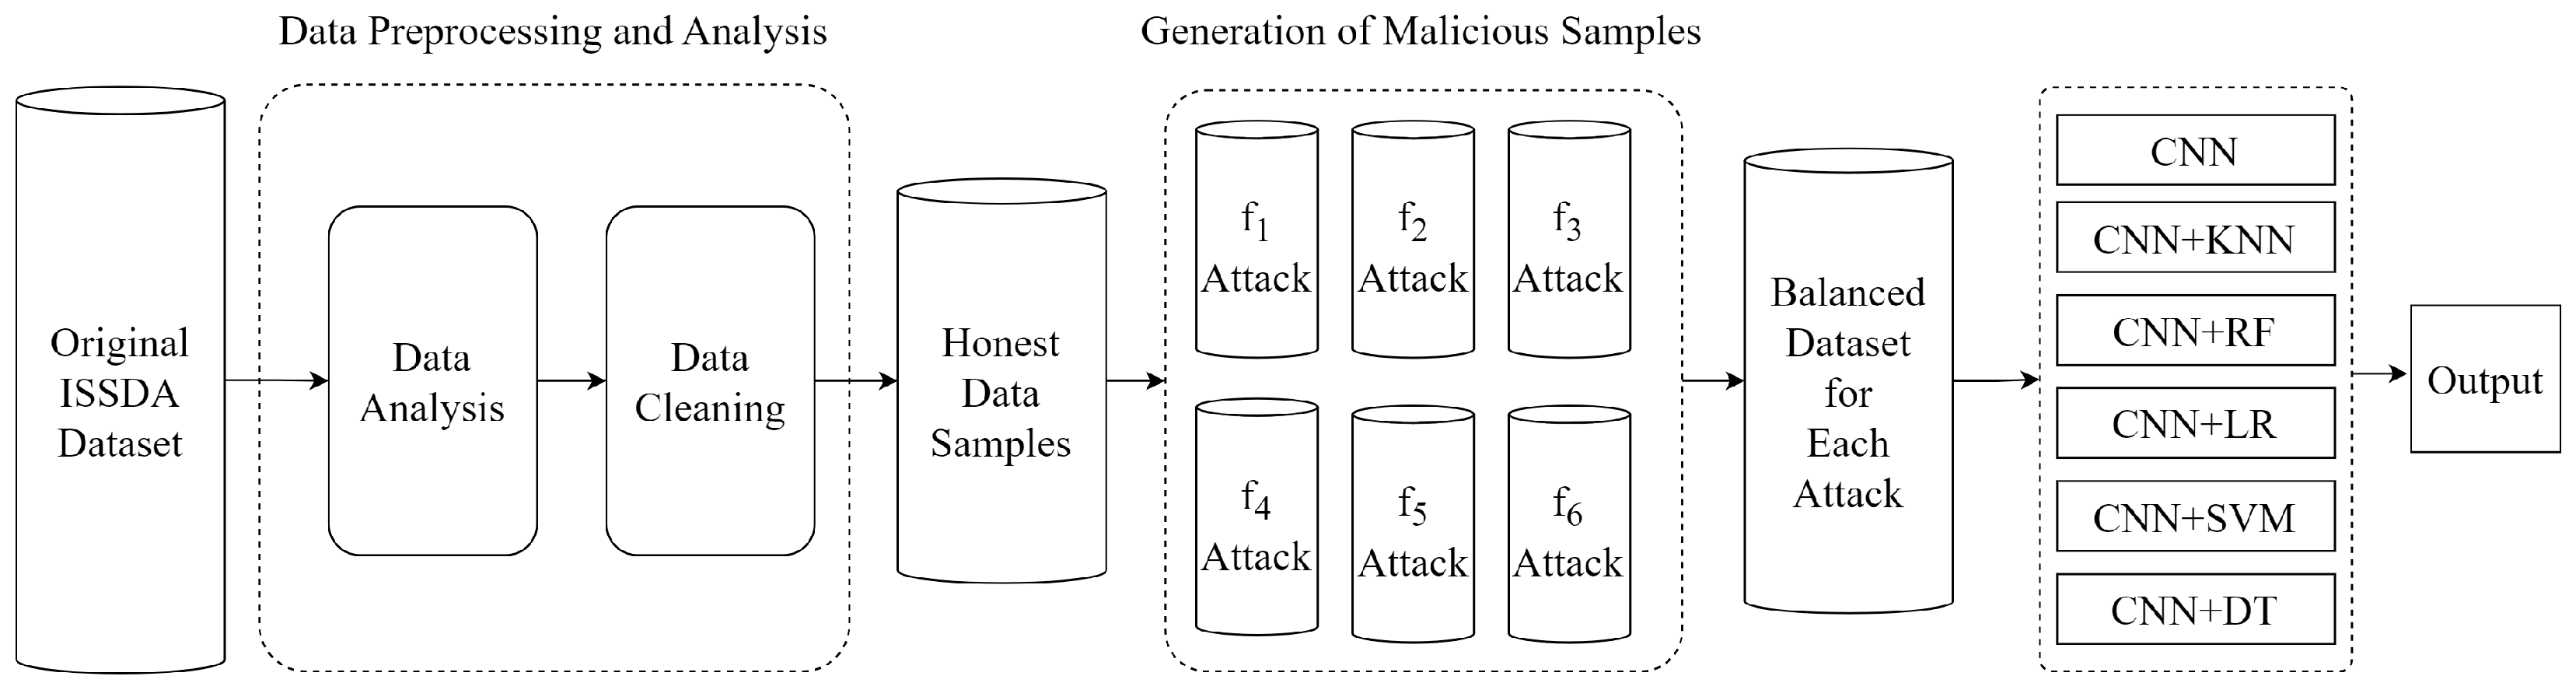
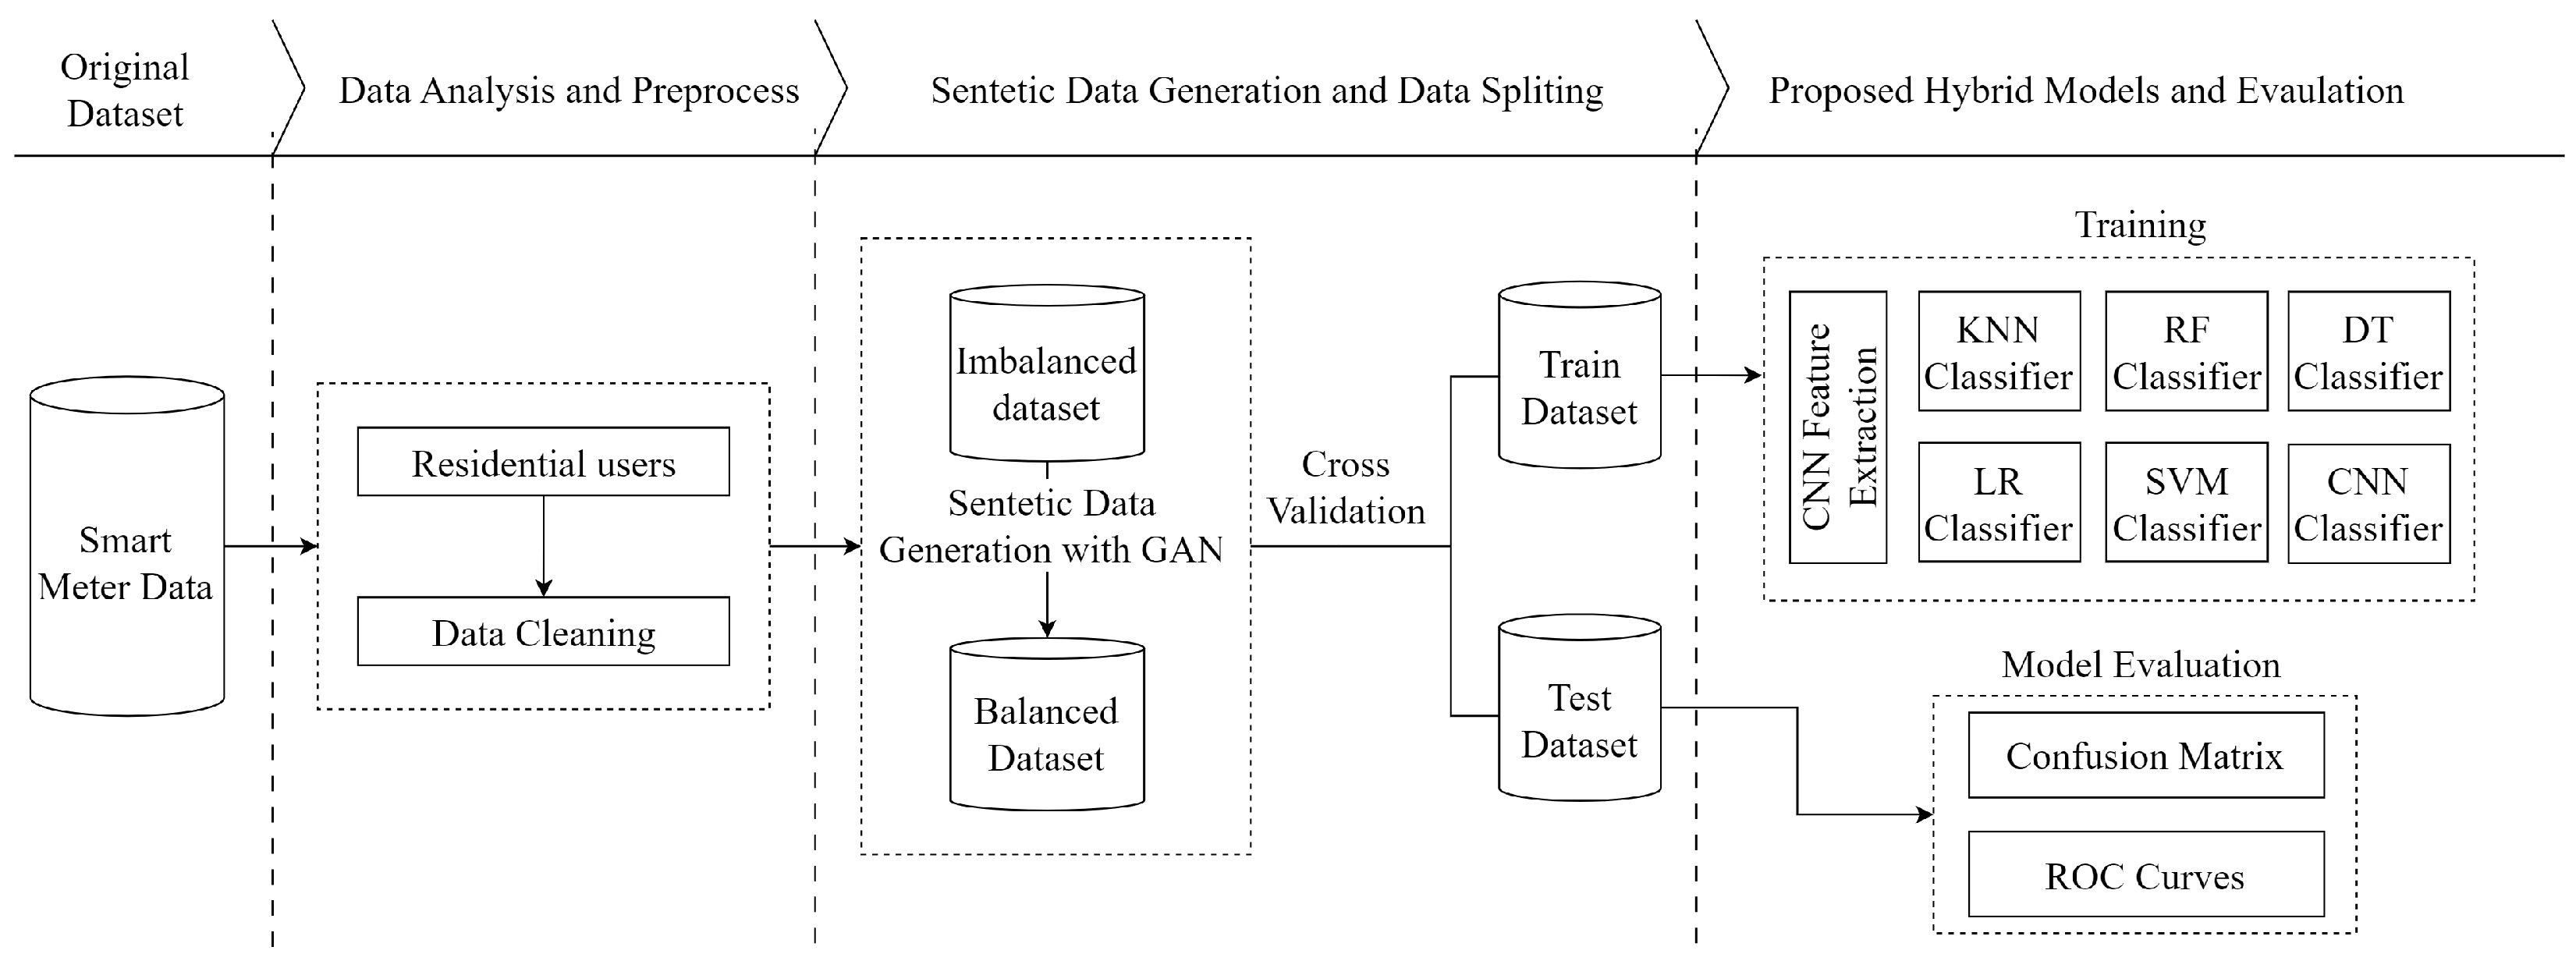
Hybrid models are significant approaches for achieving high accuracy and DR in energy theft detection. In our study, we focused on individually detecting each attack vector. Additionally, we achieved high DR of all six attack vectors when they were collectively present in the hybrid dataset. We show these different situations in two flow charts. The overall flowchart is presented for individual attack vectors in Figure 4. Moreover, the overall flowchart is presented for the combined set of all attack vectors in Figure 5.
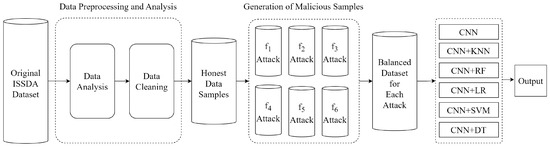
Figure 4.
Flowchart of energy theft detection for each attack vector.
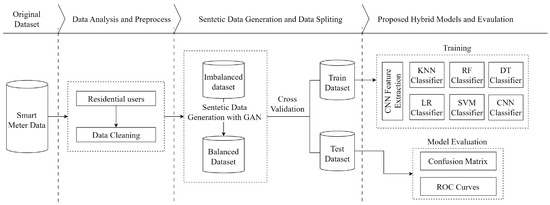
Figure 5.
Flowchart of energy theft detection for all attack vectors.
Figure 4 shows the NTL flowchart of the proposed model for each attack vector. Firstly, the dataset obtained from ISSDA was subjected to preprocessing by performing data analysis and cleaning. The obtained honest samples were exposed to each f attack vector separately, and six balanced datasets were obtained. Five CNN-based ML models and a pure CNN model were employed to classify users as honest or malicious. Each CNN-based model was trained and tested on these balanced datasets. Finally, the performance of the models was compared.
Figure 5 shows the NTL energy theft detection for all attacks collectively. Firstly, datasets for the six attack vectors were generated from the honest dataset. Afterward, the honest dataset was augmented nearly sixfold using GAN to solve the imbalanced data problem. Then, the honest dataset and the datasets containing f attacks were combined. A five-fold cross-validation technique is used to prevent over-fitting. The obtained dataset samples were classified as honest or malicious by CNN-based classifiers. Model performances were evaluated using the confusion matrix and receiver operating characteristic (ROC) curves. Finally, the models were compared.
As a result, the materials and methods employed in this study serve as the foundation for our experimental framework, ensuring rigorous data collection, preprocessing, and model implementation. The careful selection of datasets, the application of advanced algorithms, and the systematic validation processes collectively supported the credibility and reliability of our results. The utilization of state-of-the-art methods and the adherence to standardized protocols underscored the robustness of our experimental setup, facilitating a comprehensive analysis of the research objectives.
4. Results
Some of the experimental studies were conducted using an A5000 with 24 GB GPU and 128 GB RAM. Additionally, the data preprocessing and training processes utilized a V100 GPU with 50 GB RAM through Google Colab Pro. The Python 3.10 programming language and the TensorFlow and Scikit-learn libraries were employed. The hyperparameters for the designed models were set as follows: epoch value 100, batch size value 64, optimizer SGD, learning rate 0.01, L2 regularization rate 0.001, and binary cross-entropy as the loss function.
4.1. Training and Testing
The dataset was subjected to certain analysis and preprocessing. As a result of the processing, the generated datasets contain the electricity consumption data of 2104 honest and 2104 malicious customers within 536 days with half-hour intervals. The datasets were divided using a five-fold cross-validation technique into training and testing sets. Malicious ones were generated synthetically. It is demanding to extract features based on experience from the 1D electricity consumption data since daily consumption fluctuates in a relatively independent way. Thus, we designed a CNN solution to process the electricity consumption data in a 2D manner. We defined 2D data as a matrix of actual energy consumption values for a specific customer, where the rows of the matrix represent days as and columns represent the time periods as . The feature maps from the fully connected layer were utilized as inputs for ML algorithms. Furthermore, classification was carried out using the sigmoid function in the output layer of the CNN.
Consumption habits of customers can vary due to several non-malicious factors. These variations can be temporary, periodic, or permanent, potentially leading to false positive outcomes. Short-term changes may result from unusual behaviors, such as hosting an event that lasts more than a day or two. Such examples are included in training and testing datasets to mitigate this issue.
A DL-based architecture requires large amounts of data. In this study, datasets were generated with large amounts of data in order to train the proposed CNN architecture correctly. The number of samples in the datasets is presented in Table 3.
Table 3.
Generated datasets with f attacks.
4.2. Evaluation Metrics
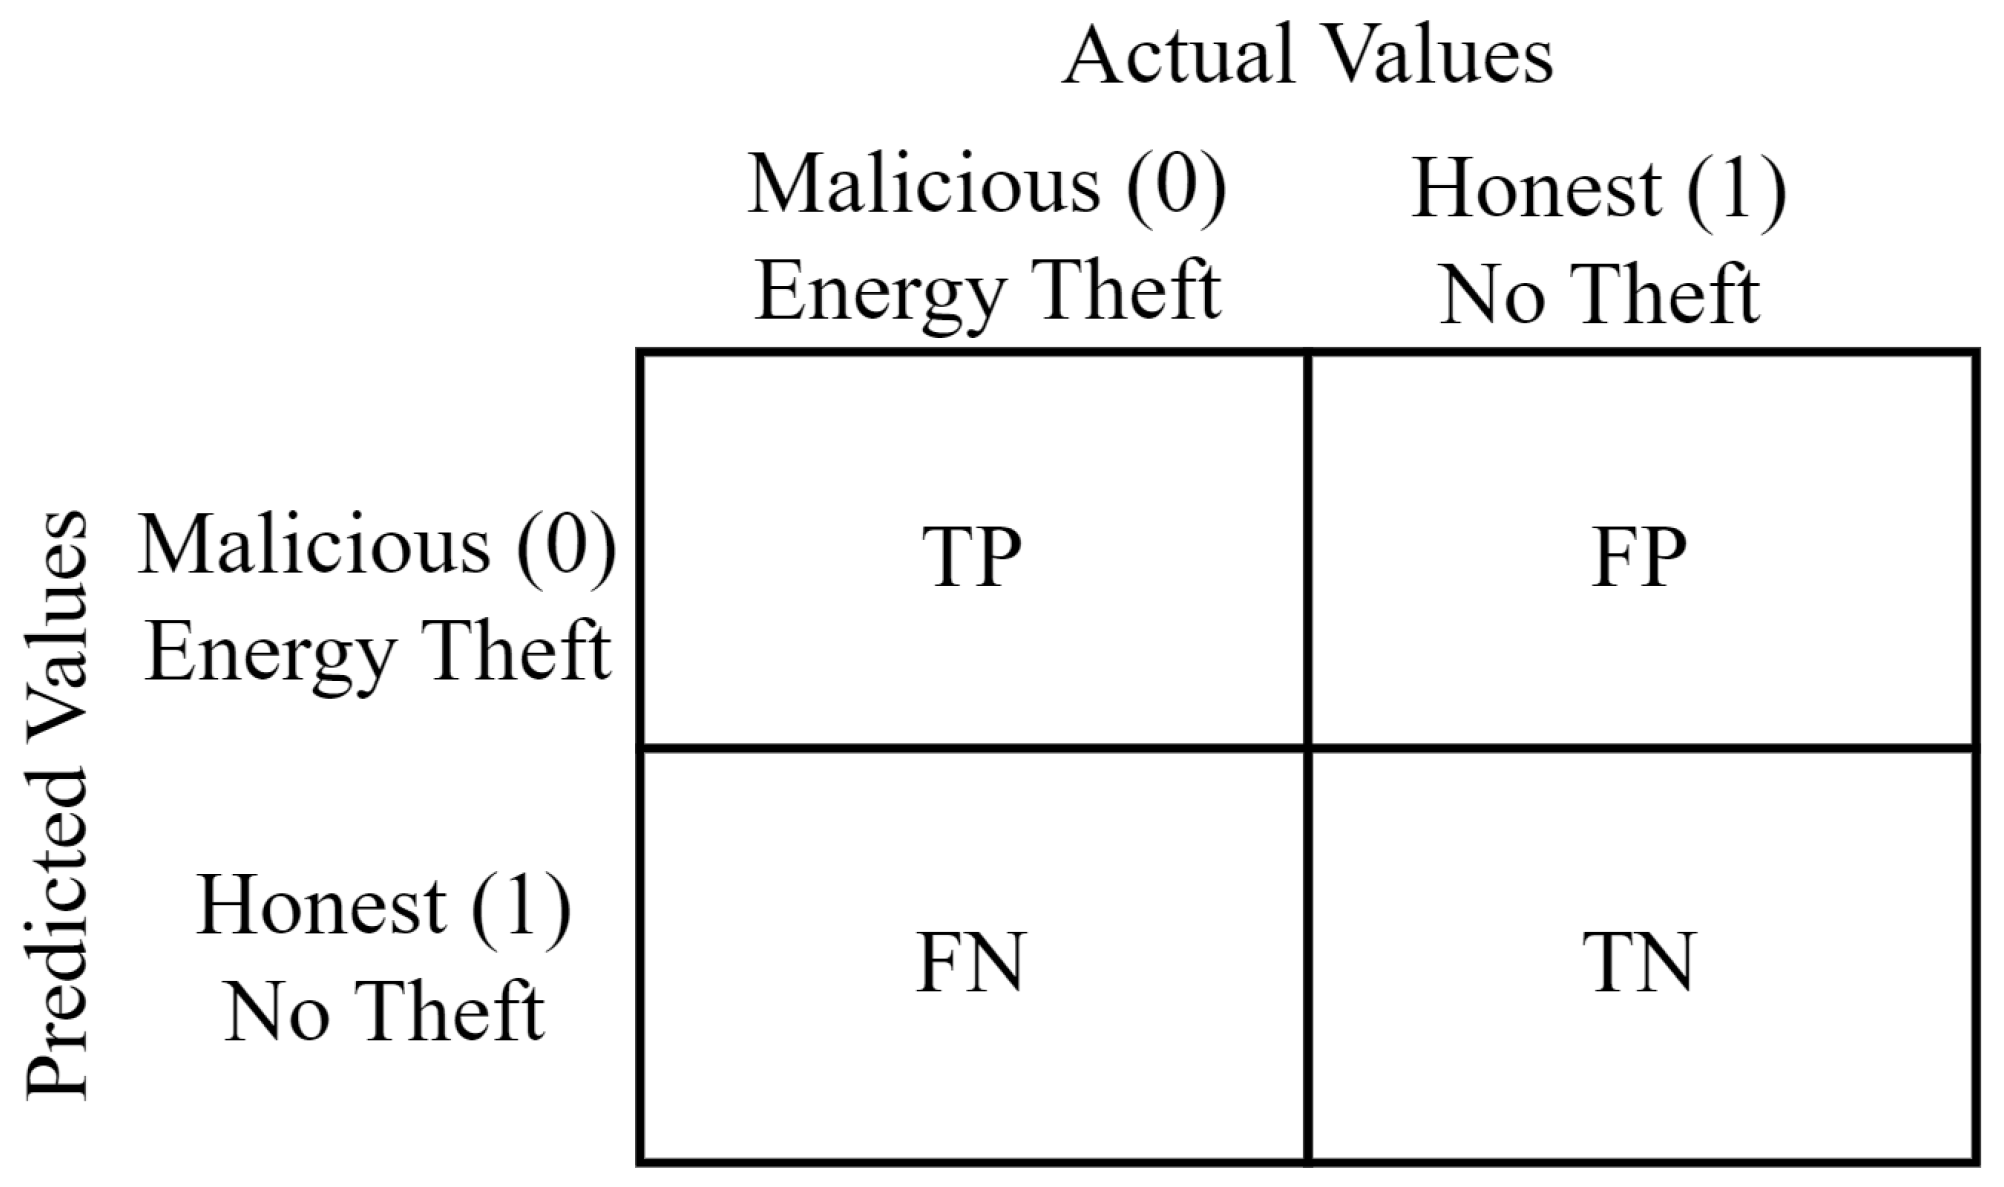
In this section, the metrics used to evaluate the performance of the proposed energy-theft-detection models are mentioned. The confusion matrix was used in the performance analysis of the developed models. The confusion matrix is a prominent structure for addressing the classification performances of the models [49].
The confusion matrix divides the entire dataset into True Positive (TP), False Positive (FP), False Negative (FN), and True Negative (TN). TP represents positives correctly predicted as positives. FP represents negatives incorrectly predicted as positives. FN represents positives incorrectly predicted as negatives. TN represents negatives correctly predicted as negatives [50]. The structure of the confusion matrix is presented in Figure 6.

Figure 6.
Confusion matrix utilized in energy theft detection.
The performance of the proposed approach on six different classifiers was tested using the accuracy, precision, specificity, TPR, FPR, and F1-score. Moreover, the Highest Difference (HD) is defined as the difference between the TPR and FPR. Additionally, Recall, sensitivity, TPR, and DR refer to the same metric. Also, FPR and False Alarm (FA) generally refer to the same metric in these studies. Since all of these concepts are used in these studies, we have presented them to avoid conceptual confusion. The metrics defined to evaluate the performance of the models are presented in Table 4.
Table 4.
Performance metrics obtained from the confusion matrix.
The ROC curve is an another significant performance metric for evaluating binary classification models. ROC curves depict the trade-off between TPR and FPR. As the discrimination threshold of a binary classifier varies, the TPR and FPR change consistently. The track of (FPR, TPR) is a curve connecting (0, 0) and (1, 1). The AUC metric is used in evaluating classification models by measuring the area under the ROC curve. A higher AUC indicates better overall performance. The AUC metric is commonly used to compare different models or to select the best-performing model among several candidates for a particular classification task.
Each metric offers insights into different aspects of a model’s performance and helps in understanding its strengths and weaknesses in making predictions in binary classification tasks. Accuracy gives an overall view. Focusing on accuracy, precision, recall, F1-score, and AUC can offer a comprehensive understanding of the model’s effectiveness in balanced datasets. When dealing with imbalanced datasets precision, recall, F1-score, and AUC offer a better insight. It was observed that performance metrics were chosen differently in many studies examined within the scope of this study. In general, it has been observed that the overall performance of the model is better when accuracy, DR, and HD are high and FPR is low.
4.3. Evaluation of the CNN-Based Models
The overall detection performances were tested for each attack vector, as well as for the hybrid dataset encompassing various attack vectors. Evaluation metrics were presented for each algorithm. The performance of algorithms varied across different attack scenarios and balanced datasets. We used five-fold cross validation and presented the mean of the folds with standard deviation in the tables. SVM, LR, RF, KNN, DT algorithms were used with CNN for classification. In order to determine the best CNN-based model, a comparative analysis was performed. Since our hybrid models work on balanced datasets, the accuracy, DR, F1-score metrics stand out in terms of evaluating the prominent performance metrics.
The performance metrics of the models and datasets with a single attack vector are given in Table 5. While the all models were generally effective in detecting all attack vectors, they performed poorly for #5. It was found that #2, #3, #4, #5 and #6 were detected with 99.81%, 98.04%, 99.48%, 81.42%, and 98.53% DR, respectively, using a CNN+RF model, and #1 was detected with a DR of 96.14% by CNN+LR. The CNN+RF model nearly obtained the best accuracy up to 99.83% except for #1. It closely followed by the CNN+LR up to 99.67%. The standard deviation values of the folds are generally close to each other, except for CNN, and are between ±0.12 and ±1.85. The results show that the proposed model can detect different attacks with high DR. It can also be seen that the detection in #5 is low. A possible reason for the lower performance of #5 could include differences in training data of the intrinsic property of zero overall theft.
Table 5.
All evaluation results of the CNN-based models for each f attack.
The evaluation of our CNN-based model involves training on a hybrid dataset encompassing various attack types and subsequently testing it on different data comprising new users not present in the training set. Table 6 illustrates the performance of models within this particular scenario. Notably, the CNN+LR classifier demonstrated the highest accuracy, DR, and F1-score. This classifier achieved 95.34% accuracy and 95.01% DR while maintaining a low FPR of only 4.32%. Promising results indicate the effectiveness of our model in detecting thefts from new users by relying on historical data. It shows that the general performance of the model is promising according to the metrics.
Table 6.
Performance metrics of the proposed CNN-based models for the hybrid dataset.
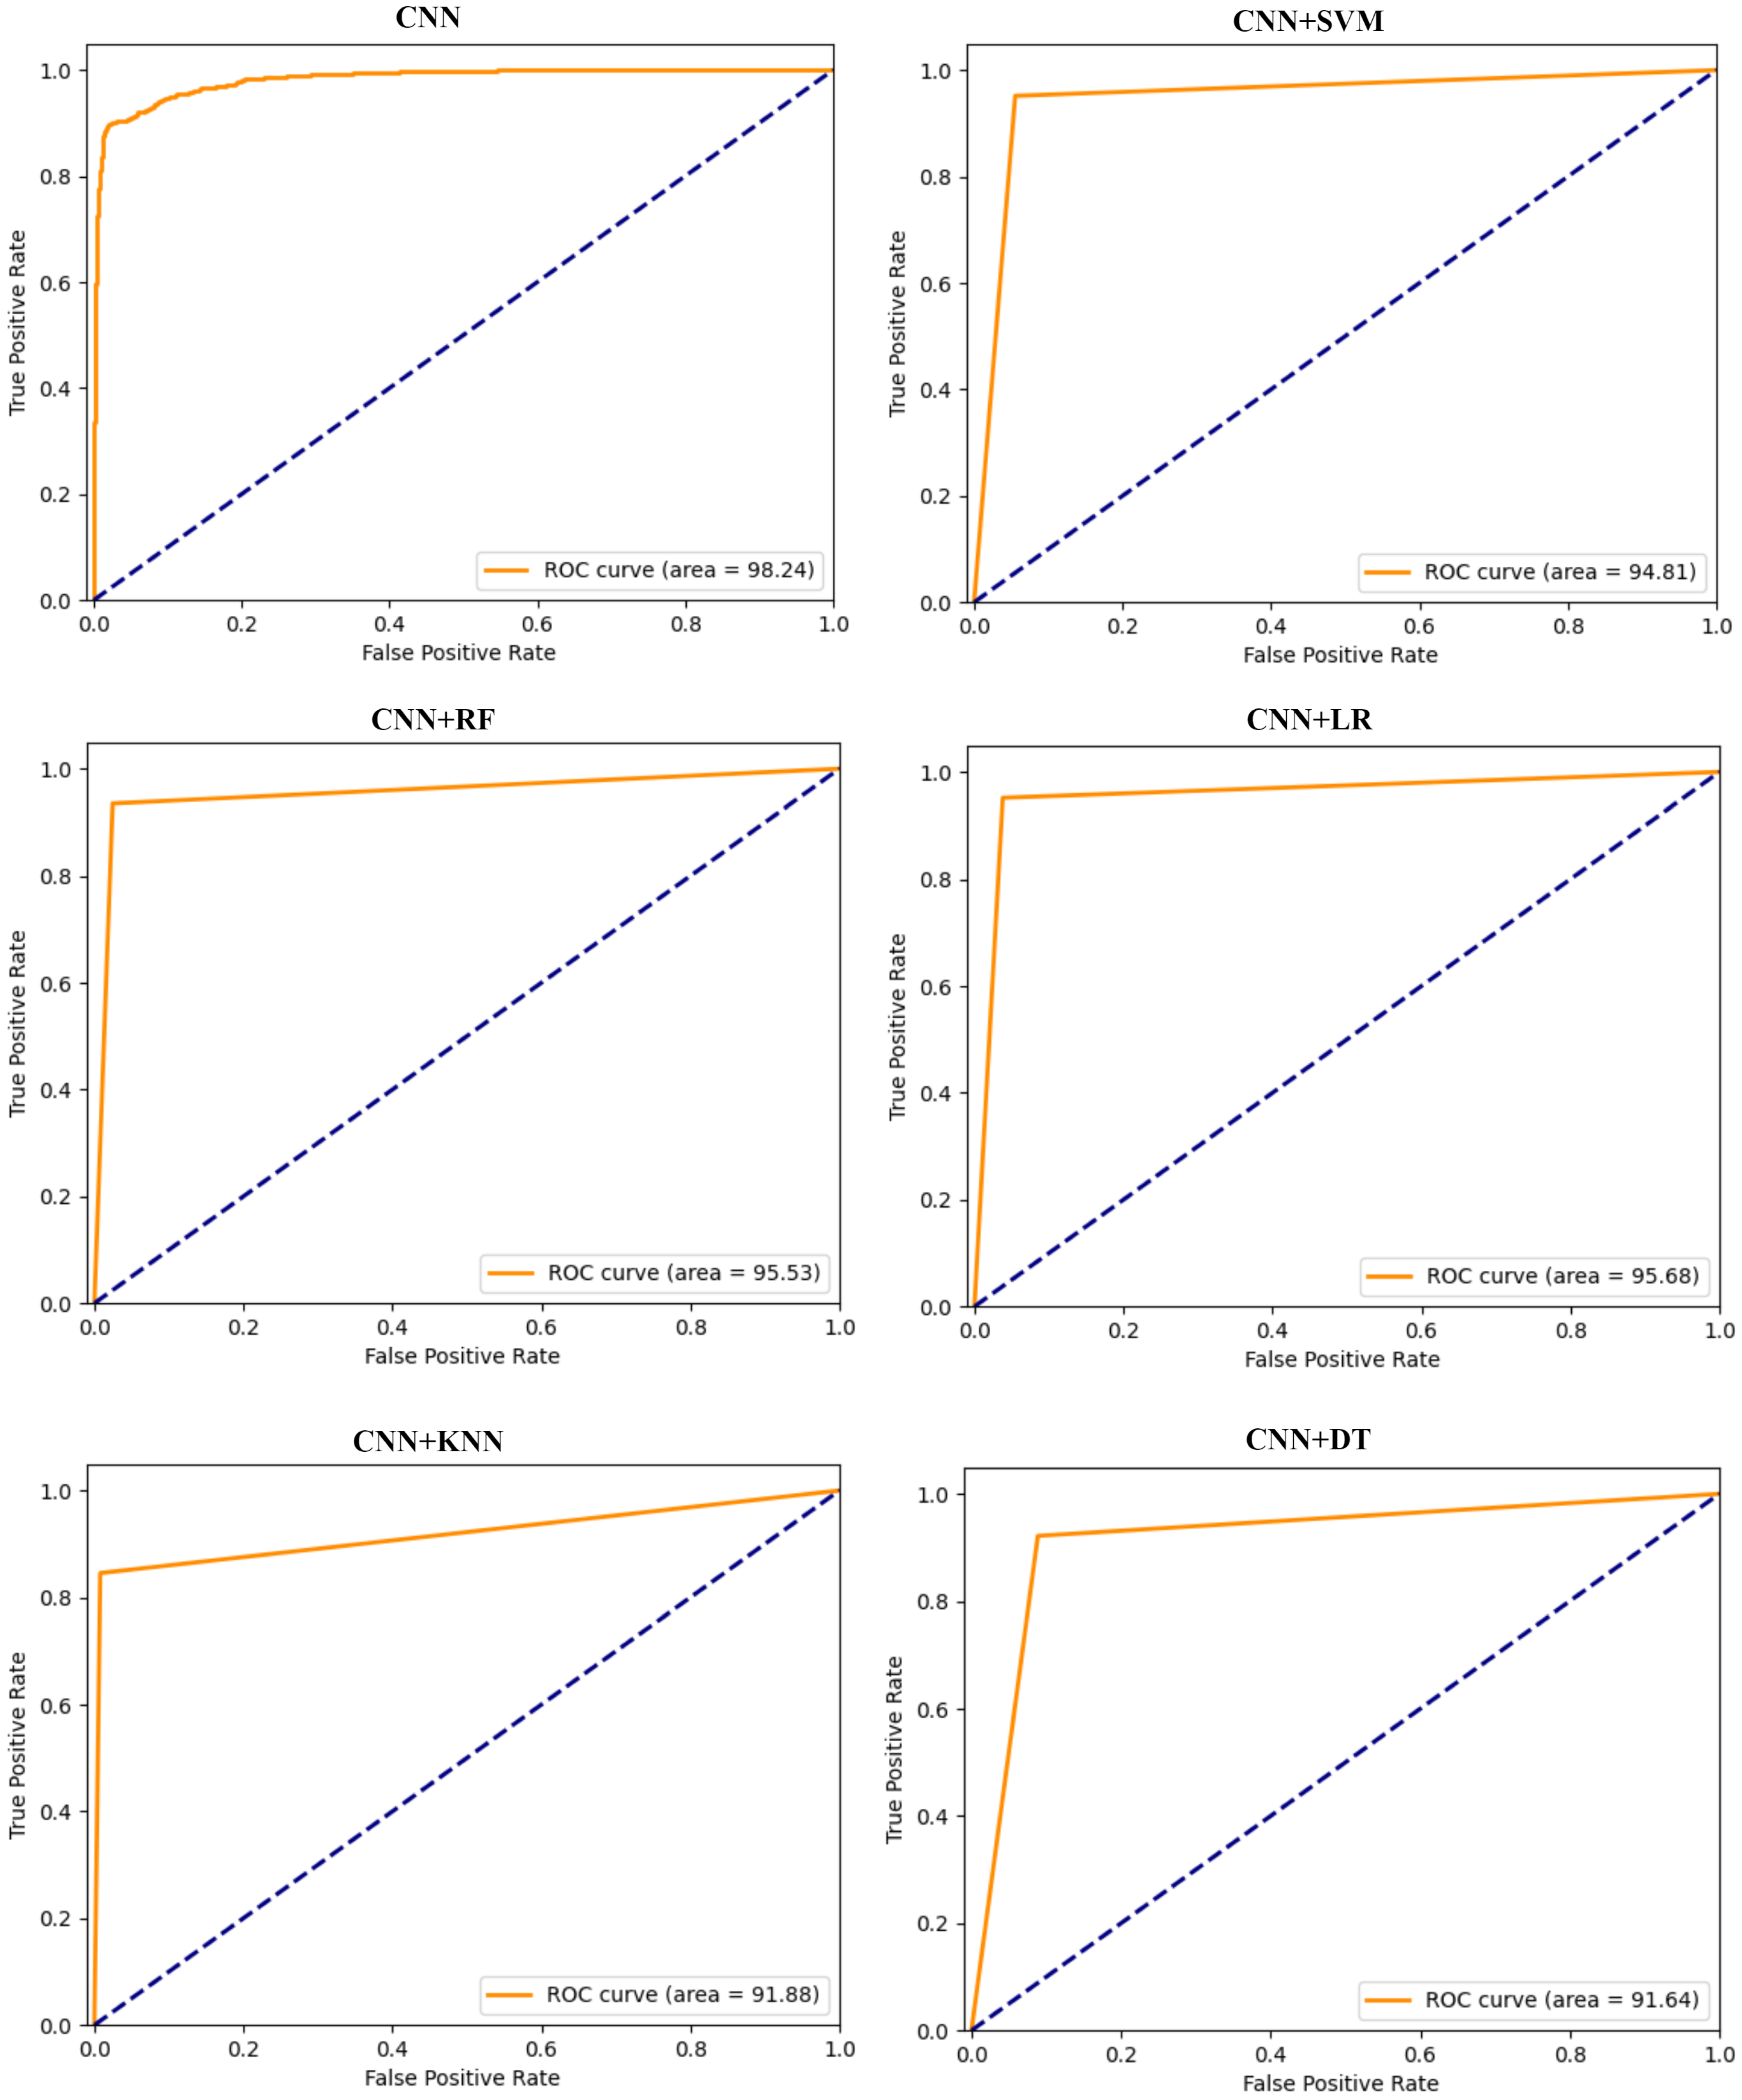
Figure 7 presents the ROC graphs presenting TPR against FPR for CNN-based models. The graphs demonstrate the relationship between the ability of models to detect positives and their corresponding false alarm rates. The CNN+LR model achieves an average value of 95.68%, marginally surpassing CNN+RF, which records an average AUC of 95.53%. These AUC values signify the adeptness of both models in correctly classifying instances involving malicious and honest consumers. CNN allows for the extraction of discriminative features from raw data, endowing these models with enhanced generalization capabilities. Furthermore, the CNN-RF model exhibits notable performance, nearing the top performance among the models evaluated. The competitive performance of the CNN+RF model positions it favorably among the hybrid models evaluated for classification efficiency with CNN+LR.
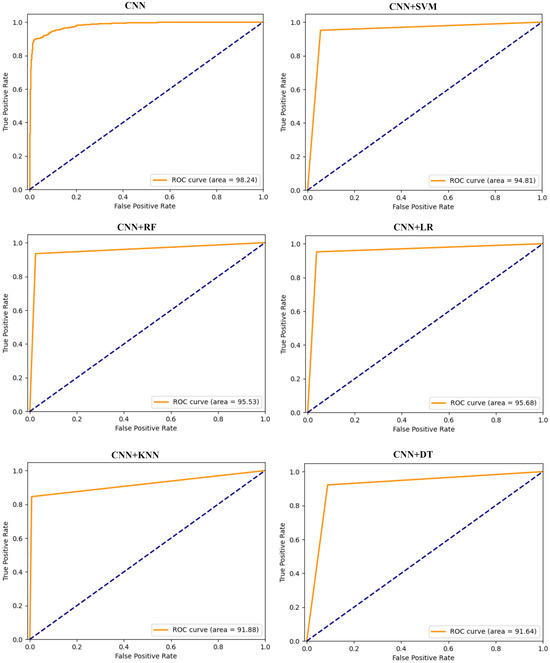
Figure 7.
ROC graphs of CNN-based hybrid models on the hybrid dataset.
Through the application of appropriate classifying techniques, our model is robust against FDI attacks and non-malicious changes in consumption patterns and therefore acquires high DR and low false alarm (FA).
4.4. Comparision with Different Models
Some studies have compared their proposed model with those running on different datasets. It is clear that this is not a healthy comparison. Therefore, we preferred studies using the ISSDA dataset in our comparisons. Also, in some studies, the success of the model was evaluated based on a single attack vector. Since this does not provide a generalizable model, we evaluate our model according to hybrid dataset performance metrics.
We make comparisons based on the most commonly used performance metrics in the literature, which are shown in Table 7 with their percentages. Our CNN-based hybrid model achieved the highest performance in accuracy, AUC, F1-score, and DR metrics. Since our FPR metric is relatively high, our HD value is slightly lower than MP-ANN [27]. When (-) is used, it means there is no information about that metric in the related article.
Table 7.
The performance of our model and others in the literature.
5. Conclusions
In this paper, robust CNN-based models are investigated to detect energy theft using real power consumption data of 2104 residential consumers. The models rely on predicting both honest and malicious energy usage pattern of users. The CNN is used to identify patterns of attacks within consumer behavior. In particular, six attack vectors are employed to generate the malicious readings from honest samples from a real energy consumption dataset. Then, CNN-based detectors are proposed for detecting energy theft. Furthermore, the GAN algorithm is adopted to handle the imbalanced data issue. In the CNN-based model, ML algorithms such as SVM, RF, LR, KNN, and DT are applied to the problem as a benchmark. The results show that the proposed CNN+LR and CNN+RF models are considerably promising classification methods in energy theft detection. The hybrid model can automatically extract features with CNN and combine the advantages of RF or LR into the model. In addition, the results indicate that the specified attack vector detectors have better performance compared to the energy-theft-detection models for all attack vectors. The results show the efficiency of models in accurately identifying various attack vectors, marking it as a promising solution for addressing energy theft issues in real-world applications, particularly within the domain of consumer-related threats. As part of future work, investigating the extension of the proposed CNN-based hybrid models to high-consumption data from industrial users is worth investigating.
Author Contributions
Conceptualization, M.Z.G. and R.D.; methodology, M.Z.G. and R.D.; writing—original draft preparation, M.Z.G.; data curation, resources, software, validation, visualization, M.Z.G.; writing—review, M.Z.G. and R.D.; editing, formal analysis R.D.; supervision, R.D. All authors have read and agreed to the published version of the manuscript.
Funding
This research received no external funding.
Institutional Review Board Statement
Not applicable.
Informed Consent Statement
Not applicable.
Data Availability Statement
Previously reported ISSDA dataset was used to support this study and available at https://www.ucd.ie/issda/data/ (accessed on 1 January 2024). The dataset is cited at relevant place in the text.
Acknowledgments
This paper was produced from the doctoral thesis titled “Development of New Approaches for the Detection and Solution of Security Vulnerabilities in the Internet of Things Based Smart Grids” presented at Fırat University, Graduate School of Natural and Applied Sciences, Department of Software Engineering, under the supervision of Resul Das.
Conflicts of Interest
The authors declare no conflict of interest.
Abbreviations
The following abbreviations are used in this manuscript:
| ANN | Artificial Neural Network |
| AMI | Advanced Metering Infrastructure |
| AUC | Area Under the Curve |
| CER | Commission for Energy Regulation |
| CNN | Convolutional Neural Network |
| DL | Deep Learning |
| DNN | Deep Neural Network |
| DR | Detection Rate |
| DT | Decision Tree |
| FA | False Alarm |
| FAN | Field Area Network |
| FDI | False Data Injection |
| FP | False Positive |
| FPR | False Positive Rate |
| FN | False Negative |
| GAN | Generative Adversarial Network |
| GRU | Gated Recurrent Unit |
| HAN | Home Area Network |
| HD | Highest Difference |
| IAN | Industrial Area Network |
| ICT | Information Communication Technologies |
| IDS | Intrusion Detection System |
| IoT | Internet of Things |
| ISSDA | Irish Social Science Data Archive |
| KNN | K-Nearest Neighbors |
| LR | Logistic Regression |
| LSTM | Long Short Term Memory |
| ML | Machine Learning |
| MP | Multilayer Perceptron |
| NAN | Neighborhood Area Network |
| NTL | Non-Technical Loss |
| PSO | Particle Swarm Optimization |
| RF | Random Forest |
| RNN | Recurrent Neural Network |
| ROC | Receiver Operating Characteristic |
| SGCC | State Grid Corporation of China |
| SMOTE | Synthetic Minority Oversampling Technique |
| SVM | Support Vector Machine |
| TP | True Positive |
| TPR | True Positive Rate |
| TN | True Negative |
| WAN | Wide Area Network |
References
- Gunduz, M.Z.; Das, R. Internet of things (IoT): Evolution, components and applications fields. Pamukkale Univ. J. Eng. Sci. 2018, 24, 327–335. [Google Scholar] [CrossRef]
- Das, R.; Gunduz, M.Z. Analysis of cyber-attacks in IoT-based critical infrastructures. Int. J. Inf. Secur. Sci. 2019, 8, 122–133. [Google Scholar]
- Emmanuel, M.; Rayudu, R. Communication technologies for smart grid applications: A survey. J. Netw. Comput. Appl. 2016, 74, 133–148. [Google Scholar] [CrossRef]
- Kimani, K.; Oduol, V.; Langat, K. Cyber security challenges for IoT-based smart grid networks. Int. J. Crit. Infrastruct. Prot. 2019, 25, 36–49. [Google Scholar] [CrossRef]
- Gunduz, M.Z.; Das, R. Communication Infrastructure and Cyber-Security in Smart Grids. J. Inst. Sci. Technol. 2020, 10, 970–984. [Google Scholar] [CrossRef]
- Qays, M.O.; Ahmad, I.; Abu-Siada, A.; Hossain, M.L.; Yasmin, F. Key communication technologies, applications, protocols and future guides for IoT-assisted smart grid systems: A review. Energy Rep. 2023, 9, 2440–2452. [Google Scholar] [CrossRef]
- Sahoo, S.; Nikovski, D.; Muso, T.; Tsuru, K. Electricity theft detection using smart meter data. In Proceedings of the 2015 IEEE Power & Energy Society Innovative Smart Grid Technologies Conference (ISGT), Washington, DC, USA, 18–20 February 2015; pp. 1–5. [Google Scholar] [CrossRef]
- Althobaiti, A.; Jindal, A.; Marnerides, A.K.; Roedig, U. Energy Theft in Smart Grids: A Survey on Data-Driven Attack Strategies and Detection Methods. IEEE Access 2021, 9, 159291–159312. [Google Scholar] [CrossRef]
- Takiddin, A.; Ismail, M.; Serpedin, E. Detection of Electricity Theft False Data Injection Attacks in Smart Grids. In Proceedings of the 2022 30th European Signal Processing Conference (EUSIPCO), Belgrade, Serbia, 29 August–2 September 2022; pp. 1541–1545. [Google Scholar] [CrossRef]
- Badr, M.M.; Ibrahem, M.I.; Kholidy, H.A.; Fouda, M.M.; Ismail, M. Review of the Data-Driven Methods for Electricity Fraud Detection in Smart Metering Systems. Energies 2023, 16, 2852. [Google Scholar] [CrossRef]
- Wang, Y.; Chen, Q.; Gan, D.; Yang, J.; Kirschen, D.S.; Kang, C. Deep Learning-Based Socio-Demographic Information Identification From Smart Meter Data. IEEE Trans. Smart Grid 2019, 10, 2593–2602. [Google Scholar] [CrossRef]
- Reda, H.T.; Anwar, A.; Mahmood, A. Comprehensive survey and taxonomies of false data injection attacks in smart grids: Attack models, targets, and impacts. Renew. Sustain. Energy Rev. 2022, 163, 112423. [Google Scholar] [CrossRef]
- Javaid, N.; Gul, H.; Baig, S.; Shehzad, F.; Xia, C.; Guan, L.; Sultana, T. Using GANCNN and ERNET for Detection of Non Technical Losses to Secure Smart Grids. IEEE Access 2021, 9, 98679–98700. [Google Scholar] [CrossRef]
- Habib, A.A.; Hasan, M.K.; Alkhayyat, A.; Islam, S.; Sharma, R.; Alkwai, L.M. False data injection attack in smart grid cyber physical system: Issues, challenges, and future direction. Comput. Electr. Eng. 2023, 107, 108638. [Google Scholar] [CrossRef]
- El-Toukhy, A.T.; Badr, M.M.; Mahmoud, M.M.E.A.; Srivastava, G.; Fouda, M.M.; Alsabaan, M. Electricity Theft Detection Using Deep Reinforcement Learning in Smart Power Grids. IEEE Access 2023, 11, 59558–59574. [Google Scholar] [CrossRef]
- Berghout, T.; Benbouzid, M.; Muyeen, S.M. Machine learning for cybersecurity in smart grids: A comprehensive review-based study on methods, solutions, and prospects. Int. J. Crit. Infrastruct. Prot. 2022, 38, 100547. [Google Scholar] [CrossRef]
- Buzau, M.M.; Tejedor-Aguilera, J.; Cruz-Romero, P.; Gómez-Expósito, A. Detection of Non-Technical Losses Using Smart Meter Data and Supervised Learning. IEEE Trans. Smart Grid 2019, 10, 2661–2670. [Google Scholar] [CrossRef]
- Abdulaal, M.J.; Ibrahem, M.I.; Mahmoud, M.M.E.A.; Khalid, J.; Aljohani, A.J.; Milyani, A.H.; Abusorrah, A.M. Real-Time Detection of False Readings in Smart Grid AMI Using Deep and Ensemble Learning. IEEE Access 2022, 10, 47541–47556. [Google Scholar] [CrossRef]
- Lepolesa, L.J.; Achari, S.; Cheng, L. Electricity Theft Detection in Smart Grids Based on Deep Neural Network. IEEE Access 2022, 10, 39638–39655. [Google Scholar] [CrossRef]
- Gunduz, M.Z.; Das, R. Cyber-security on smart grid: Threats and potential solutions. Comput. Netw. 2020, 169, 107094. [Google Scholar] [CrossRef]
- Takiddin, A.; Ismail, M.; Nabil, M.; Mahmoud, M.M.E.A.; Serpedin, E. Detecting Electricity Theft Cyber-Attacks in AMI Networks Using Deep Vector Embeddings. IEEE Syst. J. 2021, 15, 4189–4198. [Google Scholar] [CrossRef]
- Chen, J.; Nanehkaran, Y.A.; Chen, W.; Liu, Y.; Zhang, D. Data-driven intelligent method for detection of electricity theft. Int. J. Electr. Power Energy Syst. 2023, 148, 108948. [Google Scholar] [CrossRef]
- Jokar, P.; Arianpoo, N.; Leung, V.C.M. Electricity Theft Detection in AMI Using Customers’ Consumption Patterns. IEEE Trans. Smart Grid 2016, 7, 216–226. [Google Scholar] [CrossRef]
- Jindal, A.; Dua, A.; Kaur, K.; Singh, M.; Kumar, N.; Mishra, S. Decision Tree and SVM-Based Data Analytics for Theft Detection in Smart Grid. IEEE Trans. Ind. Inform. 2016, 12, 1005–1016. [Google Scholar] [CrossRef]
- Gunturi, S.K.; Sarkar, D. Ensemble machine learning models for the detection of energy theft. Electr. Power Syst. Res. 2021, 192, 106904. [Google Scholar] [CrossRef]
- Alromih, A.; Clark, J.A.; Gope, P. Electricity Theft Detection in the Presence of Prosumers Using a Cluster-based Multi-feature Detection Model. In Proceedings of the 2021 IEEE International Conference on Communications, Control, and Computing Technologies for Smart Grids (SmartGridComm), Aachen, Germany, 25–28 October 2021; pp. 339–345. [Google Scholar] [CrossRef]
- Souza, M.A.; Pereira, J.L.R.; Alves, G.d.O.; de Oliveira, B.C.; Melo, I.D.; Garcia, P.A.N. Detection and identification of energy theft in advanced metering infrastructures. Electr. Power Syst. Res. 2020, 182, 106258. [Google Scholar] [CrossRef]
- Ullah, A.; Javaid, N.; Samuel, O.; Imran, M.; Shoaib, M. CNN and GRU based Deep Neural Network for Electricity Theft Detection to Secure Smart Grid. In Proceedings of the 2020 International Wireless Communications and Mobile Computing (IWCMC), Limassol, Cyprus, 15–19 June 2020; pp. 1598–1602. [Google Scholar] [CrossRef]
- Nabil, M.; Ismail, M.; Mahmoud, M.; Shahin, M.; Qaraqe, K.; Serpedin, E. Deep Recurrent Electricity Theft Detection in AMI Networks with Random Tuning of Hyper-parameters. In Proceedings of the 2018 24th International Conference on Pattern Recognition (ICPR), Beijing, China, 20–24 August 2018; pp. 740–745. [Google Scholar] [CrossRef]
- Zheng, Z.; Yang, Y.; Niu, X.; Dai, H.N.; Zhou, Y. Wide and Deep Convolutional Neural Networks for Electricity-Theft Detection to Secure Smart Grids. IEEE Trans. Ind. Inform. 2018, 14, 1606–1615. [Google Scholar] [CrossRef]
- Hasan, M.N.; Toma, R.N.; Nahid, A.A.; Islam, M.M.M.; Kim, J.M. Electricity Theft Detection in Smart Grid Systems: A CNN-LSTM Based Approach. Energies 2019, 12, 3310. [Google Scholar] [CrossRef]
- Adil, M.; Javaid, N.; Qasim, U.; Ullah, I.; Shafiq, M.; Choi, J.G. LSTM and Bat-Based RUSBoost Approach for Electricity Theft Detection. Appl. Sci. 2020, 10, 4378. [Google Scholar] [CrossRef]
- Kocaman, B.; Tümen, V. Detection of electricity theft using data processing and LSTM method in distribution systems. Sādhanā 2020, 45, 286. [Google Scholar] [CrossRef]
- Viegas, J.L.; Esteves, P.R.; Vieira, S.M. Clustering-based novelty detection for identification of non-technical losses. Int. J. Electr. Power Energy Syst. 2018, 101, 301–310. [Google Scholar] [CrossRef]
- Cheng, G.; Zhang, Z.; Li, Q.; Li, Y.; Jin, W. Energy Theft Detection in an Edge Data Center Using Deep Learning. Math. Probl. Eng. 2021, 2021, e9938475. [Google Scholar] [CrossRef]
- Na, L.; Xiaohui, X.; Xiaoqin, M.; Xiangfu, M.; Peisen, Y. Fake Data Injection Attack Detection in AMI System Using a Hybrid Method. In Proceedings of the 2021 IEEE Sustainable Power and Energy Conference (iSPEC), Nanjing, China, 23–25 December 2021; pp. 2371–2376. [Google Scholar] [CrossRef]
- Viegas, J.L.; Vieira, S.M.; Sousa, J.M.C.; Melício, R.; Mendes, V.M.F. Electricity demand profile prediction based on household characteristics. In Proceedings of the 2015 12th International Conference on the European Energy Market (EEM), Lisbon, Portugal, 19–22 May 2015; pp. 1–5. [Google Scholar] [CrossRef]
- Nagi, J.; Yap, K.S.; Tiong, S.K.; Ahmed, S.K.; Mohamad, M. Nontechnical Loss Detection for Metered Customers in Power Utility Using Support Vector Machines. IEEE Trans. Power Deliv. 2010, 25, 1162–1171. [Google Scholar] [CrossRef]
- Ismail, M.; Shahin, M.; Shaaban, M.F.; Serpedin, E.; Qaraqe, K. Efficient detection of electricity theft cyber attacks in AMI networks. In Proceedings of the 2018 IEEE Wireless Communications and Networking Conference (WCNC), Barcelona, Spain, 15–18 April 2018; pp. 1–6. [Google Scholar] [CrossRef]
- Zheng, K.; Wang, Y.; Chen, Q.; Li, Y. Electricity theft detecting based on density-clustering method. In Proceedings of the 2017 IEEE Innovative Smart Grid Technologies—Asia (ISGT-Asia), Auckland, New Zealand, 4–7 December 2017; pp. 1–6. [Google Scholar] [CrossRef]
- Munawar, S.; Khan, Z.A.; Chaudhary, N.I.; Javaid, N.; Raja, M.A.Z.; Milyani, A.H.; Azhari, A.A. Novel FDIs-based data manipulation and its detection in smart meters’ electricity theft scenarios. Front. Energy Res. 2022, 10, 1043593. [Google Scholar] [CrossRef]
- Hussain, S.; Mustafa, M.W.; Ateyeh Al-Shqeerat, K.H.; Saleh Al-rimy, B.A.; Saeed, F. Electric theft detection in advanced metering infrastructure using Jaya optimized combined Kernel-Tree boosting classifier—A novel sequentially executed supervised machine learning approach. IET Gener. Transm. Distrib. 2022, 16, 1257–1275. [Google Scholar] [CrossRef]
- Haq, E.U.; Pei, C.; Zhang, R.; Jianjun, H.; Ahmad, F. Electricity-theft detection for smart grid security using smart meter data: A deep-CNN based approach. Energy Rep. 2023, 9, 634–643. [Google Scholar] [CrossRef]
- Irish Social Science Data Archive: Dublin, Ireland. Available online: https://www.ucd.ie/issda/data (accessed on 1 January 2024).
- Pereira, J.; Saraiva, F. Convolutional neural network applied to detect electricity theft: A comparative study on unbalanced data handling techniques. Int. J. Electr. Power Energy Syst. 2021, 131, 107085. [Google Scholar] [CrossRef]
- Orozco, E.; Qi, R.; Zheng, J. Feature Engineering for Semi-supervised Electricity Theft Detection in AMI. In Proceedings of the 2023 IEEE Green Technologies Conference (GreenTech), Denver, CO, USA, 19–21 April 2023; pp. 128–133. [Google Scholar] [CrossRef]
- Ayaz, I.; Kutlu, F.; Cömert, Z. DeepMaizeNet: A novel hybrid approach based on CBAM for implementing the doubled haploid technique. Agron. J. 2023. [Google Scholar] [CrossRef]
- Mohebbi Moghaddam, M.; Boroomand, B.; Jalali, M.; Zareian, A.; Daeijavad, A.; Manshaei, M.H.; Krunz, M. Games of GANs: Game-Theoretical models for generative adversarial networks. Artif. Intell. Rev. 2023, 56, 9771–9807. [Google Scholar] [CrossRef]
- Gündüz, M.Z.; Daş, R. An effective DNN-based Approach for Detecting Energy Theft in Smart Grids through User Consumption Patterns. Turk. J. Nat. Sci. 2023, 12, 163–170. [Google Scholar] [CrossRef]
- Yan, Z.; Wen, H. Performance Analysis of Electricity Theft Detection for the Smart Grid: An Overview. IEEE Trans. Instrum. Meas. 2022, 71, 2502928. [Google Scholar] [CrossRef]
- Ibrahem, M.I.; Nabil, M.; Fouda, M.M.; Mahmoud, M.M.E.A.; Alasmary, W.; Alsolami, F. Efficient Privacy-Preserving Electricity Theft Detection With Dynamic Billing and Load Monitoring for AMI Networks. IEEE Internet Things J. 2021, 8, 1243–1258. [Google Scholar] [CrossRef]

Disclaimer/Publisher’s Note: The statements, opinions and data contained in all publications are solely those of the individual author(s) and contributor(s) and not of MDPI and/or the editor(s). MDPI and/or the editor(s) disclaim responsibility for any injury to people or property resulting from any ideas, methods, instructions or products referred to in the content. |
© 2024 by the authors. Licensee MDPI, Basel, Switzerland. This article is an open access article distributed under the terms and conditions of the Creative Commons Attribution (CC BY) license (https://creativecommons.org/licenses/by/4.0/).