
The Effect of Sleep Deprivation on Brain Fingerprint Stability: A Magnetoencephalography Validation Study

 , , , , , ,
  , and
, and
Abstract
1. Introduction
2. Materials and Methods
2.1. Participants
2.2. Sleep Deprivation Protocol (SDP)
2.3. MRI Acquisition
2.4. MEG System
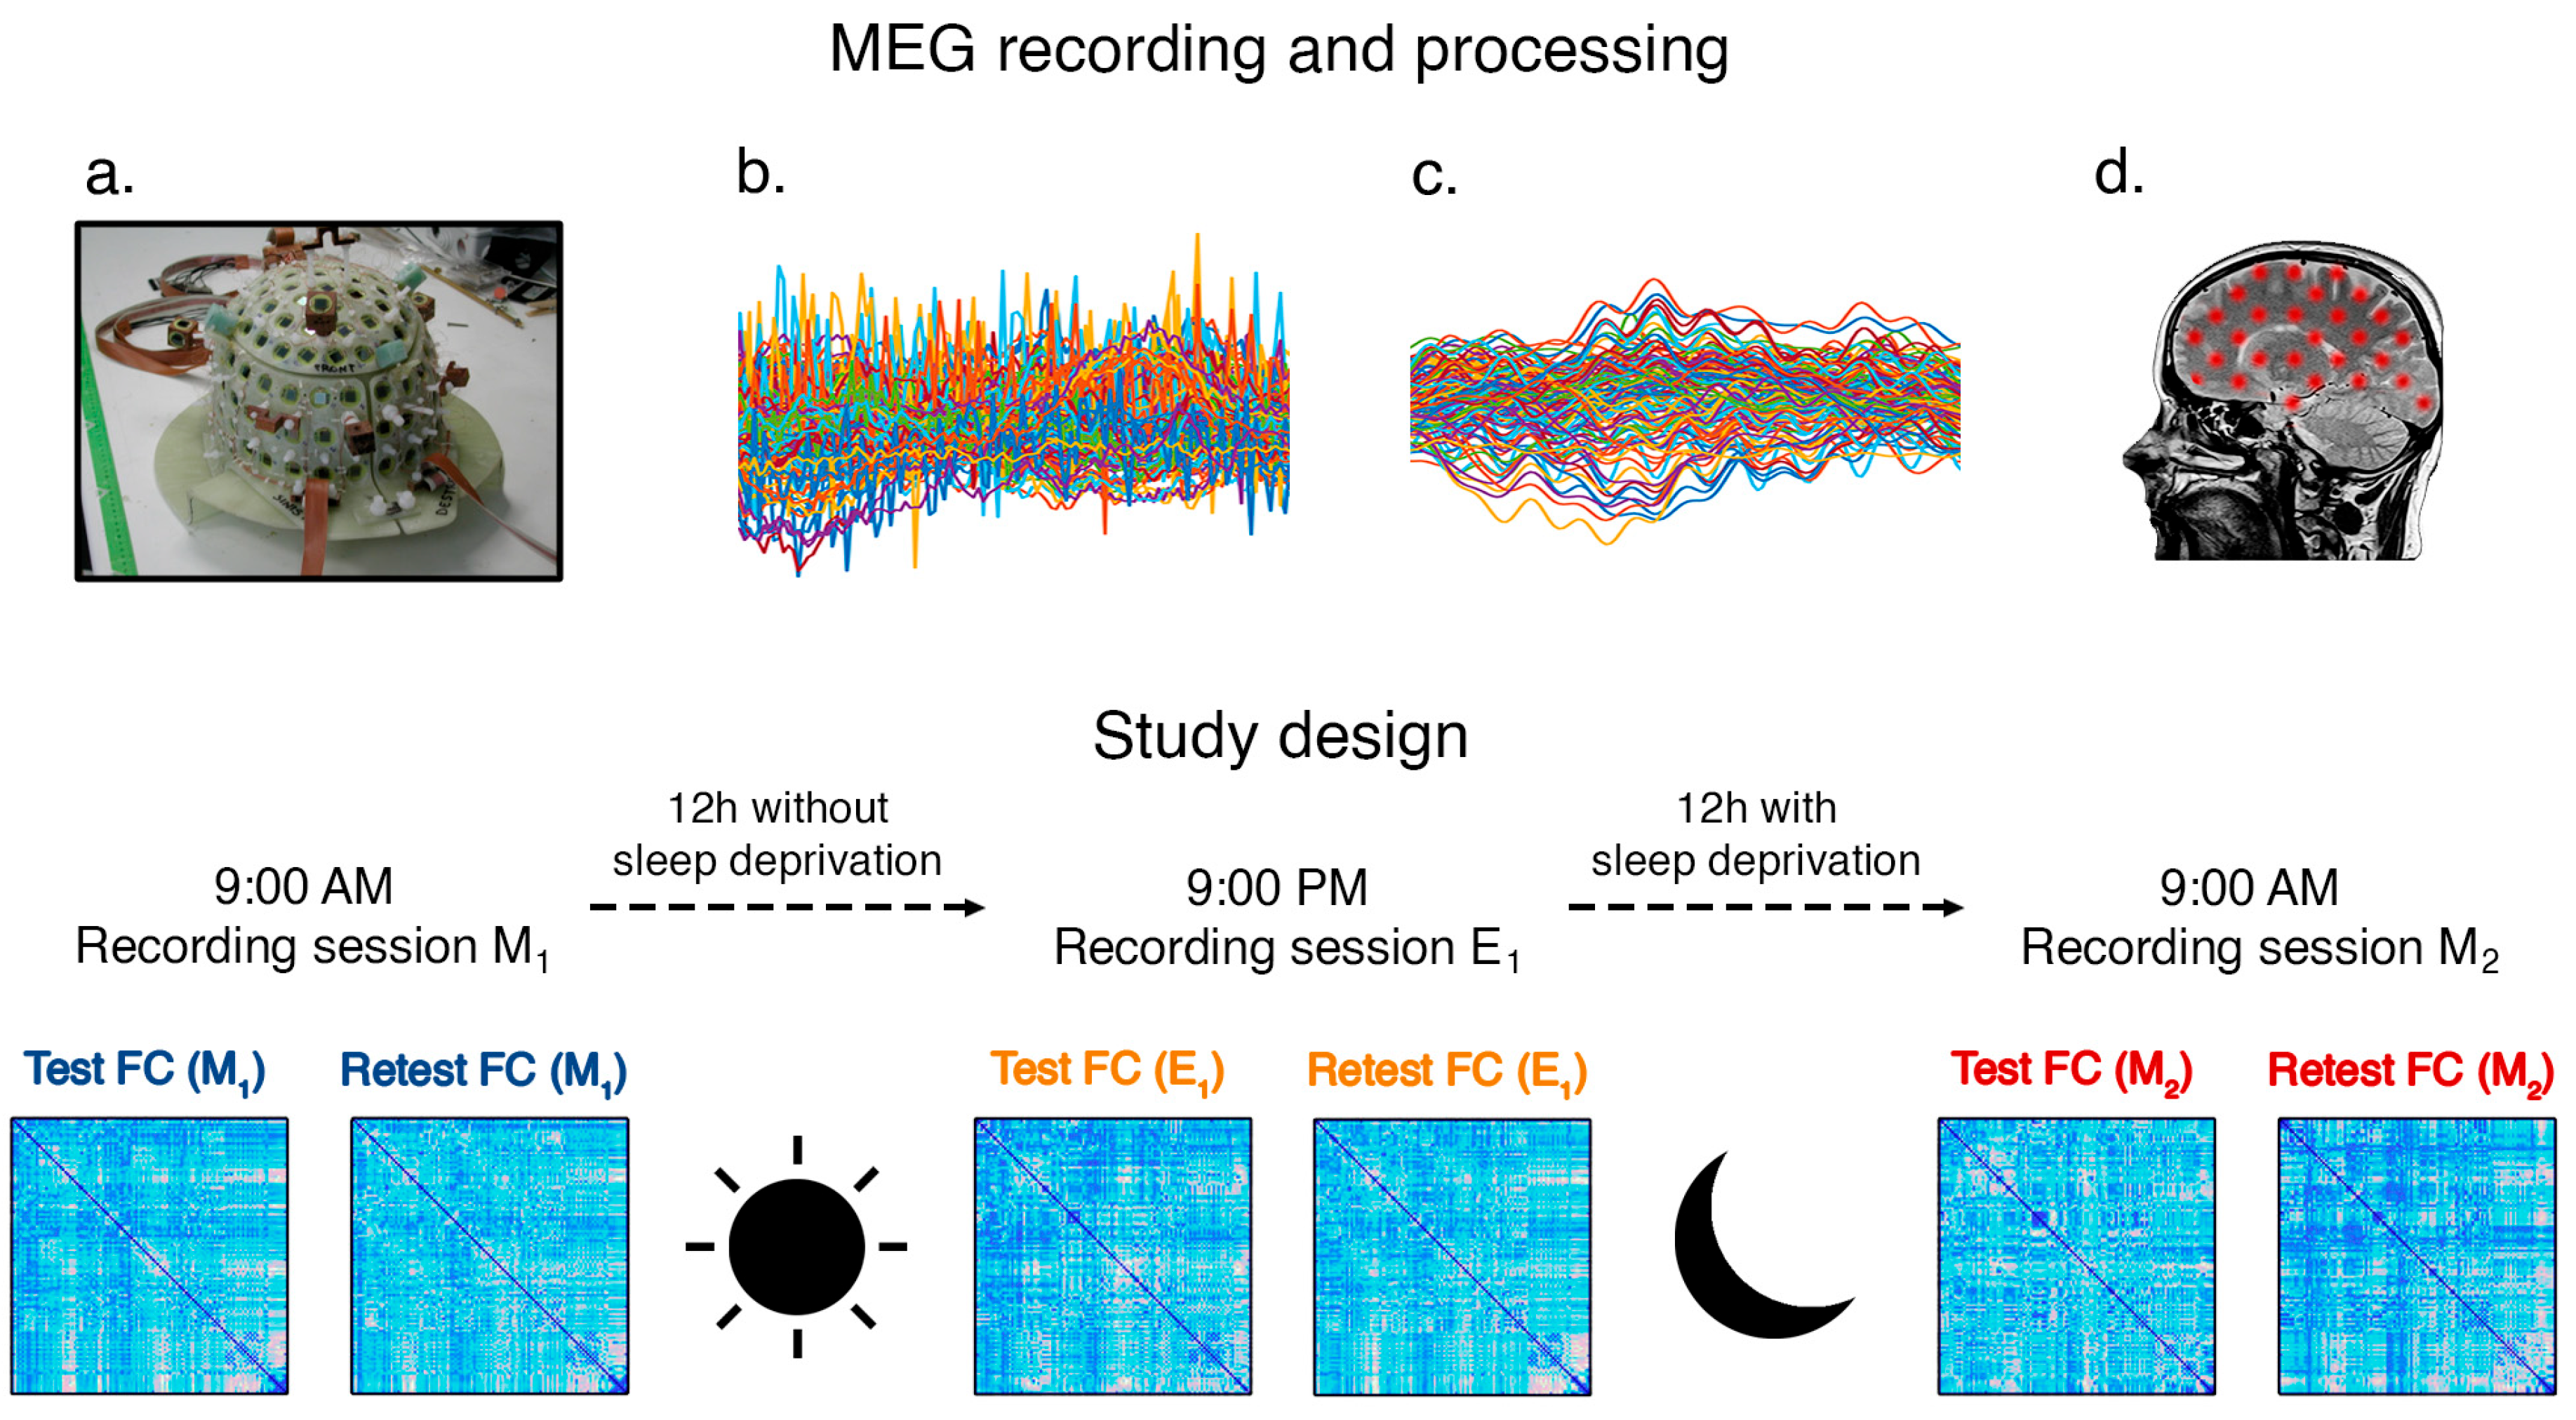
2.5. MEG Acquisition and Processing
2.6. Fingerprint Analysis
- Combination M1M1: this refers to the test and retest collected on the same day at very close time instants during the morning (one-minute time distance)—no sleep deprivation.
- Combination M1E1: this refers to the comparison between the morning acquisitions and the evening acquisitions—no sleep deprivation.
- Combination E1M2: this refers to the comparison between the evening acquisitions and the next-morning acquisitions—including sleep deprivation.
- Combination M1M2: this refers to the comparison between the two different morning acquisitions—including sleep deprivation.
2.7. Cognitive Assessment
2.7.1. Letter Cancellation Task
2.7.2. Task Switching
2.8. Subjective Evaluations
2.9. Statistical Analysis
3. Results
4. Discussion
5. Conclusions
Supplementary Materials
Author Contributions
Funding
Institutional Review Board Statement
Informed Consent Statement
Data Availability Statement
Conflicts of Interest
References
- Sporns, O. The Human Connectome: A Complex Network. Ann. N. Y. Acad. Sci. 2011, 1224, 109–125. [Google Scholar] [CrossRef] [PubMed]
- Amico, E.; Goñi, J. The Quest for Identifiability in Human Functional Connectomes. Sci. Rep. 2018, 8, 8254. [Google Scholar] [CrossRef] [PubMed]
- Sorrentino, P.; Rucco, R.; Lardone, A.; Liparoti, M.; Troisi Lopez, E.; Cavaliere, C.; Soricelli, A.; Jirsa, V.; Sorrentino, G.; Amico, E. Clinical Connectome Fingerprints of Cognitive Decline. NeuroImage 2021, 238, 118253. [Google Scholar] [CrossRef] [PubMed]
- Sareen, E.; Zahar, S.; Ville, D.V.D.; Gupta, A.; Griffa, A.; Amico, E. Exploring MEG Brain Fingerprints: Evaluation, Pitfalls, and Interpretations. NeuroImage 2021, 240, 118331. [Google Scholar] [CrossRef]
- da Silva Castanheira, J.; Orozco Perez, H.D.; Misic, B.; Baillet, S. Brief Segments of Neurophysiological Activity Enable Individual Differentiation. Nat. Commun. 2021, 12, 5713. [Google Scholar] [CrossRef] [PubMed]
- Demeter, D.V.; Engelhardt, L.E.; Mallett, R.; Gordon, E.M.; Nugiel, T.; Harden, K.P.; Tucker-Drob, E.M.; Lewis-Peacock, J.A.; Church, J.A. Functional Connectivity Fingerprints at Rest Are Similar across Youths and Adults and Vary with Genetic Similarity. iScience 2020, 23, 100801. [Google Scholar] [CrossRef] [PubMed]
- Horien, C.; Shen, X.; Scheinost, D.; Constable, R.T. The Individual Functional Connectome Is Unique and Stable over Months to Years. NeuroImage 2019, 189, 676–687. [Google Scholar] [CrossRef] [PubMed]
- Kaufmann, T.; Alnæs, D.; Brandt, C.L.; Bettella, F.; Djurovic, S.; Andreassen, O.A.; Westlye, L.T. Stability of the Brain Functional Connectome Fingerprint in Individuals with Schizophrenia. JAMA Psychiatry 2018, 75, 749–751. [Google Scholar] [CrossRef] [PubMed]
- Jalbrzikowski, M.; Liu, F.; Foran, W.; Klei, L.; Calabro, F.J.; Roeder, K.; Devlin, B.; Luna, B. Functional Connectome Fingerprinting Accuracy in Youths and Adults Is Similar When Examined on the Same Day and 1.5-Years Apart. Hum. Brain Mapp. 2020, 41, 4187–4199. [Google Scholar] [CrossRef]
- Krause, A.J.; Simon, E.B.; Mander, B.A.; Greer, S.M.; Saletin, J.M.; Goldstein-Piekarski, A.N.; Walker, M.P. The Sleep-Deprived Human Brain. Nat. Rev. Neurosci. 2017, 18, 404–418. [Google Scholar] [CrossRef]
- Mander, B.A.; Reid, K.J.; Davuluri, V.K.; Small, D.M.; Parrish, T.B.; Mesulam, M.-M.; Zee, P.C.; Gitelman, D.R. Sleep Deprivation Alters Functioning within the Neural Network Underlying the Covert Orienting of Attention. Brain Res. 2008, 1217, 148–156. [Google Scholar] [CrossRef] [PubMed][Green Version]
- Chee, M.W.L.; Choo, W.C. Functional Imaging of Working Memory after 24 Hr of Total Sleep Deprivation. J. Neurosci. 2004, 24, 4560–4567. [Google Scholar] [CrossRef]
- Gao, L.; Bai, L.; Zhang, Y.; Dai, X.; Netra, R.; Min, Y.; Zhou, F.; Niu, C.; Dun, W.; Gong, H.; et al. Frequency-Dependent Changes of Local Resting Oscillations in Sleep-Deprived Brain. PLoS ONE 2015, 10, e0120323. [Google Scholar] [CrossRef] [PubMed]
- Tomasi, D.; Wang, R.L.; Telang, F.; Boronikolas, V.; Jayne, M.C.; Wang, G.-J.; Fowler, J.S.; Volkow, N.D. Impairment of Attentional Networks after 1 Night of Sleep Deprivation. Cerebral Cortex 2009, 19, 233–240. [Google Scholar] [CrossRef] [PubMed]
- Zhang, S.; Yang, W.; Mou, H.; Pei, Z.; Li, F.; Wu, X. An Overview of Brain Fingerprint Identification Based on Various Neuroimaging Technologies. IEEE Trans. Cogn. Dev. Syst. 2024, 16, 151–164. [Google Scholar] [CrossRef]
- Baselice, F.; Sorriso, A.; Rucco, R.; Sorrentino, P. Phase Linearity Measurement: A Novel Index for Brain Functional Connectivity. IEEE Trans. Med. Imaging 2019, 38, 873–882. [Google Scholar] [CrossRef] [PubMed]
- Hwang, R.J.; Chen, L.F.; Yeh, T.C.; Tu, P.C.; Tu, C.H.; Hsieh, J.C. The Resting Frontal Alpha Asymmetry across the Menstrual Cycle: A Magnetoencephalographic Study. Horm. Behav. 2008, 54, 28–33. [Google Scholar] [CrossRef] [PubMed]
- Buysse, D.J.; Reynolds, C.F.; Monk, T.H.; Berman, S.R.; Kupfer, D.J. The Pittsburgh Sleep Quality Index: A New Instrument for Psychiatric Practice and Research. Psychiatry Res. 1989, 28, 193–213. [Google Scholar] [CrossRef] [PubMed]
- Johns, M.W. A New Method for Measuring Daytime Sleepiness: The Epworth Sleepiness Scale. Sleep 1991, 14, 540–545. [Google Scholar] [CrossRef] [PubMed]
- Åkerstedt, T.; Hume, K.; Minors, D.; Waterhouse, J. The Subjective Meaning of Good Sleep, An Intraindividual Approach Using the Karolinska Sleep Diary. Percept. Mot. Skills 1994, 79, 287–296. [Google Scholar] [CrossRef] [PubMed]
- Åkerstedt, T.; Gillberg, M. Subjective and Objective Sleepiness in the Active Individual. Int. J. Neurosci. 1990, 52, 29–37. [Google Scholar] [CrossRef] [PubMed]
- Hart, S.G. Nasa-Task Load Index (NASA-TLX); 20 Years Later. Proc. Hum. Factors Ergon. Soc. Annu. Meet. 2006, 50, 904–908. [Google Scholar] [CrossRef]
- Hart, S.G.; Staveland, L.E. Development of NASA-TLX (Task Load Index): Results of Empirical and Theoretical Research. In Advances in Psychology; Hancock, P.A., Meshkati, N., Eds.; Human Mental Workload: North-Holland, The Netherlands, 1988; Volume 52, pp. 139–183. [Google Scholar]
- Grier, R.A. How High Is High? A Meta-Analysis of NASA-TLX Global Workload Scores. Proc. Hum. Factors Ergon. Soc. Annu. Meet. 2015, 59, 1727–1731. [Google Scholar] [CrossRef]
- Noyes, J.M.; Bruneau, D.P.J. A Self-Analysis of the NASA-TLX Workload Measure. Ergonomics 2007, 50, 514–519. [Google Scholar] [CrossRef] [PubMed]
- Pesoli, M.; Rucco, R.; Liparoti, M.; Lardone, A.; D’Aurizio, G.; Minino, R.; Troisi Lopez, E.; Paccone, A.; Granata, C.; Curcio, G.; et al. A Night of Sleep Deprivation Alters Brain Connectivity and Affects Specific Executive Functions. Neurol. Sci. 2022, 43, 1025–1034. [Google Scholar] [CrossRef]
- Rombetto, S.; Granata, C.; Vettoliere, A.; Russo, M. Multichannel System Based on a High Sensitivity Superconductive Sensor for Magnetoencephalography. Sensors 2014, 14, 12114–12126. [Google Scholar] [CrossRef]
- Vettoliere, A.; Granata, C. Highly Sensitive Tunable Magnetometer Based on Superconducting Quantum Interference Device. Sensors 2023, 23, 3558. [Google Scholar] [CrossRef] [PubMed]
- Singh, S.P. Magnetoencephalography: Basic Principles. Ann. Indian Acad. Neurol. 2014, 17, S107–S112. [Google Scholar] [CrossRef] [PubMed]
- Sorrentino, P.; Petkoski, S.; Sparaco, M.; Troisi Lopez, E.; Signoriello, E.; Baselice, F.; Bonavita, S.; Pirozzi, M.A.; Quarantelli, M.; Sorrentino, G.; et al. Whole-Brain Propagation Delays in Multiple Sclerosis, a Combined Tractography—Magnetoencephalography Study. J. Neurosci. 2022, 42, 8807–8816. [Google Scholar] [CrossRef]
- Oostenveld, R.; Fries, P.; Maris, E.; Schoffelen, J.M. FieldTrip: Open Source Software for Advanced Analysis of MEG, EEG, and Invasive Electrophysiological Data. Comput. Intell. Neurosci. 2011, 2011, 156869. [Google Scholar] [CrossRef] [PubMed]
- Rucco, R.; Liparoti, M.; Jacini, F.; Baselice, F.; Antenora, A.; De Michele, G.; Criscuolo, C.; Vettoliere, A.; Mandolesi, L.; Sorrentino, G.; et al. Mutations in the SPAST Gene Causing Hereditary Spastic Paraplegia Are Related to Global Topological Alterations in Brain Functional Networks. Neurol. Sci. 2019, 40, 979–984. [Google Scholar] [CrossRef] [PubMed]
- Van Veen, B.D.; Van Drongelen, W.; Yuchtman, M.; Suzuki, A. Localization of Brain Electrical Activity via Linearly Constrained Minimum Variance Spatial Filtering. IEEE Trans. Biomed. Eng. 1997, 44, 867–880. [Google Scholar] [CrossRef] [PubMed]
- Nolte, G. The Magnetic Lead Field Theorem in the Quasi-Static Approximation and Its Use for Magnetoenchephalography Forward Calculation in Realistic Volume Conductors. Phys. Med. Biol. 2003, 48, 3637–3652. [Google Scholar] [CrossRef] [PubMed]
- Finn, E.S.; Shen, X.; Scheinost, D.; Rosenberg, M.D.; Huang, J.; Chun, M.M.; Papademetris, X.; Constable, R.T. Functional Connectome Fingerprinting: Identifying Individuals Using Patterns of Brain Connectivity. Nat. Neurosci. 2015, 18, 1664–1671. [Google Scholar] [CrossRef] [PubMed]
- Casagrande, M.; Violani, C.; Curcio, G.; Bertini, M. Assessing Vigilance through a Brief Pencil and Paper Letter Cancellation Task (LCT): Effects of One Night of Sleep Deprivation and of the Time of Day. Ergonomics 1997, 40, 613–630. [Google Scholar] [CrossRef] [PubMed]
- Couyoumdjian, A.; Sdoia, S.; Tempesta, D.; Curcio, G.; Rastellini, E.; De Gennaro, L.; Ferrara, M. The Effects of Sleep and Sleep Deprivation on Task-Switching Performance. J. Sleep Res. 2010, 19, 64–70. [Google Scholar] [CrossRef] [PubMed]
- Benjamini, Y.; Hochberg, Y. Controlling the False Discovery Rate: A Practical and Powerful Approach to Multiple Testing. J. R. Stat. Soc. Ser. B (Methodol.) 1995, 57, 289–300. [Google Scholar] [CrossRef]
- Van De Ville, D.; Farouj, Y.; Preti, M.G.; Liégeois, R.; Amico, E. When Makes You Unique: Temporality of the Human Brain Fingerprint. Sci. Adv. 2021, 7, eabj0751. [Google Scholar] [CrossRef] [PubMed]
- Ousdal, O.T.; Kaufmann, T.; Kolskår, K.; Vik, A.; Wehling, E.; Lundervold, A.J.; Lundervold, A.; Westlye, L.T. Longitudinal Stability of the Brain Functional Connectome Is Associated with Episodic Memory Performance in Aging. Hum. Brain Mapp. 2020, 41, 697–709. [Google Scholar] [CrossRef] [PubMed]
- Malik, A.S.; Amin, H.U. Chapter 1—Designing an EEG Experiment. In Designing EEG Experiments for Studying the Brain; Malik, A.S., Amin, H.U., Eds.; Academic Press: Cambridge, MA, USA, 2017; pp. 1–30. ISBN 978-0-12-811140-6. [Google Scholar]
- Todorova, R.; Zugaro, M. Isolated Cortical Computations during Delta Waves Support Memory Consolidation. Science 2019, 366, 377–381. [Google Scholar] [CrossRef] [PubMed]
- Wang, C.; Zhang, P.; Wang, C.; Yang, L.; Zhang, X. Cortical Thinning and Abnormal Structural Covariance Network after Three Hours Sleep Restriction. Front. Psychiatry 2021, 12, 664811. [Google Scholar] [CrossRef] [PubMed]
- Chen, X.; Hsu, C.; Xu, D.; Yu, J.; Lei, X. Loss of Frontal Regulator of Vigilance during Sleep Inertia: A Simultaneous EEG-fMRI Study. Hum. Brain Mapp. 2020, 41, 4288–4298. [Google Scholar] [CrossRef] [PubMed]
- Hilditch, C.J.; Bansal, K.; Chachad, R.; Wong, L.R.; Bathurst, N.G.; Feick, N.H.; Santamaria, A.; Shattuck, N.L.; Garcia, J.O.; Flynn-Evans, E.E. Reconfigurations in Brain Networks upon Awakening from Slow Wave Sleep: Interventions and Implications in Neural Communication. Netw. Neurosci. 2023, 7, 102–121. [Google Scholar] [CrossRef] [PubMed]
- Trotti, L.M. Waking up Is the Hardest Thing I Do All Day: Sleep Inertia and Sleep Drunkenness. Sleep Med. Rev. 2017, 35, 76–84. [Google Scholar] [CrossRef] [PubMed]
- Wang, L.; Aton, S.J. Perspective—Ultrastructural Analyses Reflect the Effects of Sleep and Sleep Loss on Neuronal Cell Biology. Sleep 2022, 45, zsac047. [Google Scholar] [CrossRef] [PubMed]
- Lian, J.; Xu, L.; Song, T.; Peng, Z.; Zhang, Z.; An, X.; Chen, S.; Zhong, X.; Shao, Y. Reduced Resting-State EEG Power Spectra and Functional Connectivity after 24 and 36 Hours of Sleep Deprivation. Brain Sci. 2023, 13, 949. [Google Scholar] [CrossRef] [PubMed]
- Wu, J.; Zhou, Q.; Li, J.; Chen, Y.; Shao, S.; Xiao, Y. Decreased Resting-State Alpha-Band Activation and Functional Connectivity after Sleep Deprivation. Sci. Rep. 2021, 11, 484. [Google Scholar] [CrossRef] [PubMed]
- Xu, Z.; Chang, Y.; Guo, F.; Wang, C.; Chai, N.; Zheng, M.; Fang, P.; Zhu, Y. The Restoration Ability of a Short Nap after Sleep Deprivation on the Brain Cognitive Function: A Dynamic Functional Connectivity Analysis. CNS Neurosci. Ther. 2023, 30, e14413. [Google Scholar] [CrossRef] [PubMed]
- Mukli, P.; Csipo, T.; Lipecz, A.; Stylianou, O.; Racz, F.S.; Owens, C.D.; Perry, J.W.; Tarantini, S.; Sorond, F.A.; Kellawan, J.M.; et al. Sleep Deprivation Alters Task-Related Changes in Functional Connectivity of the Frontal Cortex: A near-Infrared Spectroscopy Study. Brain Behav. 2021, 11, e02135. [Google Scholar] [CrossRef] [PubMed]
- Khan, M.A.; Al-Jahdali, H. The Consequences of Sleep Deprivation on Cognitive Performance. Neurosci. J. 2023, 28, 91–99. [Google Scholar] [CrossRef] [PubMed]
- Rodrigues, T.; Shigaeff, N. Sleep Disorders and Attention: A Systematic Review. Arq. Neuro-Psiquiatr. 2022, 80, 530–538. [Google Scholar] [CrossRef] [PubMed]
- Riontino, L.; Cavallero, C. Impact of Sleep Deprivation on Attentional Networks: Disentangling Orienting Components. Brain Cogn. 2022, 159, 105863. [Google Scholar] [CrossRef] [PubMed]


| M1M2 | ||||||||||
|---|---|---|---|---|---|---|---|---|---|---|
| δ | Θ | α | β | γ | δ | θ | α | β | γ | |
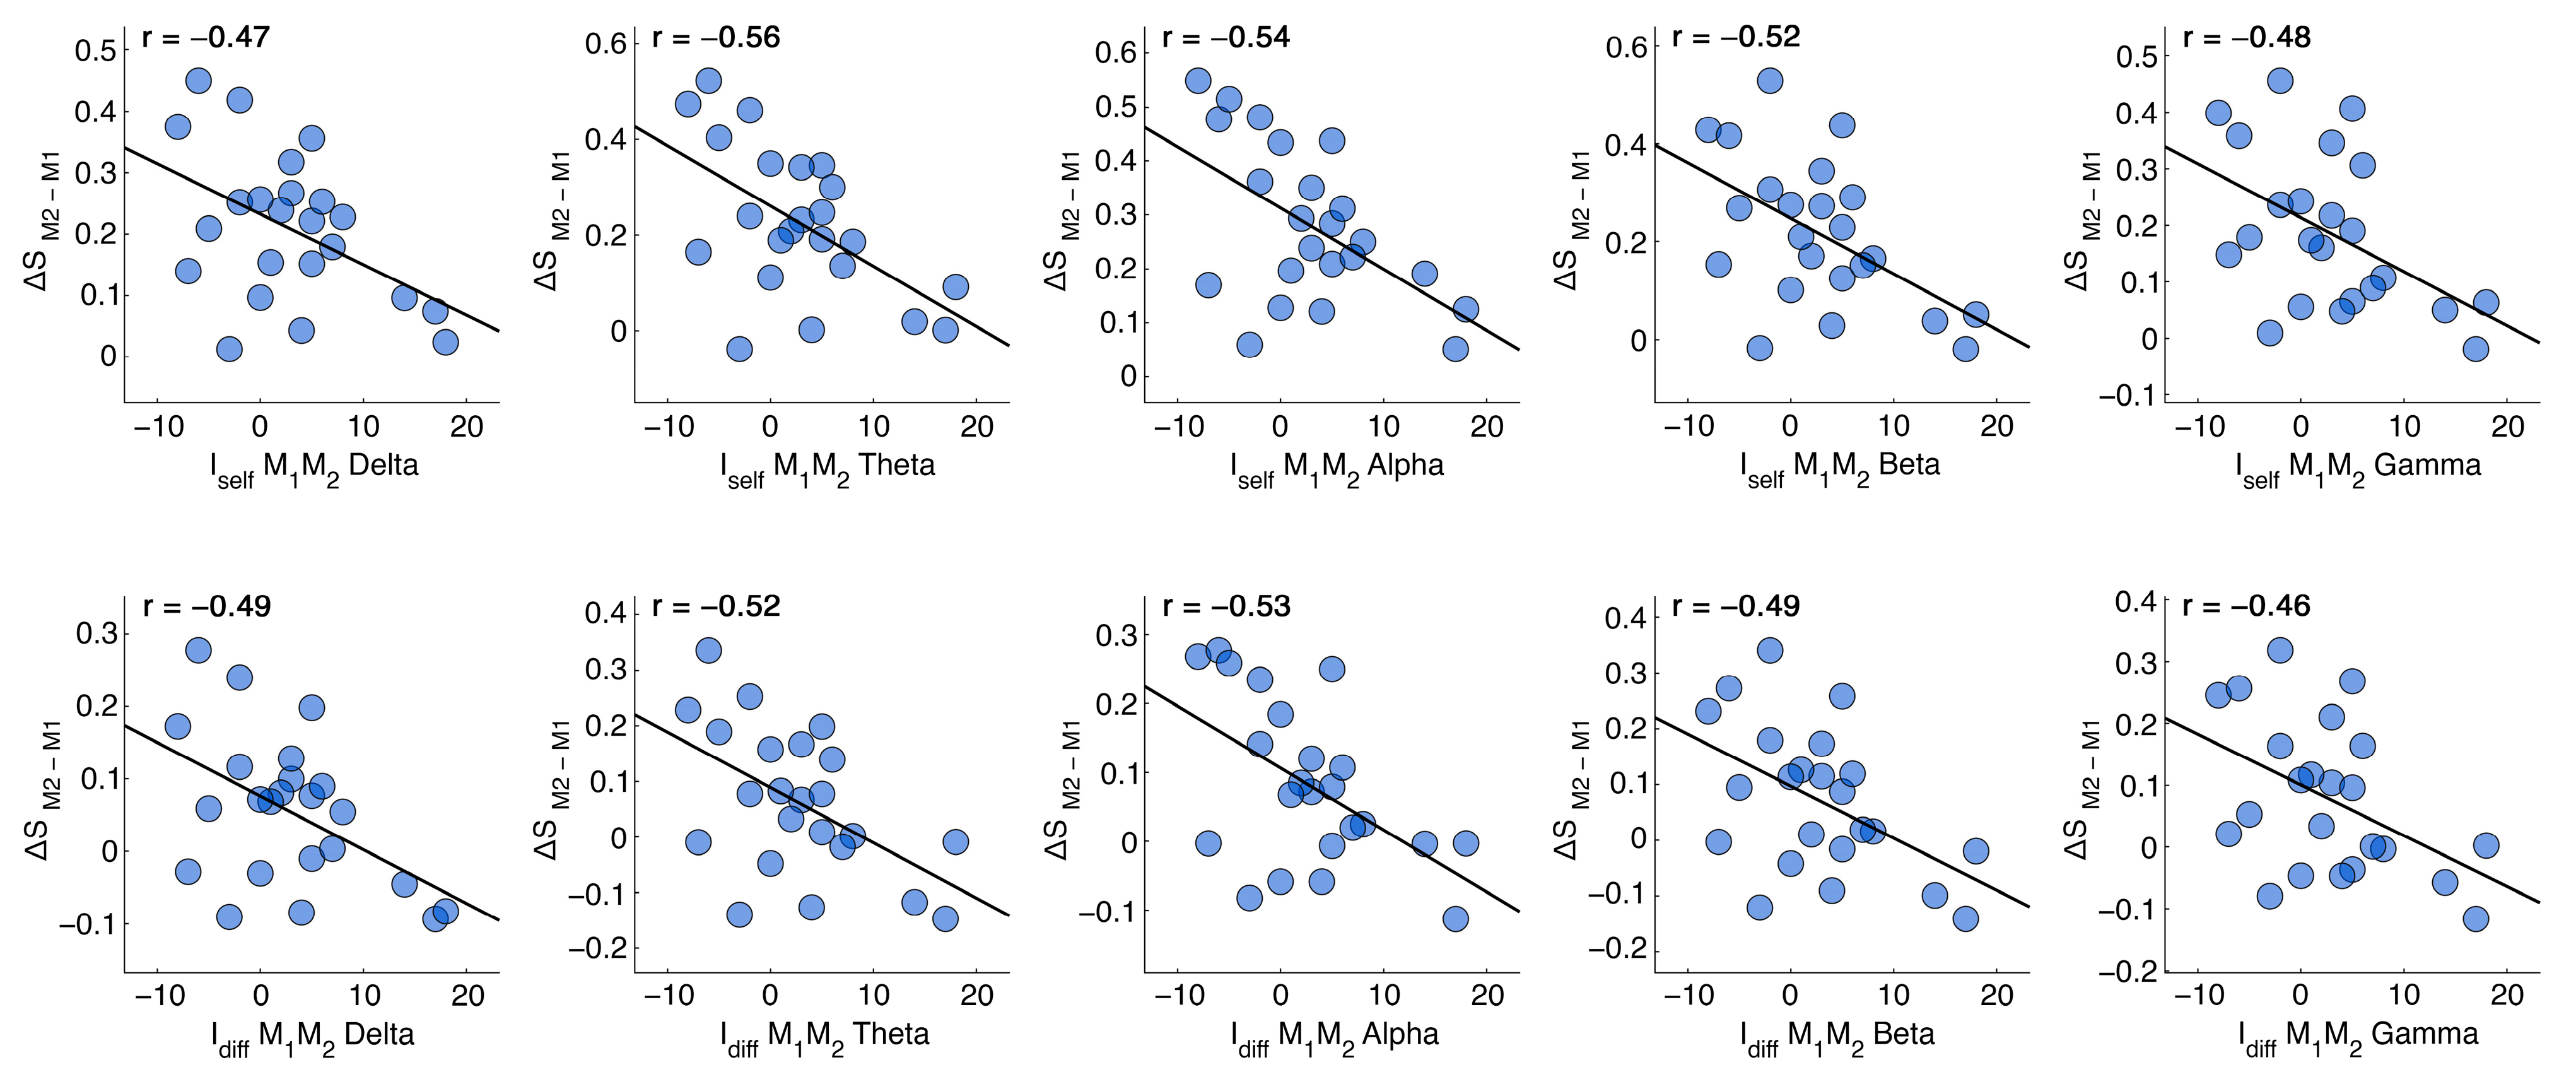
| p-value | 0.024 | 0.005 | 0.008 | 0.011 | 0.019 | 0.017 | 0.010 | 0.010 | 0.017 | 0.026 |
| p-value (FDR) | 0.024 | 0.018 | 0.018 | 0.018 | 0.024 | 0.022 | 0.022 | 0.022 | 0.022 | 0.026 |
| corr | −0.47 | −0.56 | −0.54 | −0.52 | −0.48 | −0.49 | −0.52 | −0.53 | −0.49 | −0.46 |
Disclaimer/Publisher’s Note: The statements, opinions and data contained in all publications are solely those of the individual author(s) and contributor(s) and not of MDPI and/or the editor(s). MDPI and/or the editor(s) disclaim responsibility for any injury to people or property resulting from any ideas, methods, instructions or products referred to in the content. |
© 2024 by the authors. Licensee MDPI, Basel, Switzerland. This article is an open access article distributed under the terms and conditions of the Creative Commons Attribution (CC BY) license (https://creativecommons.org/licenses/by/4.0/).
Share and Cite
Ambrosanio, M.; Troisi Lopez, E.; Polverino, A.; Minino, R.; Cipriano, L.; Vettoliere, A.; Granata, C.; Mandolesi, L.; Curcio, G.; Sorrentino, G.; et al. The Effect of Sleep Deprivation on Brain Fingerprint Stability: A Magnetoencephalography Validation Study. Sensors 2024, 24, 2301. https://doi.org/10.3390/s24072301
Ambrosanio M, Troisi Lopez E, Polverino A, Minino R, Cipriano L, Vettoliere A, Granata C, Mandolesi L, Curcio G, Sorrentino G, et al. The Effect of Sleep Deprivation on Brain Fingerprint Stability: A Magnetoencephalography Validation Study. Sensors. 2024; 24(7):2301. https://doi.org/10.3390/s24072301
Chicago/Turabian StyleAmbrosanio, Michele, Emahnuel Troisi Lopez, Arianna Polverino, Roberta Minino, Lorenzo Cipriano, Antonio Vettoliere, Carmine Granata, Laura Mandolesi, Giuseppe Curcio, Giuseppe Sorrentino, and et al. 2024. "The Effect of Sleep Deprivation on Brain Fingerprint Stability: A Magnetoencephalography Validation Study" Sensors 24, no. 7: 2301. https://doi.org/10.3390/s24072301
APA StyleAmbrosanio, M., Troisi Lopez, E., Polverino, A., Minino, R., Cipriano, L., Vettoliere, A., Granata, C., Mandolesi, L., Curcio, G., Sorrentino, G., & Sorrentino, P. (2024). The Effect of Sleep Deprivation on Brain Fingerprint Stability: A Magnetoencephalography Validation Study. Sensors, 24(7), 2301. https://doi.org/10.3390/s24072301