
Deployment Protection for Interference of 5G Base Stations with Aeronautical Radio Altimeters


Abstract
1. Introduction
- They have not yet proposed an integrated interference model tailored to the complex operational scenarios of aircraft, nor have they provided a method for calculating protective measures in accordance with aviation safety requirements.
- They have not adequately explored the variations of protection zones under dynamic aircraft operational scenarios, nor have they proposed deployment protection measures for dynamic situations. Moreover, their discussion of path loss is overly simplistic.
- They have failed to provide an effective and direct analytical framework for addressing the deployment of 5G base stations near airports and to offer direct mitigation measures for base station deployment.
- First, we propose a novel deployment protection method to define prohibited zones, considering aviation safety requirements such as the WCLS (Worst-Case Landing Scenario) and ICAO 6 dB margin, and conduct analysis for both horizontal and vertical prohibited zones. The adoption of an integrated computational model addresses issues where other analytical models are not applicable to civil aviation operations.
- Second, we investigate the variations of prohibited zones during aircraft dynamic operations, considering factors such as an aircraft’s roll/pitch angle, altitude AGL, and the stochastic feature of path loss. We examine three different base stations (rural macrocells (RMas), urban macrocells (UMas), and urban microcells (UMis)), two antenna configurations (an omnidirectional antenna and 16 × 16 beamforming antenna arrays), and the deployment height and vertical scan angle of the base station.
- Finally, we discuss methods for mitigating interference within the prohibited zones using beamforming technology, employing power control and angle shutoff techniques to protect radio altimeters. This provides a new approach for deploying 5G base stations near airports while ensuring aviation safety.

| This Paper | [3] | [17] | [18] | [20] | [24] | [25] | ||
|---|---|---|---|---|---|---|---|---|
| Integrated Interference Model | Applicable in aviation | ◯ | ◯ | |||||
| RMa, UMa, UMi, ICAO 6 dB, WCLS, antenna types | ◯ | ◯ | ◯ | |||||
| Prohibited zones | ◯ | ◯ | ◯ | |||||
| Dynamic Aircraft Operational Scenarios | Aircraft altitude and attitude | ◯ | ||||||
| Dynamic interference thresholds | ◯ | ◯ | ◯ | ◯ | ||||
| Vertical prohibited zones | ◯ | |||||||
| Path Loss | Analyzing LOS and NLOS scenarios | ◯ | ◯ | ◯ | ||||
| Mitigation Measures | Applicable for BSs near airports | ◯ | ◯ | ◯ | ◯ | ◯ | ||
| Tx power control and angle shutoff | ◯ | ◯ |
2. Methodology
2.1. Integrated Interference Model
2.1.1. 5G Base Station Antenna
2.1.2. RA Antenna
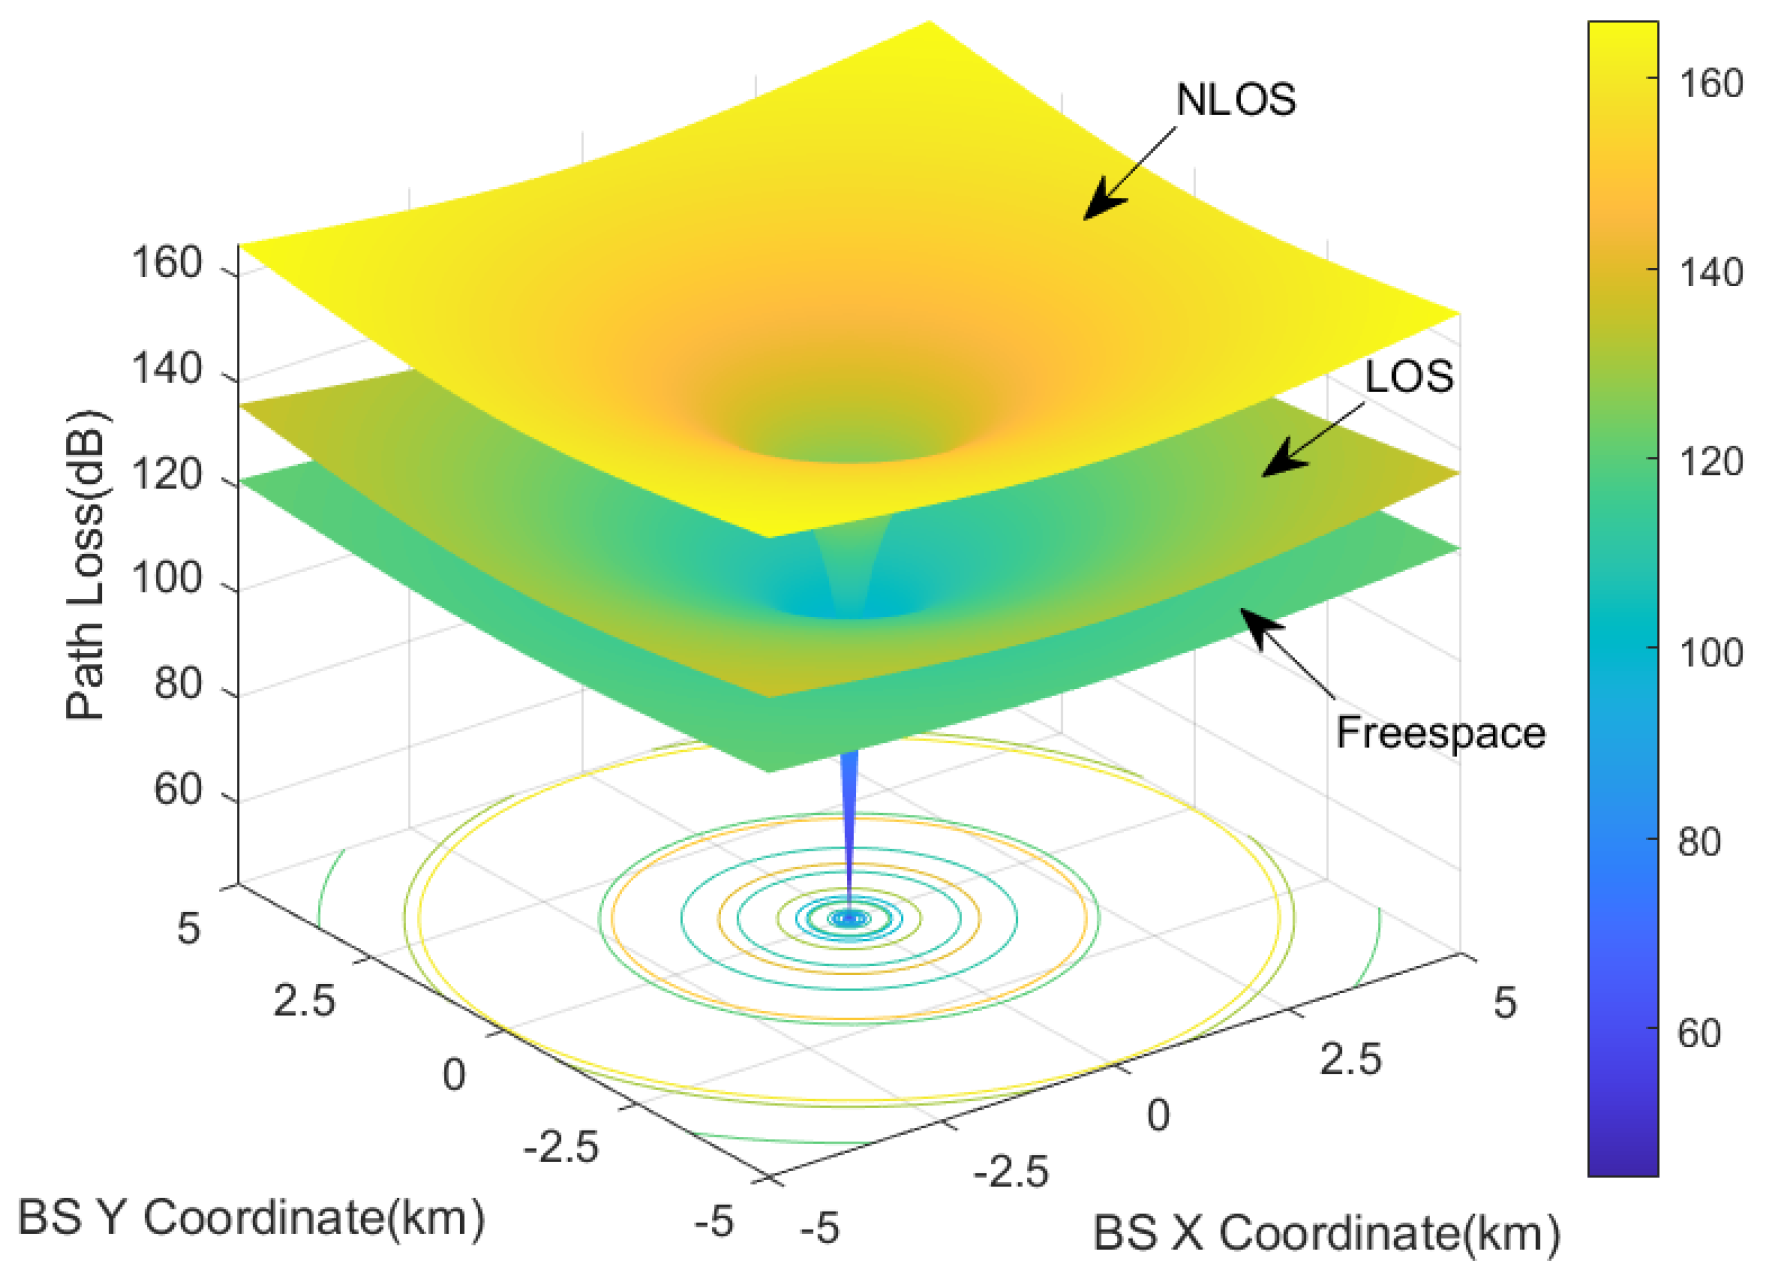
2.1.3. Path Loss
2.2. Interference Thresholds
2.3. Deployment Protection Methods
2.3.1. Prohibited Zone
| Algorithm 1 Calculation method for the prohibited zone |
|
2.3.2. Interference Mitigation Methods
| Algorithm 2 Power Control Method |
|
| Algorithm 3 Angle Shutoff Method |
|
3. Simulation Parameters
4. Results and Discussion
4.1. Prohibited Zone with Omnidirectional Antenna
4.1.1. Horizontal Prohibited Zone
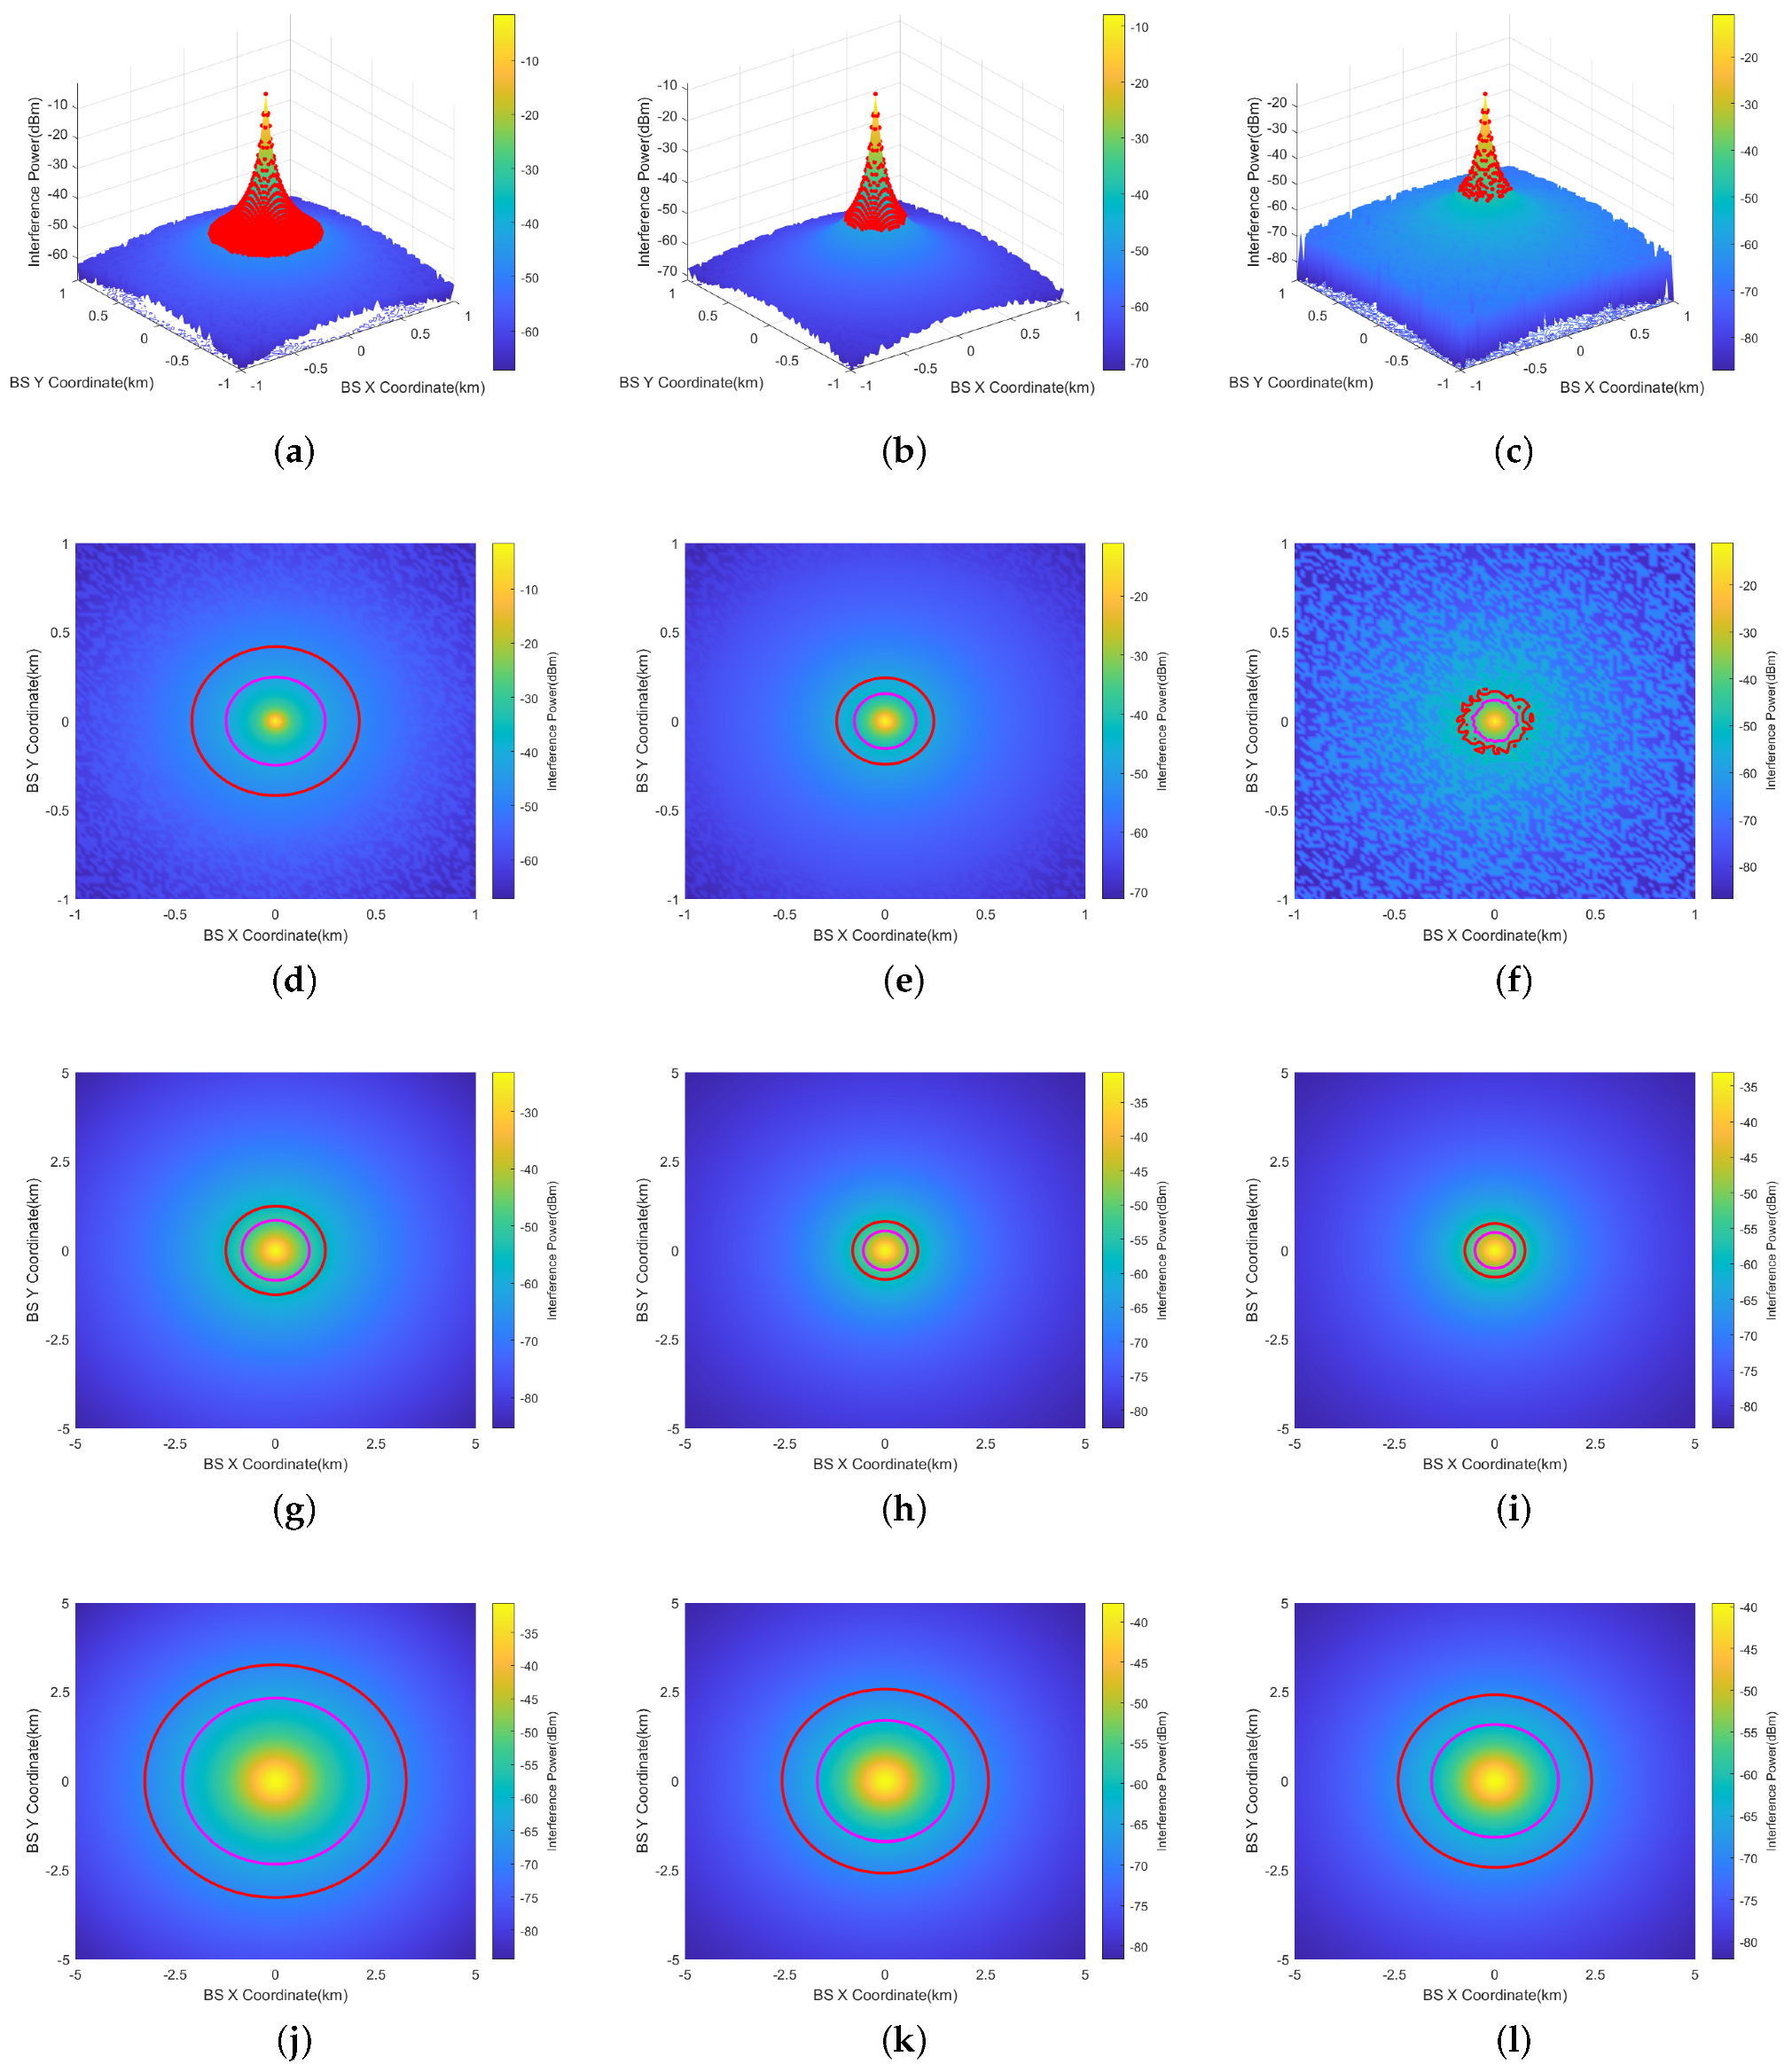
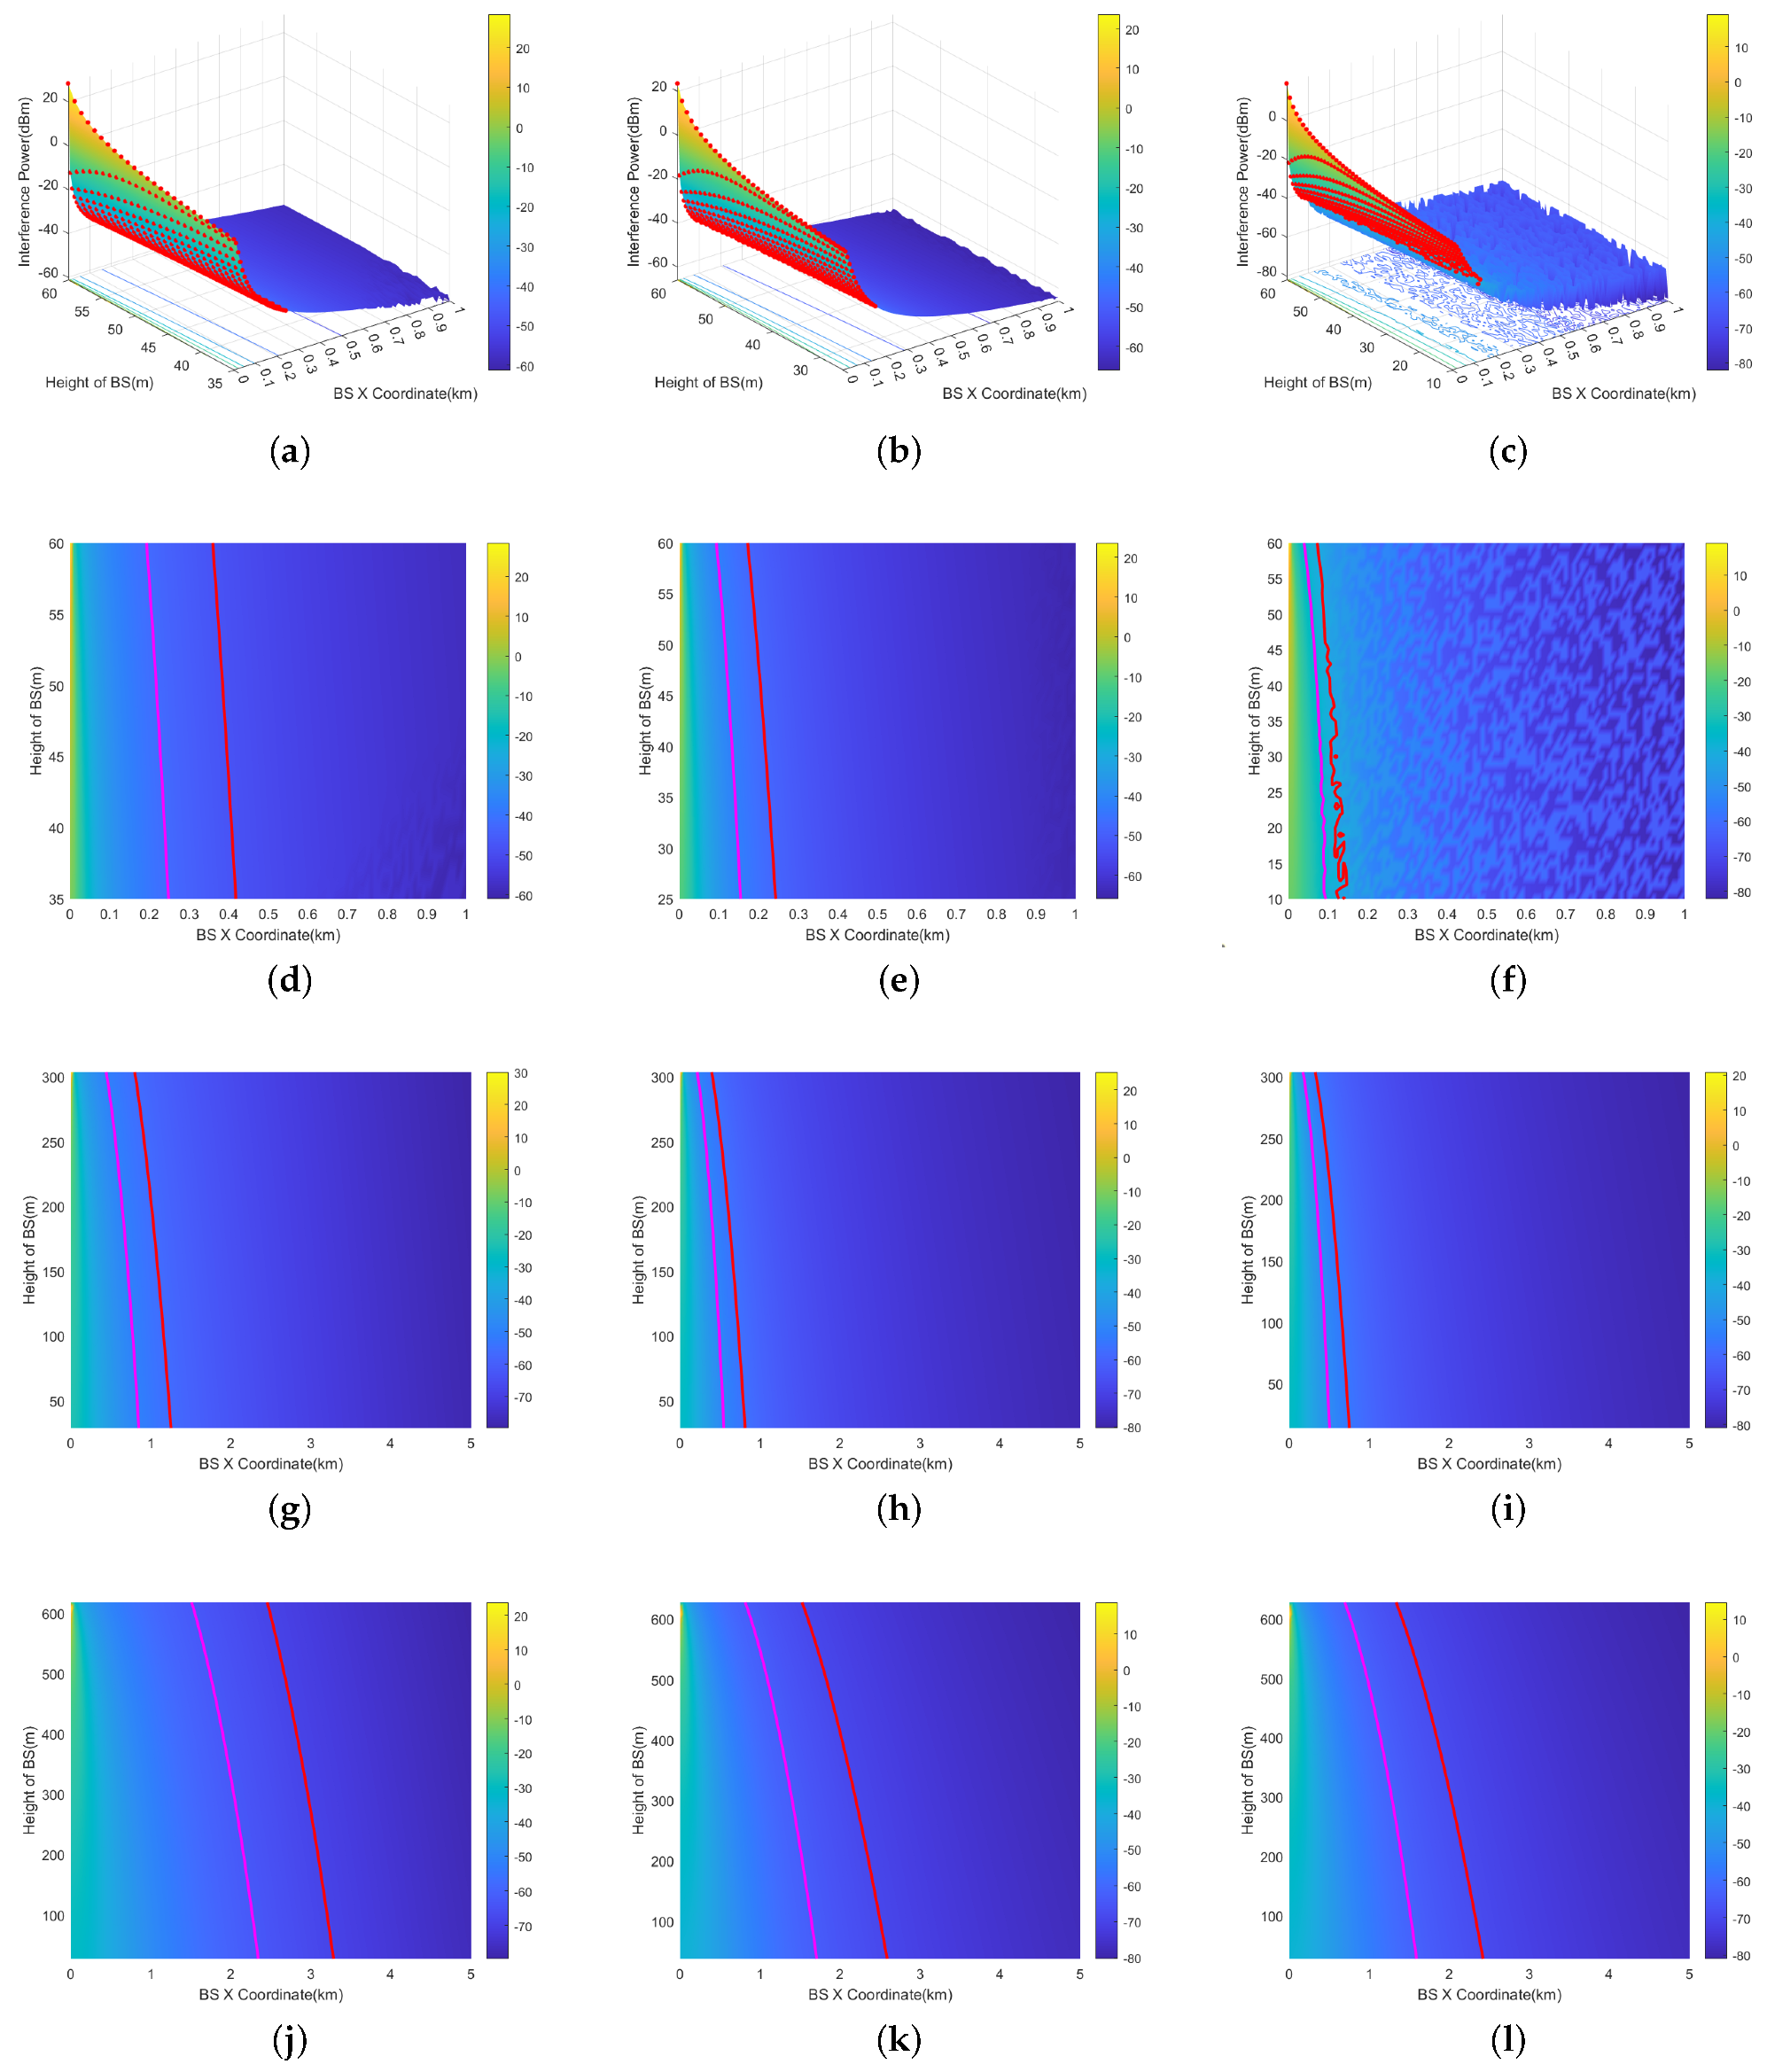
- Among the three types of base station, the prohibited zone of the RMa base station is the largest. This is primarily because the RMa base station has the highest transmission power and height.
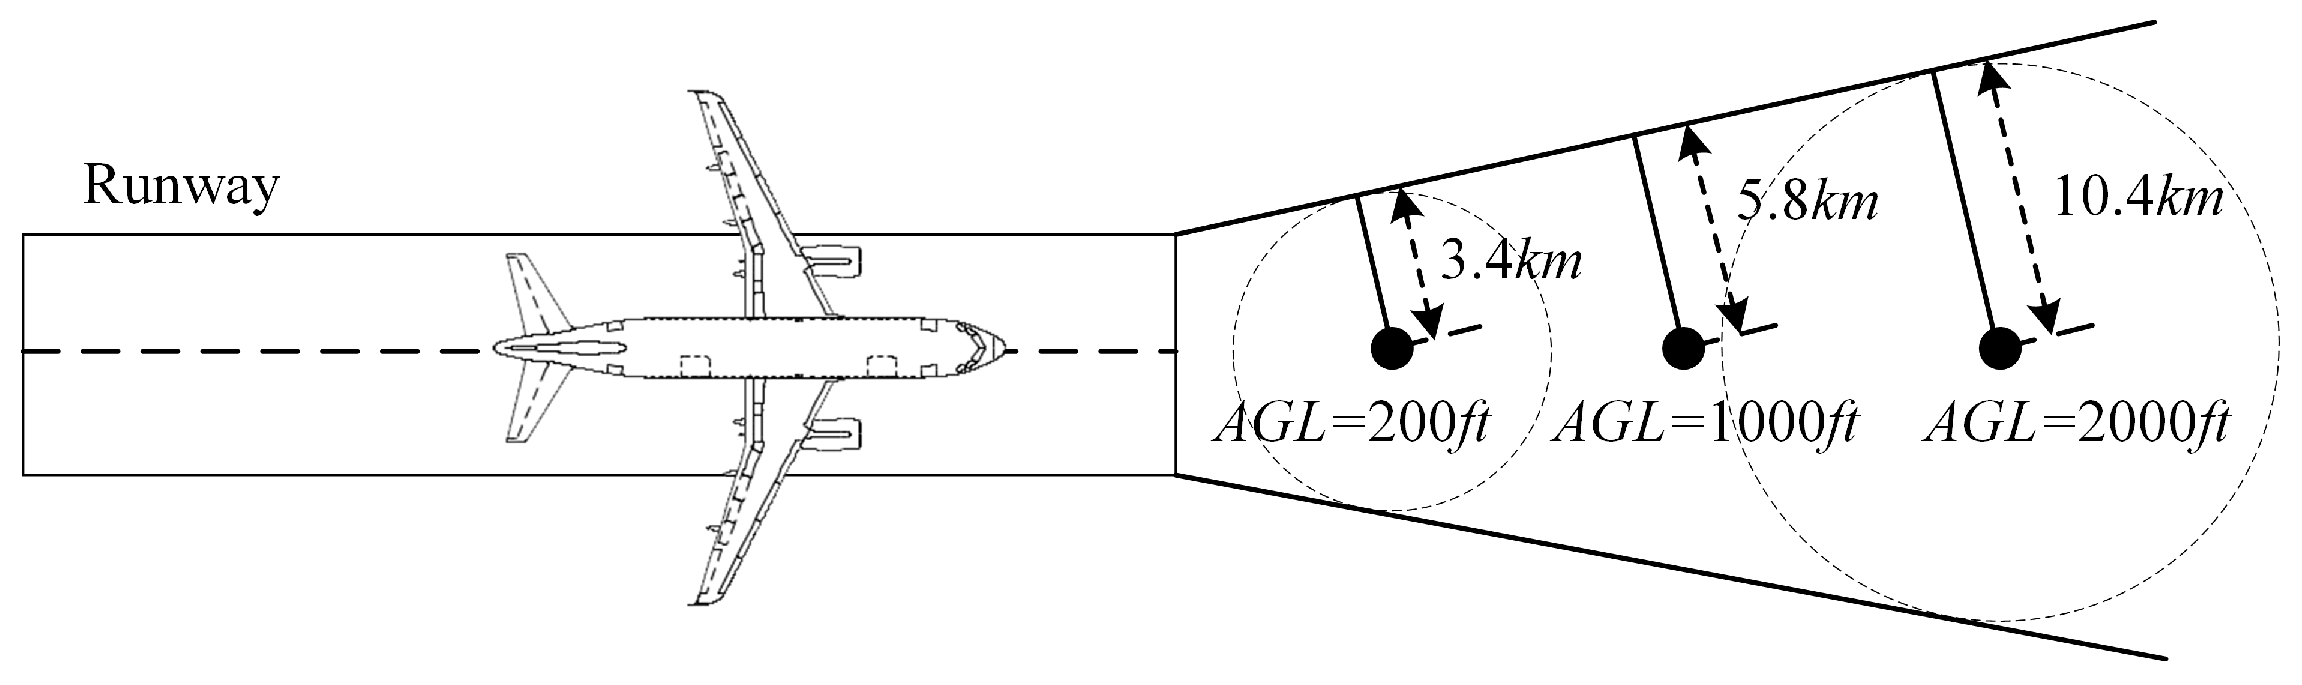
- For the same type of base station, the prohibited zone is largest when ft and smallest when ft. This is the result of the dynamic variation of both interference threshold and path loss.
- The magenta line represents the prohibited zone without considering the 6 dB margin. The ICAO 6 dB margin increases the prohibited zone radius by 0.2–0.9 km.
- The irregularity of the prohibited zones in Figure 12f is primarily attributed to the statistical feature of line-of-sight (LOS) and non-line-of-sight (NLOS) path loss, assuming that the occurrence probabilities of both LOS and NLOS are equal to 50%. In UMi scenario, there is a significant difference in the attenuation between LOS and NLOS due to the fact that the UMi base station has a height of 10 m, which is the lowest among the three types of base stations. This results in a greater difference in attenuation between NLOS and LOS. In Figure 12i,l, with ft, 2000 ft, the aircraft is at a higher altitude. The path loss is nearly identical between the LOS and NLOS scenarios, and the statistical feature of path loss is not pronounced. As a result, the prohibited zone does not exhibit irregularity.
4.1.2. Vertical Prohibited Zone
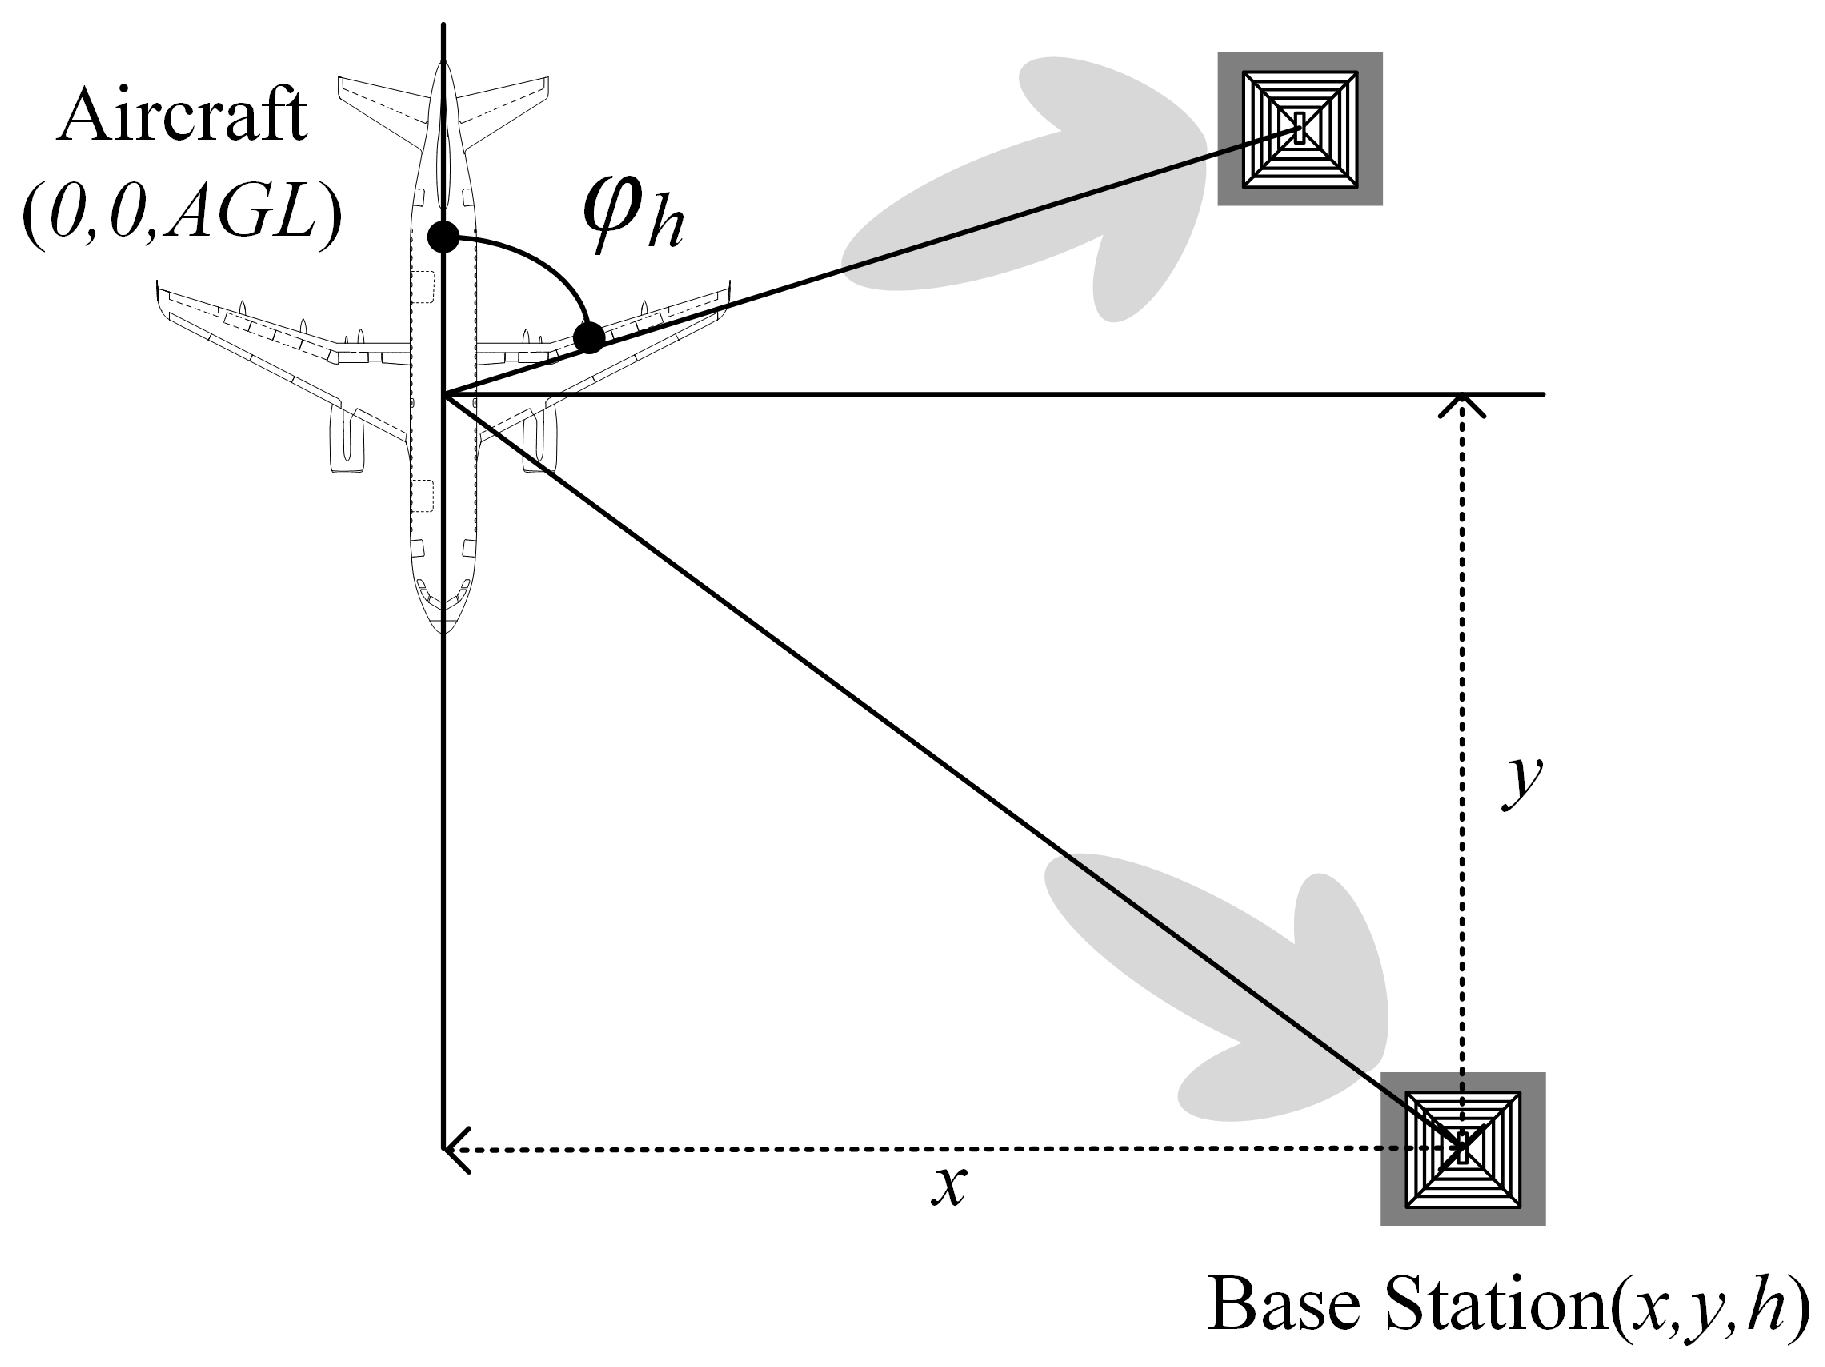
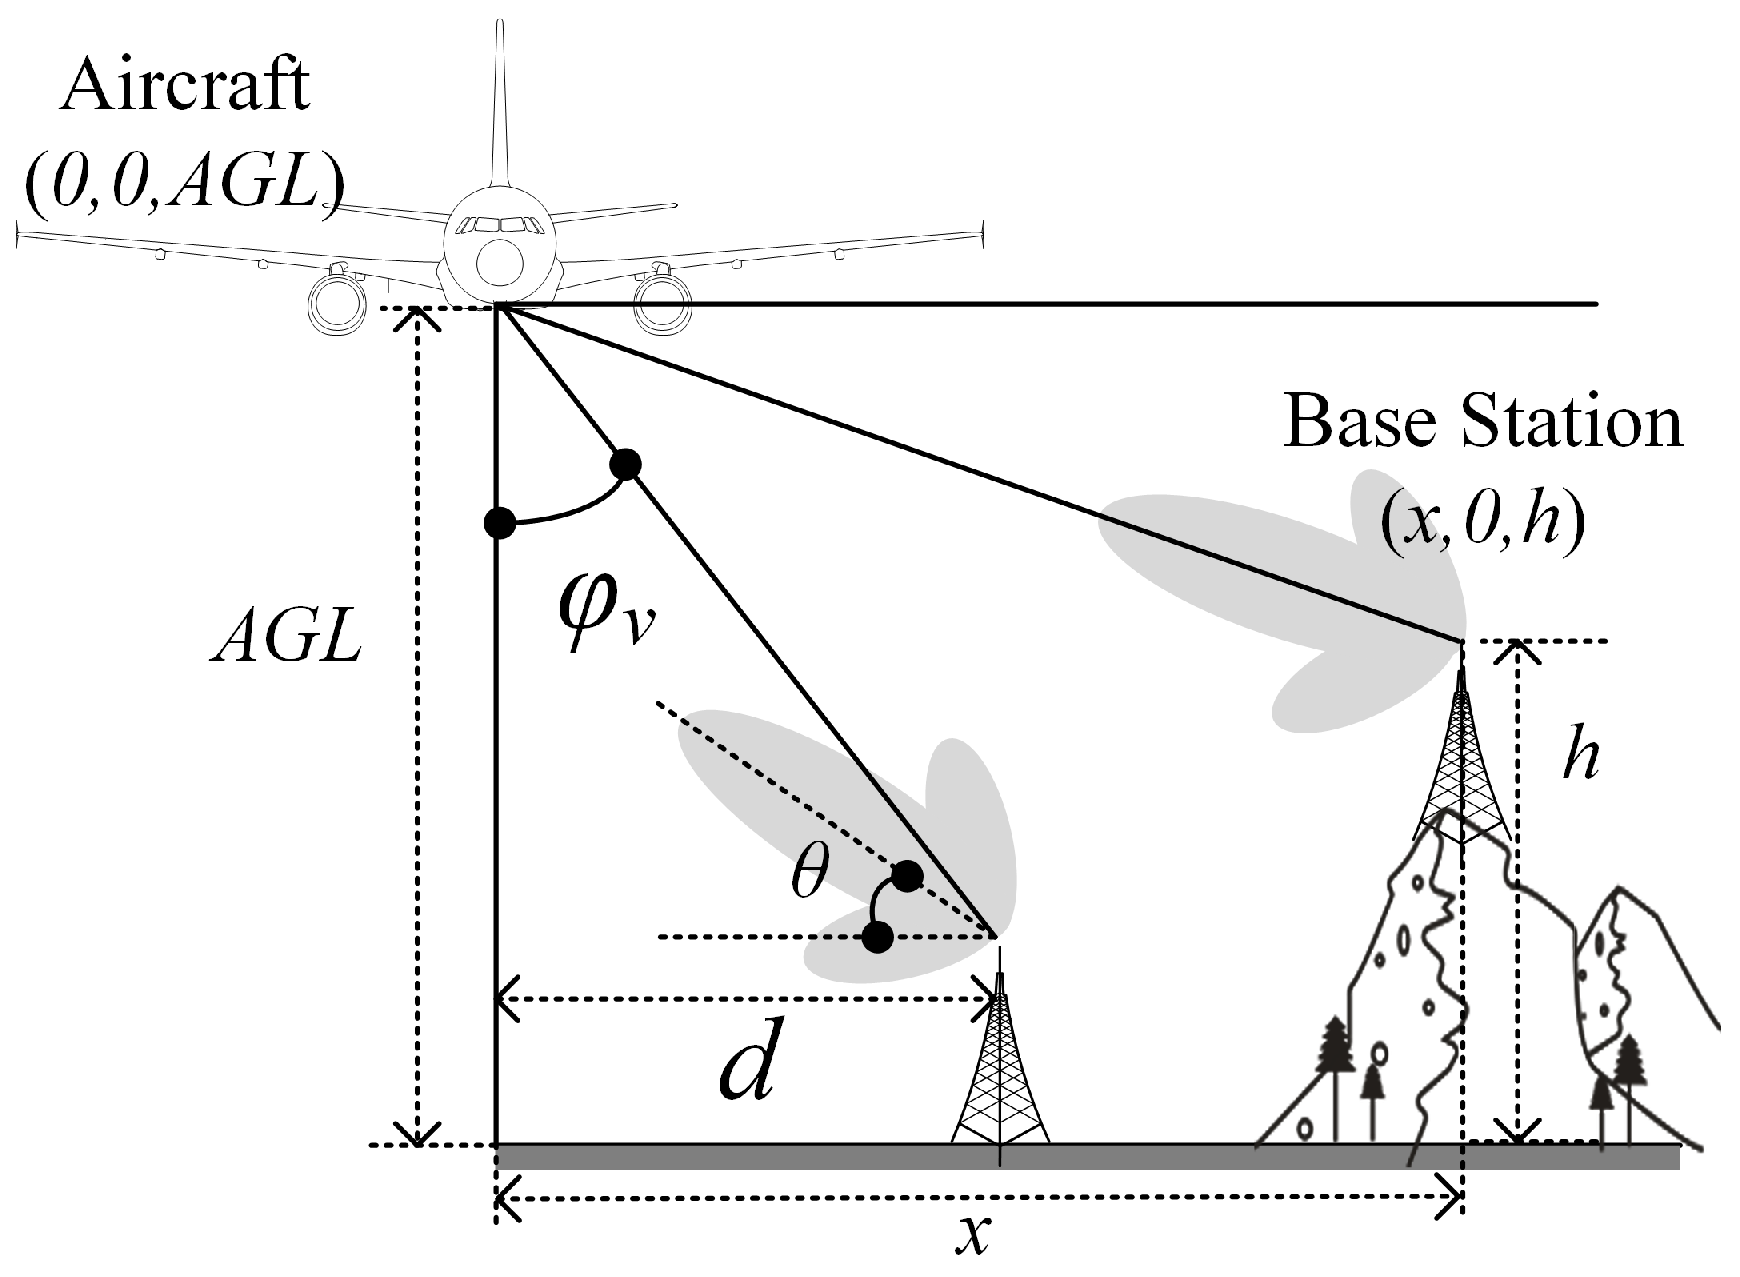
- The radius of the vertical prohibited zone varies with height. This is mainly due to the fact that the gain of the RA antenna varies at different angles. Its ability to receive interference is also different. At higher altitudes close to the aircraft’s altitude AGL, the angle () in Figure 10 is bigger, and the gain decreases accordingly.
- Similar to the horizontal prohibited zone, the largest vertical prohibited zone occurs with the RMa base station at 2000 ft. The magenta line represents the ICAO 6 dB margin, which increases the prohibited zone radius by 0.2–1.1 km. The path loss of NLOS and LOS is the most significant in the UMi scenario.

4.2. Prohibited Zone with Beamforming Antenna
- (1)
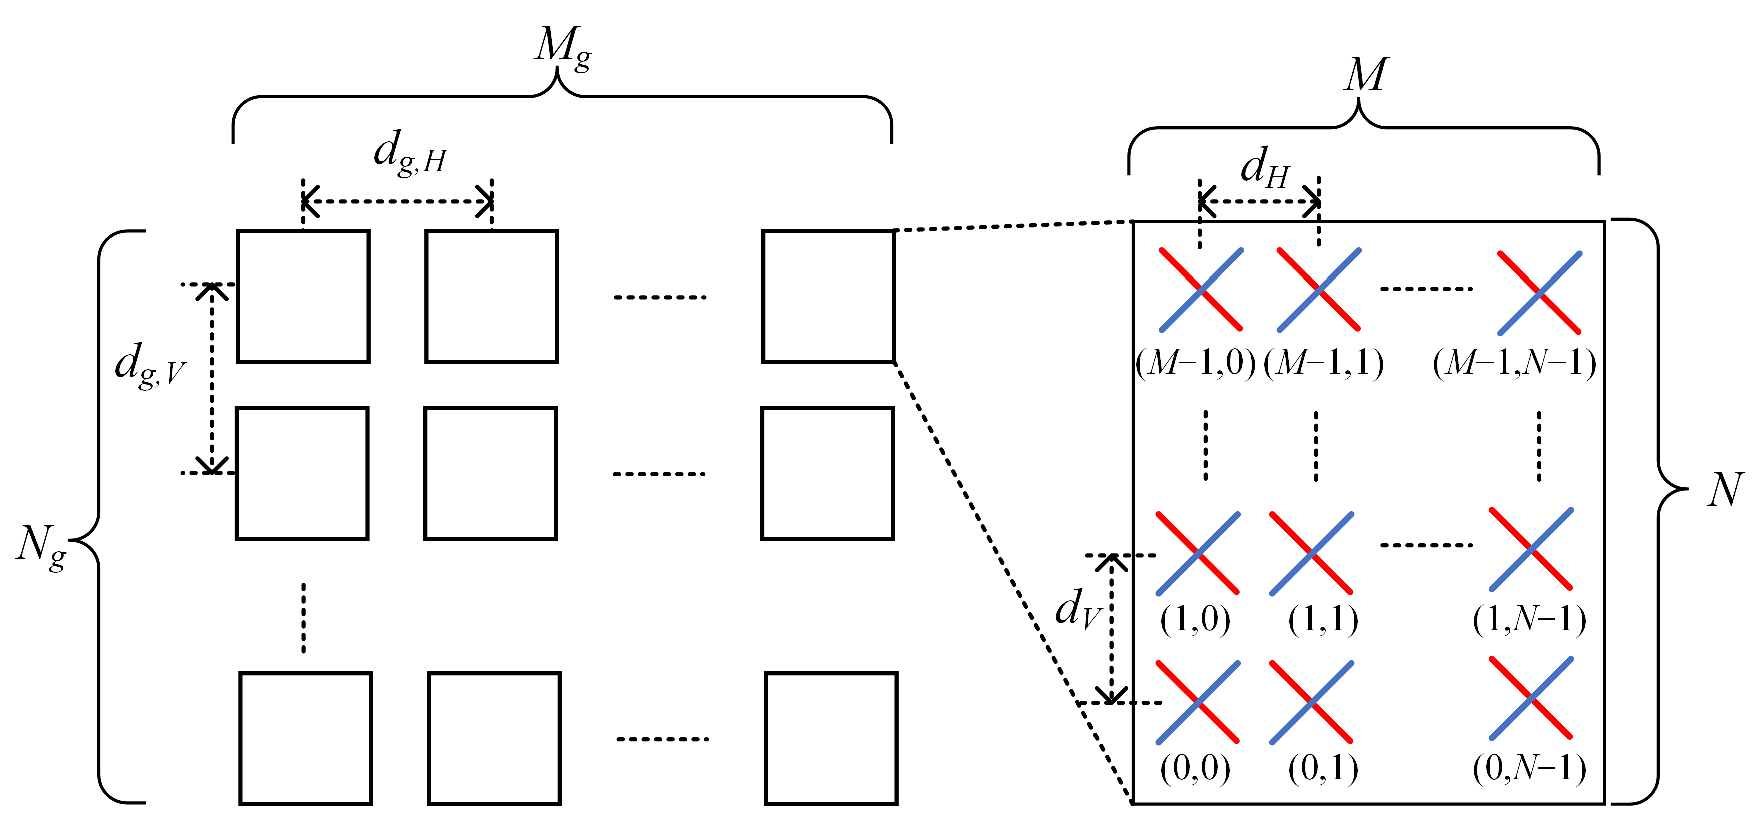
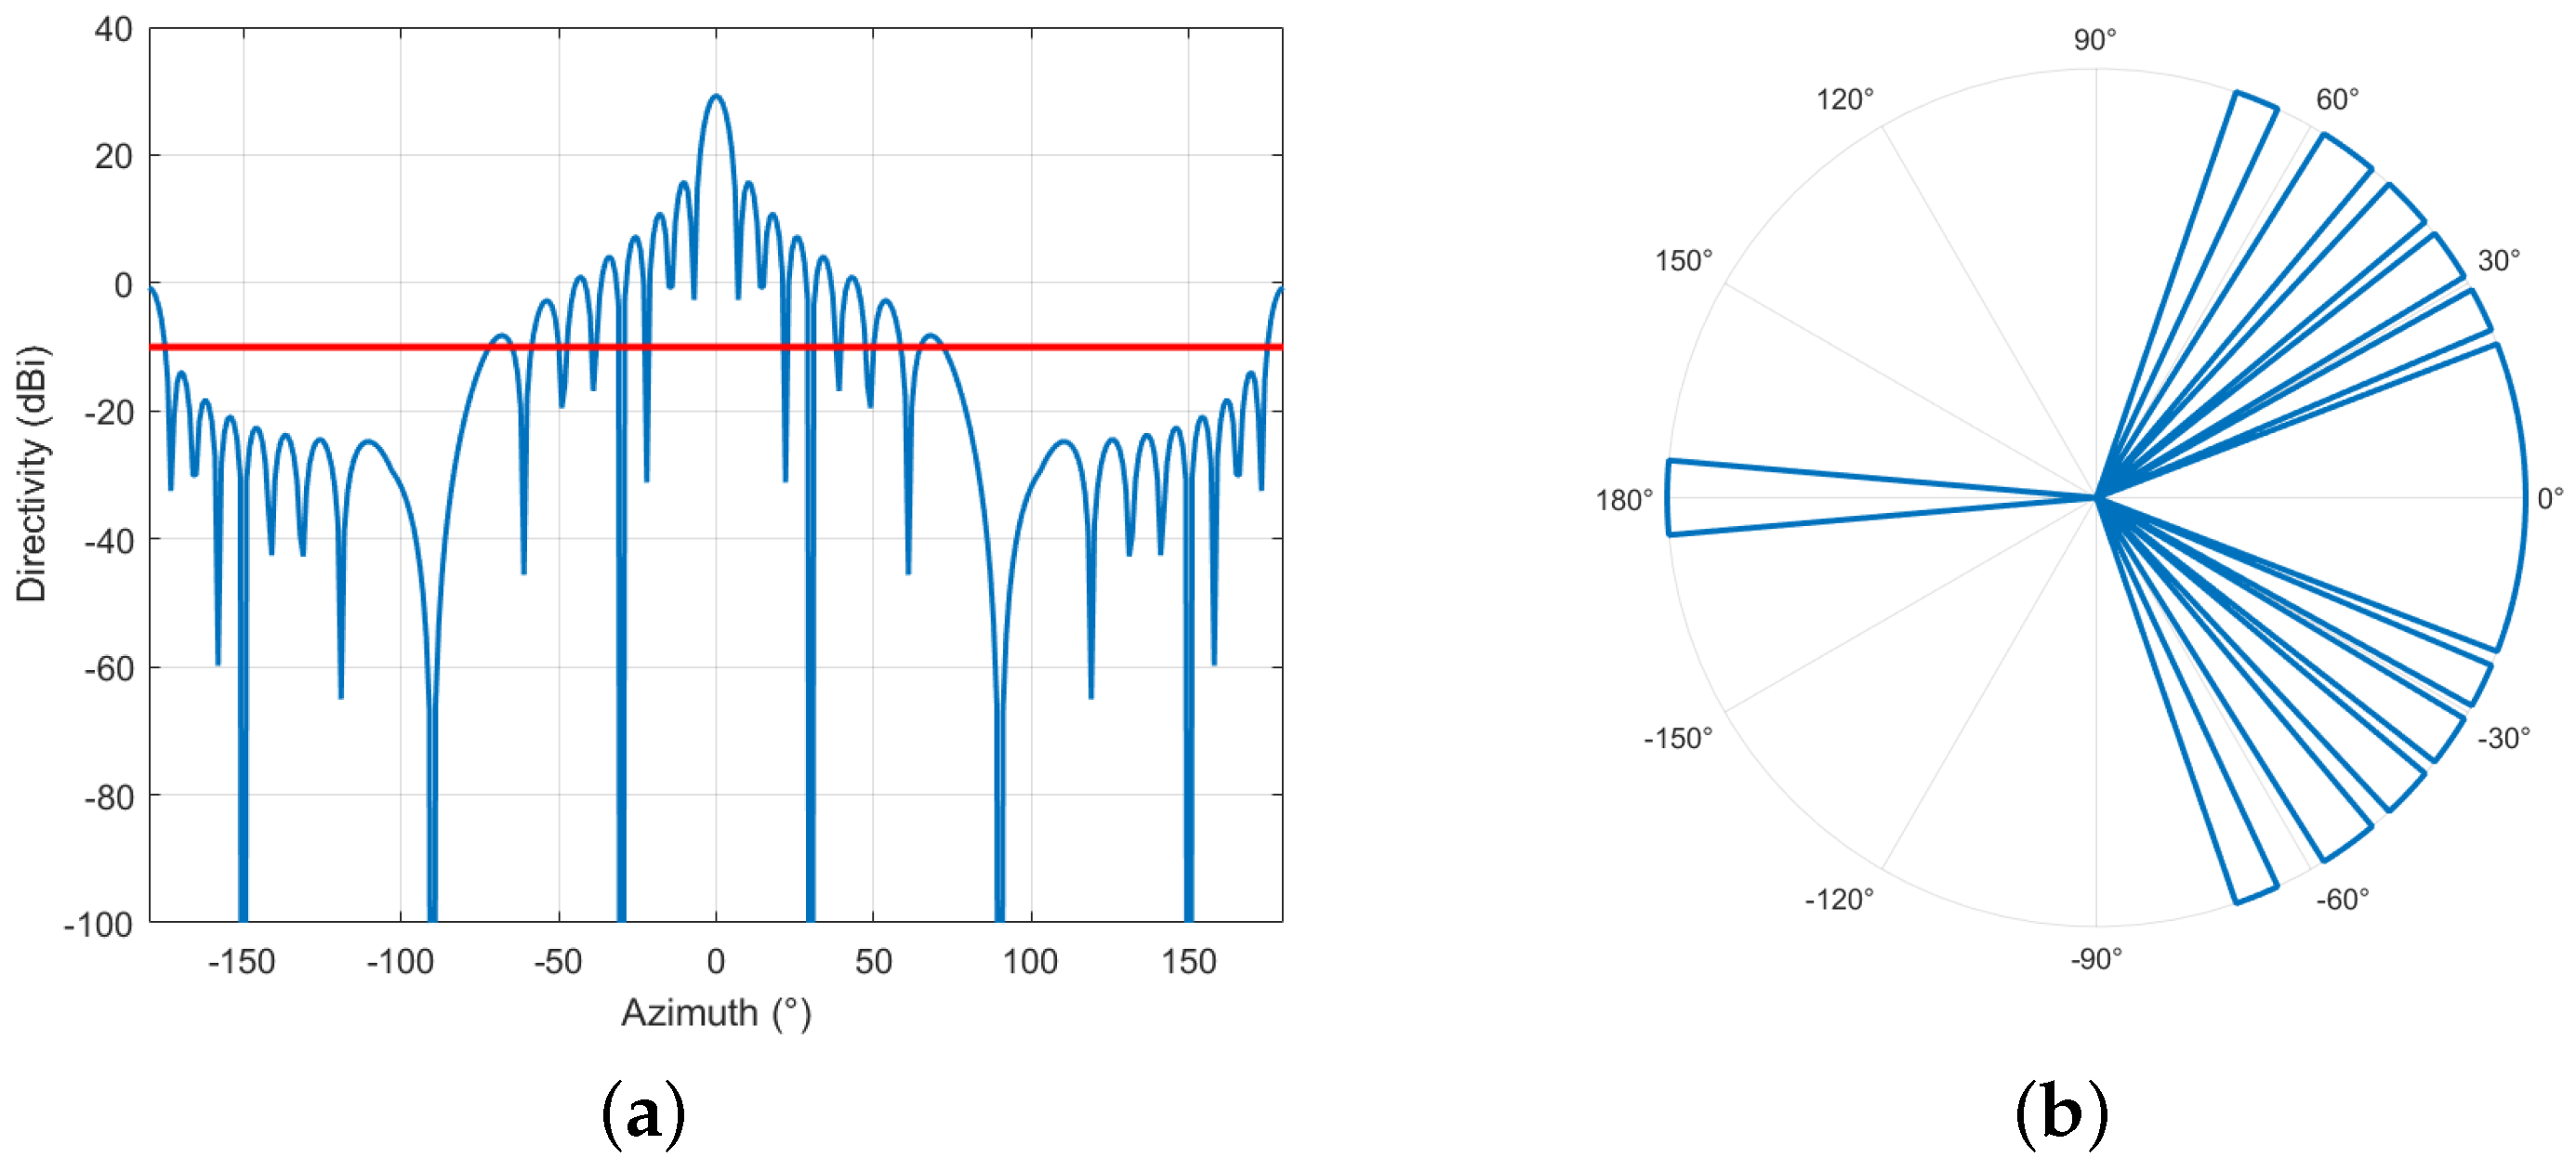
- A commonly used 16 × 16 beamforming antenna is selected.
- (2)
- The main lobe of the beamforming antenna can sweep in a range horizontally using electronic steering technology.
- (3)
- The main lobe of the beamforming antenna can sweep in range of 0– vertically. The angle between the main lobe and the horizontal plane is the vertical scan angle () (), as shown in Figure 10.
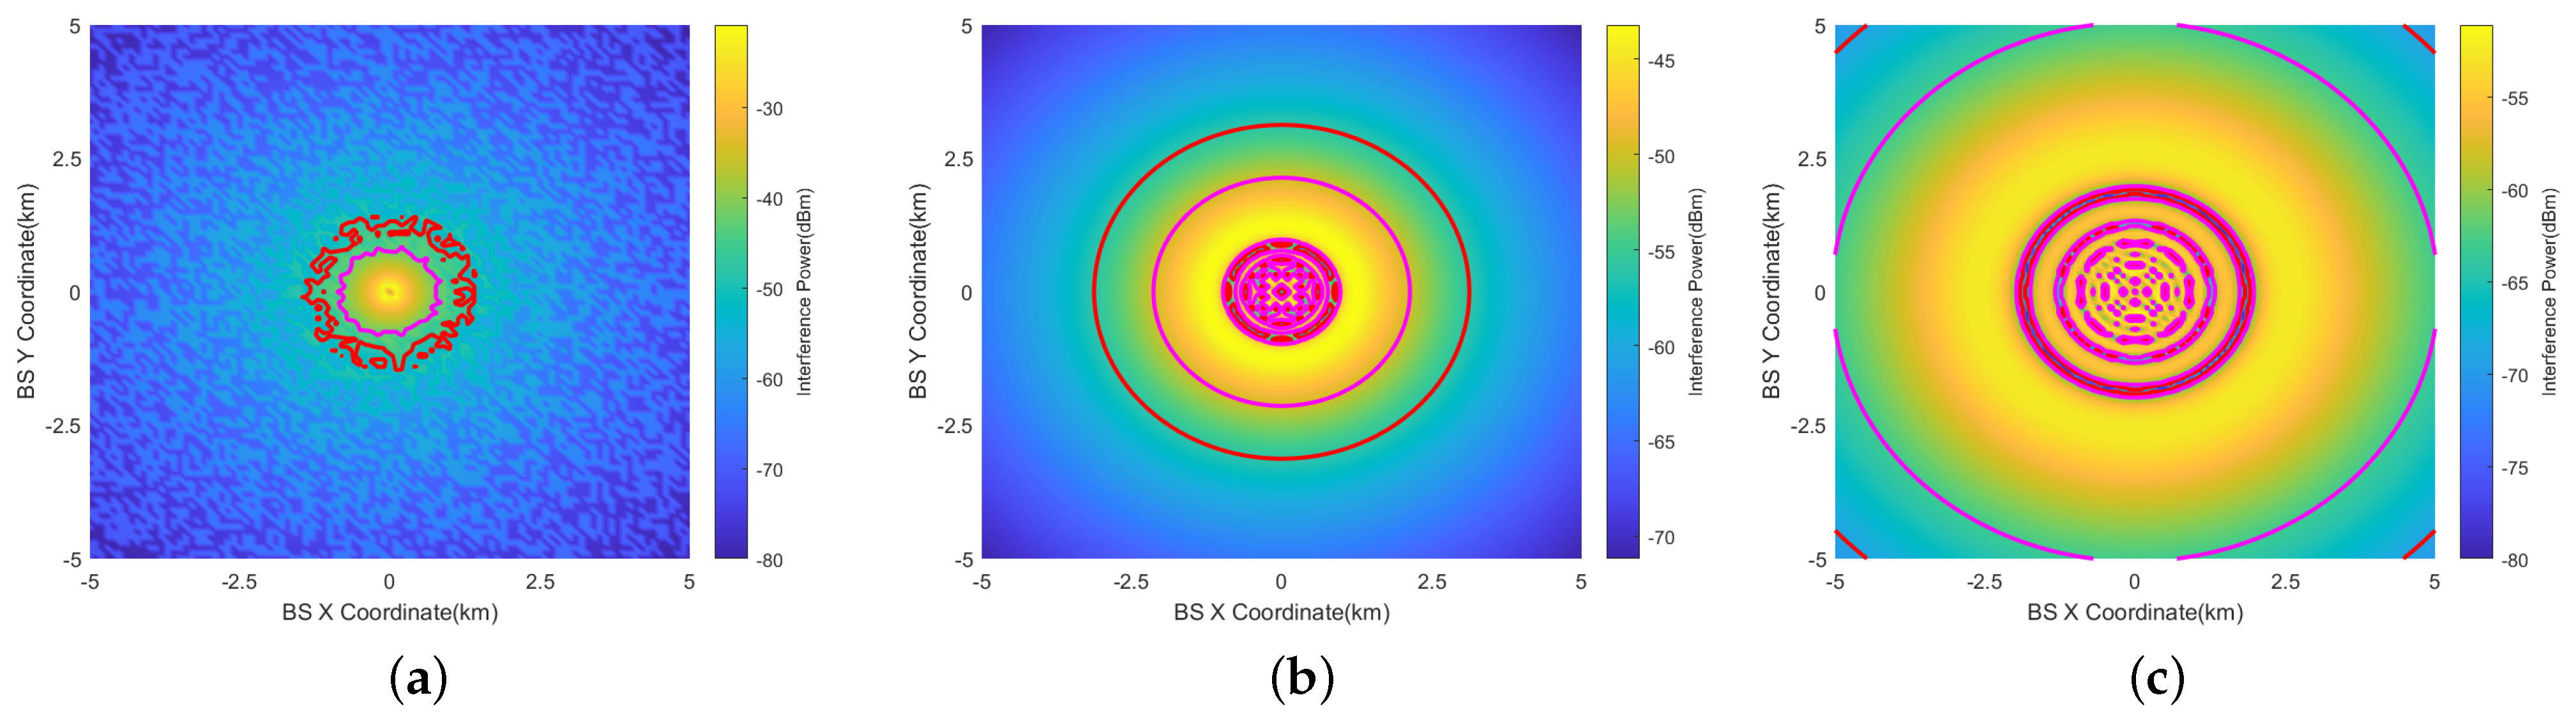
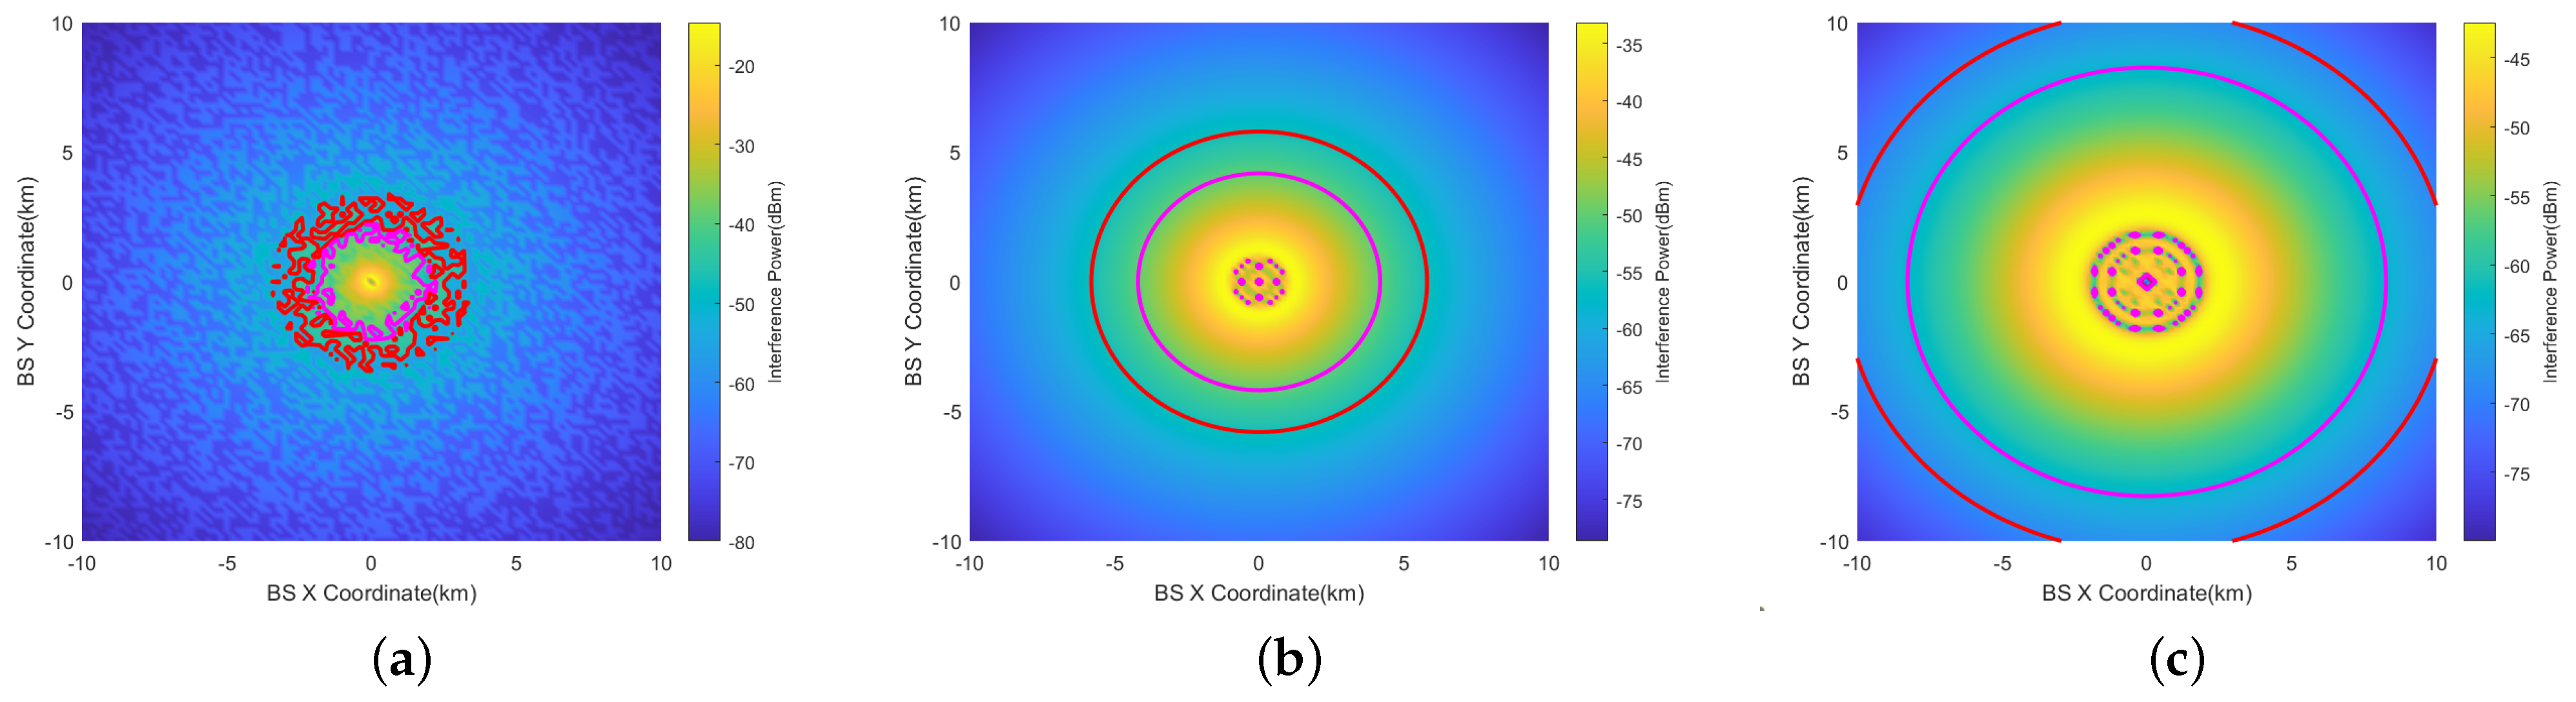
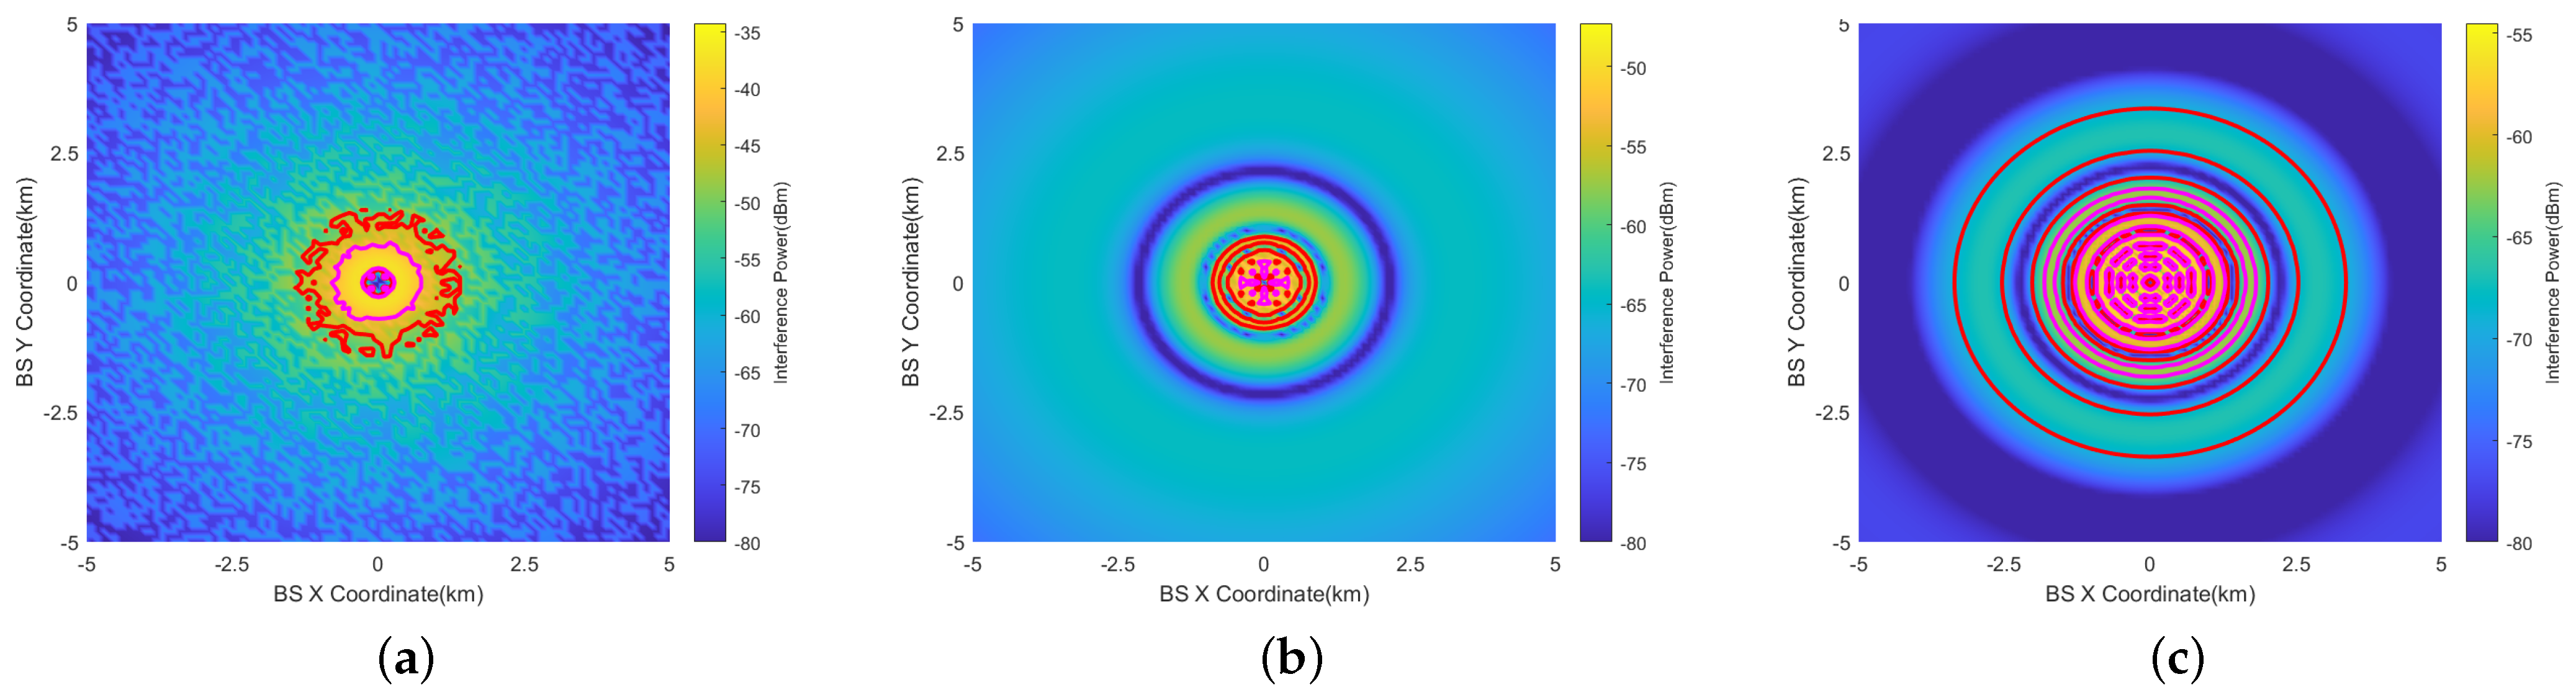
4.2.1. Horizontal Prohibited Zone
- The largest prohibited zone occurs at ft. The prohibited zone at ft is smaller than that at ft. This is because at 1000 ft, the interference is mainly generated by the side lobes of the antenna.
- Within the prohibited zone (the largest red circle), there are still multiple smaller red circles. This is most evident in Figure 14c. This occurs because there are angles with minimal gain between different lobes of the beamforming antenna. At these angles, the interference is minimal. These smaller circles should be disregarded when determining the size of the prohibited zone.
- The prohibited zone of RMa exhibits irregular characteristics when ft. The statistical features of LOS and NLOS can manifest at the edges of the prohibited zone. However, these features are not evident when ft at 2000 ft.
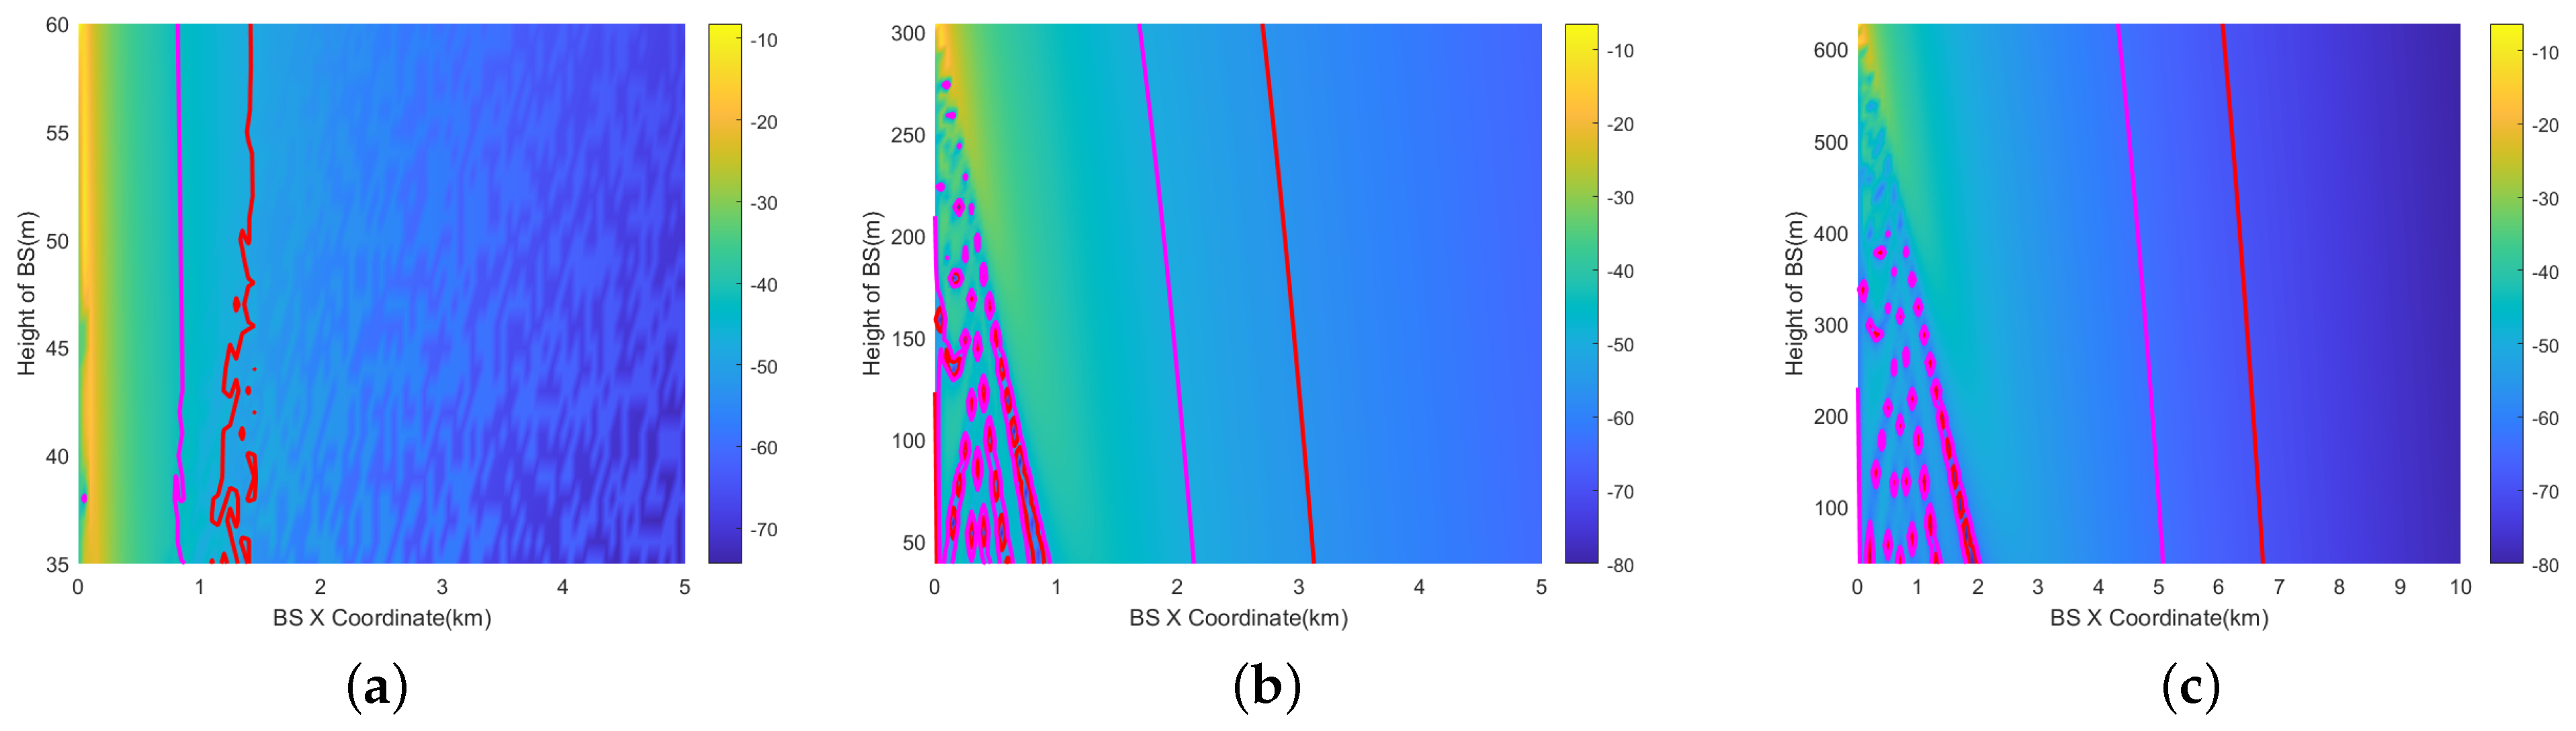
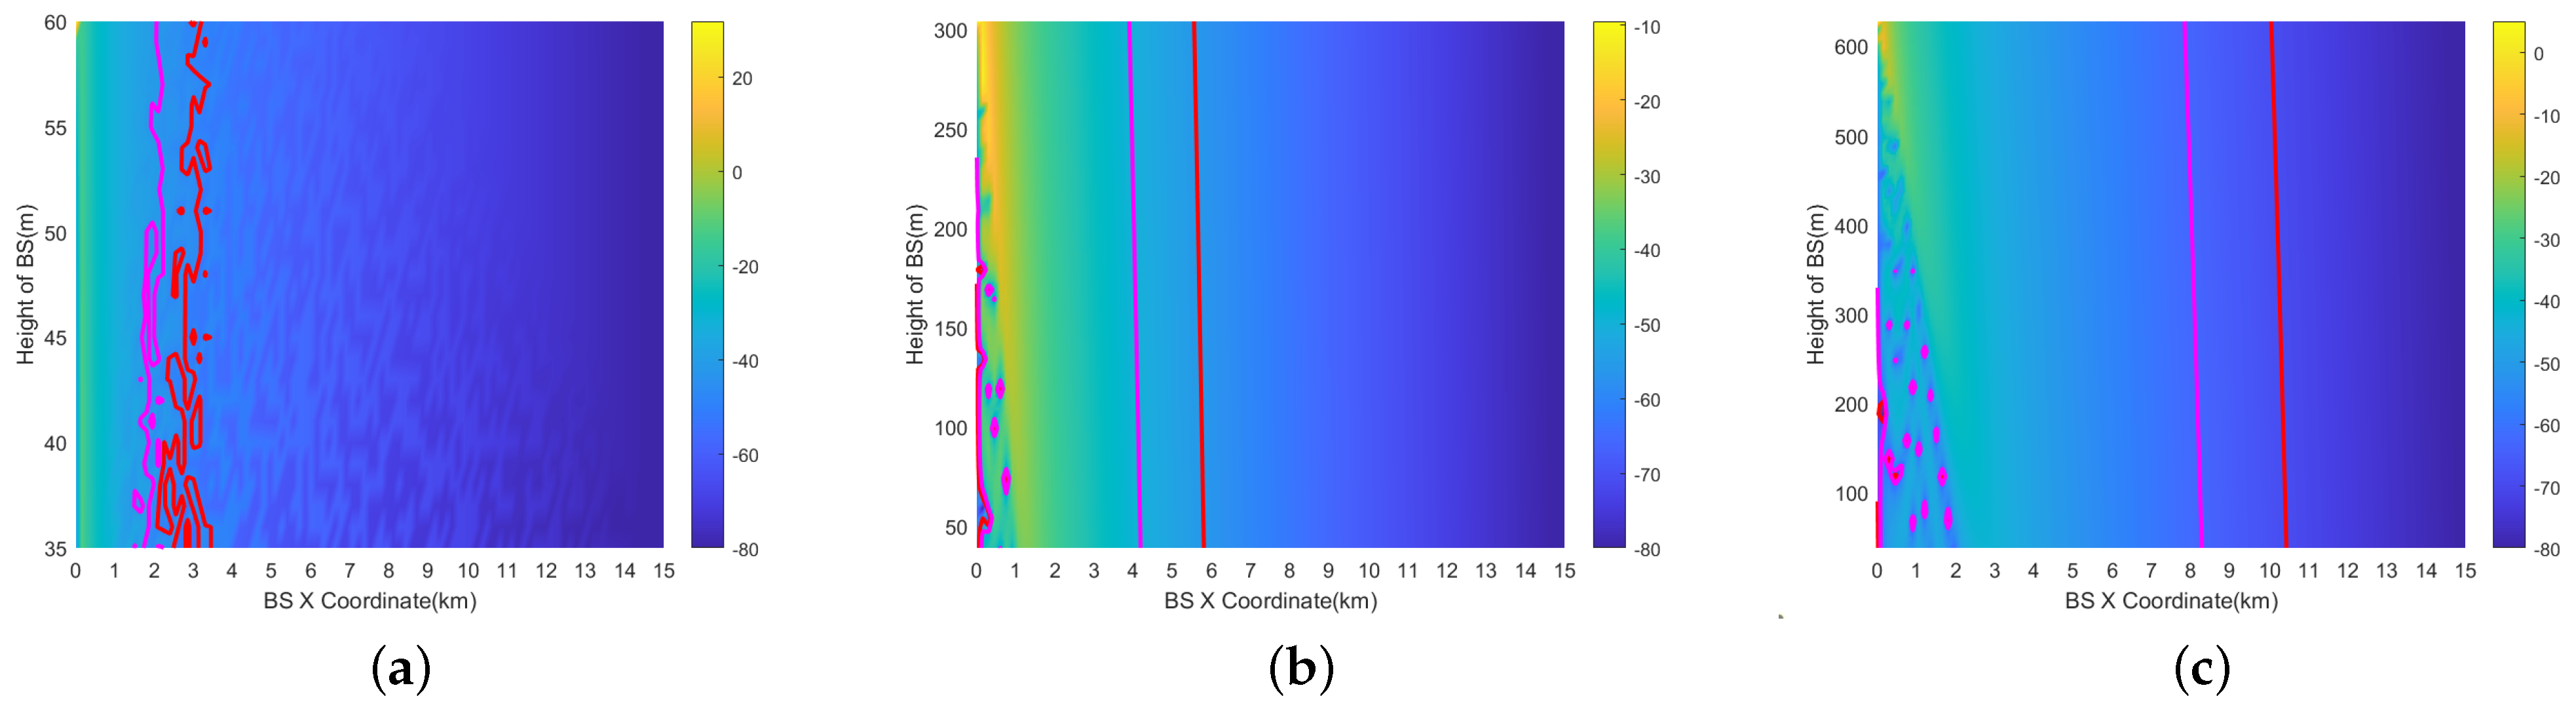
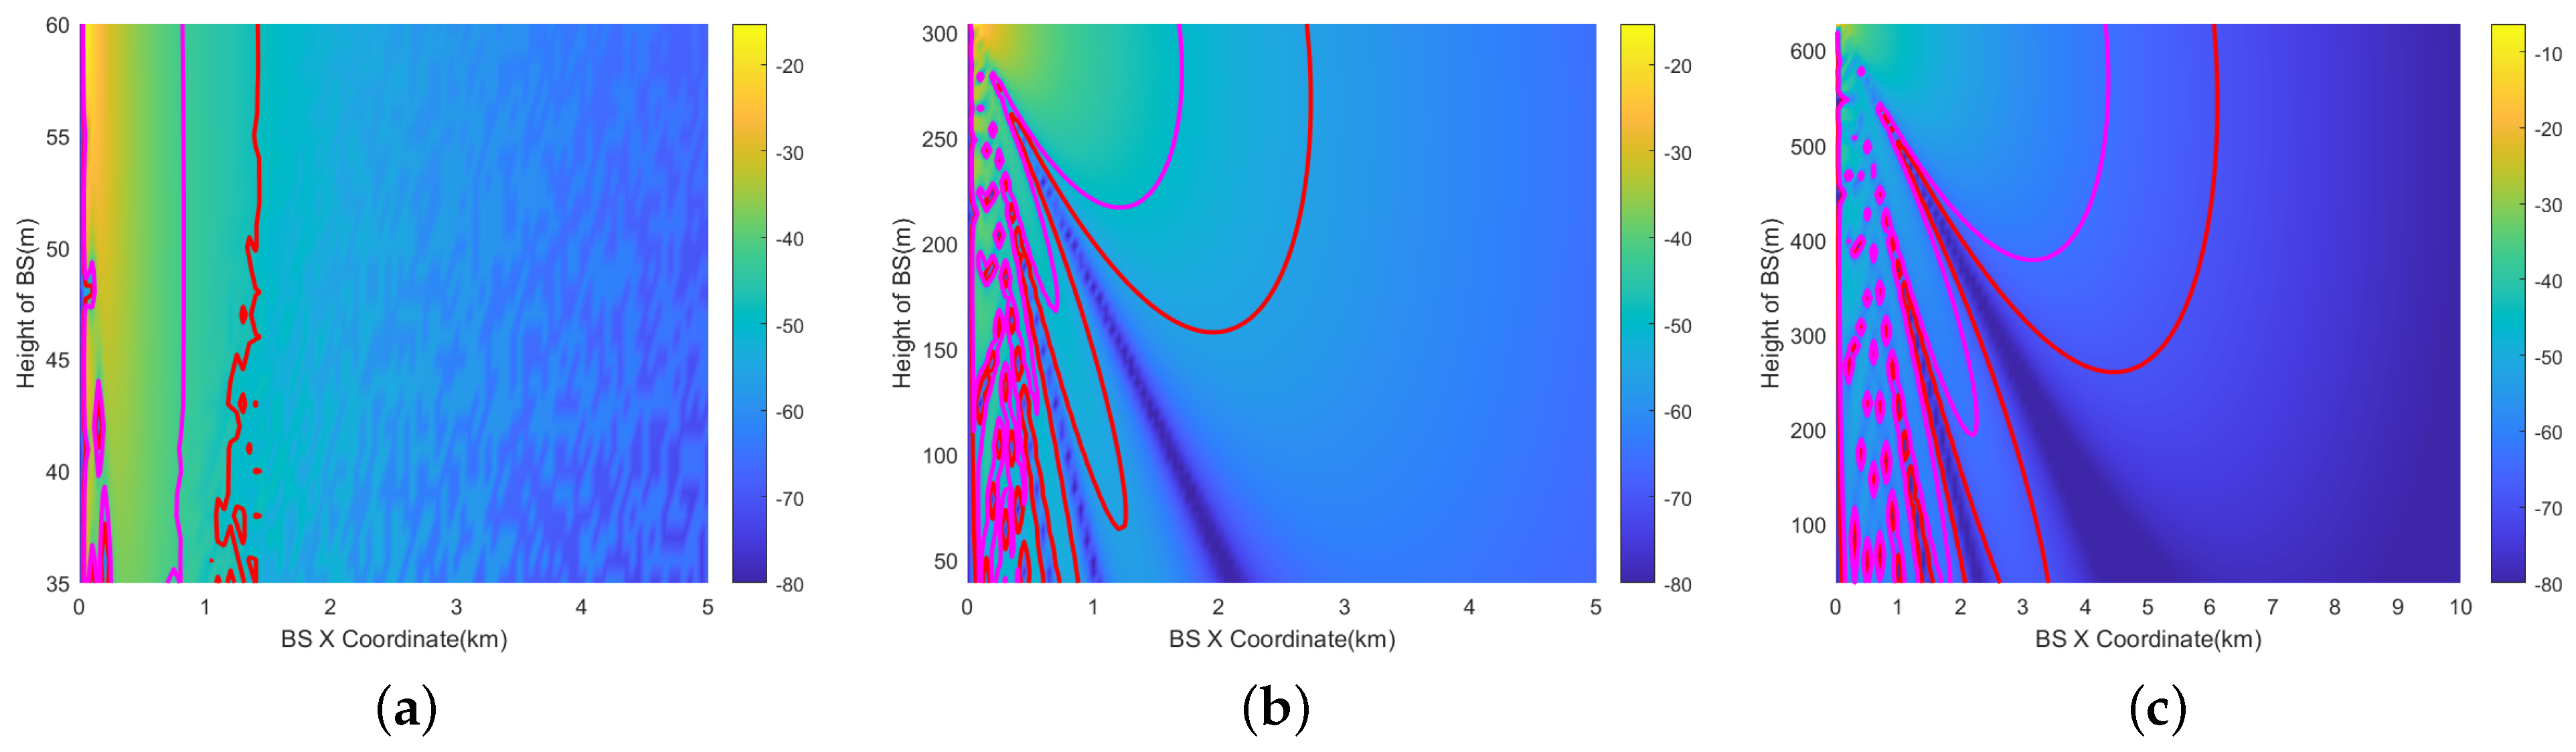
4.2.2. Vertical Prohibited Zone
- The largest prohibited zone occurs at ft. At 200 ft (60.96 m), the radius of the prohibited zone shows little variation within the 0–200 ft height range. At 1000 ft (304.6 m), the radius of the vertical prohibited zone exhibits a significant change, ranging from 0.9 km to 2.8 km. Due to interference from side lobes, the shape of the prohibited zone becomes complex. At 2000 ft (609.6 m), the shape of the prohibited zone is similar to 1000 ft, varying from 3.4 km to 6.1 km.
- This implies that even when the aircraft reaches flight altitudes of 1000 ft or 2000 ft, stations on the mountain located as far as 2.8 km and 6.1 km away can still cause interference. However, base stations on the ground do not cause interference.
- At 200 ft, the impact of is minimal. At 1000 ft, there is a notable change in the shape of the vertical prohibited zone, primarily due to the aircraft being within the main lobe range of the antenna. At 2000 ft, the shape of the vertical prohibited zone is similar to that at 1000 feet, with a range of change from 6.2 km to 6.7 km.
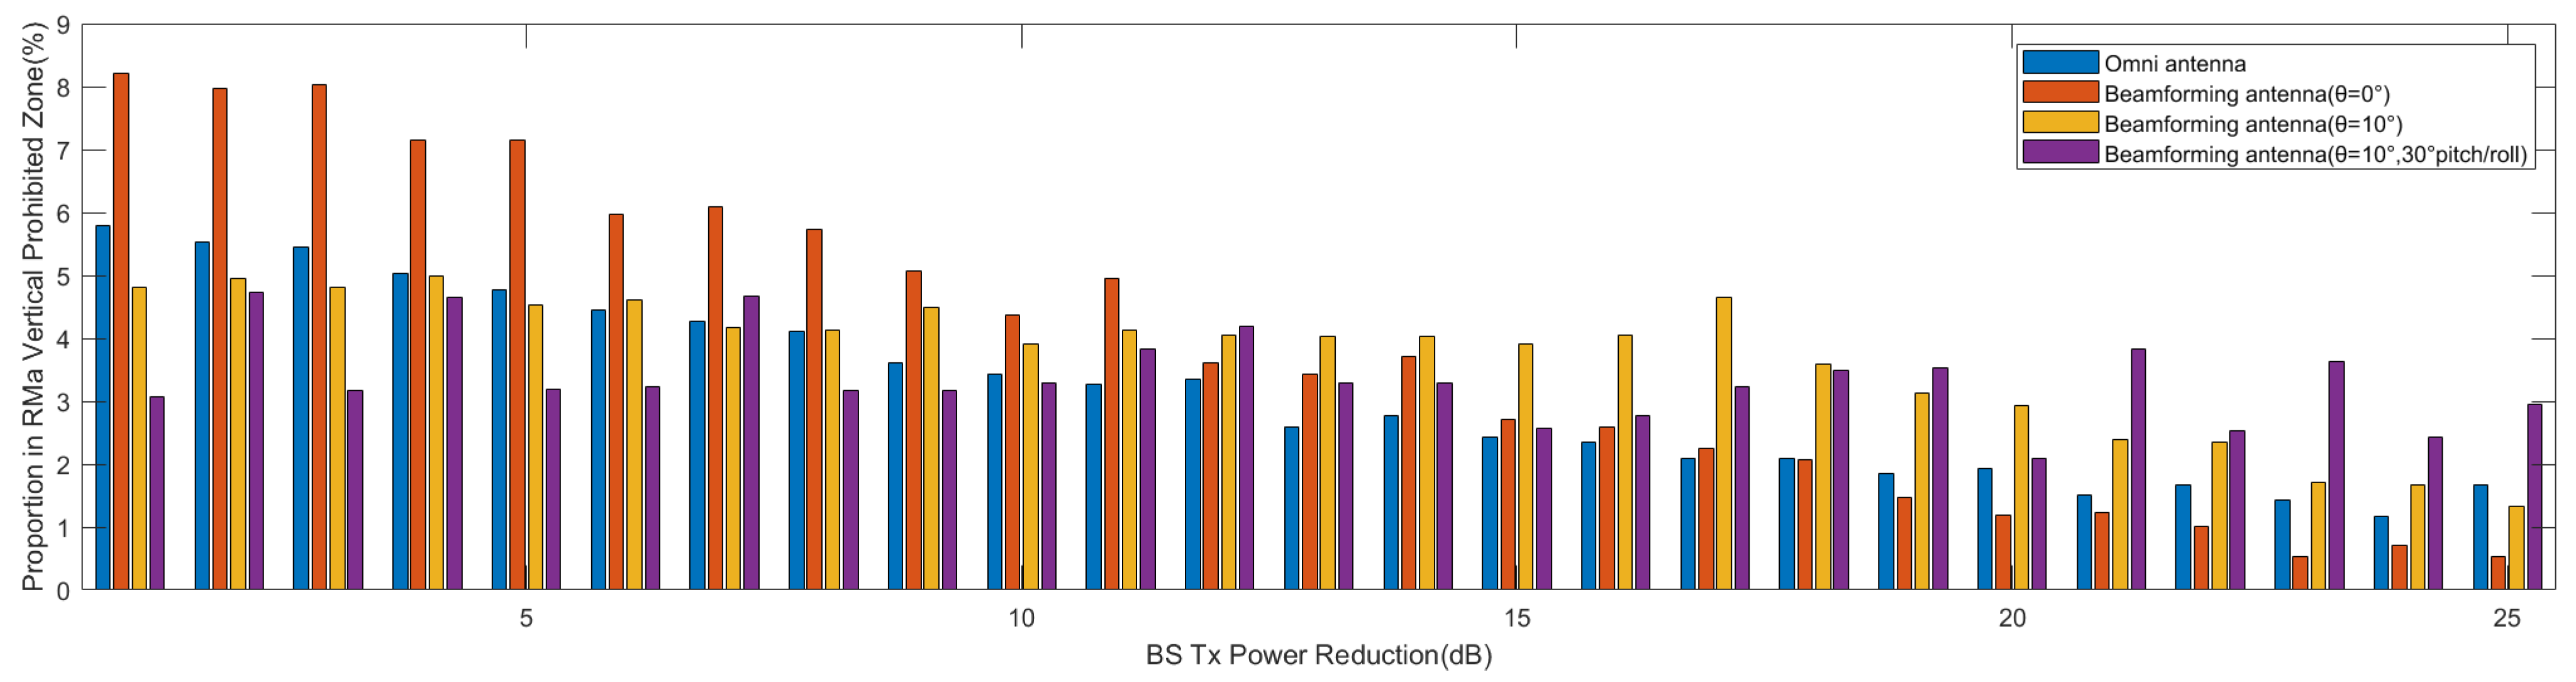
4.3. Effect of Aircraft Pitch\Roll Angle
4.4. Interference Mitigation Methods in Prohibited Zone
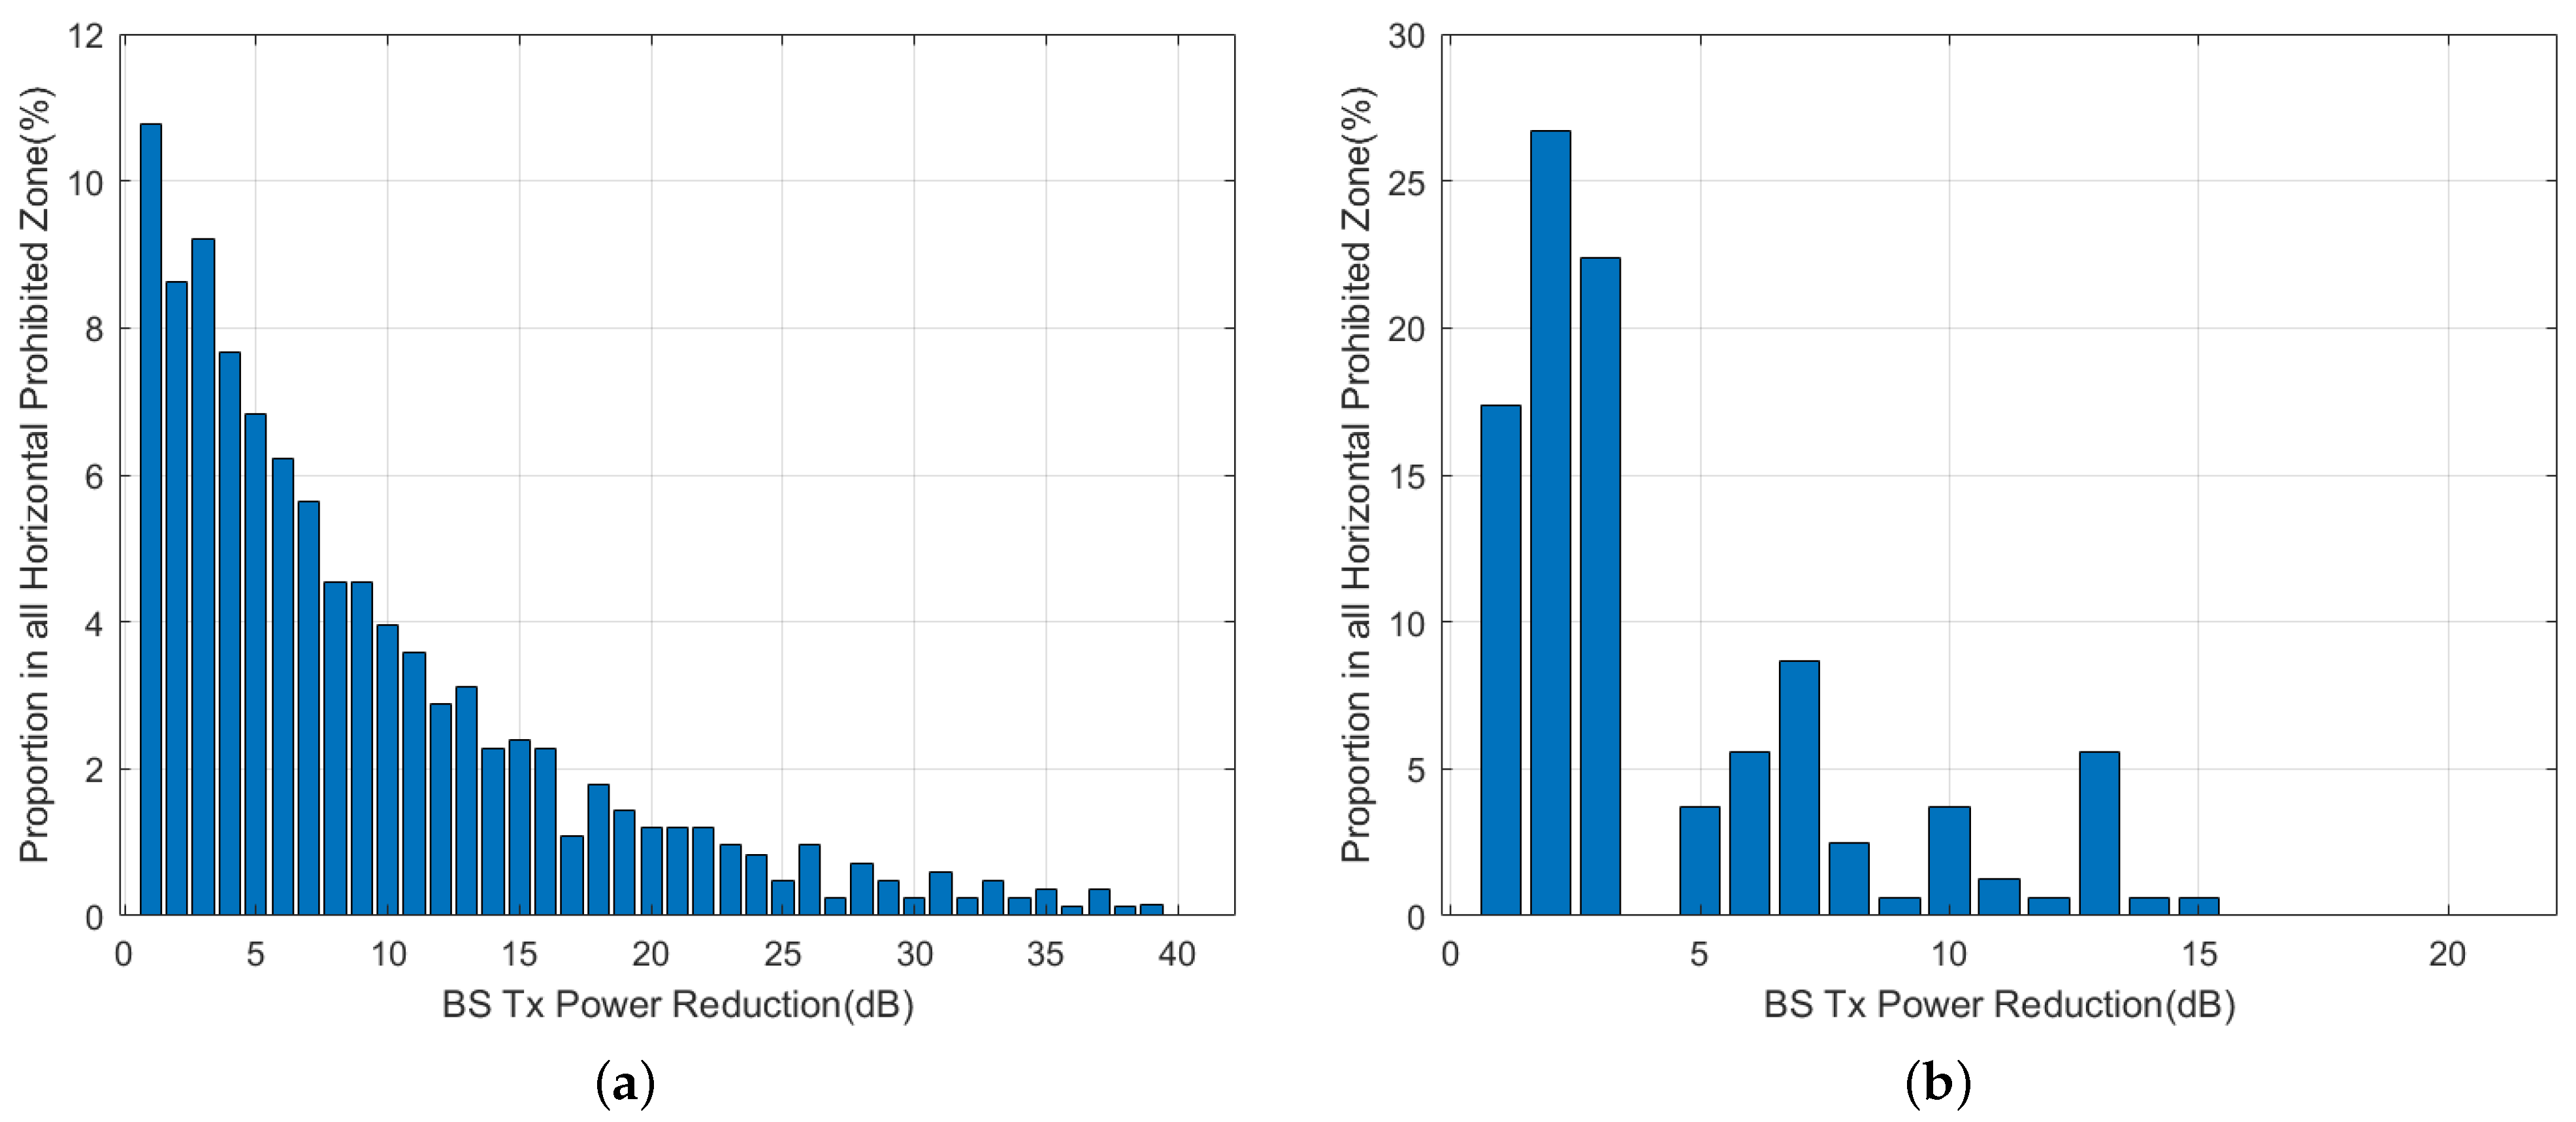
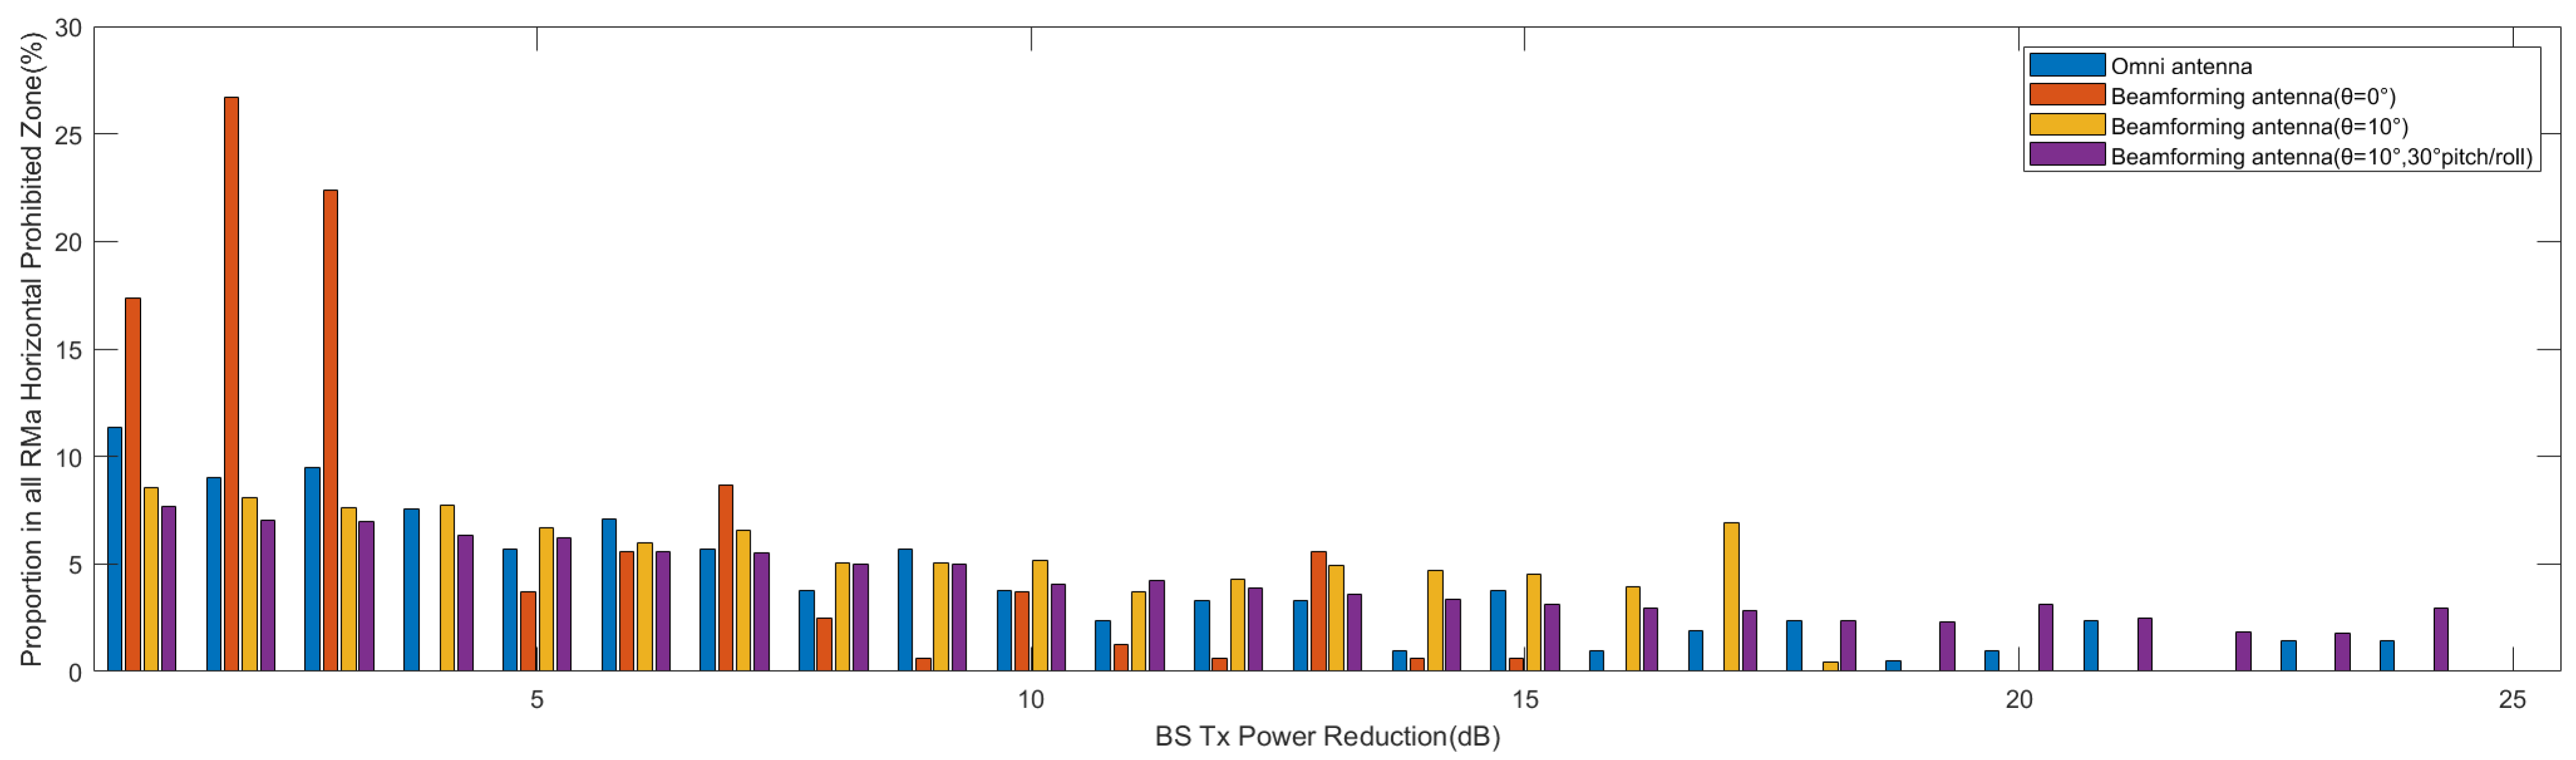
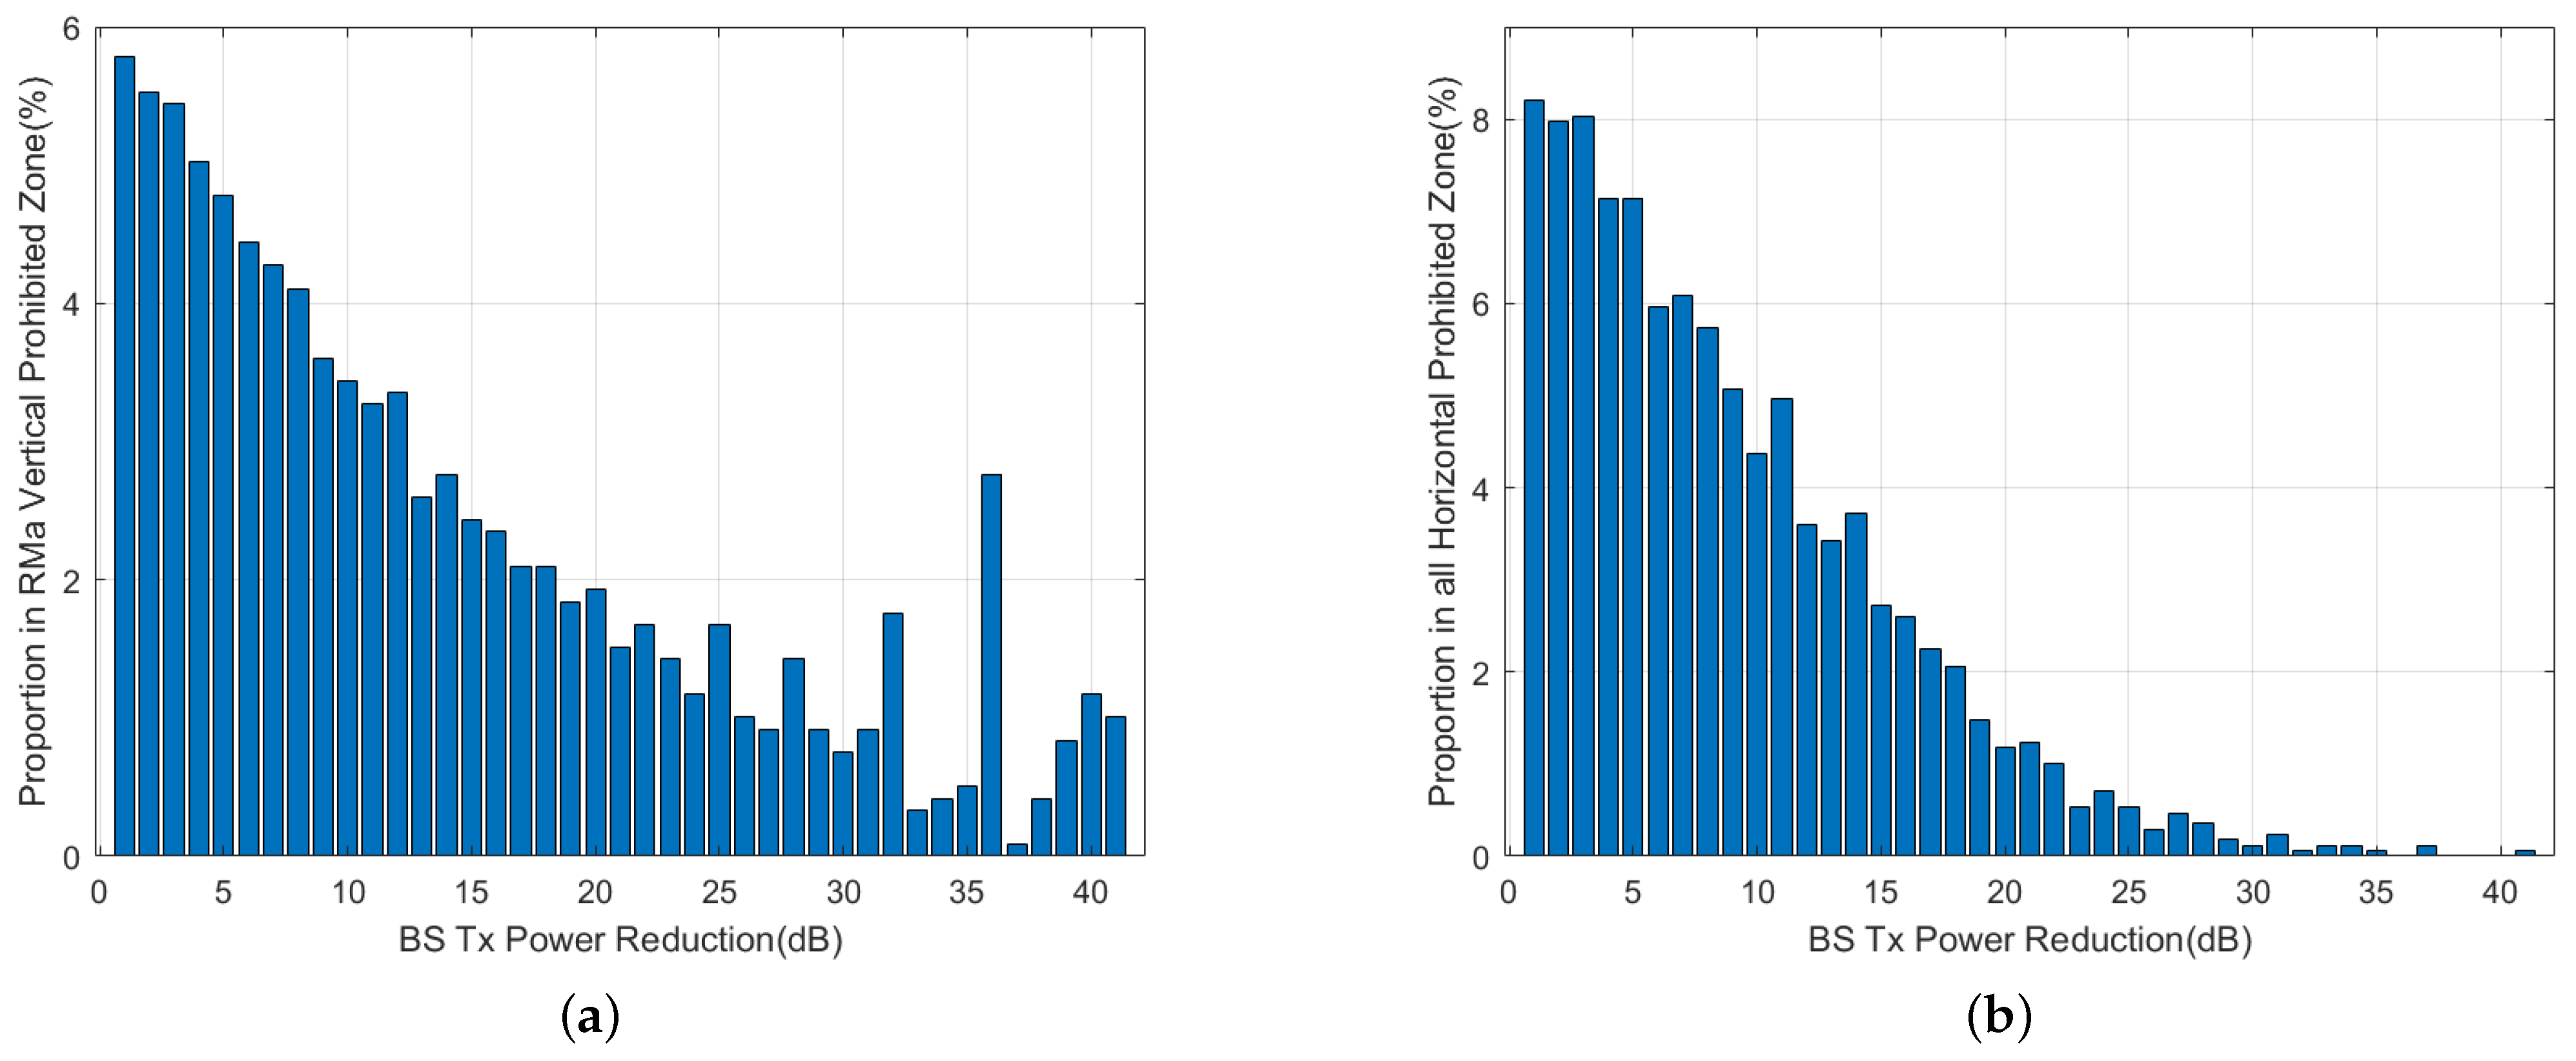
4.4.1. Tx Power Control
4.4.2. Angle Shutoff Method
- (1)
- The horizontal distance between the aircraft and BS varies between 0 and 10 km;
- (2)
- The steering beam of the BS varies between 0 and horizontally;
- (3)
- All possible directions of the beamforming antenna of the base station need to be analyzed;
- (4)
- All angles of interference at different altitudes AGL need to be analyzed.
4.5. Summary
4.6. Discussion
4.6.1. The Applicability of the Model
4.6.2. The Integrity and Accuracy of the Model
4.6.3. The Application of the Deployment Protection Method
5. Conclusions
Author Contributions
Funding
Institutional Review Board Statement
Informed Consent Statement
Data Availability Statement
Conflicts of Interest
References
- ITU. Operational and Technical Characteristics and Protection Criteria of Radio Altimeters Utilizing the Band 4200–4400 MHz; Technical Report ITU-R Report 2059-0; ITU: Geneva, Switzerland, 2014. [Google Scholar]
- AVSI. AFE 76s2 Report: Derivation of Radar Altimeter Interference Tolerance Masks; Technical Report AFE76S2; AVSI: Milan, Italy, 2021. [Google Scholar]
- RTCA. Assessment of C-Band Mobile Telecommunications Interference Impact on Low Range Radar Altimeter Operations; Technical Report PMC-2073; RTCA: Washington, DC, USA, 2020. [Google Scholar]
- RTCA. Minimum Performance Standards Airborne Low-Range Radar Altimeters; Technical Report DO-155; RTCA: Washington, DC, USA, 1974. [Google Scholar]
- EUROCAE. Minimum Performance Specification for Airborne Low Range Radio (Radar) Altimeter Equipment; Technical Report ED-30; EUROCAE: Lucerne, Switzerland, 1980. [Google Scholar]
- ARINC. Radio Altimeter; Technical Report ARINC707-7; ARINC: El Segundo, CA, USA, 2009. [Google Scholar]
- Labun, J.; Kurdel, P.; Češkovič, M.; Nekrasov, A.; Gamec, J. Low altitude measurement accuracy improvement of the airborne FMCW radio altimeters. Electronics 2019, 8, 888. [Google Scholar] [CrossRef]
- Češkovič, M.; Kurdel, P.; Gecejová, N.; Labun, J.; Laššák, M. Evaluation of Doppler Effect Error Affecting the Radio Altimeter Altitude Measurements. Sensors 2022, 23, 177. [Google Scholar] [CrossRef] [PubMed]
- Kurdel, P.; Češkovič, M.; Gecejová, N.; Labun, J.; Gamec, J. The method of evaluation of radio altimeter methodological error in laboratory environment. Sensors 2022, 22, 5394. [Google Scholar] [CrossRef] [PubMed]
- 3GPP. Radio Frequency (RF) System Scenarios (Release 15); Technical Report TR 36.942 V15.0.0; 3GPP: Valbonne, France, 2018. [Google Scholar]
- Szpakowska-Peas, E. CRW 13—The new generation radio altimeter: The concept, design, and tests. Aircr. Eng. Aerosp. Technol. 2020, 92, 1413–1419. [Google Scholar] [CrossRef]
- Zheng, L.; Lops, M.; Eldar, Y.C.; Wang, X. Radar and communication coexistence: An overview: A review of recent methods. IEEE Signal Process. Mag. 2019, 36, 85–99. [Google Scholar] [CrossRef]
- Ma, R.; Yang, W.; Guan, X.; Lu, X.; Song, Y.; Chen, D. Covert mmWave communications with finite blocklength against spatially random wardens. IEEE Internet Things J. 2023, 11, 3402–3416. [Google Scholar] [CrossRef]
- Sun, Y.; An, K.; Zhu, Y.; Zheng, G.; Wong, K.K.; Chatzinotas, S.; Ng, D.W.K.; Guan, D. Energy-efficient hybrid beamforming for multilayer RIS-assisted secure integrated terrestrial-aerial networks. IEEE Trans. Commun. 2022, 70, 4189–4210. [Google Scholar] [CrossRef]
- ITU. Sharing Studies between International Mobile Telecommunication-Advanced Systems and Geostationary Satellite Networks in the Fixed-Satellite Service in the 3400–4200 MHz and 4500–4800 MHz Frequency Bands in the WRC Study Cycle Leading to WRC-15; Technical Report Report S.2368-0; ITU-R: Geneva, Switzerland, 2015. [Google Scholar]
- Wei, Y.; Liu, S.; Hwang, S.H. Distance protection for coexistence of 5G base station and satellite Earth station. Electronics 2021, 10, 1481. [Google Scholar] [CrossRef]
- Liu, S.; Wei, Y.; Hwang, S.H. Hybrid of Angular and Distance Protection for Coexistence of 5G Base Stations and Satellite Earth Stations. Electronics 2022, 11, 623. [Google Scholar] [CrossRef]
- Al-Jumaily, A.; Sali, A.; Jiménez, V.P.G.; Fontán, F.P.; Singh, M.J.; Ismail, A.; Al-Maatouk, Q.; Al-Saegh, A.M.; Al-Jumeily, D. Evaluation of 5g coexistence and interference signals in the c-band satellite earth station. IEEE Trans. Veh. Technol. 2022, 71, 6189–6200. [Google Scholar] [CrossRef]
- Urama, J.; Wiren, R.; Galinina, O.; Kauppi, J.; Hiltunen, K.; Erkkila, J.; Chernogorov, F.; Etelaaho, P.; Heikkila, M.; Torsner, J.; et al. UAV-aided interference assessment for private 5G NR deployments: Challenges and solutions. IEEE Commun. Mag. 2020, 58, 89–95. [Google Scholar] [CrossRef]
- Pastukh, A.; Tikhvinskiy, V.; Devyatkin, E.; Kulakayeva, A. Sharing studies between 5G IoT networks and fixed service in the 6425–7125 MHz band with Monte Carlo simulation analysis. Sensors 2022, 22, 1587. [Google Scholar] [CrossRef] [PubMed]
- Rinaldi, F.; Maattanen, H.L.; Torsner, J.; Pizzi, S.; Andreev, S.; Iera, A.; Koucheryavy, Y.; Araniti, G. Non-terrestrial networks in 5G & beyond: A survey. IEEE Access 2020, 8, 165178–165200. [Google Scholar]
- ITU. Compatibility Analysis between Wireless Avionic Intra-Communication Systems and Systems in the Existing Services in the Frequency Band 4200–4400 MHz; Technical Report ITU-R Report 2319-0; ITU: Geneva, Switzerland, 2014. [Google Scholar]
- Futatsumori, S.; Morioka, K.; Kohmura, A.; Yonemoto, N.; Hikage, T.; Sekiguchi, T.; Yamamoto, M.; Nojima, T. Analysis of radar altimeter interference due to wireless avionics intra-communication systems by using large-scale FDTD method—Investigation on Airbus A320 class passenger aircraft. In Proceedings of the 2018 International Applied Computational Electromagnetics Society Symposium (ACES), Denver, CO, USA, 25–29 March 2018; IEEE: Toulouse, France, 2018; pp. 1–2. [Google Scholar]
- Kim, S.; Visotsky, E.; Moorut, P.; Bechta, K.; Ghosh, A.; Dietrich, C. Coexistence of 5G with the incumbents in the 28 and 70 GHz bands. IEEE J. Sel. Areas Commun. 2017, 35, 1254–1268. [Google Scholar] [CrossRef]
- Liu, S.; Wei, Y.; Hwang, S.H. Guard band protection for coexistence of 5G base stations and satellite earth stations. ICT Express 2023, 9, 1103–1109. [Google Scholar] [CrossRef]
- ITU. Reference Radiation Pattern for Earth Station Antennas in the Fixed-Satellite Service for Use in Coordination and Interference Assessment in the Frequency Range from 2 to 31 GHz; Technical Report ITU-R S.465-6; ITU: Geneva, Switzerland, 2013. [Google Scholar]
- Cho, Y.; Kim, H.K.; Nekovee, M.; Jo, H.S. Coexistence of 5G with satellite services in the millimeter-wave band. IEEE Access 2020, 8, 163618–163636. [Google Scholar] [CrossRef]
- 3GPP. Evolved Universal Terrestrial Radio Access (E-UTRA): Base Station (BS) Radio Transmission and Reception (Release 15); Technical Report TS 36.104 V15.0.0; 3GPP: Valbonne, France, 2018. [Google Scholar]
- Saad, S.A.; Shayea, I.; Ahmed, N.M.S. Artificial intelligence linear regression model for mobility robustness optimization algorithm in 5G cellular networks. Alex. Eng. J. 2024, 89, 125–148. [Google Scholar] [CrossRef]
- 3GPP. Study on Channel Model for Frequencies from 0.5 to 100 GHz (Release 15); Technical Report TR 38.901 V15.0.0; 3GPP: Valbonne, France, 2018. [Google Scholar]
- Labun, J.; Krchňák, M.; Kurdel, P.; Češkovič, M.; Nekrasov, A.; Gamcová, M. Possibilities of increasing the low altitude measurement precision of airborne radio altimeters. Electronics 2018, 7, 191. [Google Scholar] [CrossRef]
- ICAO. Handbook on Radio Frequency Spectrum Requirements for Civil Aviation, Volume I: ICAO Spectrum Strategy, Policy Statements, and Related Information—Second Edition; Technical Report Doc 9718; ICAO: Montreal, QC, Canada, 2018. [Google Scholar]
- 3GPP. Base Station (BS) Radio Transmission and Reception (Release 15); Technical Report TS 38.104 V15.3.0; 3GPP: Valbonne, France, 2018. [Google Scholar]
- Liu, X.; Sanz-Izquierdo, B.; Gao, S.; Wen, L.; Yang, X.X. Wideband Dual-Polarized Filtering Antenna for Base Station Applications. In IEEE Antennas and Wireless Propagation Letters; IEEE: Toulouse, France, 2024. [Google Scholar]


| Altimeter | Frequency (GHz) | Altitude AGL (ft) | ||||
|---|---|---|---|---|---|---|
| 200 | 1000 | 2000 | 5000 | |||
| Category 1 | 3.93 | T | −16 | −24 | - | −30 |
| T6dB | −22 | −30 | - | −36 | ||
| Category 2 | 3.93 | T | −42 | −50 | −63 | - |
| T6dB | −48 | −56 | −69 | - | ||
| Category 3 | 3.93 | T | −37 | - | - | - |
| T6dB | −43 | - | - | - | ||
| RMa | UMa | UMi | ||
|---|---|---|---|---|
| BS maximum Tx power (dBm) | 46 | 38 | 38 | |
| BS antenna height (m) | 35 | 25 | 10 | |
| Antenna pattern | 3GPP TR 38.901 | |||
| Omni antenna gain (dBi) | 15 | |||
| Maximum array gain 16 × 16 (dBi) | 29.5 | |||
| Channel bandwidth (MHz) | 100 | 100 | 100 | |
| BS maximum PSD (dBm/MHz) | 26 | 18 | 18 | |
| Building height (m) | 7 | None | None | |
| Street width (m) | 25 | None | None | |
| LOS shadow fading (dB) | 6 | 4 | 4 | |
| NLOS shadow fading (dB) | 8 | 6 | 7.82 | |
| Maximum vertical scan angle (°) | 10 | 10 | 10 | |
| 200 ft | 1000 ft | 2000 ft | |||||
|---|---|---|---|---|---|---|---|
| 6dB | 6dB | 6dB | |||||
| Omni Antenna | 0.2 | 0.4 | 0.9 | 1.3 | 2.3 | 3.2 | |
| 16 × 16 Beamforming antenna | 0.8 | 1.4 | 0.4 | 0.9 | 2.5 | 3.4 | |
| 0.9 | 1.5 | 2.1 | 3.1 | 5.0 | 6.7 | ||
| , \ | 2.2 | 3.4 | 4.2 | 5.8 | 8.4 | 10.4 | |
| = 200 ft | = 1000 ft | = 2000 ft | |||||||||||
|---|---|---|---|---|---|---|---|---|---|---|---|---|---|
| 6dB | 6dB | 6dB | |||||||||||
| 0 ft | 200 ft | 0 ft | 200 ft | 0 ft | 1000 ft | 0 ft | 1000 ft | 0 ft | 2000 ft | 0 ft | 2000 ft | ||
| Omni Antenna | 0.2 | 0.2 | 0.4 | 0.4 | 0.9 | 0.5 | 1.3 | 1.0 | 2.3 | 1.5 | 3.2 | 2.6 | |
| 16 × 16 Beamforming Antenna | 0.8 | 0.8 | 1.4 | 1.5 | 0.4 | 1.7 | 0.9 | 2.8 | 2.5 | 4.3 | 3.4 | 6.1 | |
| 0.9 | 0.9 | 1.5 | 1.5 | 2.1 | 1.8 | 3.1 | 2.8 | 5.0 | 4.5 | 6.7 | 6.2 | ||
| , \ | 2.2 | 2.2 | 3.4 | 3.4 | 4.2 | 4.0 | 5.8 | 5.6 | 8.4 | 8.0 | 10.4 | 9.9 | |
Disclaimer/Publisher’s Note: The statements, opinions and data contained in all publications are solely those of the individual author(s) and contributor(s) and not of MDPI and/or the editor(s). MDPI and/or the editor(s) disclaim responsibility for any injury to people or property resulting from any ideas, methods, instructions or products referred to in the content. |
© 2024 by the authors. Licensee MDPI, Basel, Switzerland. This article is an open access article distributed under the terms and conditions of the Creative Commons Attribution (CC BY) license (https://creativecommons.org/licenses/by/4.0/).
Share and Cite
Duan, Z.; Ma, Z.; Bai, J.; Wang, P.; Xu, K.; Yuan, S. Deployment Protection for Interference of 5G Base Stations with Aeronautical Radio Altimeters. Sensors 2024, 24, 2313. https://doi.org/10.3390/s24072313
Duan Z, Ma Z, Bai J, Wang P, Xu K, Yuan S. Deployment Protection for Interference of 5G Base Stations with Aeronautical Radio Altimeters. Sensors. 2024; 24(7):2313. https://doi.org/10.3390/s24072313
Chicago/Turabian StyleDuan, Zhaobin, Zhenyang Ma, Jie Bai, Peng Wang, Ke Xu, and Shun Yuan. 2024. "Deployment Protection for Interference of 5G Base Stations with Aeronautical Radio Altimeters" Sensors 24, no. 7: 2313. https://doi.org/10.3390/s24072313
APA StyleDuan, Z., Ma, Z., Bai, J., Wang, P., Xu, K., & Yuan, S. (2024). Deployment Protection for Interference of 5G Base Stations with Aeronautical Radio Altimeters. Sensors, 24(7), 2313. https://doi.org/10.3390/s24072313