
Development of Multimodal Fusion Technology for Tomato Maturity Assessment


 , ,
, ,  ,
,
Abstract
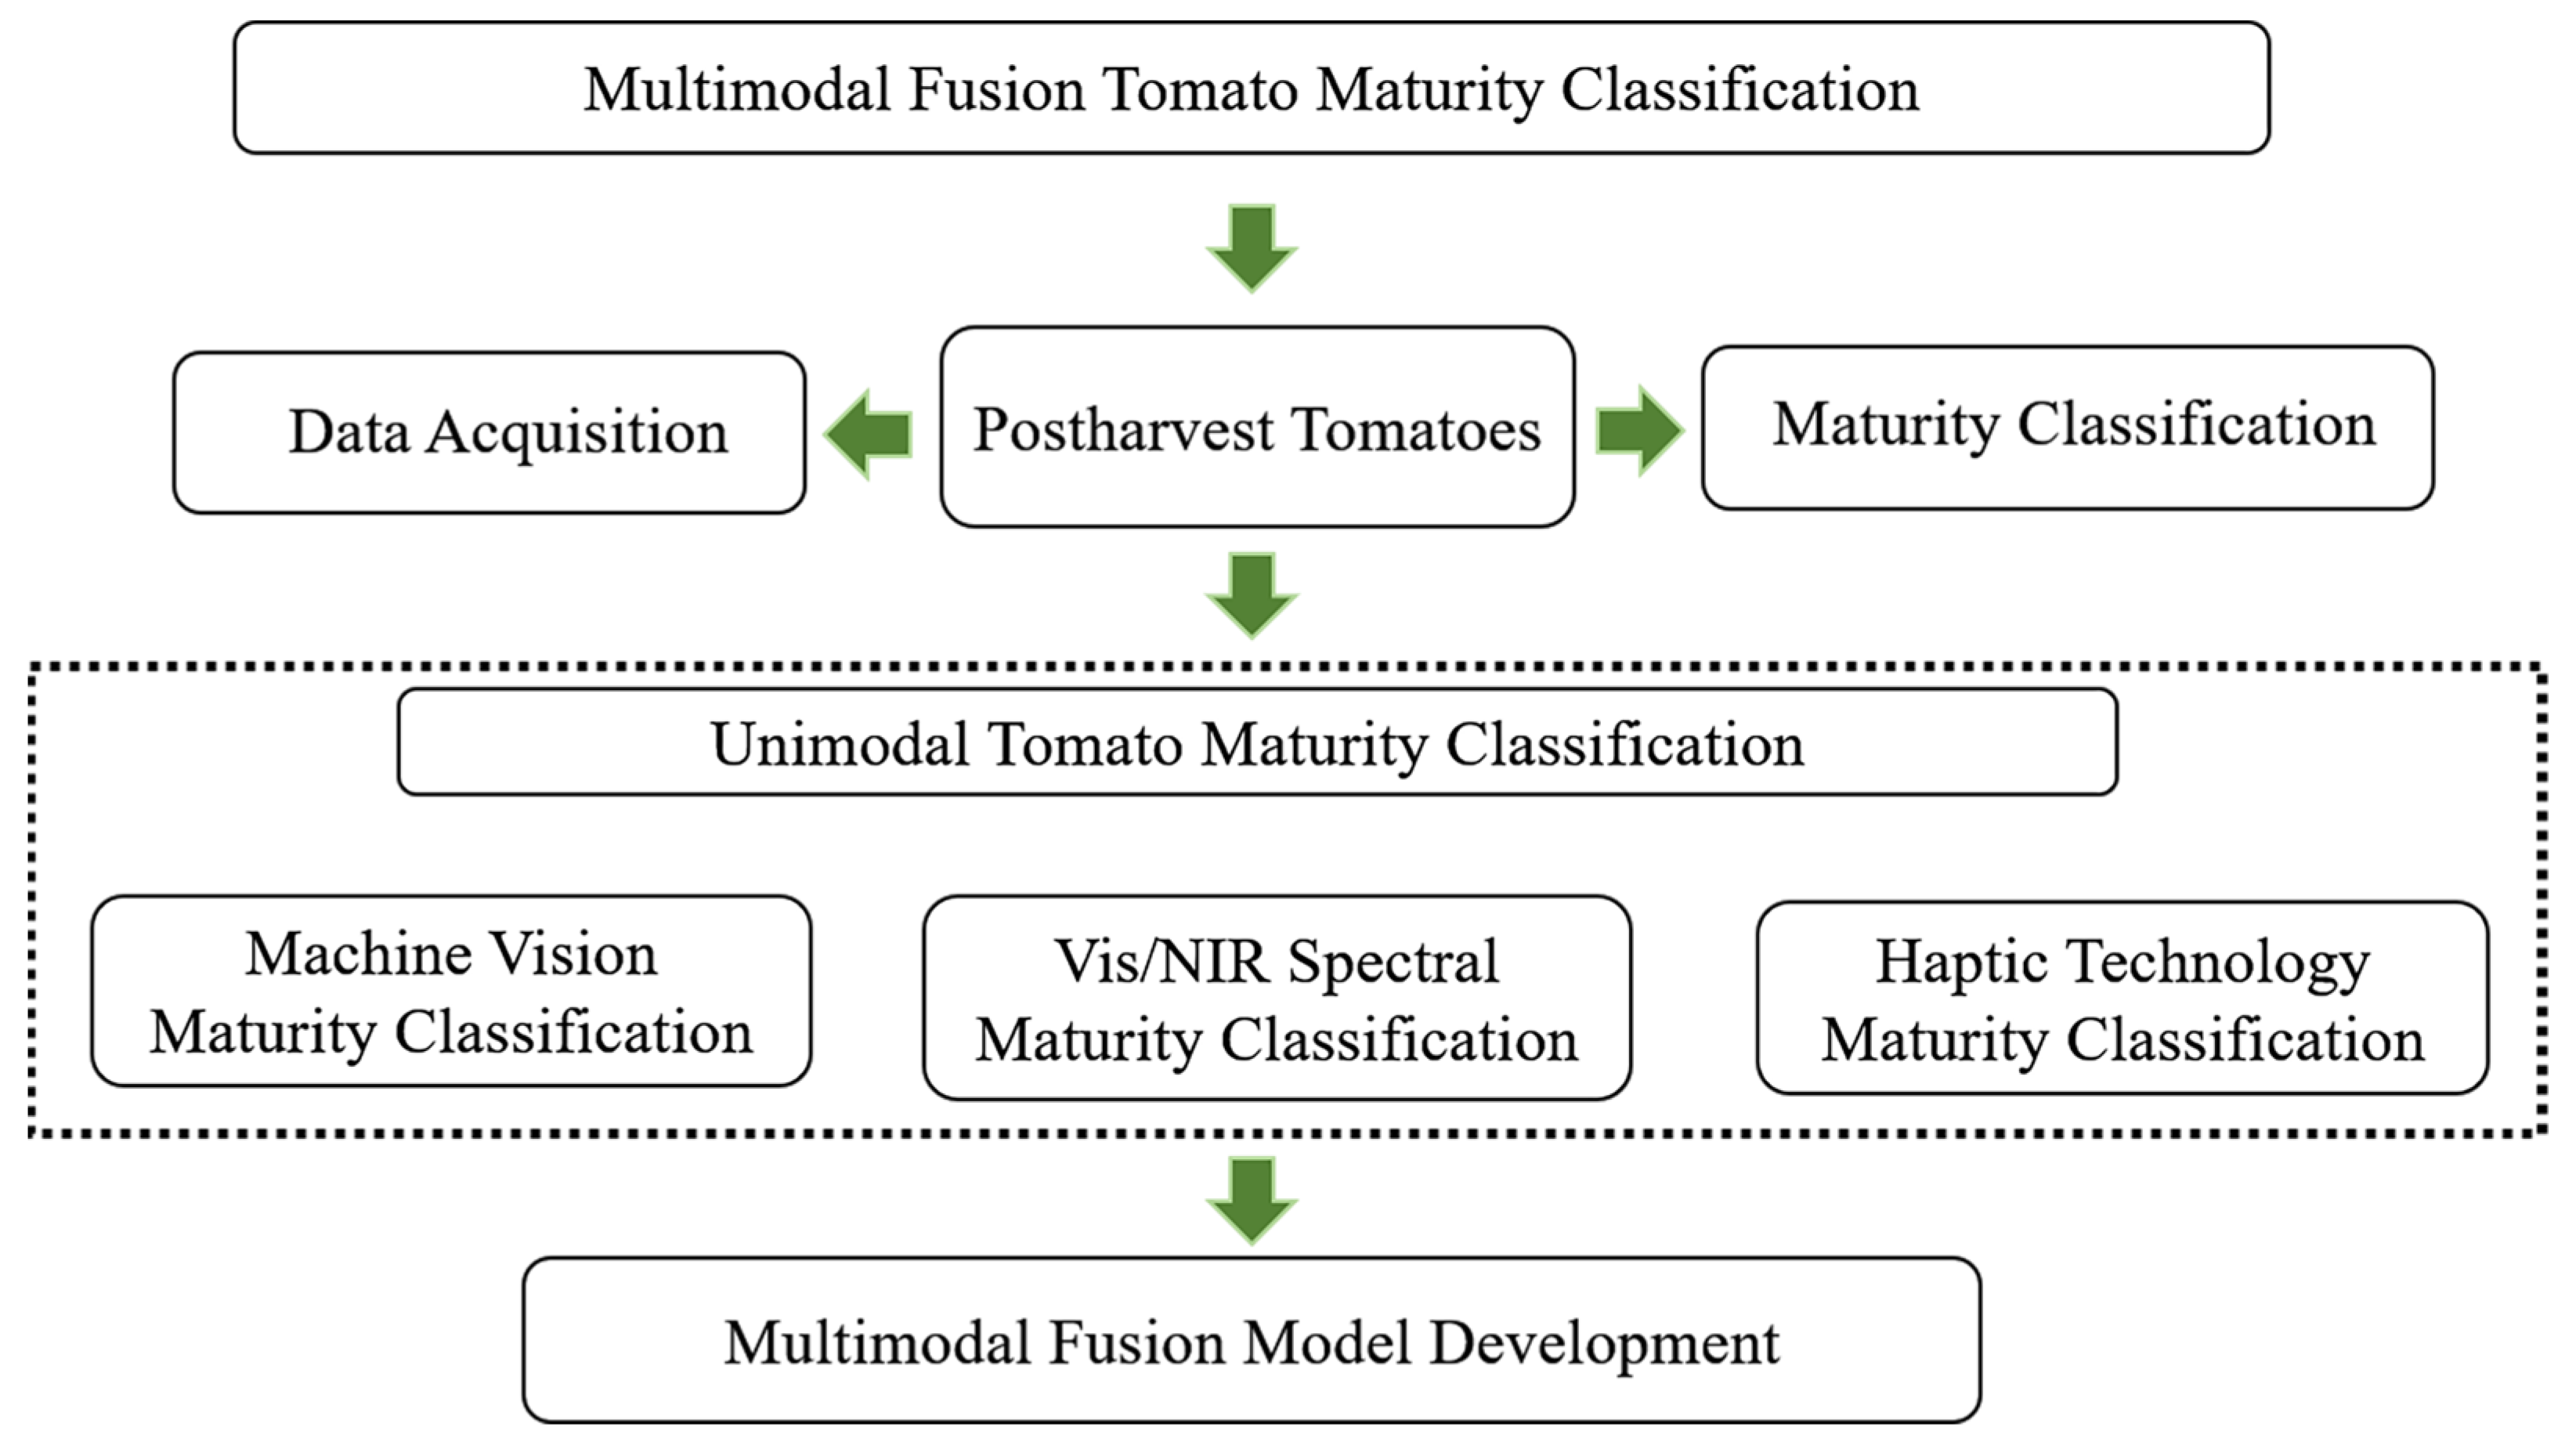
1. Introduction
2. Materials and Methods
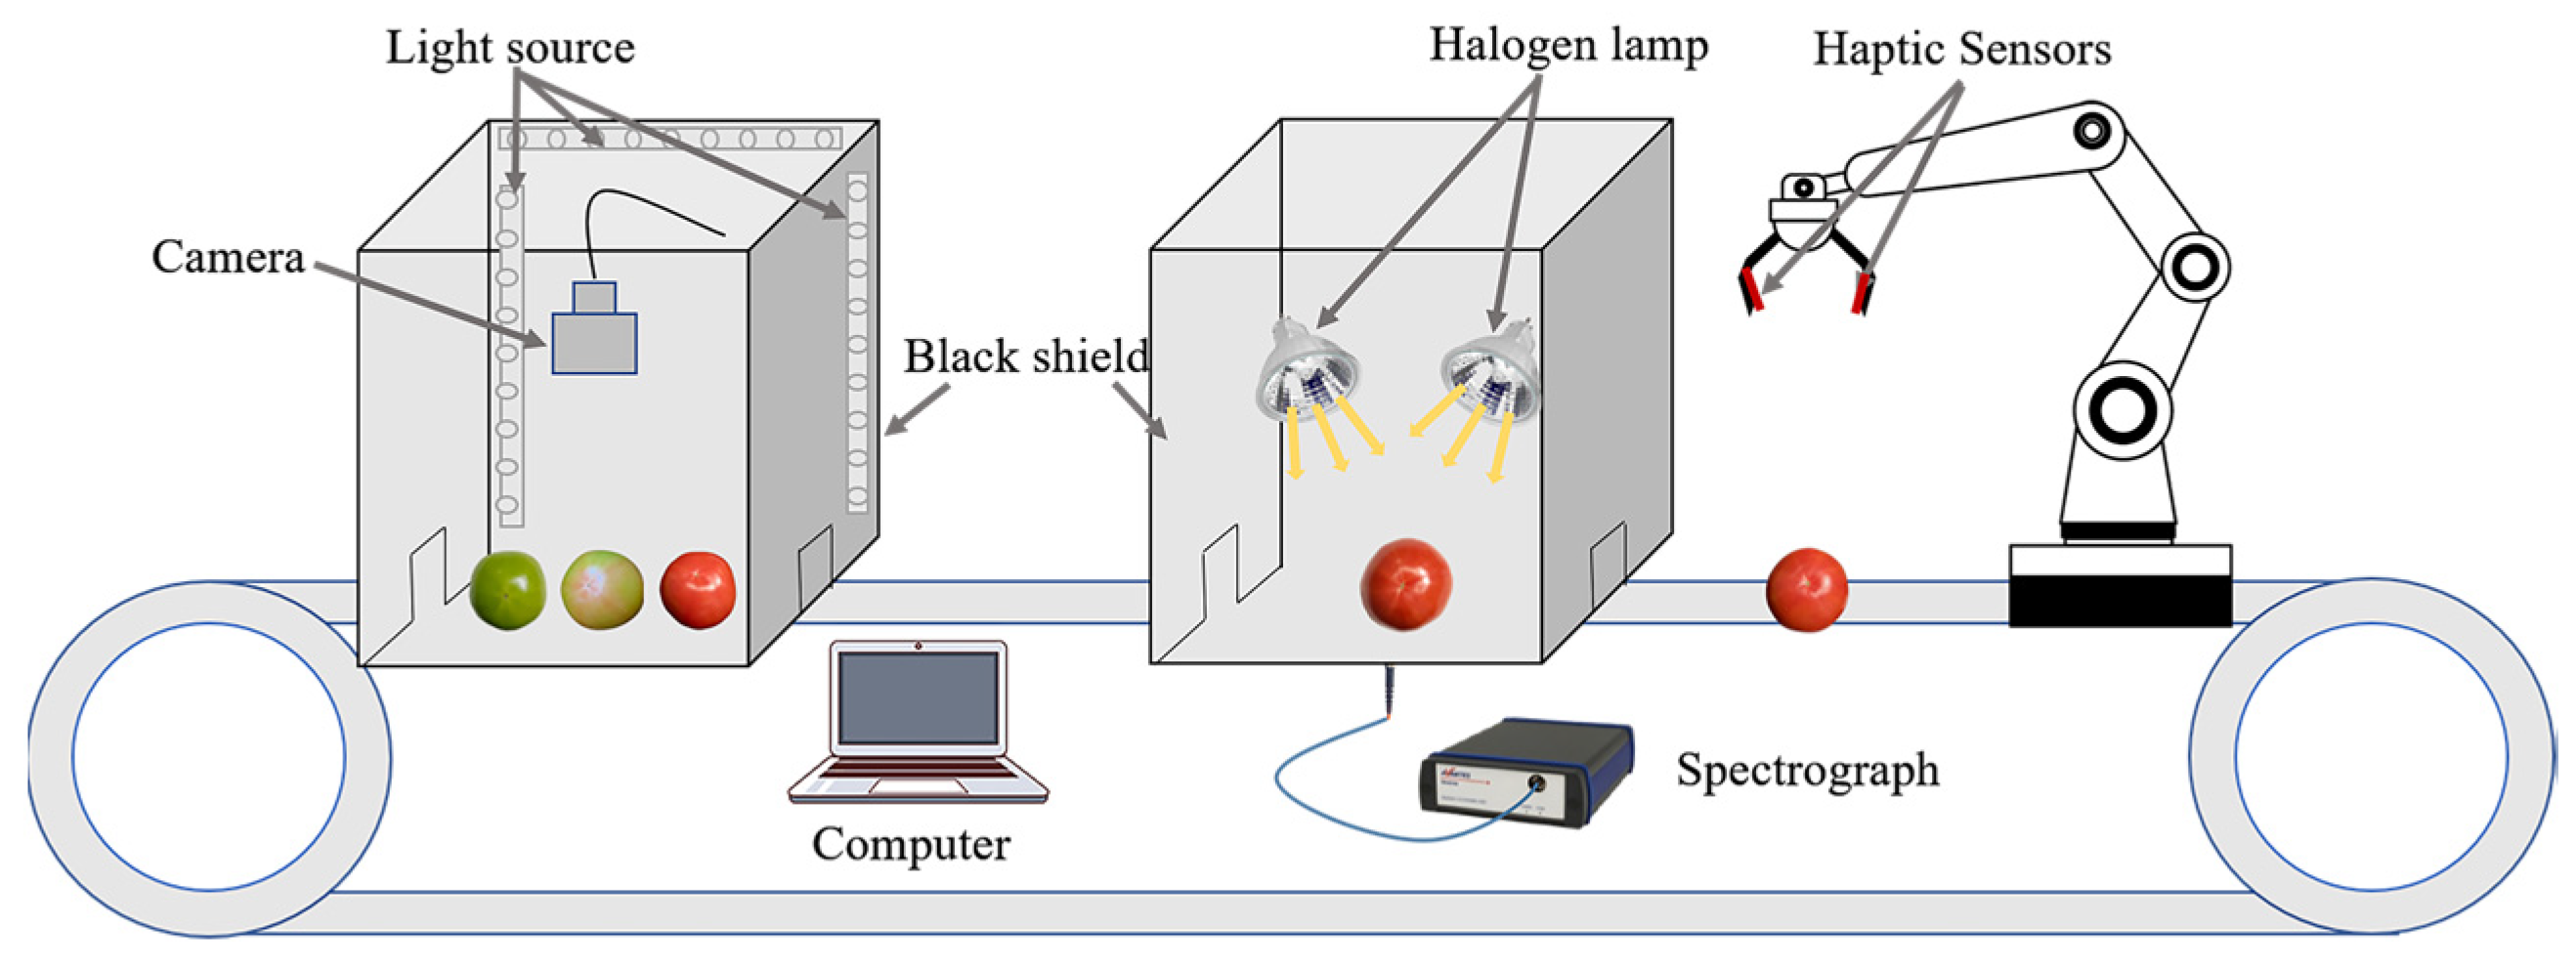
2.1. Experimental Design
2.2. Data Acquisition
2.2.1. Image Acquisition
2.2.2. Vis/NIR Spectral Information Acquisition
2.2.3. Tactile Information Acquisition
2.3. Data Preprocessing
2.4. Sample Quality Measurement
2.5. A Deep Learning Framework for Multimodal Fusion
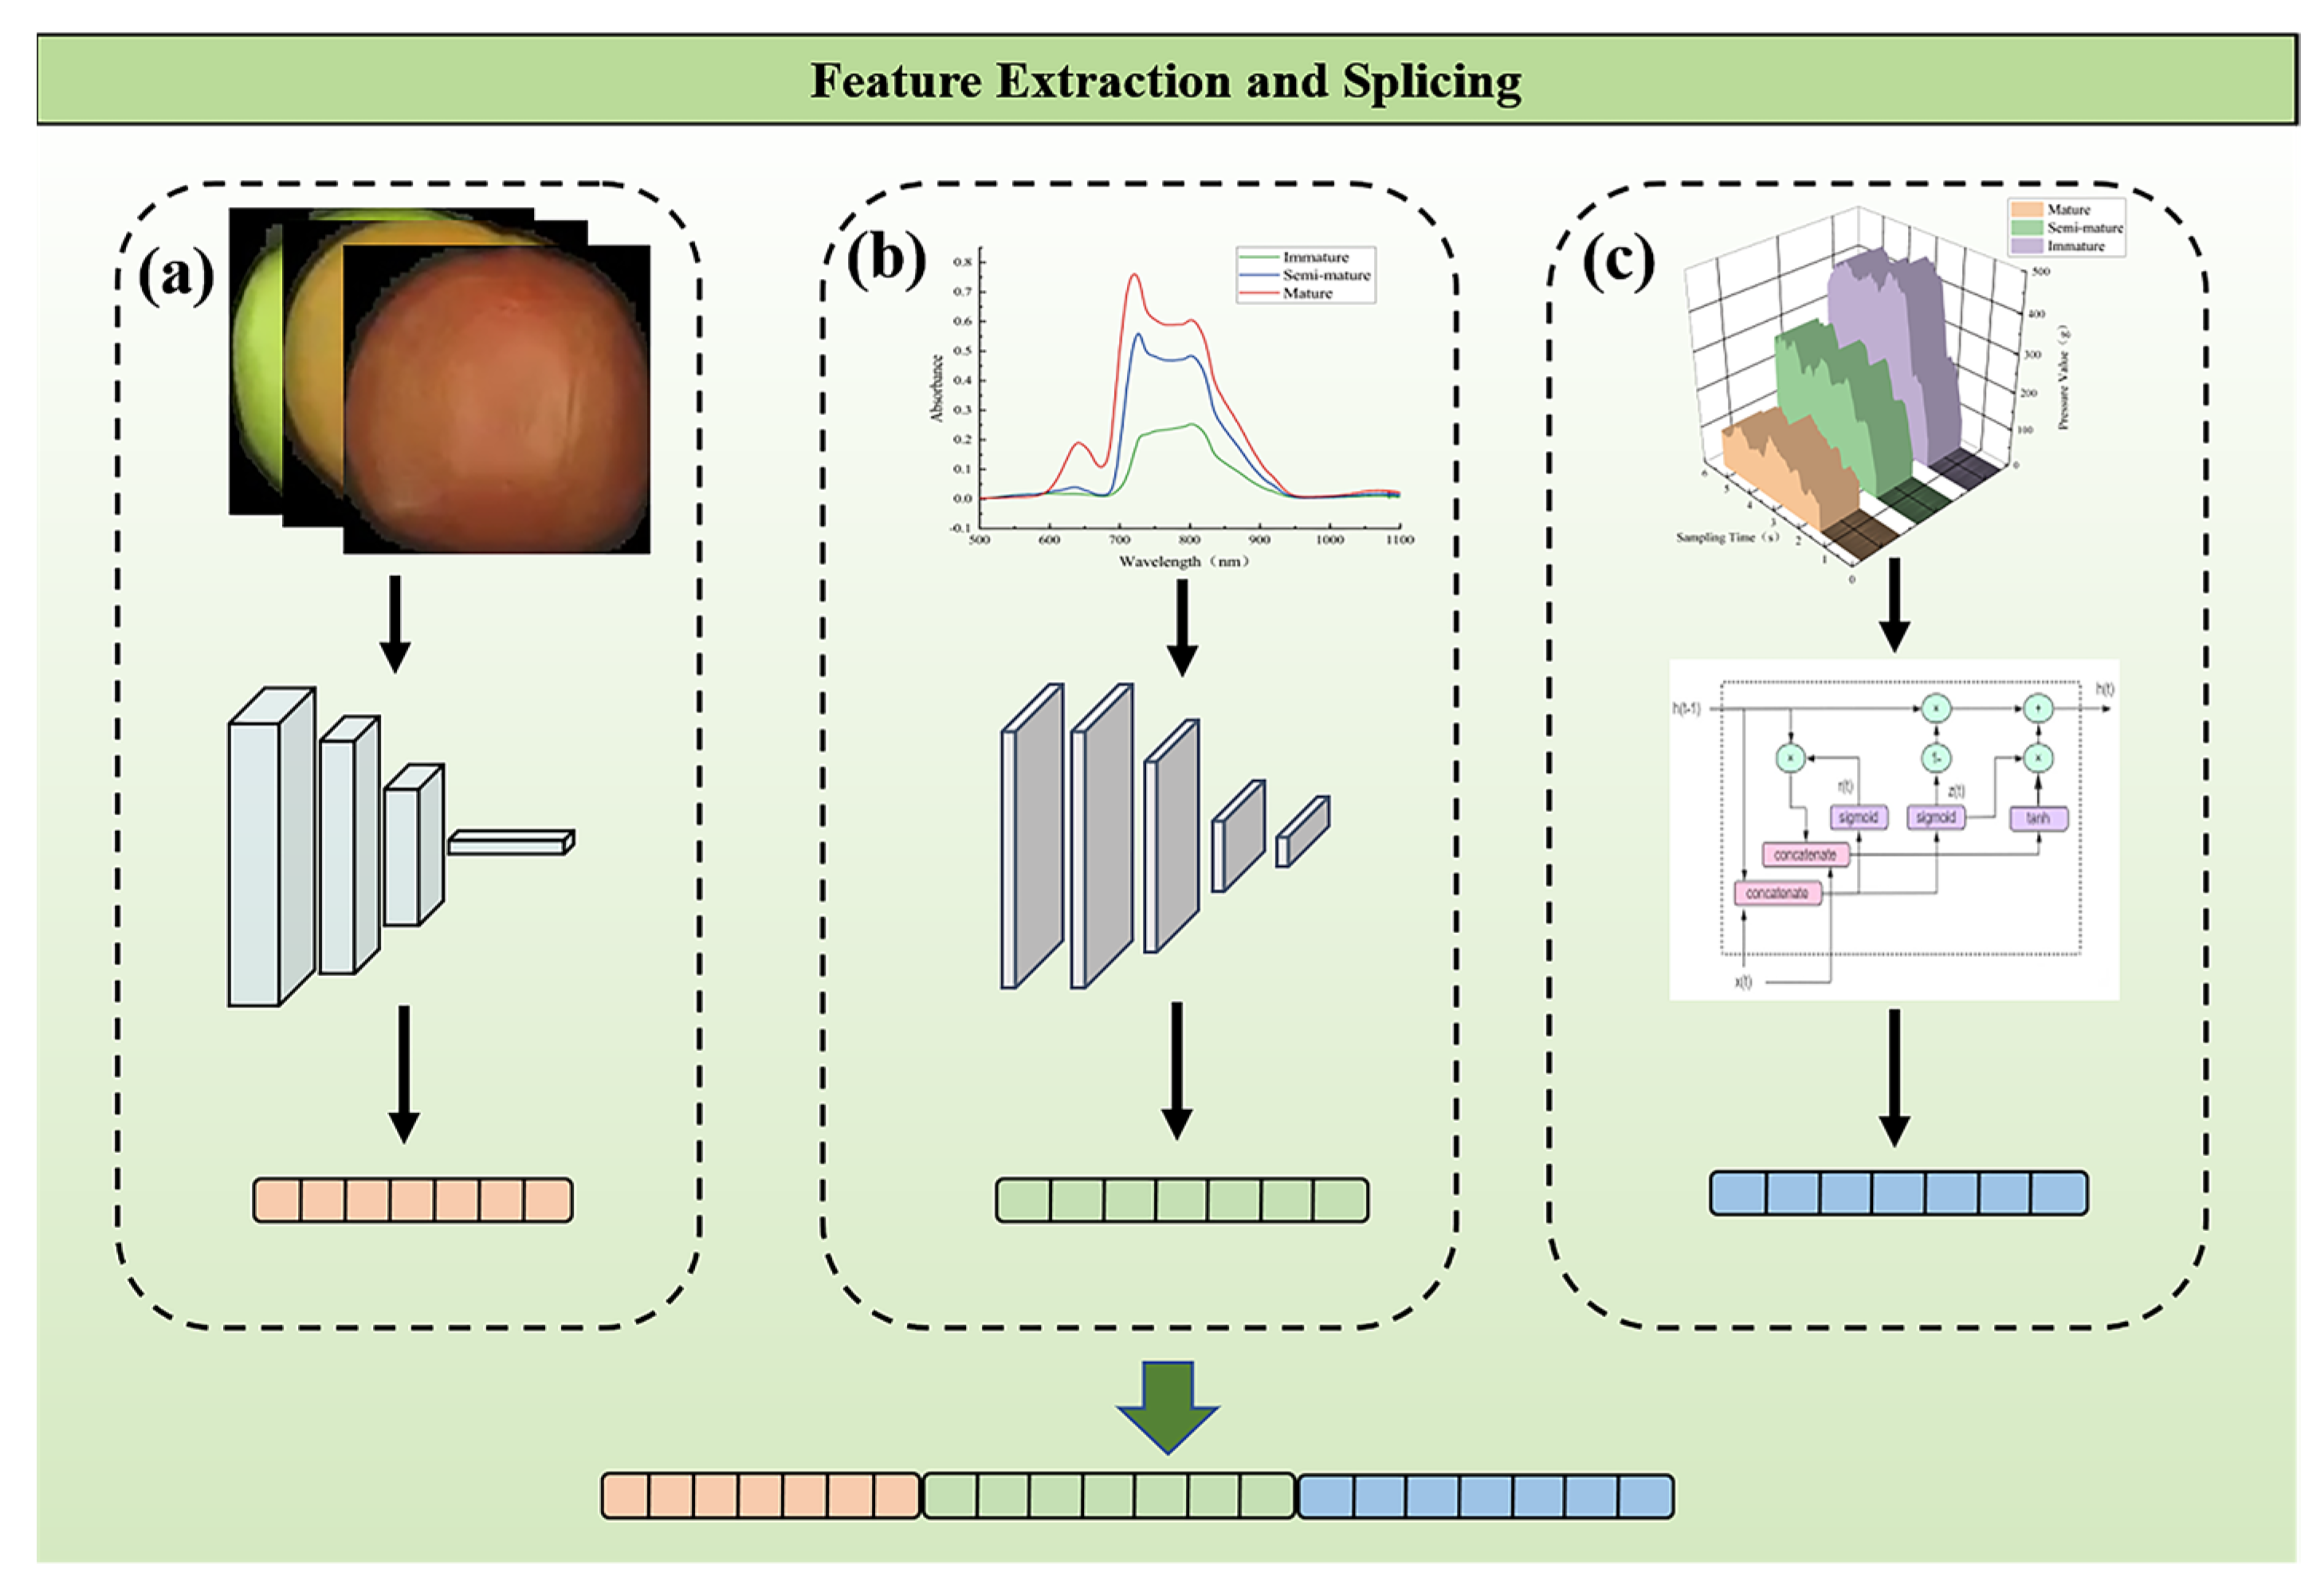
2.5.1. Feature Extraction
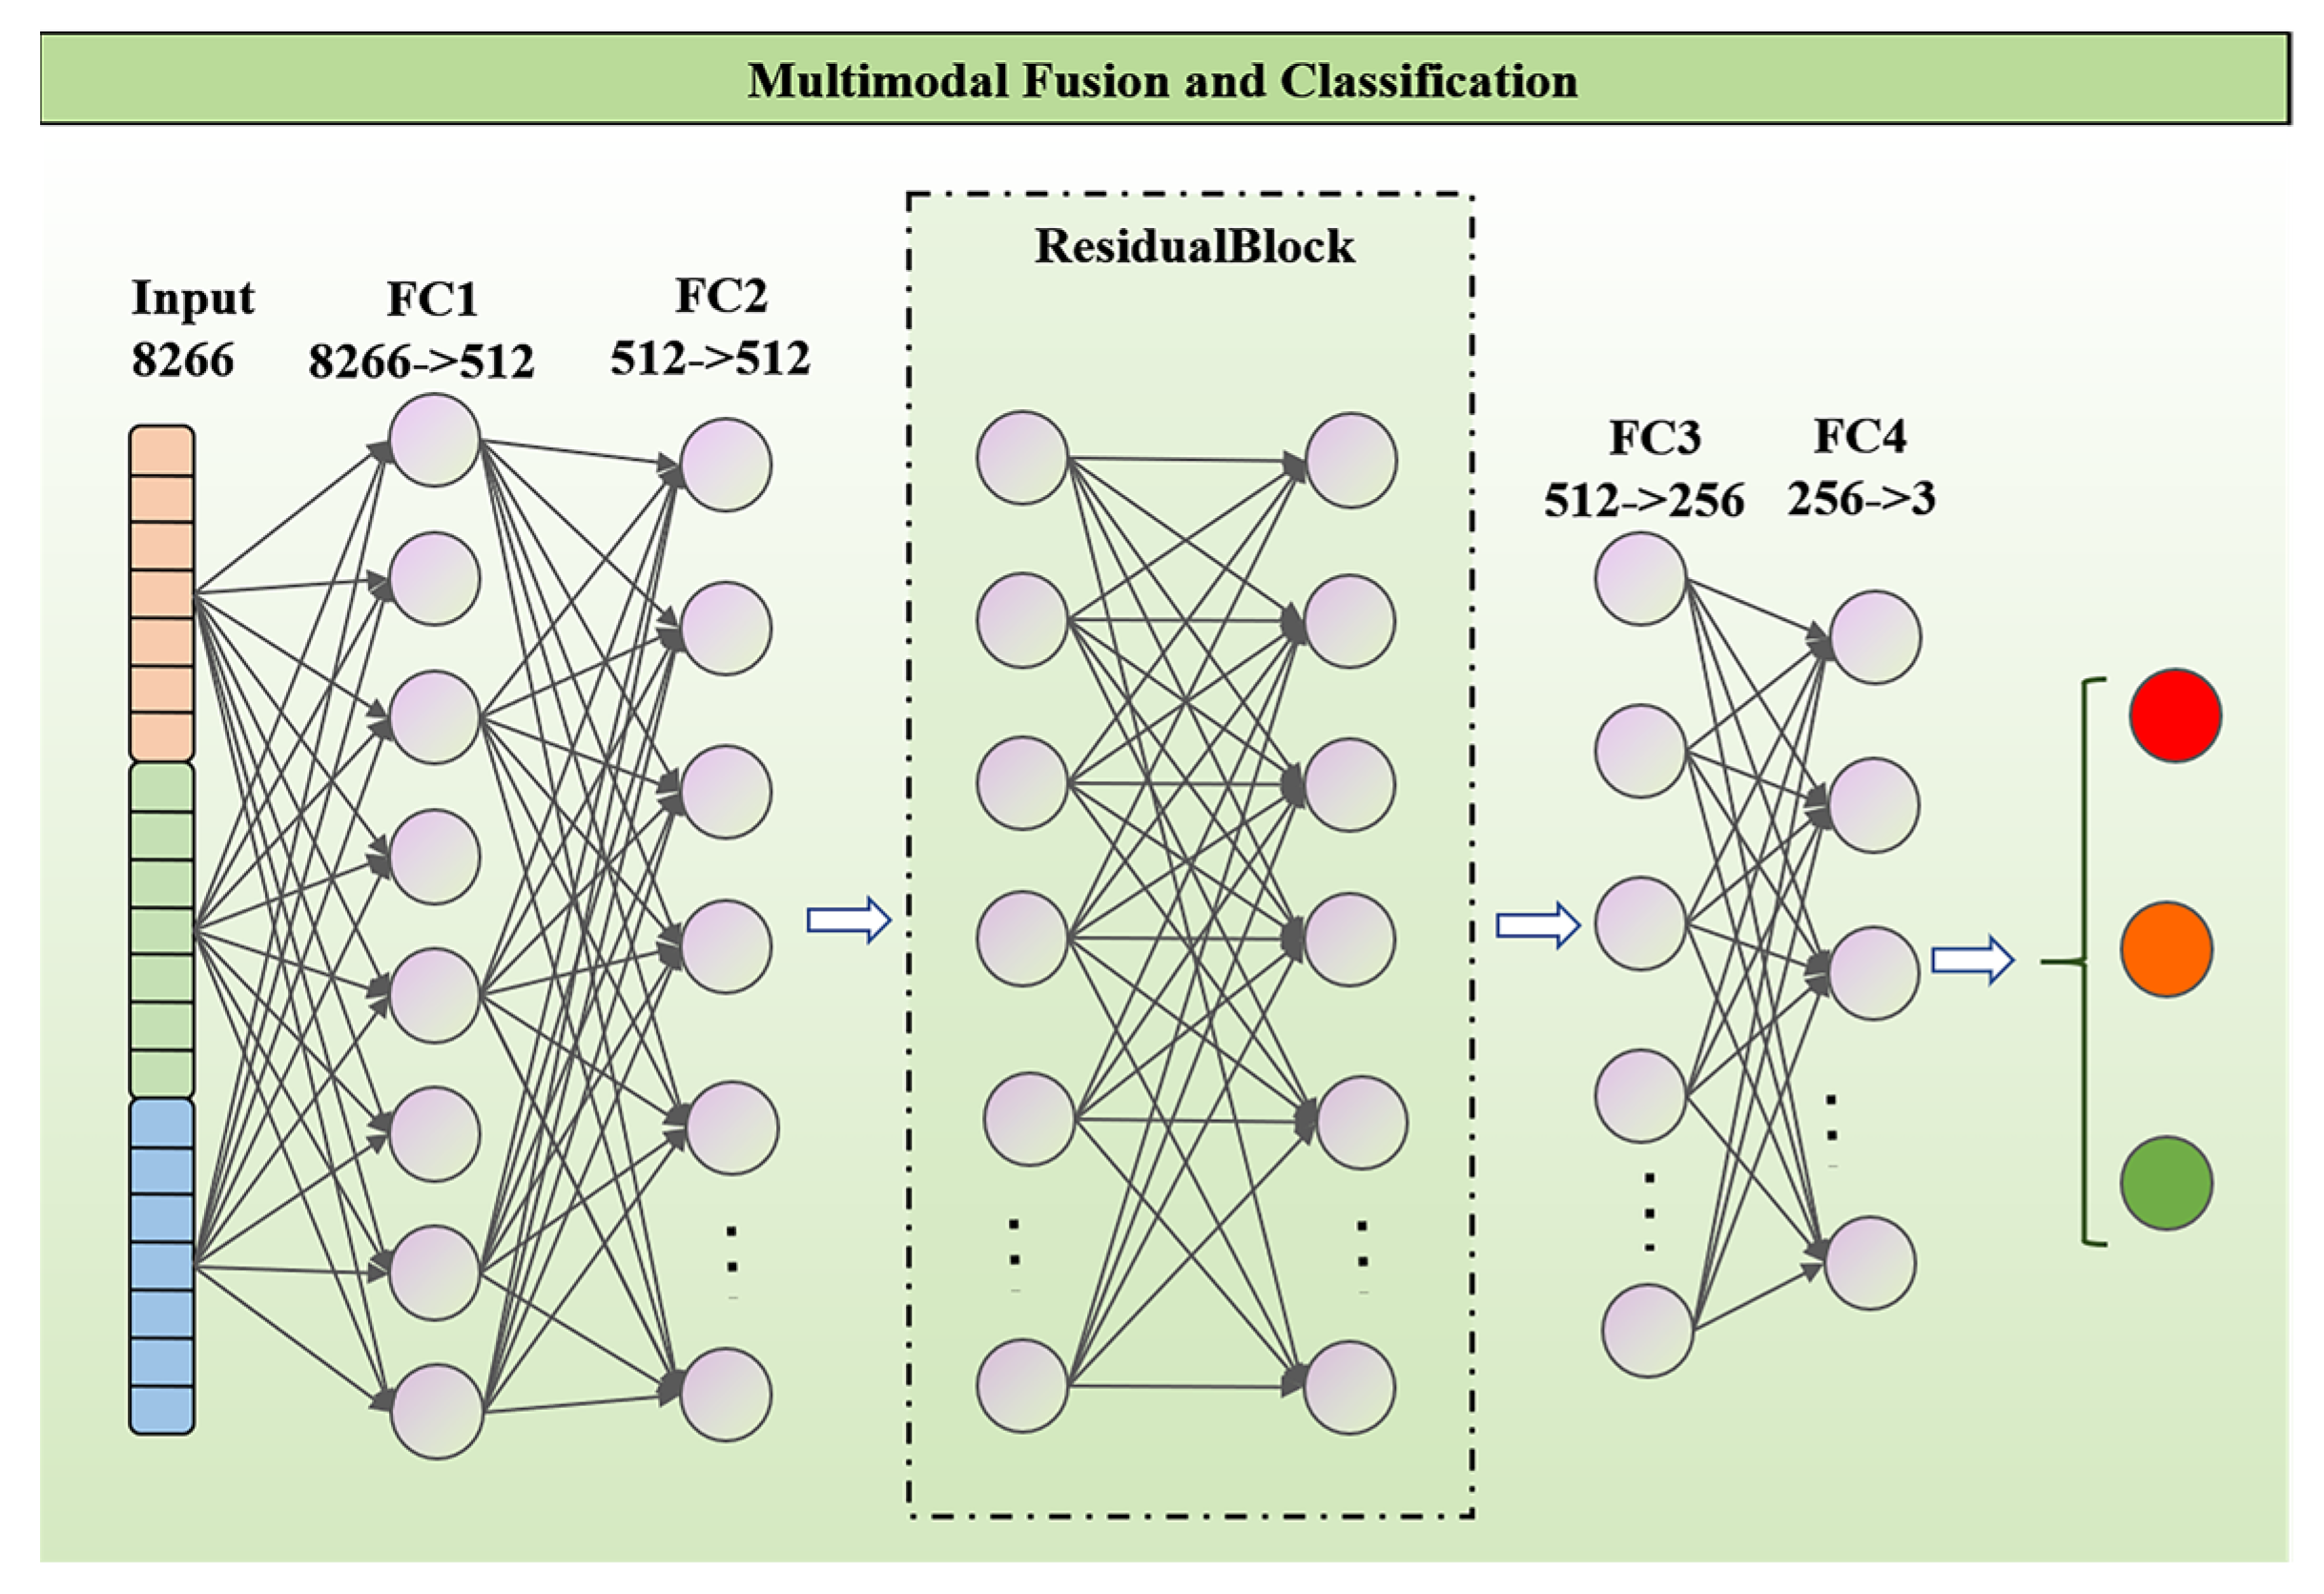
2.5.2. Feature Fusion
2.5.3. Multimodal Fusion Classification Networks
2.6. Model Evaluation
3. Results and Discussion
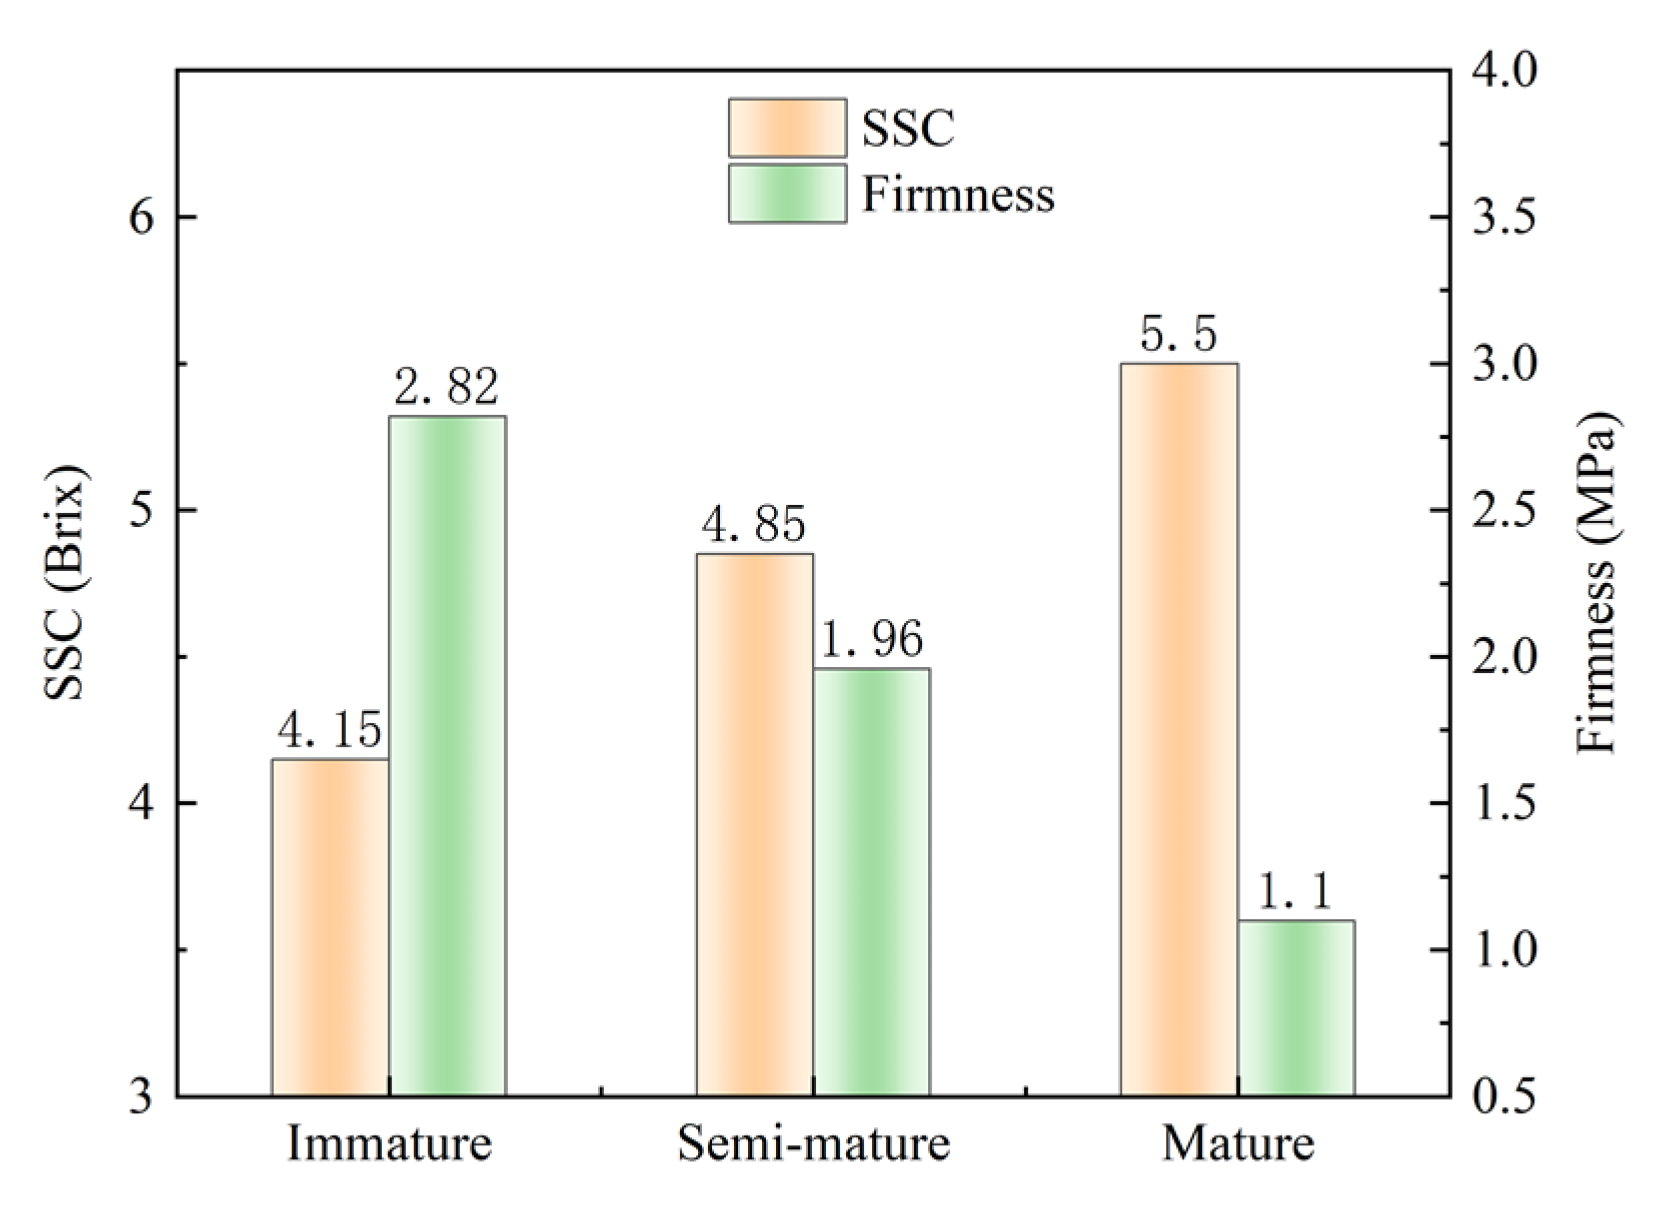
3.1. Analysis of Soluble Solids and Firmness of Tomatoes
3.2. Analysis of Original Data
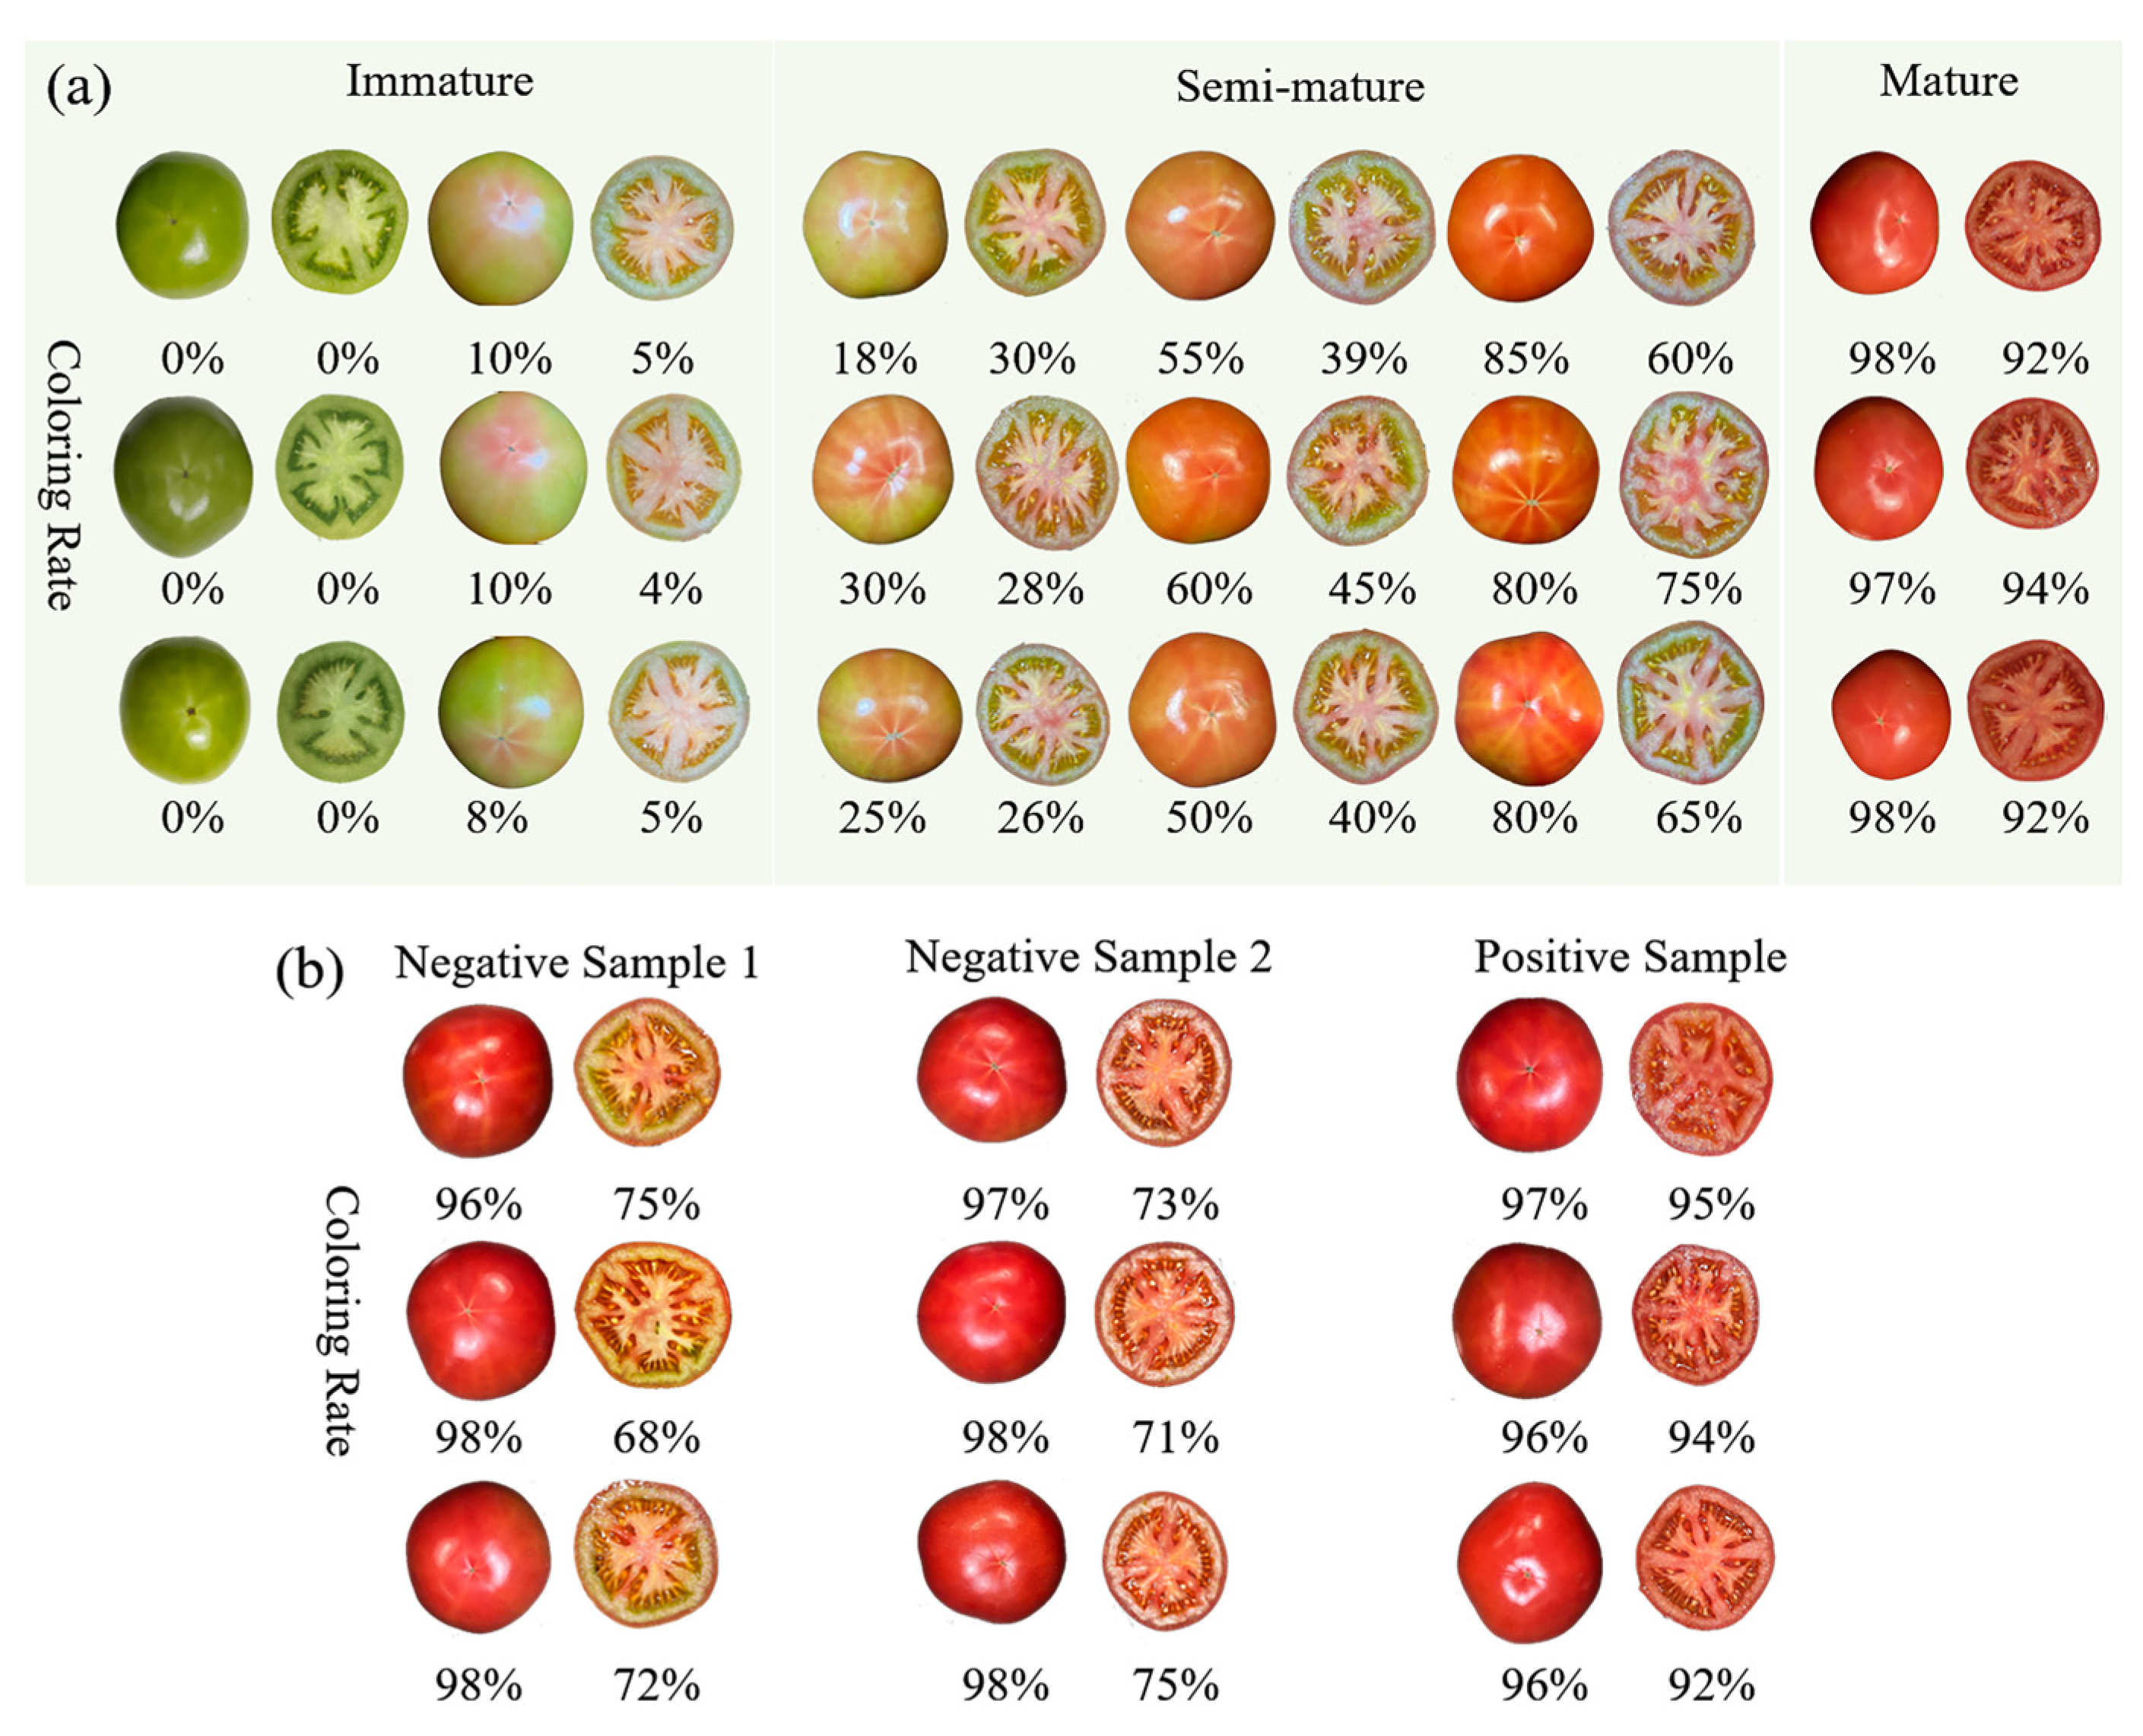
3.2.1. Image Data Analysis
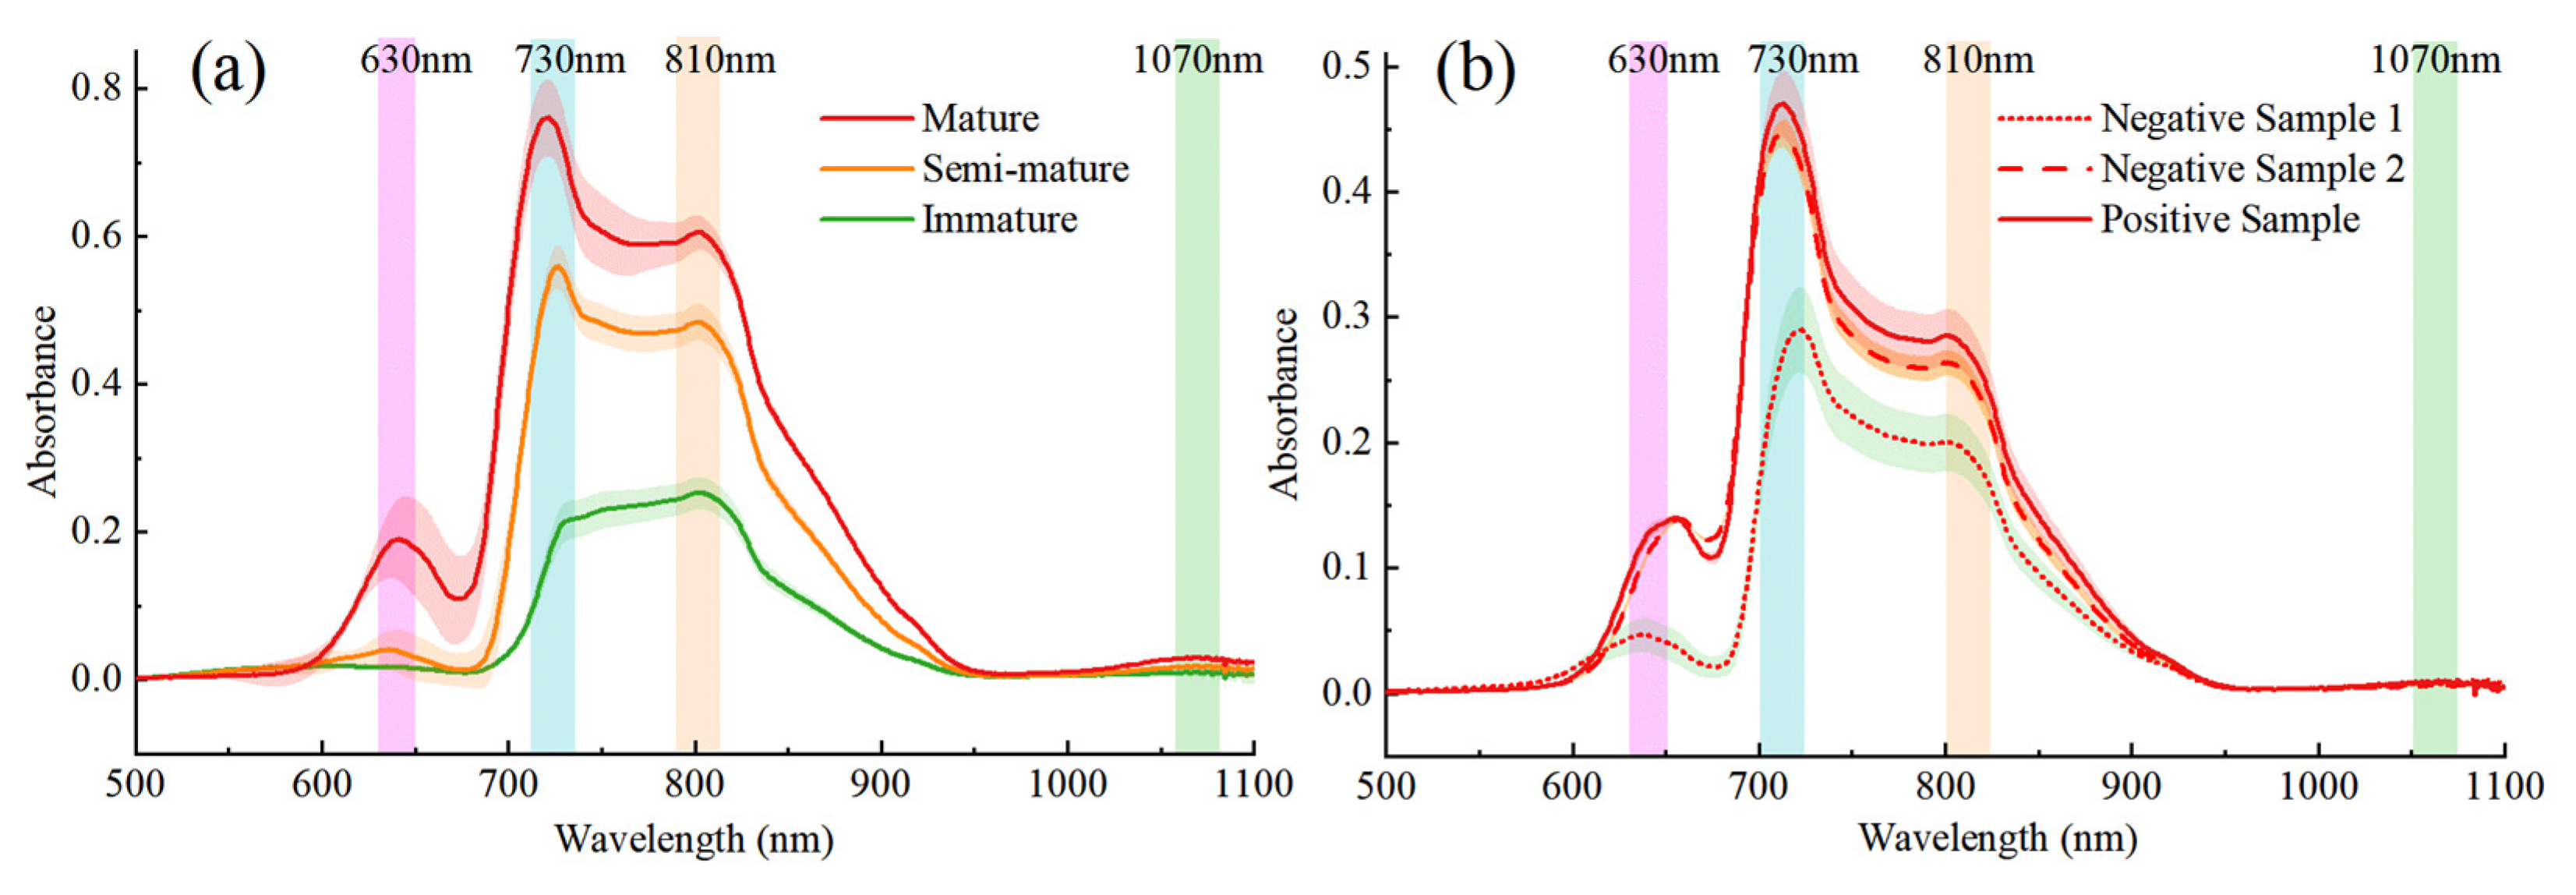
3.2.2. Analysis of Spectral Data
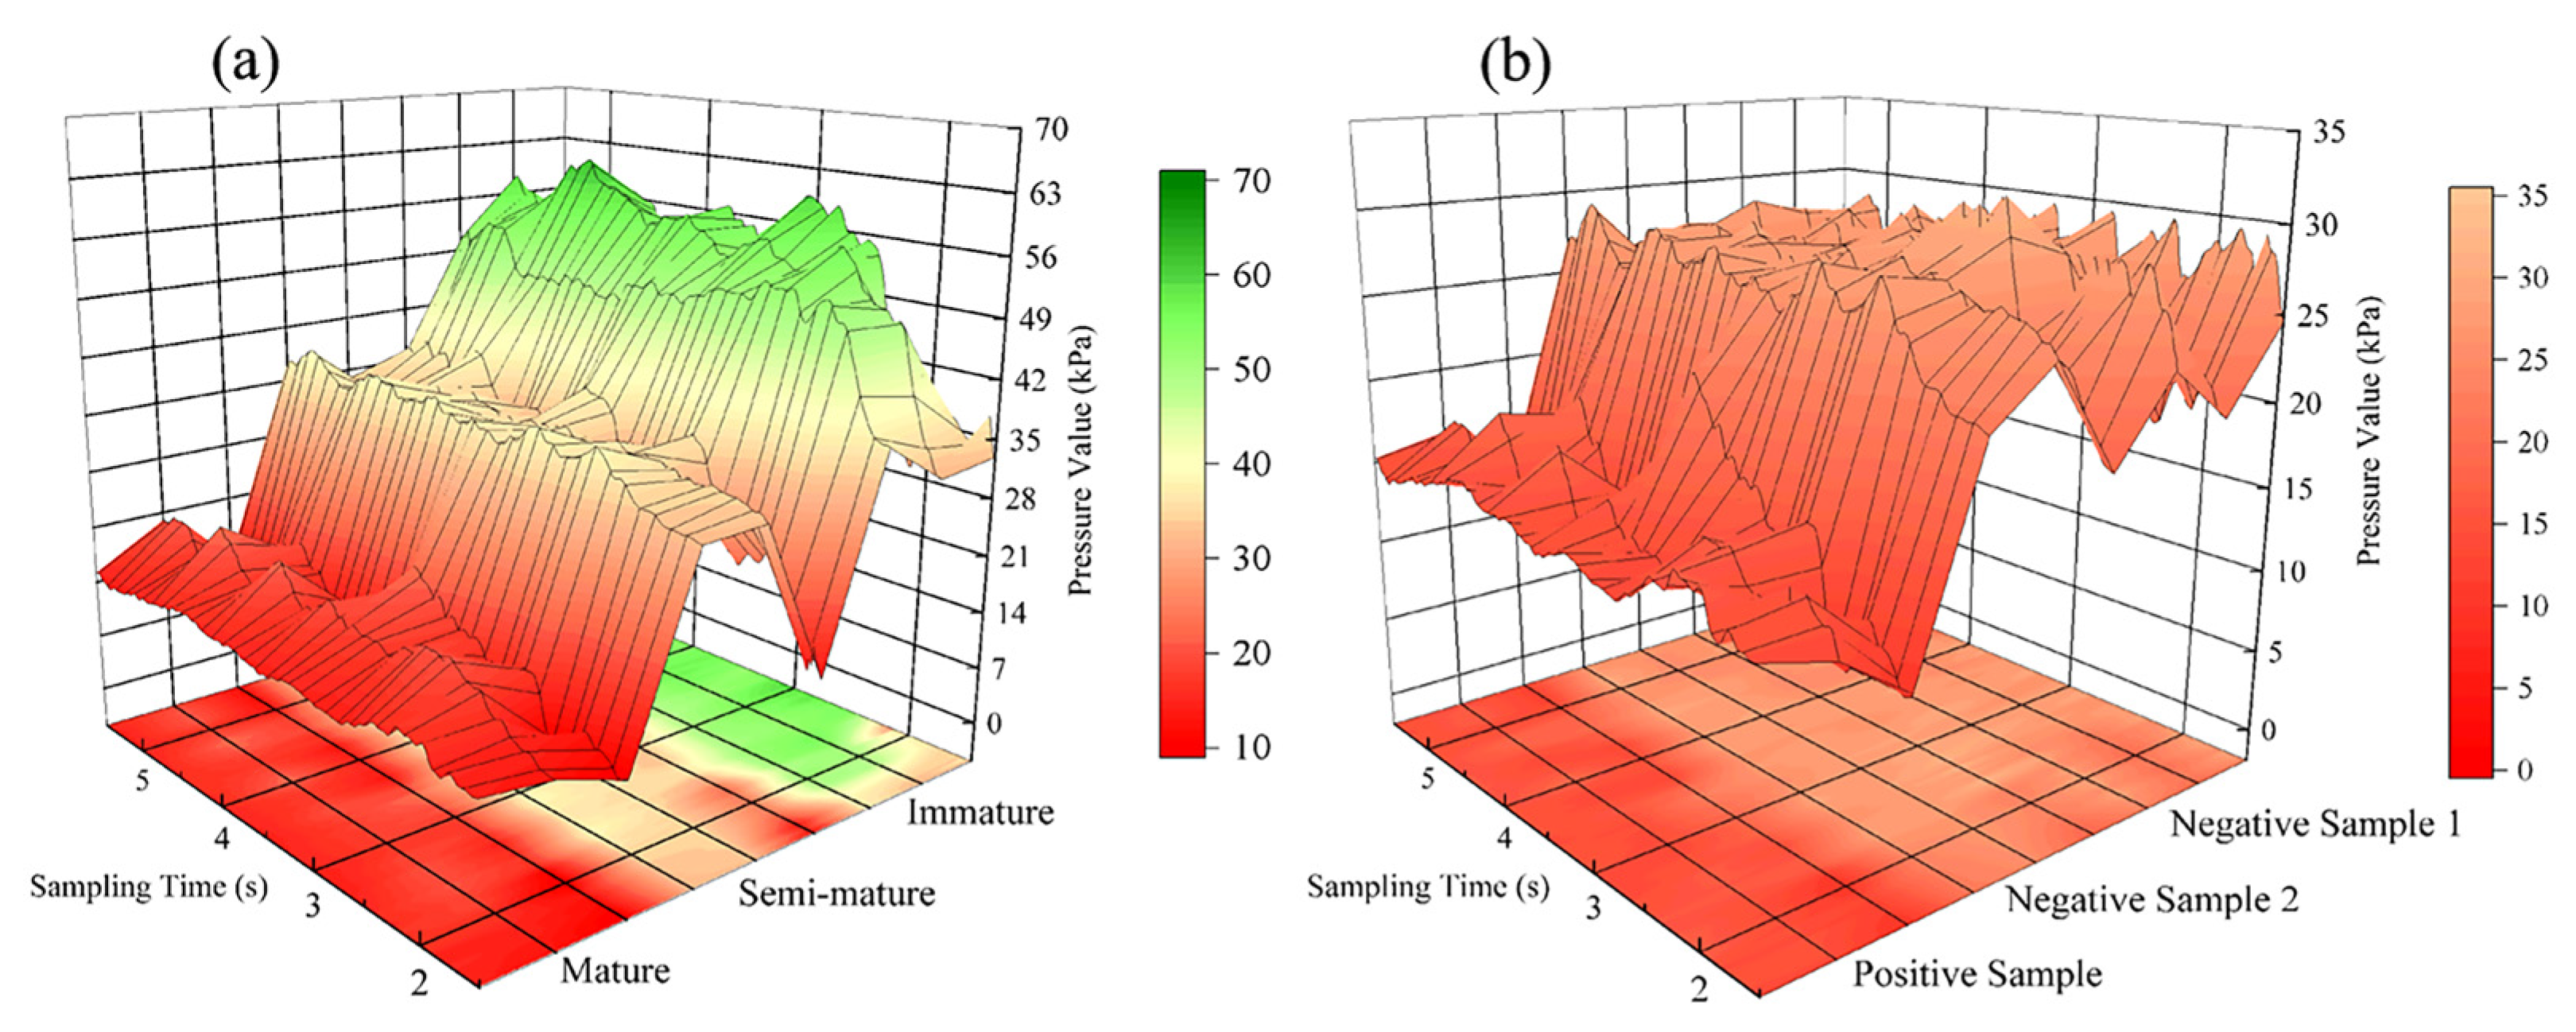
3.2.3. Analysis of Haptic Data
3.3. Multimodal Fusion Maturity Classification Model
3.3.1. Unimodal Maturity Classification
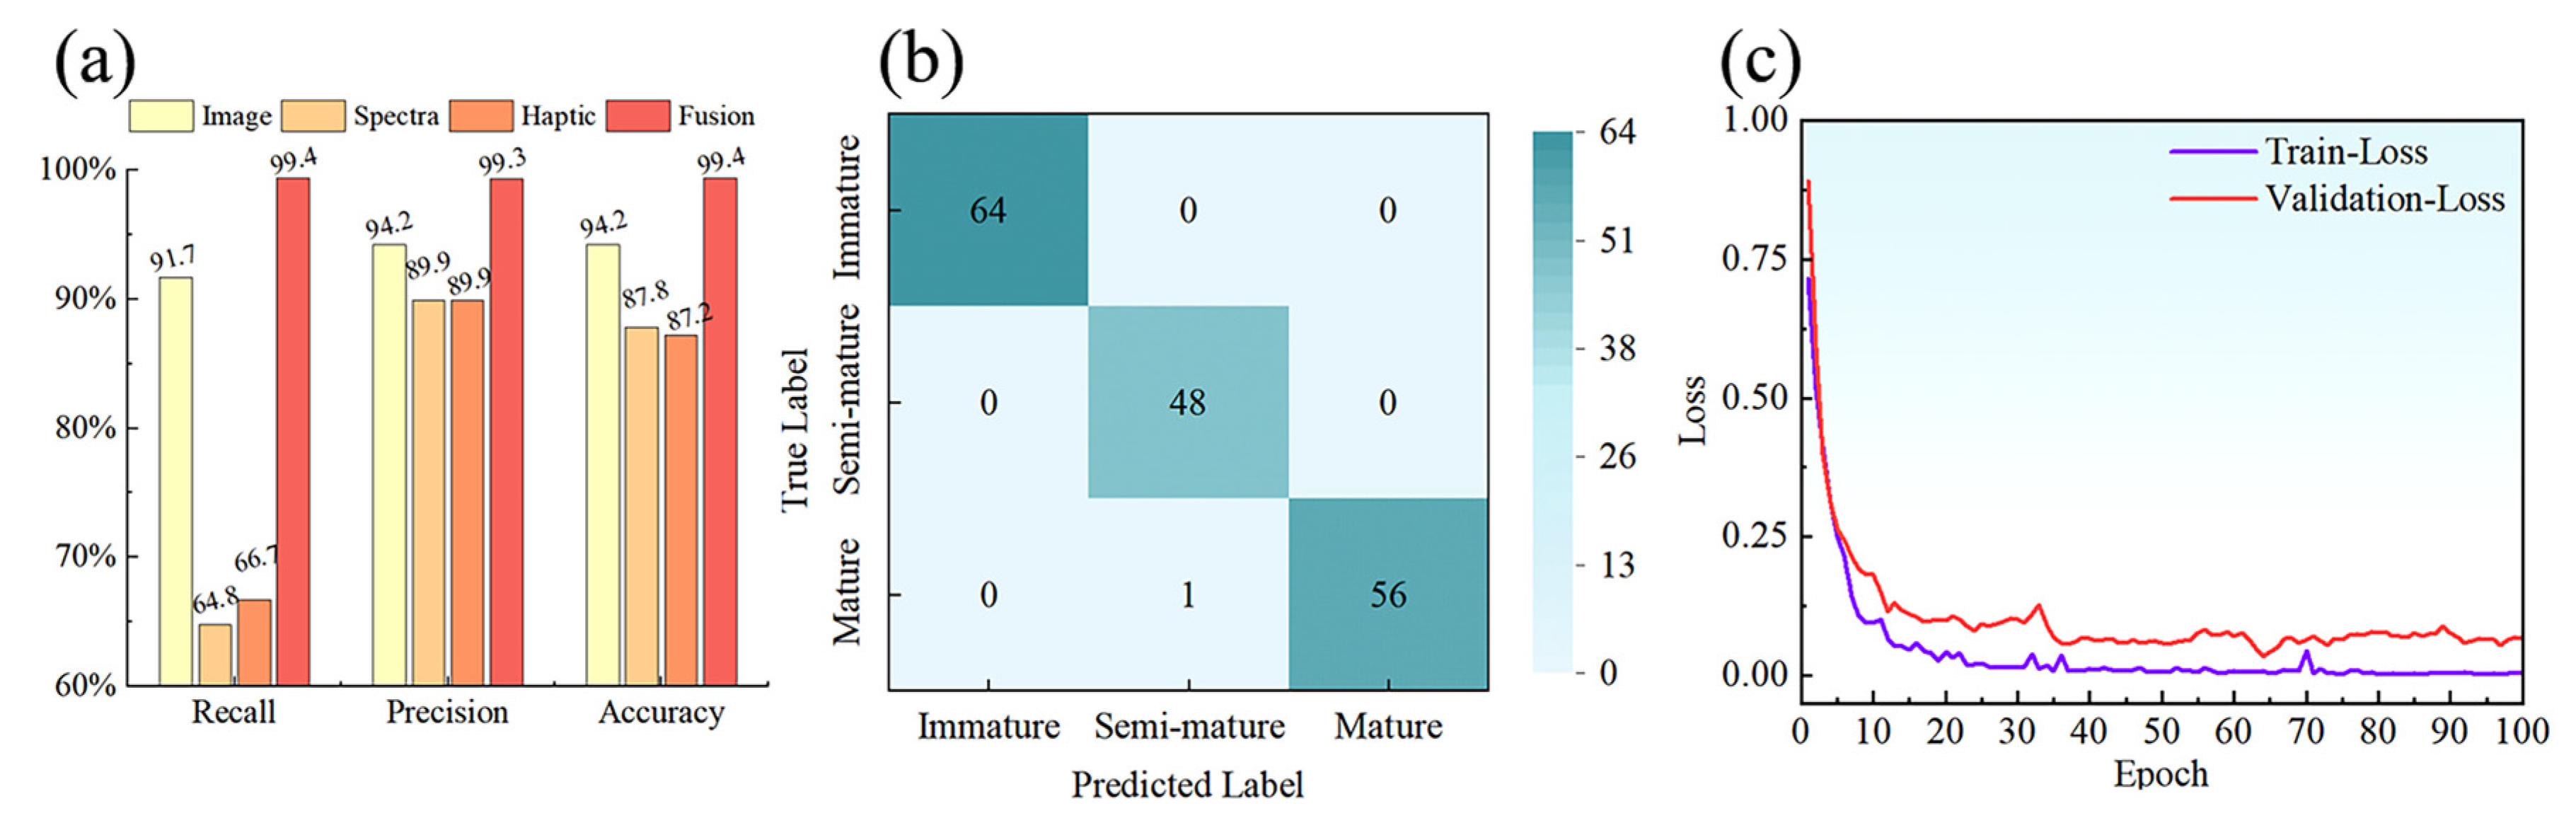
3.3.2. Multimodal Fusion Maturity Classification
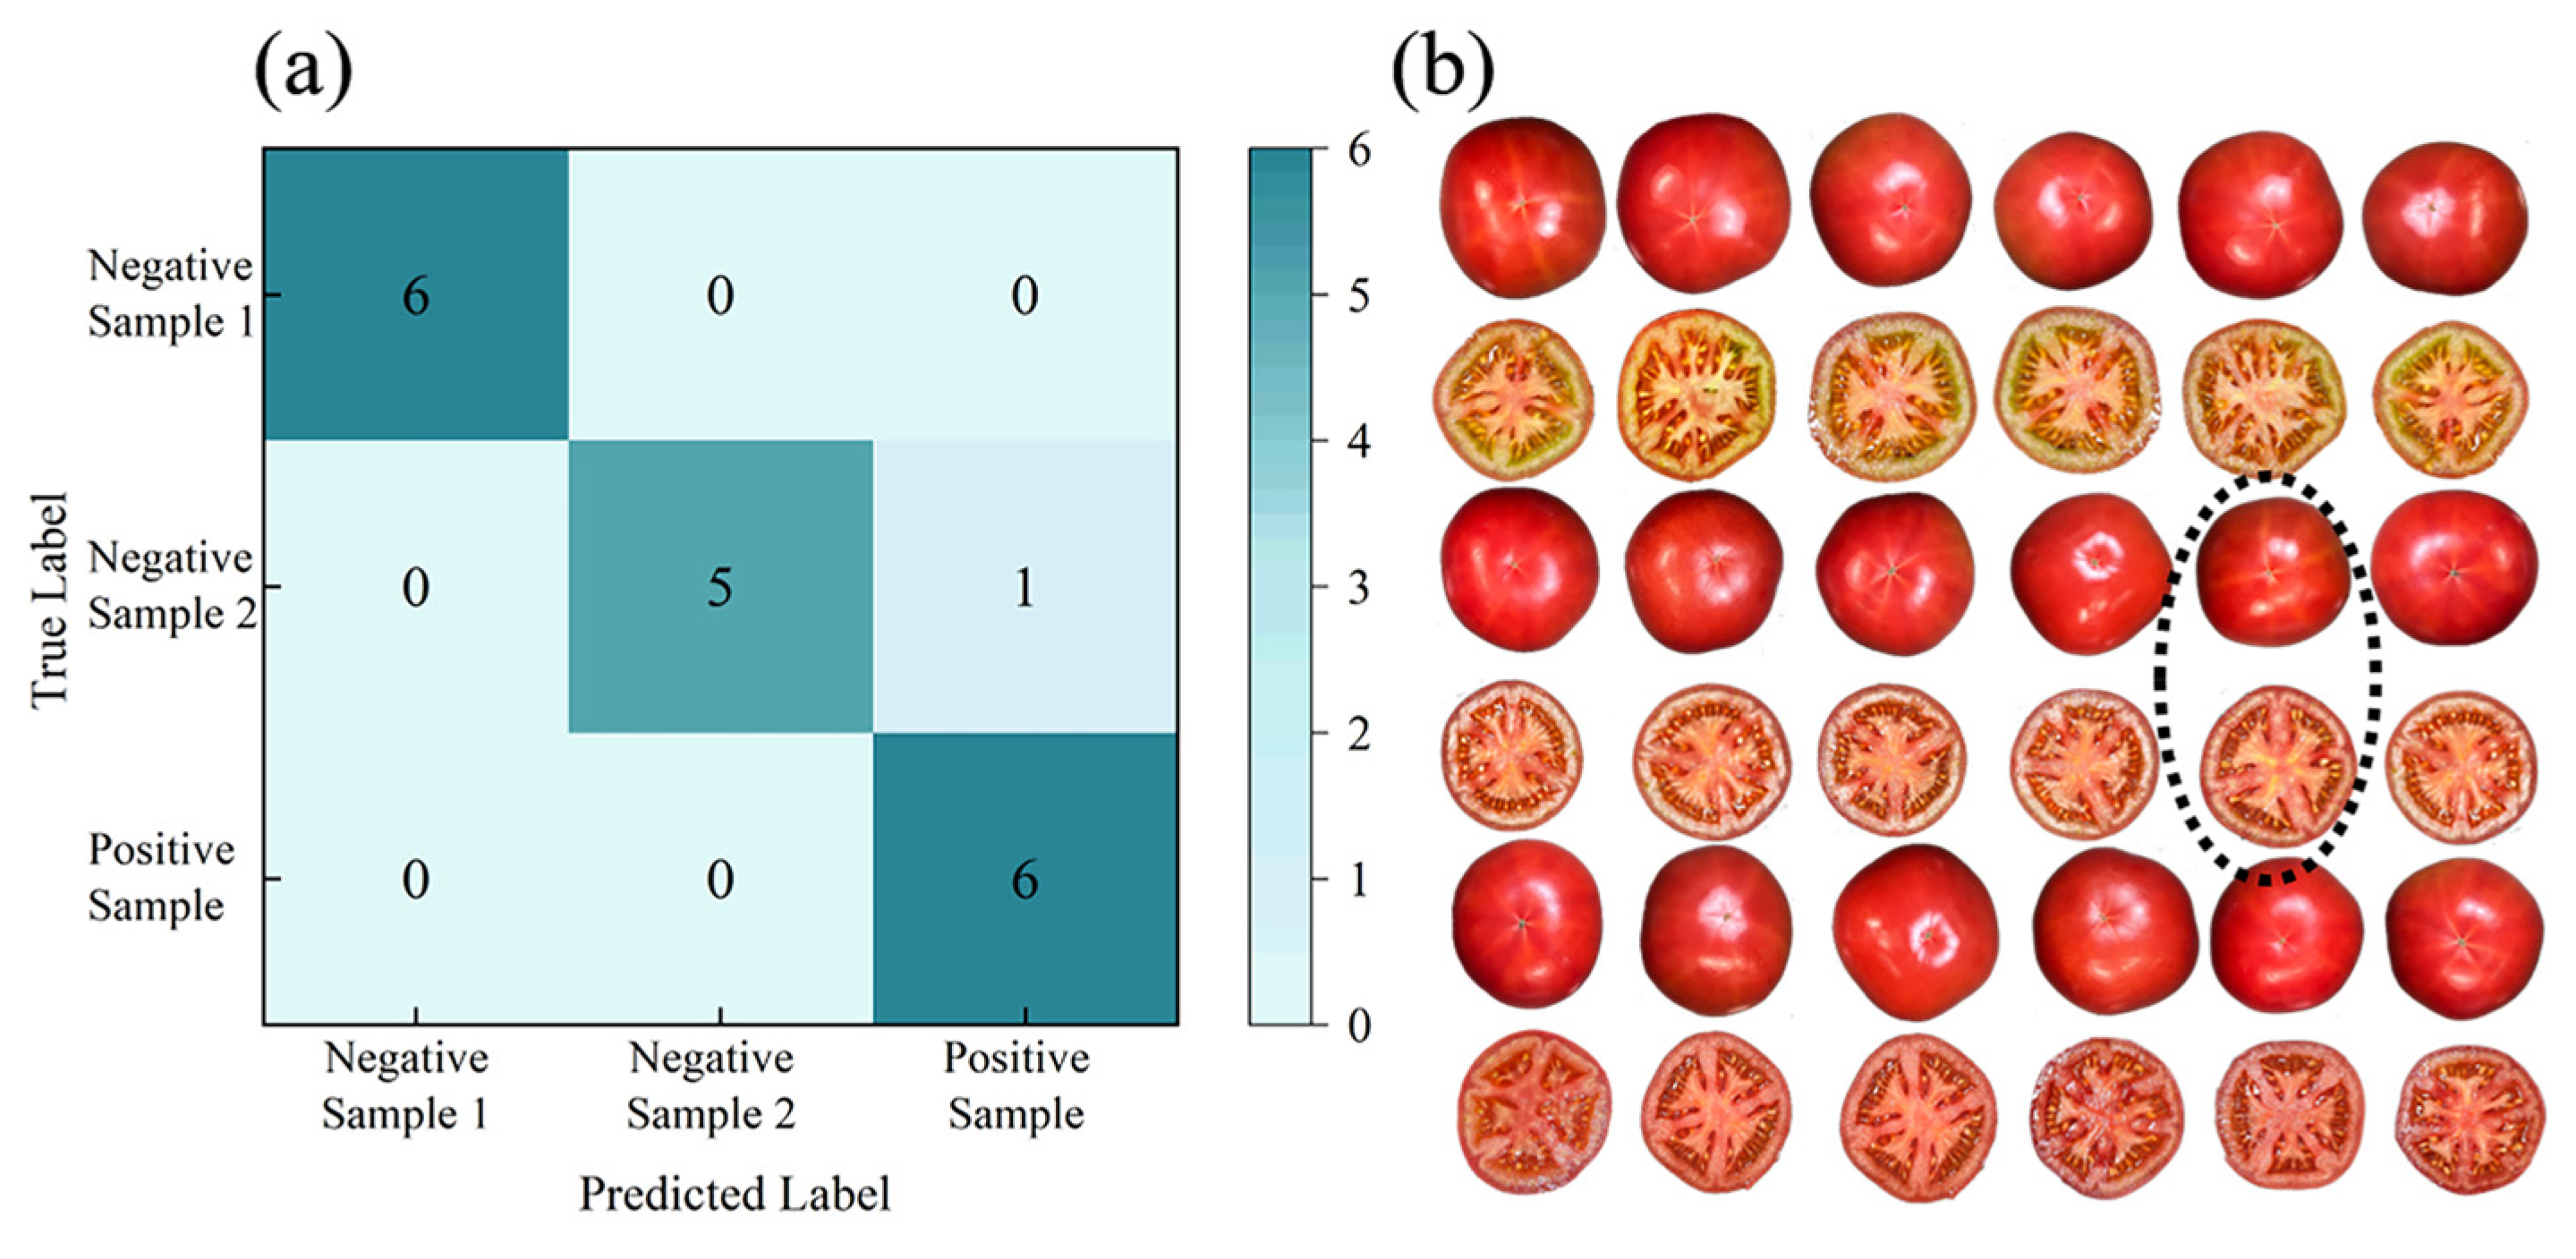
3.3.3. Independent Validation of Heterogeneous Samples of Internal and External Maturity
4. Conclusions
Author Contributions
Funding
Institutional Review Board Statement
Informed Consent Statement
Data Availability Statement
Conflicts of Interest
References
- Gómez, A.H.; Wang, J.; Hu, G.; Pereira, A.G. Monitoring Storage Shelf Life of Tomato Using Electronic Nose Technique. J. Food Eng. 2008, 85, 625–631. [Google Scholar] [CrossRef]
- Burton-Freeman, B.M.; Sesso, H.D. Whole Food versus Supplement: Comparing the Clinical Evidence of Tomato Intake and Lycopene Supplementation on Cardiovascular Risk Factors. Adv. Nutr. 2014, 5, 457–485. [Google Scholar] [CrossRef] [PubMed]
- Michaličková, D.; Belović, M.; Ilić, N.; Kotur-Stevuljević, J.; Slanař, O.; Šobajić, S. Comparison of Polyphenol-Enriched Tomato Juice and Standard Tomato Juice for Cardiovascular Benefits in Subjects with Stage 1 Hypertension: A Randomized Controlled Study. Plant Foods Hum. Nutr. 2019, 74, 122–127. [Google Scholar] [CrossRef] [PubMed]
- Seo, D.; Cho, B.-H.; Kim, K.-C. Development of Monitoring Robot System for Tomato Fruits in Hydroponic Greenhouses. Agronomy 2021, 11, 2211. [Google Scholar] [CrossRef]
- Nguyen, L.T.; Tay, A.; Balasubramaniam, V.M.; Legan, J.D.; Turek, E.J.; Gupta, R. Evaluating the Impact of Thermal and Pressure Treatment in Preserving Textural Quality of Selected Foods. LWT-Food Sci. Technol. 2010, 43, 525–534. [Google Scholar] [CrossRef]
- Sirisomboon, P.; Tanaka, M.; Kojima, T. Evaluation of Tomato Textural Mechanical Properties. J. Food Eng. 2012, 111, 618–624. [Google Scholar] [CrossRef]
- Zhang, J.; Wang, X.; Xia, J.; Xing, S.; Zhang, X. Flexible Sensing Enabled Intelligent Manipulator System (FSIMS) for Avocados (Persea Americana Mill) Ripeness Grading. J. Clean. Prod. 2022, 363, 132599. [Google Scholar] [CrossRef]
- Chen, Y.; Lin, J.; Du, X.; Fang, B.; Sun, F.; Li, S. Non-Destructive Fruit Firmness Evaluation Using Vision-Based Tactile Information. In Proceedings of the IEEE 2022 International Conference on Robotics and Automation (ICRA), Philadelphia, PA, USA, 23–27 May 2022; pp. 2303–2309. [Google Scholar]
- Sabzi, S.; Nadimi, M.; Abbaspour-Gilandeh, Y.; Paliwal, J. Non-Destructive Estimation of Physicochemical Properties and Detection of Ripeness Level of Apples Using Machine Vision. Int. J. Fruit Sci. 2022, 22, 628–645. [Google Scholar] [CrossRef]
- Miraei Ashtiani, S.-H.; Javanmardi, S.; Jahanbanifard, M.; Martynenko, A.; Verbeek, F.J. Detection of Mulberry Ripeness Stages Using Deep Learning Models. IEEE Access 2021, 9, 100380–100394. [Google Scholar] [CrossRef]
- Jiang, X.; Zhu, M.; Yao, J.; Zhang, Y.; Liu, Y. Calibration of Near Infrared Spectroscopy of Apples with Different Fruit Sizes to Improve Soluble Solids Content Model Performance. Foods 2022, 11, 1923. [Google Scholar] [CrossRef]
- Wedding, B.B.; Wright, C.; Grauf, S.; Gadek, P.; White, R.D. The Application of FT-NIRS for the Detection of Bruises and the Prediction of Rot Susceptibility of ‘Hass’ Avocado Fruit. J. Sci. Food Agric. 2019, 99, 1880–1887. [Google Scholar] [CrossRef]
- Varga, L.A.; Makowski, J.; Zell, A. Measuring the Ripeness of Fruit with Hyperspectral Imaging and Deep Learning. In Proceedings of the IEEE 2021 International Joint Conference on Neural Networks (IJCNN), Shenzhen, China, 18–22 July 2021; pp. 1–8. [Google Scholar]
- Verma, P.K.; Pathak, P.; Kumar, B.; Himani, H.; Preety, P. Automatic Optical Imaging System for Mango Fruit Using Hyperspectral Camera and Deep Learning Algorithm. IJRITCC 2023, 11, 112–117. [Google Scholar] [CrossRef]
- Tyagi, P.; Semwal, R.; Sharma, A.; Tiwary, U.S.; Varadwaj, P. E-Nose: A Low-Cost Fruit Ripeness Monitoring System. J. Agric. Eng. 2022, 54. [Google Scholar] [CrossRef]
- Chen, L.-Y.; Wu, C.-C.; Chou, T.-I.; Chiu, S.-W.; Tang, K.-T. Development of a Dual MOS Electronic Nose/Camera System for Improving Fruit Ripeness Classification. Sensors 2018, 18, 3256. [Google Scholar] [CrossRef]
- Pagés, G.; Deborde, C.; Lemaire-Chamley, M.; Moing, A.; Bonny, J.-M. MRSI vs CEST MRI to Understand Tomato Metabolism in Ripening Fruit: Is There a Better Contrast? Anal. Bioanal. Chem. 2021, 413, 1251–1257. [Google Scholar] [CrossRef]
- Kamal, T.; Cheng, S.; Khan, I.A.; Nawab, K.; Zhang, T.; Song, Y.; Wang, S.; Nadeem, M.; Riaz, M.; Khan, M.A.U.; et al. Potential Uses of LF-NMR and MRI in the Study of Water Dynamics and Quality Measurement of Fruits and Vegetables. J. Food Process. Preserv. 2019, 43, e14202. [Google Scholar] [CrossRef]
- Kim, J.; Pyo, H.; Jang, I.; Kang, J.; Ju, B.; Ko, K. Tomato Harvesting Robotic System Based on Deep-ToMaToS: Deep Learning Network Using Transformation Loss for 6D Pose Estimation of Maturity Classified Tomatoes with Side-Stem. Comput. Electron. Agric. 2022, 201, 107300. [Google Scholar] [CrossRef]
- Liu, L.; Li, Z.; Lan, Y.; Shi, Y.; Cui, Y. Design of a Tomato Classifier Based on Machine Vision. PLoS ONE 2019, 14, e0219803. [Google Scholar] [CrossRef]
- Kao, I.-H.; Hsu, Y.-W.; Yang, Y.-Z.; Chen, Y.-L.; Lai, Y.-H.; Perng, J.-W. Determination of Lycopersicon Maturity Using Convolutional Autoencoders. Sci. Hortic. 2019, 256, 108538. [Google Scholar] [CrossRef]
- Alenazi, M.M.; Shafiq, M.; Alsadon, A.A.; Alhelal, I.M.; Alhamdan, A.M.; Solieman, T.H.I.; Ibrahim, A.A.; Shady, M.R.; Saad, M.A.O. Non-Destructive Assessment of Flesh Firmness and Dietary Antioxidants of Greenhouse-Grown Tomato (Solanum lycopersicum L.) at Different Fruit Maturity Stages. Saudi J. Biol. Sci. 2020, 27, 2839–2846. [Google Scholar] [CrossRef]
- Huang, Y.; Dong, W.; Chen, Y.; Wang, X.; Luo, W.; Zhan, B.; Liu, X.; Zhang, H. Online Detection of Soluble Solids Content and Maturity of Tomatoes Using Vis/NIR Full Transmittance Spectra. Chemom. Intell. Lab. Syst. 2021, 210, 104243. [Google Scholar] [CrossRef]
- Maharshi, V.; Sharma, S.; Prajesh, R.; Das, S.; Agarwal, A.; Mitra, B. A Novel Sensor for Fruit Ripeness Estimation Using Lithography Free Approach. IEEE Sens. J. 2022, 22, 22192–22199. [Google Scholar] [CrossRef]
- Azhari, S.; Setoguchi, T.; Sasaki, I.; Nakagawa, A.; Ikeda, K.; Azhari, A.; Hasan, I.H.; Hamidon, M.N.; Fukunaga, N.; Shibata, T.; et al. Toward Automated Tomato Harvesting System: Integration of Haptic Based Piezoresistive Nanocomposite and Machine Learning. IEEE Sens. J. 2021, 21, 27810–27817. [Google Scholar] [CrossRef]
- TermehYousefi, A.; Azhari, S.; Khajeh, A.; Hamidon, M.N.; Tanaka, H. Development of Haptic Based Piezoresistive Artificial Fingertip: Toward Efficient Tactile Sensing Systems for Humanoids. Mater. Sci. Eng. C 2017, 77, 1098–1103. [Google Scholar] [CrossRef] [PubMed]
- Parajuli, P.; Yoon, S.-C.; Zhuang, H.; Bowker, B. Characterizing the Spatial Distribution of Woody Breast Condition in Broiler Breast Fillet by Compression Force Measurement. Food Meas. 2024, 18, 1991–2003. [Google Scholar] [CrossRef]
- Jena, A.; Bamola, A.; Mishra, S.; Jain, I.; Pathak, N.; Sharma, N.; Joshi, N.; Pandey, R.; Kaparwal, S.; Yadav, V.; et al. State-of-the-Art Non-Destructive Approaches for Maturity Index Determination in Fruits and Vegetables: Principles, Applications, and Future Directions. Food Prod. Process. Nutr. 2024, 6, 56. [Google Scholar]
- Odusami, M.; Maskeliūnas, R.; Damaševičius, R. Pixel-Level Fusion Approach with Vision Transformer for Early Detection of Alzheimer’s Disease. Electronics 2023, 12, 1218. [Google Scholar] [CrossRef]
- Chen, L.; Wang, K.; Li, M.; Wu, M.; Pedrycz, W.; Hirota, K. K-Means Clustering-Based Kernel Canonical Correlation Analysis for Multimodal Emotion Recognition in Human–Robot Interaction. IEEE Trans. Ind. Electron. 2023, 70, 1016–1024. [Google Scholar] [CrossRef]
- Chango, W.; Lara, J.A.; Cerezo, R.; Romero, C. A Review on Data Fusion in Multimodal Learning Analytics and Educational Data Mining. WIREs Data Min. Knowl. 2022, 12, e1458. [Google Scholar] [CrossRef]
- Qiu, S.; Cui, X.; Ping, Z.; Shan, N.; Li, Z.; Bao, X.; Xu, X. Deep Learning Techniques in Intelligent Fault Diagnosis and Prognosis for Industrial Systems: A Review. Sensors 2023, 23, 1305. [Google Scholar] [CrossRef]
- Zhou, W.; Dong, S.; Lei, J.; Yu, L. MTANet: Multitask-Aware Network With Hierarchical Multimodal Fusion for RGB-T Urban Scene Understanding. IEEE Trans. Intell. Veh. 2023, 8, 48–58. [Google Scholar] [CrossRef]
- Xia, F.; Lou, Z.; Sun, D.; Li, H.; Quan, L. Weed Resistance Assessment through Airborne Multimodal Data Fusion and Deep Learning: A Novel Approach towards Sustainable Agriculture. Int. J. Appl. Earth Obs. Geoinf. 2023, 120, 103352. [Google Scholar] [CrossRef]
- Li, W.; Liu, Z.; Hu, Z. Effects of Nitrogen and Potassium Fertilizers on Potato Growth and Quality under Multimodal Sensor Data Fusion. Mob. Inf. Syst. 2022, 2022, 6726204. [Google Scholar] [CrossRef]
- Lan, Y.; Guo, Y.; Chen, Q.; Lin, S.; Chen, Y.; Deng, X. Visual Question Answering Model for Fruit Tree Disease Decision-Making Based on Multimodal Deep Learning. Front. Plant Sci. 2023, 13, 1064399. [Google Scholar] [CrossRef] [PubMed]
- Garillos-Manliguez, C.A.; Chiang, J.Y. Multimodal Deep Learning and Visible-Light and Hyperspectral Imaging for Fruit Maturity Estimation. Sensors 2021, 21, 1288. [Google Scholar] [CrossRef]
- Garillos-Manliguez, C.A.; Chiang, J.Y. Multimodal Deep Learning via Late Fusion for Non-Destructive Papaya Fruit Maturity Classification. In Proceedings of the IEEE 2021 18th International Conference on Electrical Engineering, Computing Science and Automatic Control (CCE), Mexico City, Mexico, 10–12 November 2021; pp. 1–6. [Google Scholar]
- Suharjito; Junior, F.A.; Koeswandy, Y.P.; Debi Nurhayati, P.W.; Asrol, M.; Marimin. Annotated Datasets of Oil Palm Fruit Bunch Piles for Ripeness Grading Using Deep Learning. Sci. Data 2023, 10, 72. [Google Scholar] [CrossRef] [PubMed]
- Ganguli, S.; Selvan, P.T.; Nayak, M.M.; Chaudhury, S.; Espina, R.U.; Ofori, I. Deep Learning Based Dual Channel Banana Grading System Using Convolution Neural Network. J. Food Qual. 2022, 2022, 6050284. [Google Scholar] [CrossRef]
- USDA. U.S. Standards for Grades of Fresh Tomatoes; United States Department of Agriculture; Agricultural Marketing Service: Washington, DC, USA, 1991. [Google Scholar]
- Huang, Y.P.; Wang, D.Z.; Zhou, H.Y.; Yang, Y.T.; Chen, K.J. Ripeness Assessment of Tomato Fruit by Optical Absorption and Scattering Coefficient Spectra. Spectrosc. Spectr. Anal. 2020, 40, 3556–3561. [Google Scholar]
- Zhang, S.; Yang, Y.; Chen, C.; Zhang, X.; Leng, Q.; Zhao, X. Deep Learning-Based Multimodal Emotion Recognition from Audio, Visual, and Text Modalities: A Systematic Review of Recent Advancements and Future Prospects. Expert Syst. Appl. 2024, 237, 121692. [Google Scholar] [CrossRef]
- Jia, L.; Zhai, H.; Yuan, X.; Jiang, Y.; Ding, J. A Parallel Convolution and Decision Fusion-Based Flower Classification Method. Mathematics 2022, 10, 2767. [Google Scholar] [CrossRef]
- Zhang, H.; Li, Y.; Zhang, Y.; Shen, Q. Spectral-Spatial Classification of Hyperspectral Imagery Using a Dual-Channel Convolutional Neural Network. Remote Sens. Lett. 2017, 8, 438–447. [Google Scholar] [CrossRef]
- Hochreiter, S.; Schmidhuber, J. Long short-term memory. Neural Comput. 1997, 9, 1735–1780. [Google Scholar] [CrossRef] [PubMed]
- Pastor, F.; García-González, J.; Gandarias, J.M.; Medina, D.; Closas, P.; García-Cerezo, A.J.; Gómez-de-Gabriel, J.M. Bayesian and Neural Inference on LSTM-Based Object Recognition from Tactile and Kinesthetic Information. IEEE Robot. Autom. Lett. 2021, 6, 231–238. [Google Scholar] [CrossRef]
- Bottcher, W.; Machado, P.; Lama, N.; McGinnity, T.M. Object Recognition for Robotics from Tactile Time Series Data Utilising Different Neural Network Architectures. In Proceedings of the 2021 International Joint Conference on Neural Networks (IJCNN), Shenzhen, China, 18–22 July 2021. [Google Scholar]
- Zhang, J.; Wu, X.; Huang, C. AdaMoW: Multimodal Sentiment Analysis Based on Adaptive Modality-Specific Weight Fusion Network. IEEE Access 2023, 11, 48410–48420. [Google Scholar] [CrossRef]
- Zhang, W.; Mi, L.; Thompson, P.M.; Wang, Y. A Geometric Framework for Feature Mappings in Multimodal Fusion of Brain Image Data. In Information Processing in Medical Imaging; Chung, A.C.S., Gee, J.C., Yushkevich, P.A., Bao, S., Eds.; Lecture Notes in Computer Science; Springer International Publishing: Cham, Switzerland, 2019; Volume 11492, pp. 617–630. ISBN 978-3-030-20350-4. [Google Scholar]
- Liu, B.; Ge, R.; Zhu, Y.; Zhang, B.; Zhang, X.; Bao, Y. IDAF: Iterative Dual-Scale Attentional Fusion Network for Automatic Modulation Recognition. Sensors 2023, 23, 8134. [Google Scholar] [CrossRef]
- Nakayasu, M.; Umemoto, N.; Akiyama, R.; Ohyama, K.; Lee, H.J.; Miyachi, H.; Watanabe, B.; Muranaka, T.; Saito, K.; Sugimoto, Y.; et al. Characterization of C-26 Aminotransferase, Indispensable for Steroidal Glycoalkaloid Biosynthesis. Plant J. 2021, 108, 81–92. [Google Scholar] [CrossRef] [PubMed]
- Qin, J.; Lu, R. Measurement of the Optical Properties of Fruits and Vegetables Using Spatially Resolved Hyperspectral Diffuse Reflectance Imaging Technique. Postharvest Biol. Technol. 2008, 49, 355–365. [Google Scholar] [CrossRef]
- Williams, P.; Norris, K. Near-Infrared Technology in the Agricultural and Food Industries; American Association of Cereal Chemists, Inc.: St. Paul, MO, USA, 1987; ISBN 0-913250-49-X. [Google Scholar]
- Van Dijk, C.; Boeriu, C.; Stolle-Smits, T.; Tijskens, L.M.M. The Firmness of Stored Tomatoes (Cv. Tradiro). 2. Kinetic and Near Infrared Models to Describe Pectin Degrading Enzymes and Firmness Loss. J. Food Eng. 2006, 77, 585–593. [Google Scholar] [CrossRef]


| Models | Accuracy | Precision | Recall | ||||||
|---|---|---|---|---|---|---|---|---|---|
| Training Set | Validation Set | Test Set | Training Set | Validation Set | Test Set | Training Set | Validation Set | Test Set | |
| Imagery | 94.0% | 93..4% | 94.2% | 94.5% | 94.6% | 94.2% | 94.8% | 94.7% | 91.7% |
| Spectral | 87.3% | 84.7% | 87.8% | 89.7% | 87.6% | 89.9% | 66.3% | 65.2% | 64.8% |
| Haptic | 90.0% | 88.7% | 87.2% | 90.4% | 89.7% | 89.9% | 66.7% | 66.7% | 66.7% |
Disclaimer/Publisher’s Note: The statements, opinions and data contained in all publications are solely those of the individual author(s) and contributor(s) and not of MDPI and/or the editor(s). MDPI and/or the editor(s) disclaim responsibility for any injury to people or property resulting from any ideas, methods, instructions or products referred to in the content. |
© 2024 by the authors. Licensee MDPI, Basel, Switzerland. This article is an open access article distributed under the terms and conditions of the Creative Commons Attribution (CC BY) license (https://creativecommons.org/licenses/by/4.0/).
Share and Cite
Liu, Y.; Wei, C.; Yoon, S.-C.; Ni, X.; Wang, W.; Liu, Y.; Wang, D.; Wang, X.; Guo, X. Development of Multimodal Fusion Technology for Tomato Maturity Assessment. Sensors 2024, 24, 2467. https://doi.org/10.3390/s24082467
Liu Y, Wei C, Yoon S-C, Ni X, Wang W, Liu Y, Wang D, Wang X, Guo X. Development of Multimodal Fusion Technology for Tomato Maturity Assessment. Sensors. 2024; 24(8):2467. https://doi.org/10.3390/s24082467
Chicago/Turabian StyleLiu, Yang, Chaojie Wei, Seung-Chul Yoon, Xinzhi Ni, Wei Wang, Yizhe Liu, Daren Wang, Xiaorong Wang, and Xiaohuan Guo. 2024. "Development of Multimodal Fusion Technology for Tomato Maturity Assessment" Sensors 24, no. 8: 2467. https://doi.org/10.3390/s24082467
APA StyleLiu, Y., Wei, C., Yoon, S.-C., Ni, X., Wang, W., Liu, Y., Wang, D., Wang, X., & Guo, X. (2024). Development of Multimodal Fusion Technology for Tomato Maturity Assessment. Sensors, 24(8), 2467. https://doi.org/10.3390/s24082467