
Local Distributed Node for Power Quality Event Detection Based on Multi-Sine Fitting Algorithm


Abstract
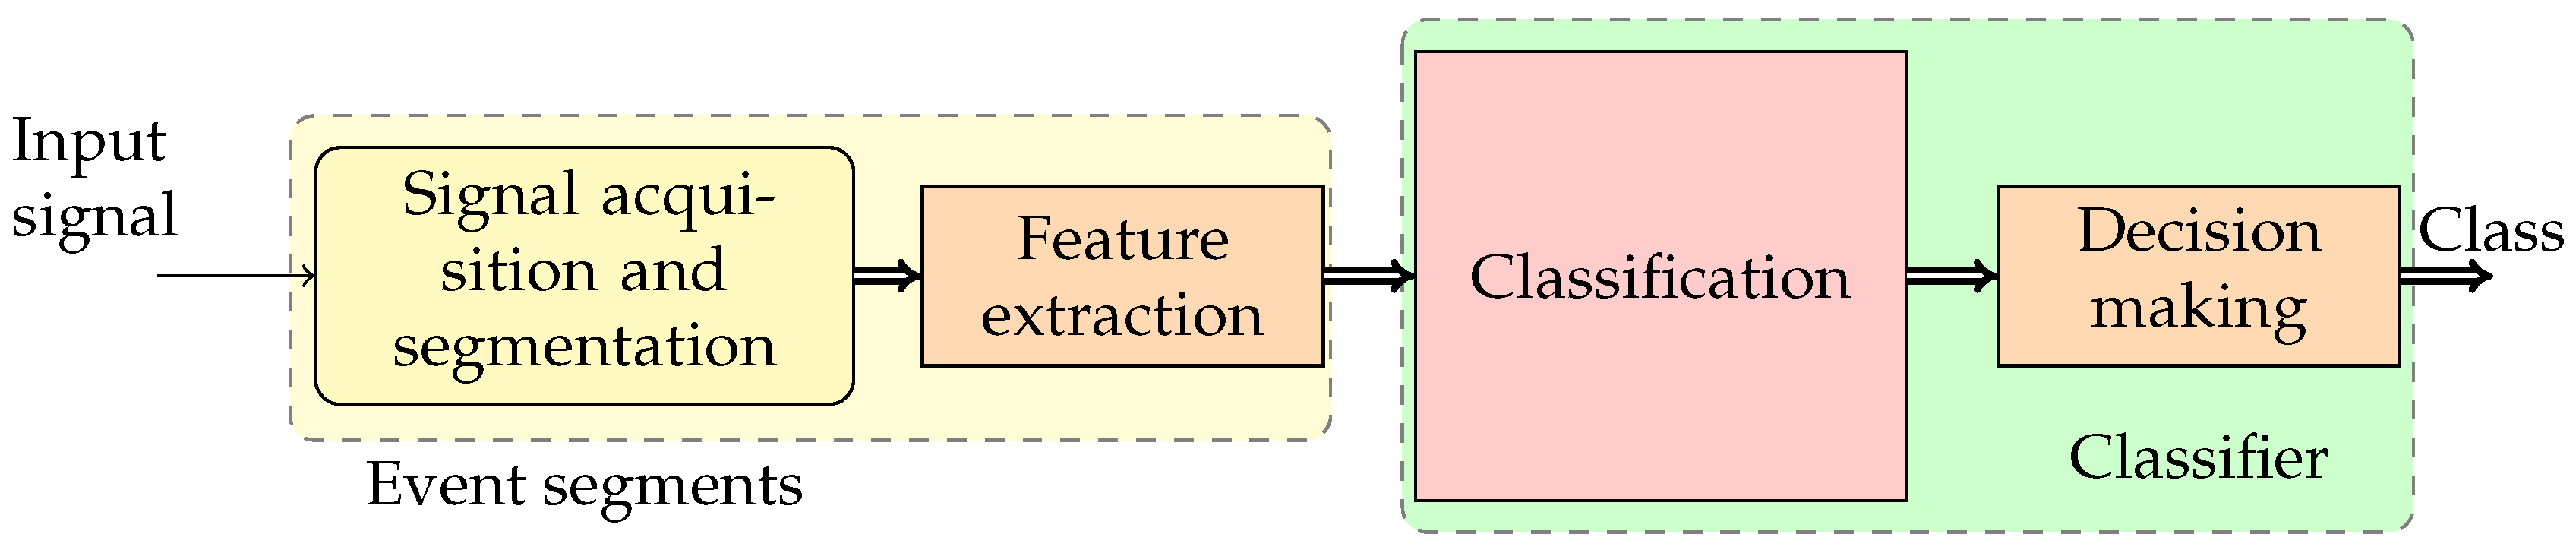
1. Introduction
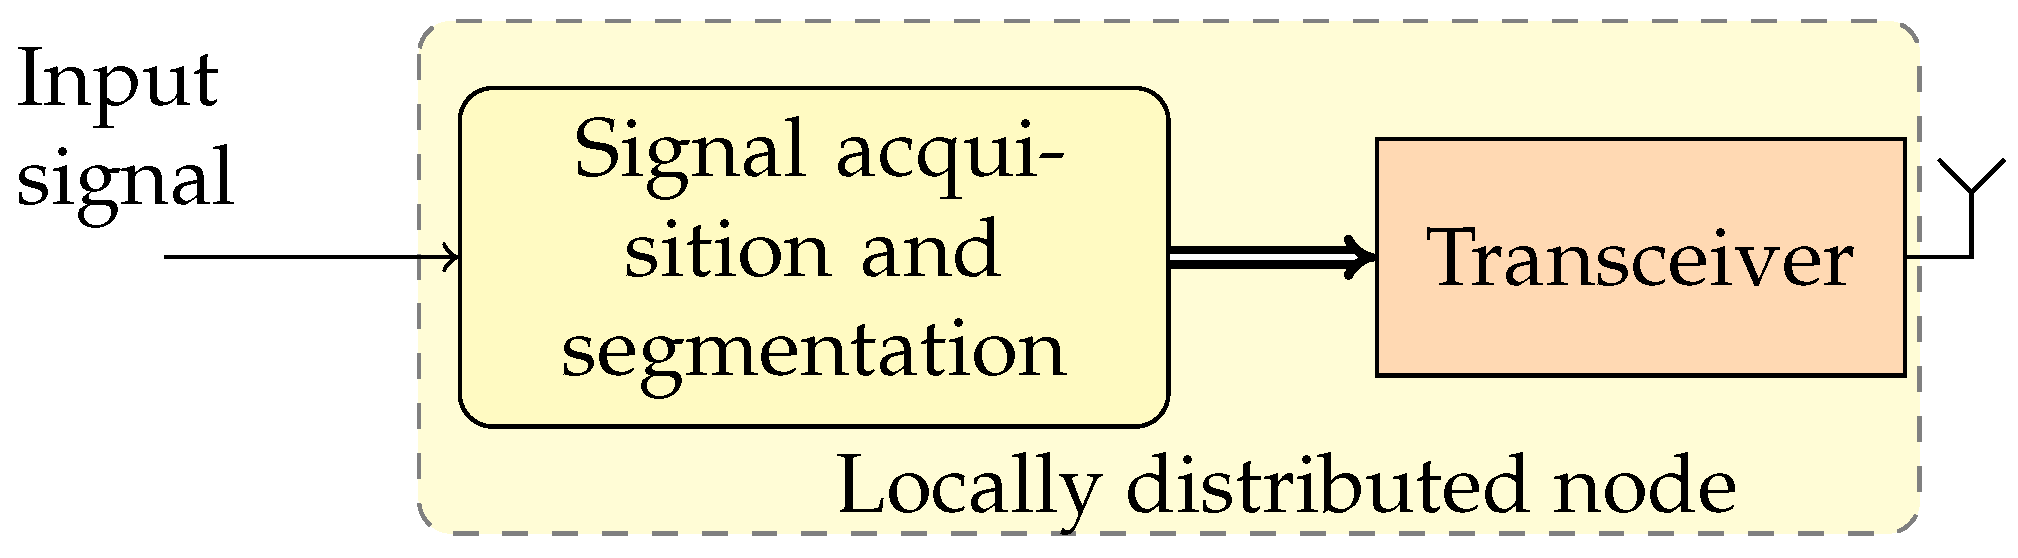
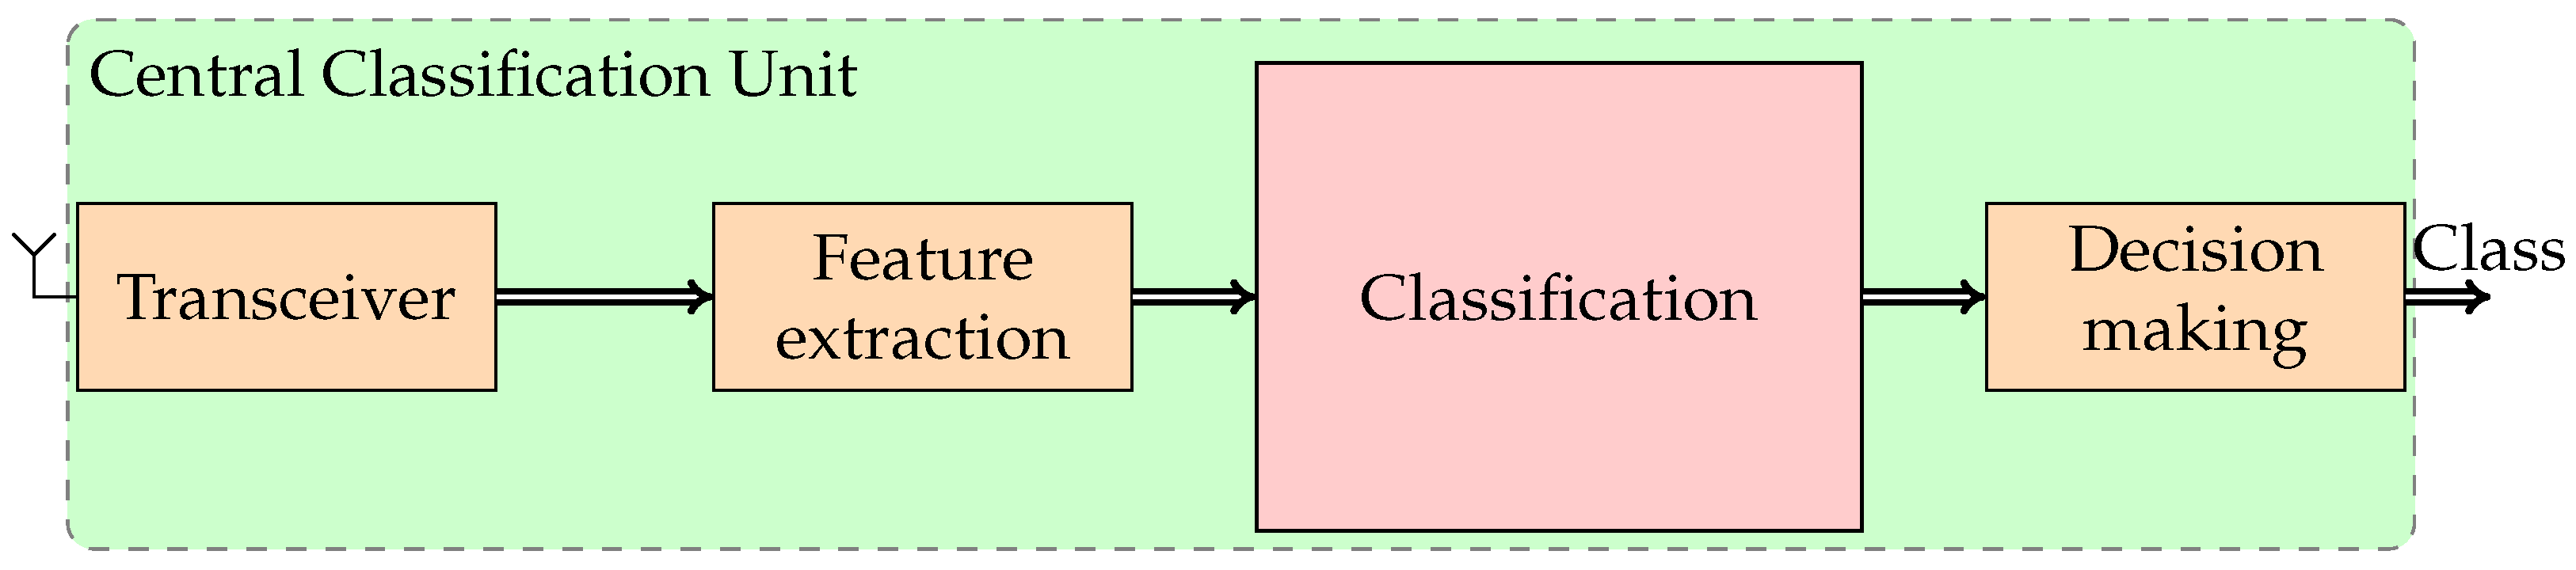
2. Proposed Distributed APQEC
3. Central Classification Unit
4. Locally Distributed Node Algorithm
4.1. Three-Parameter Multi-Sine Fitting Algorithm
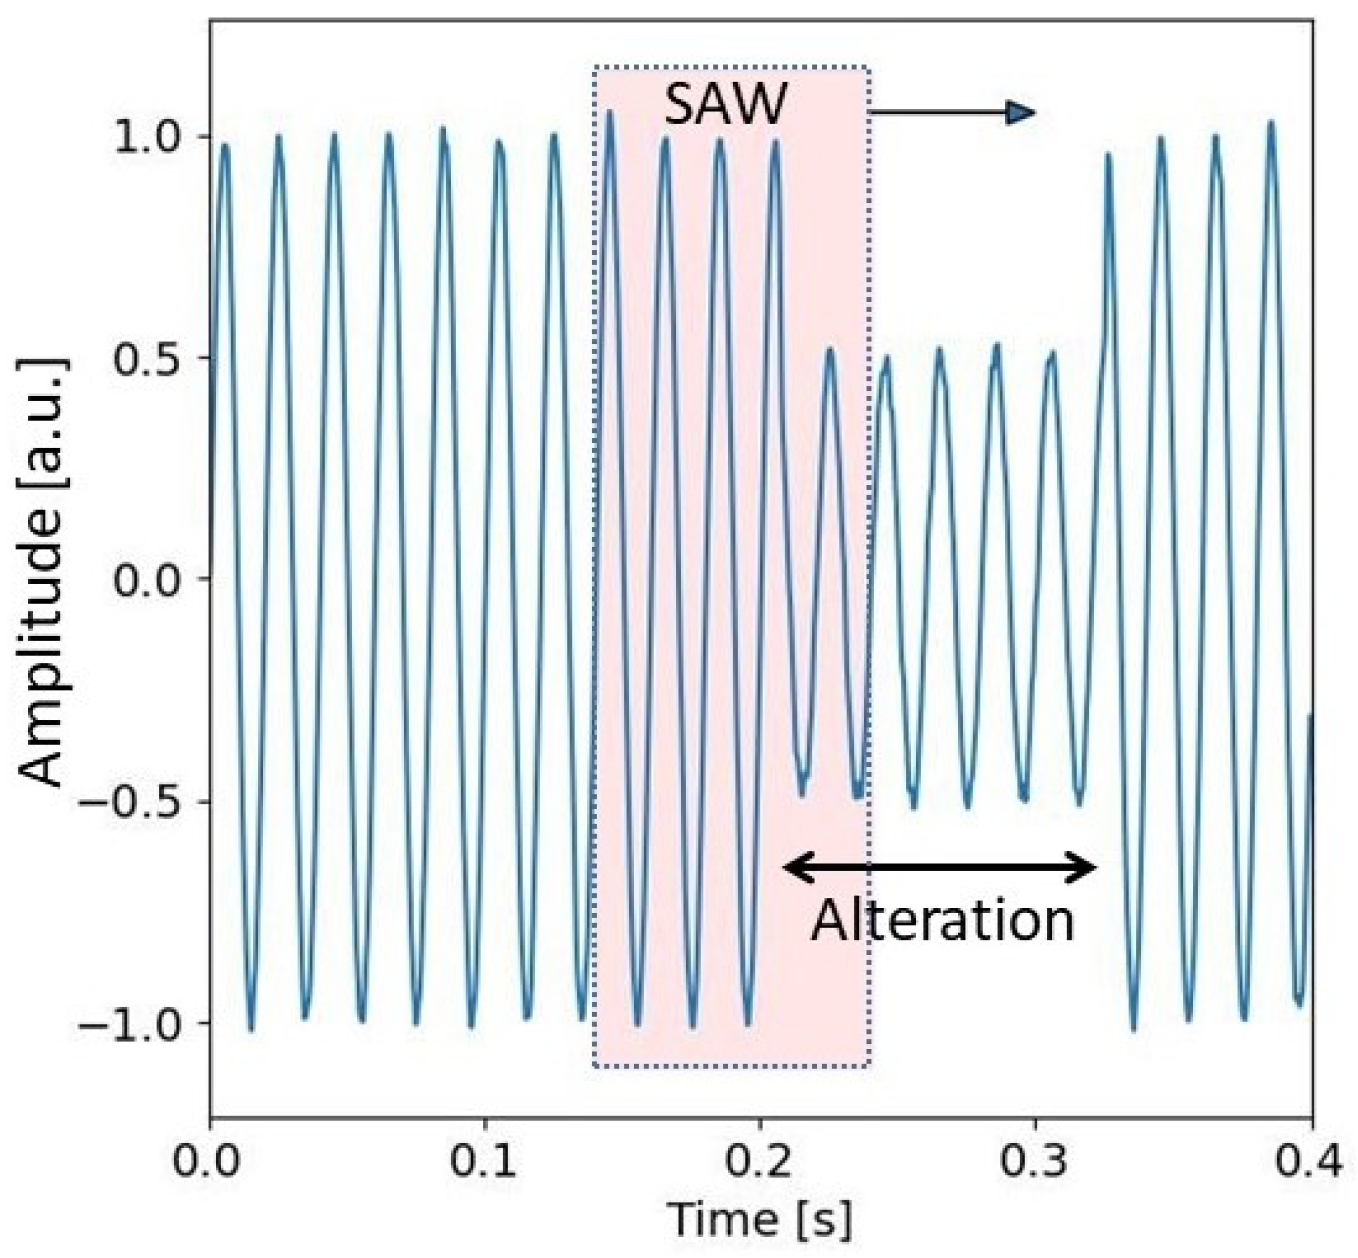
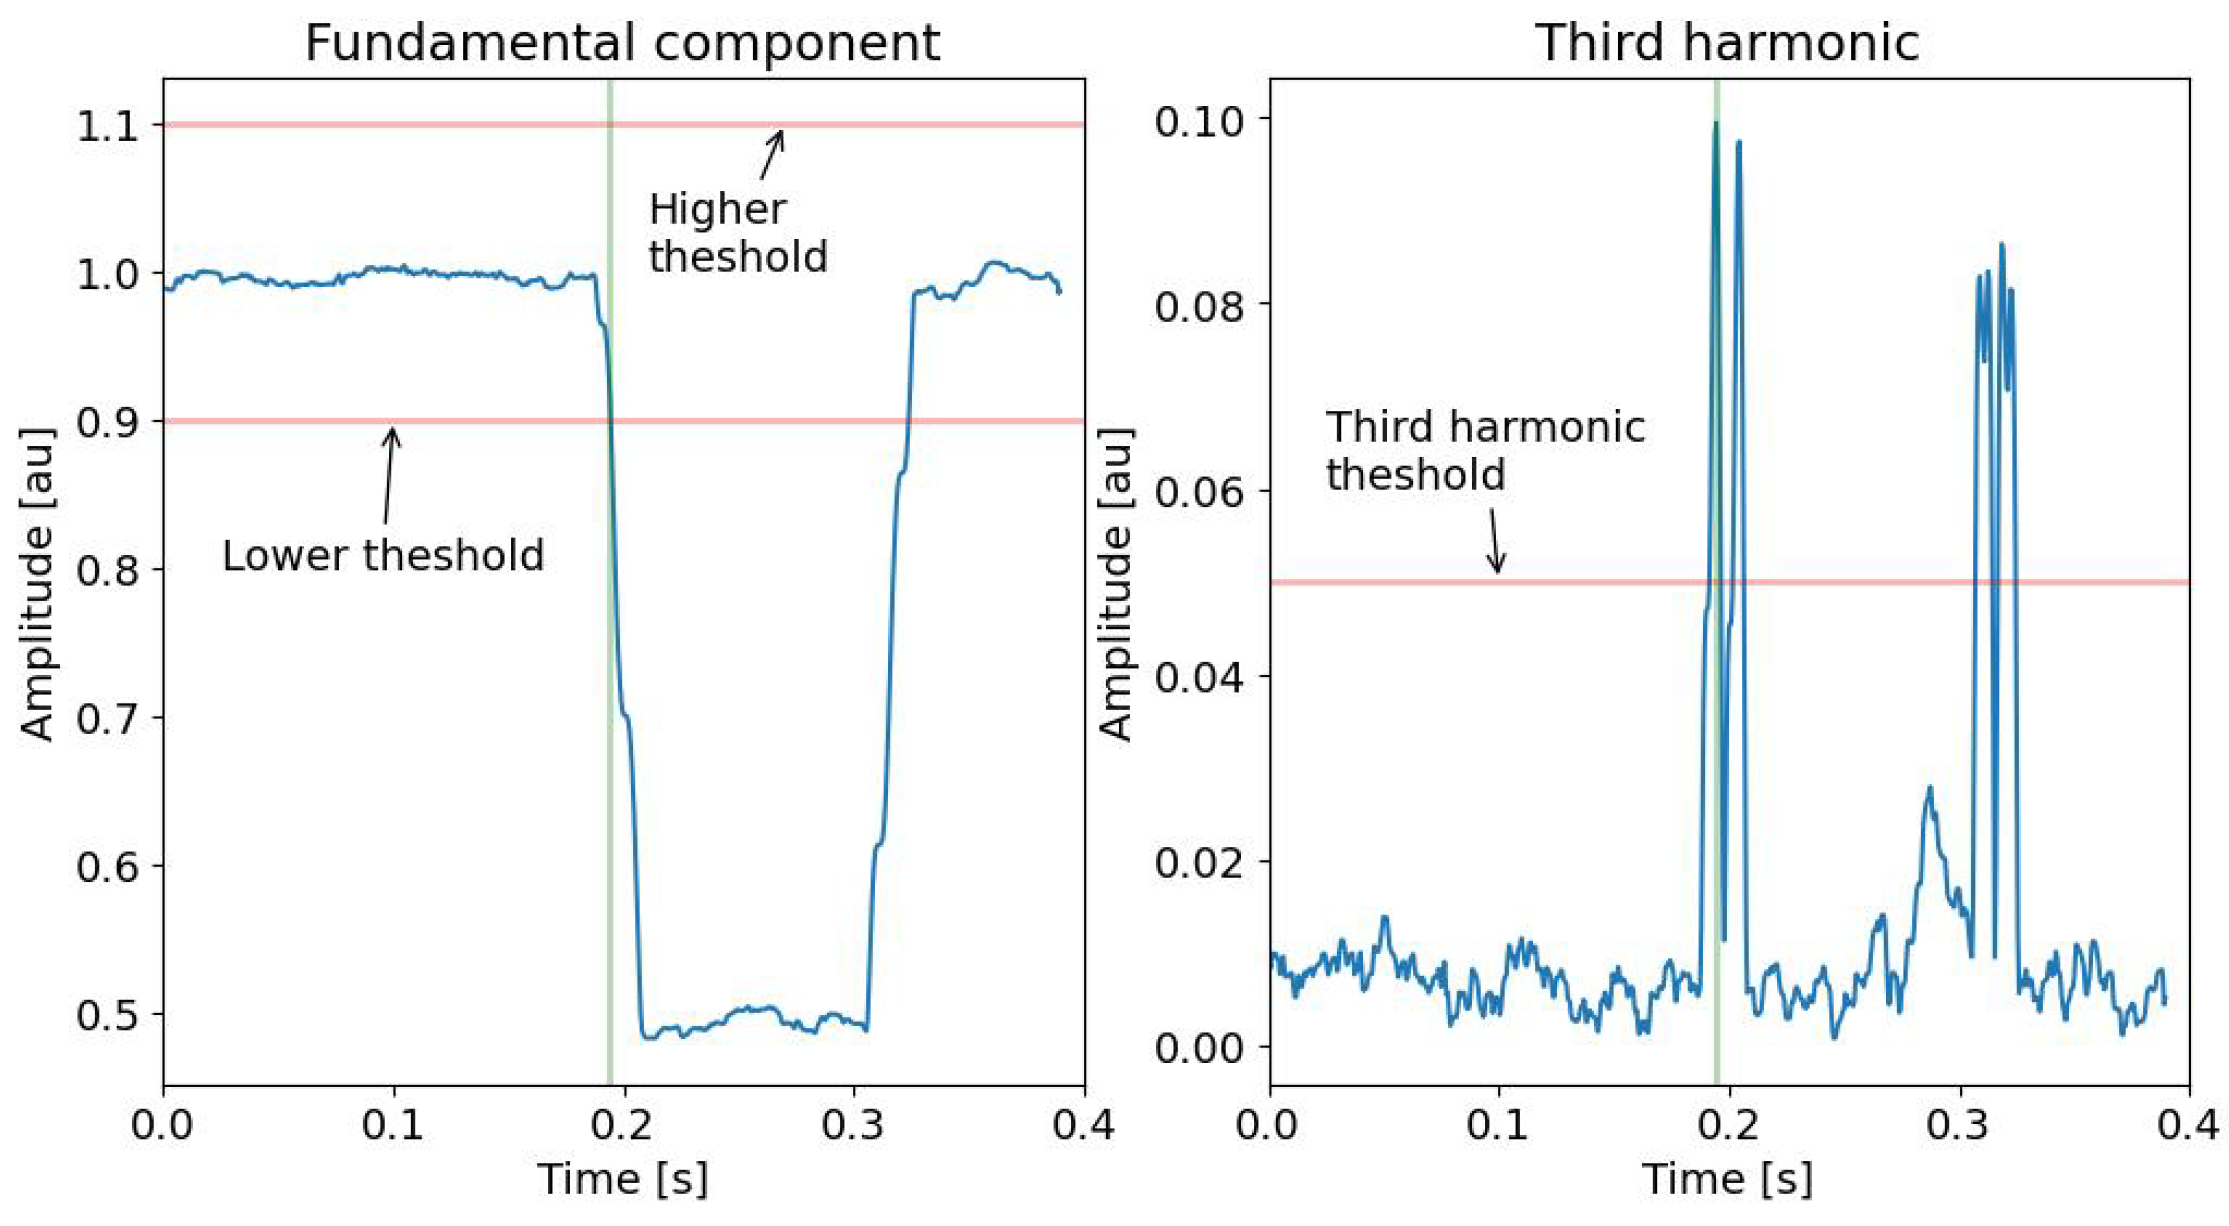
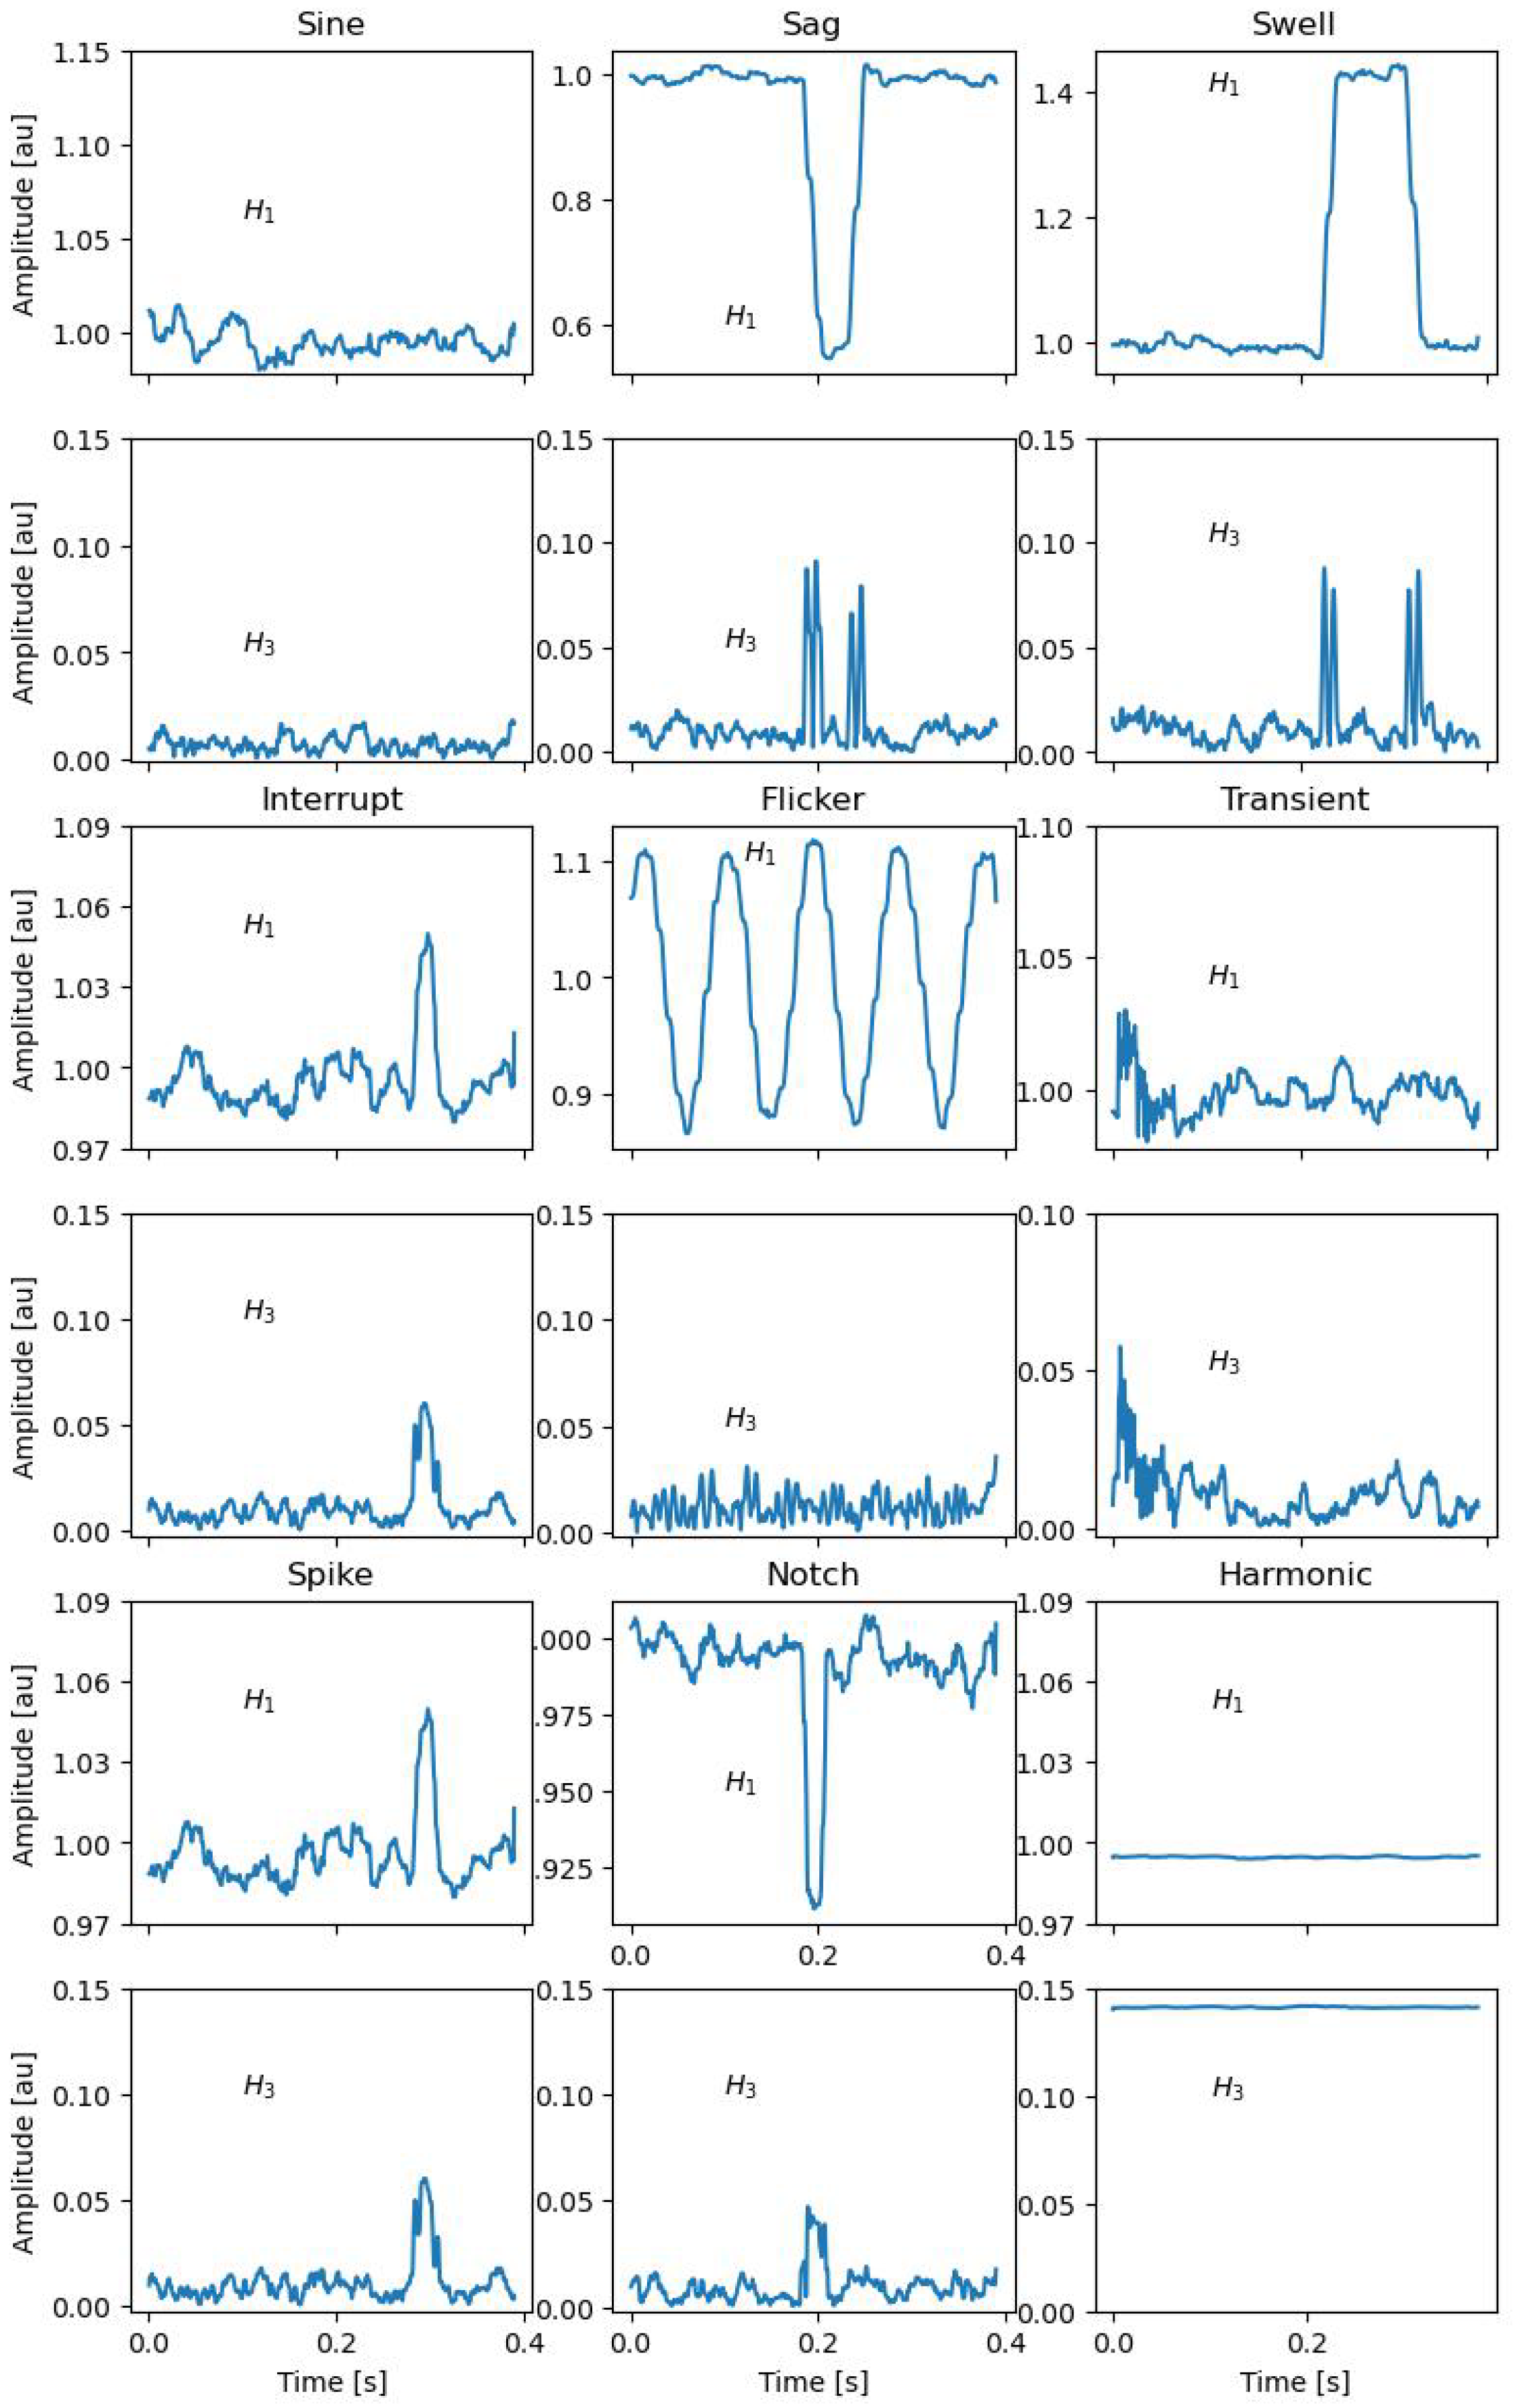
4.2. PQ Event Detection
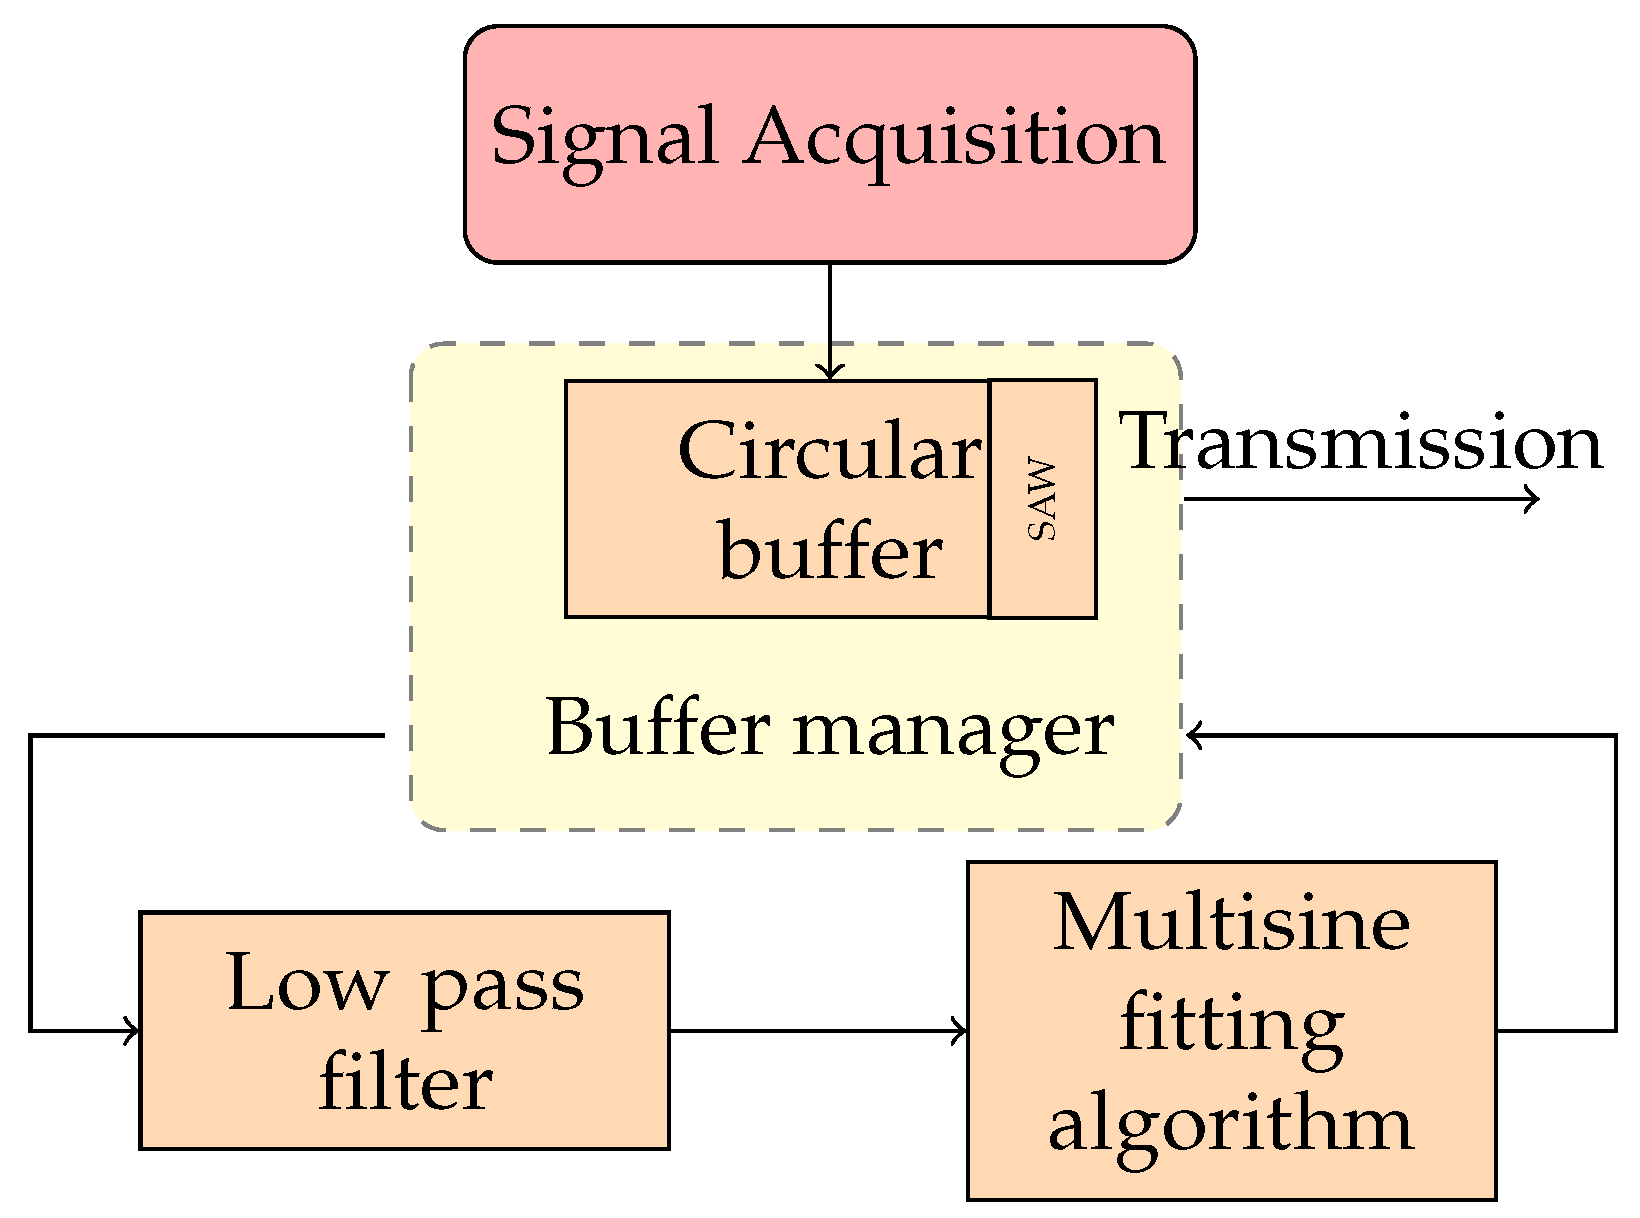
4.3. Locally Distributed Node Management Algorithm
| Algorithm 1 Circular buffer management logic |
|
| Algorithm 2 Analysis algorithm |
|
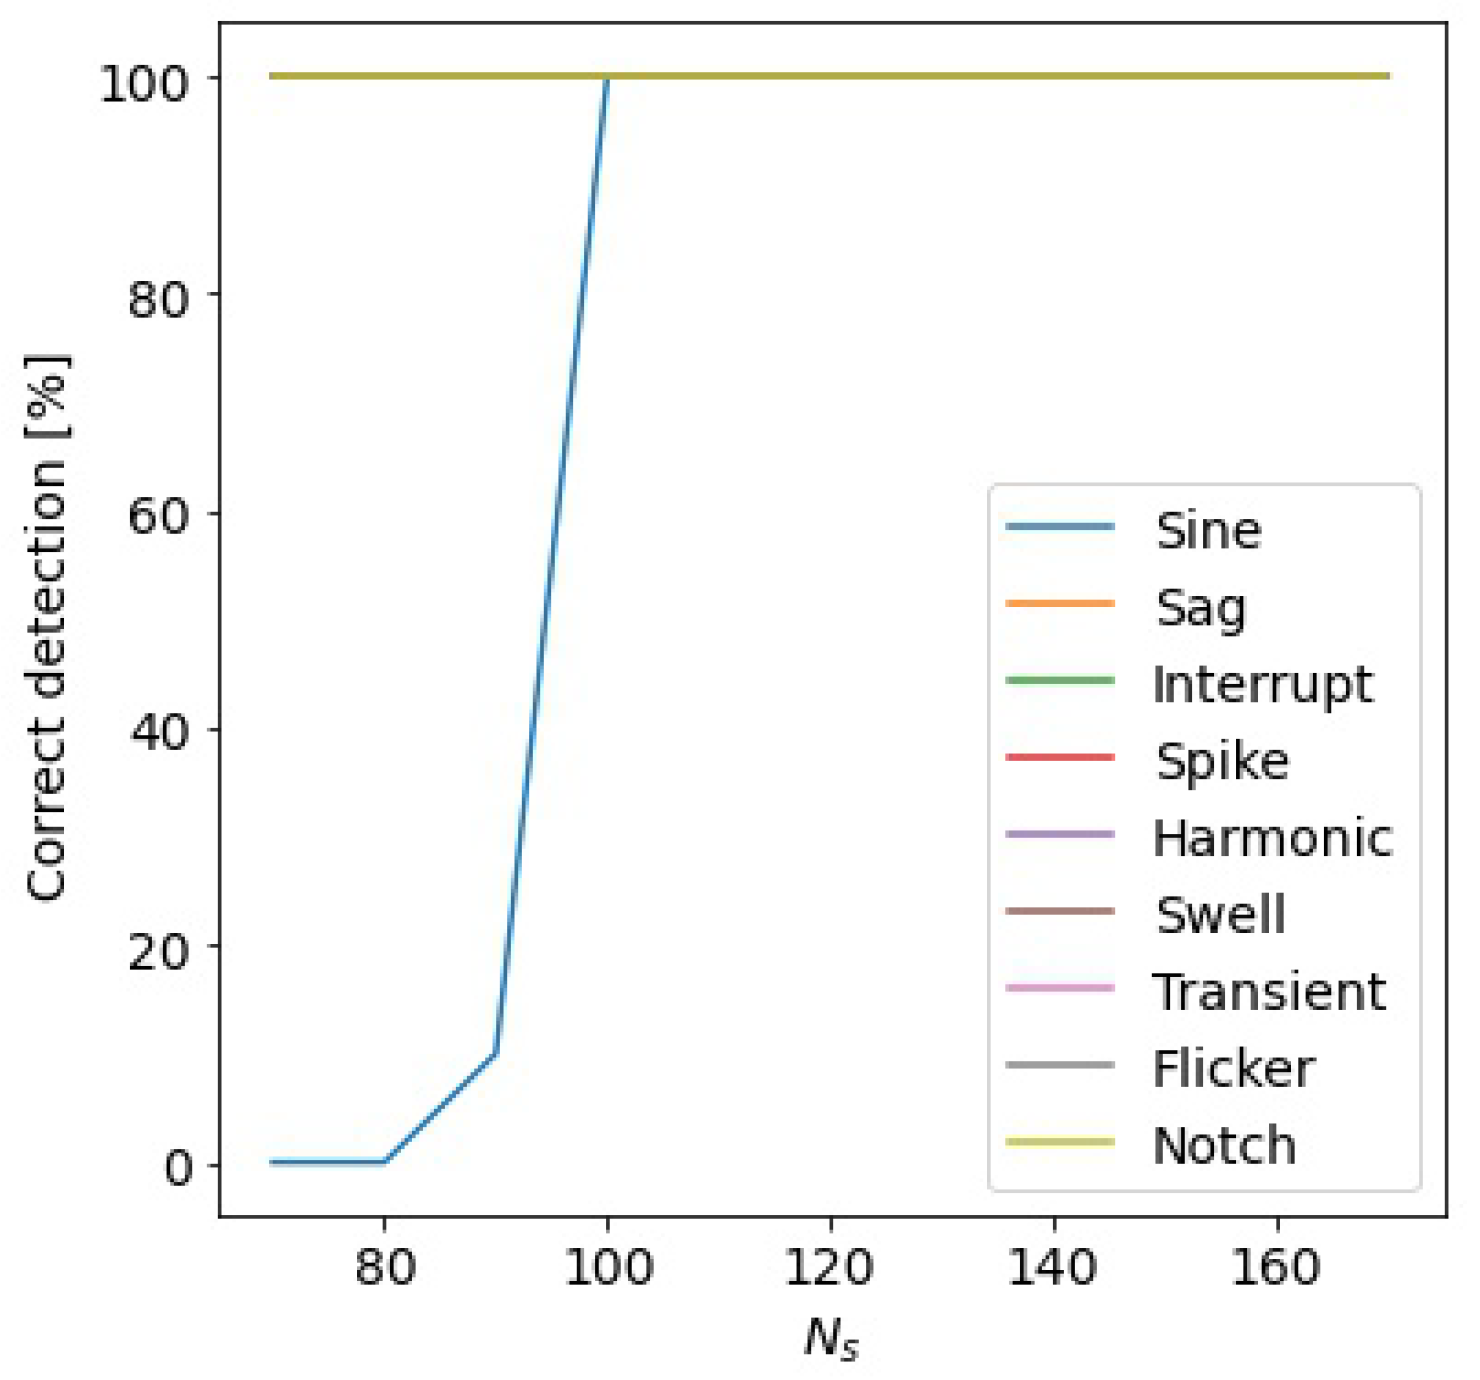
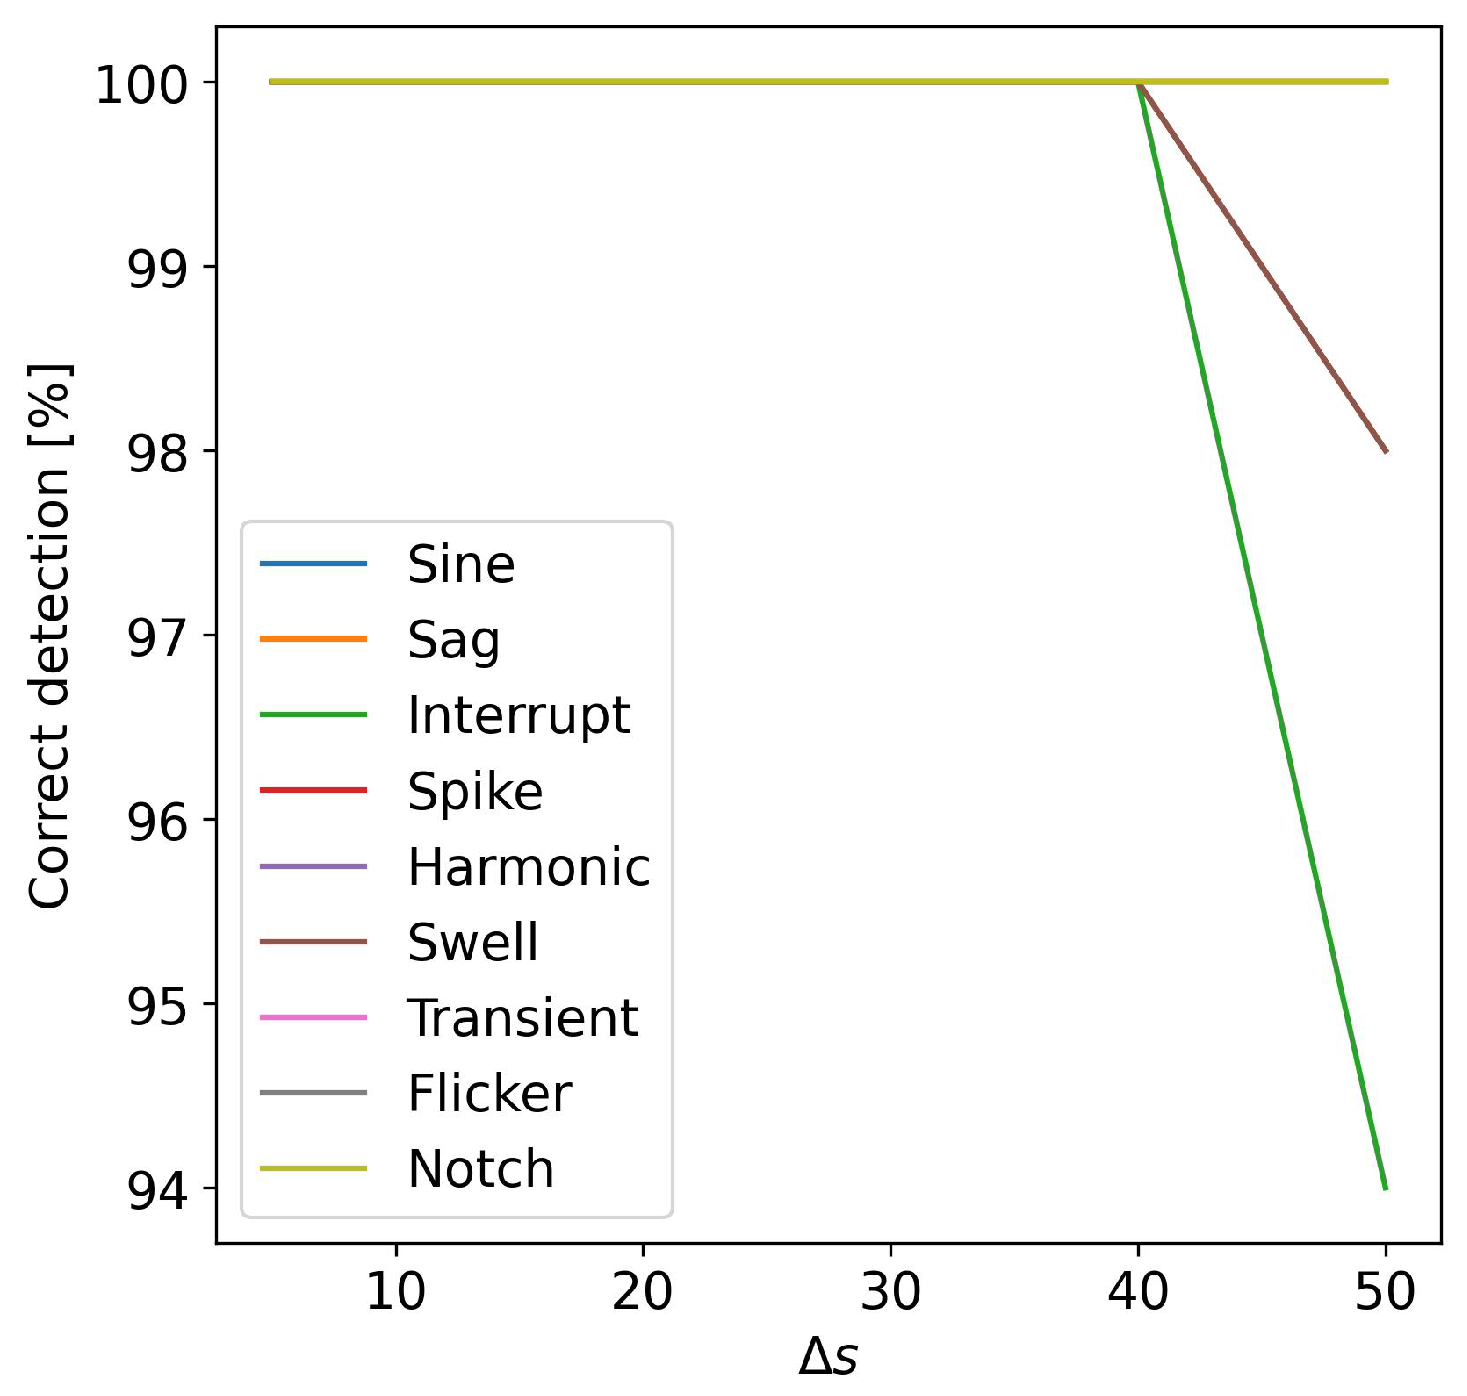
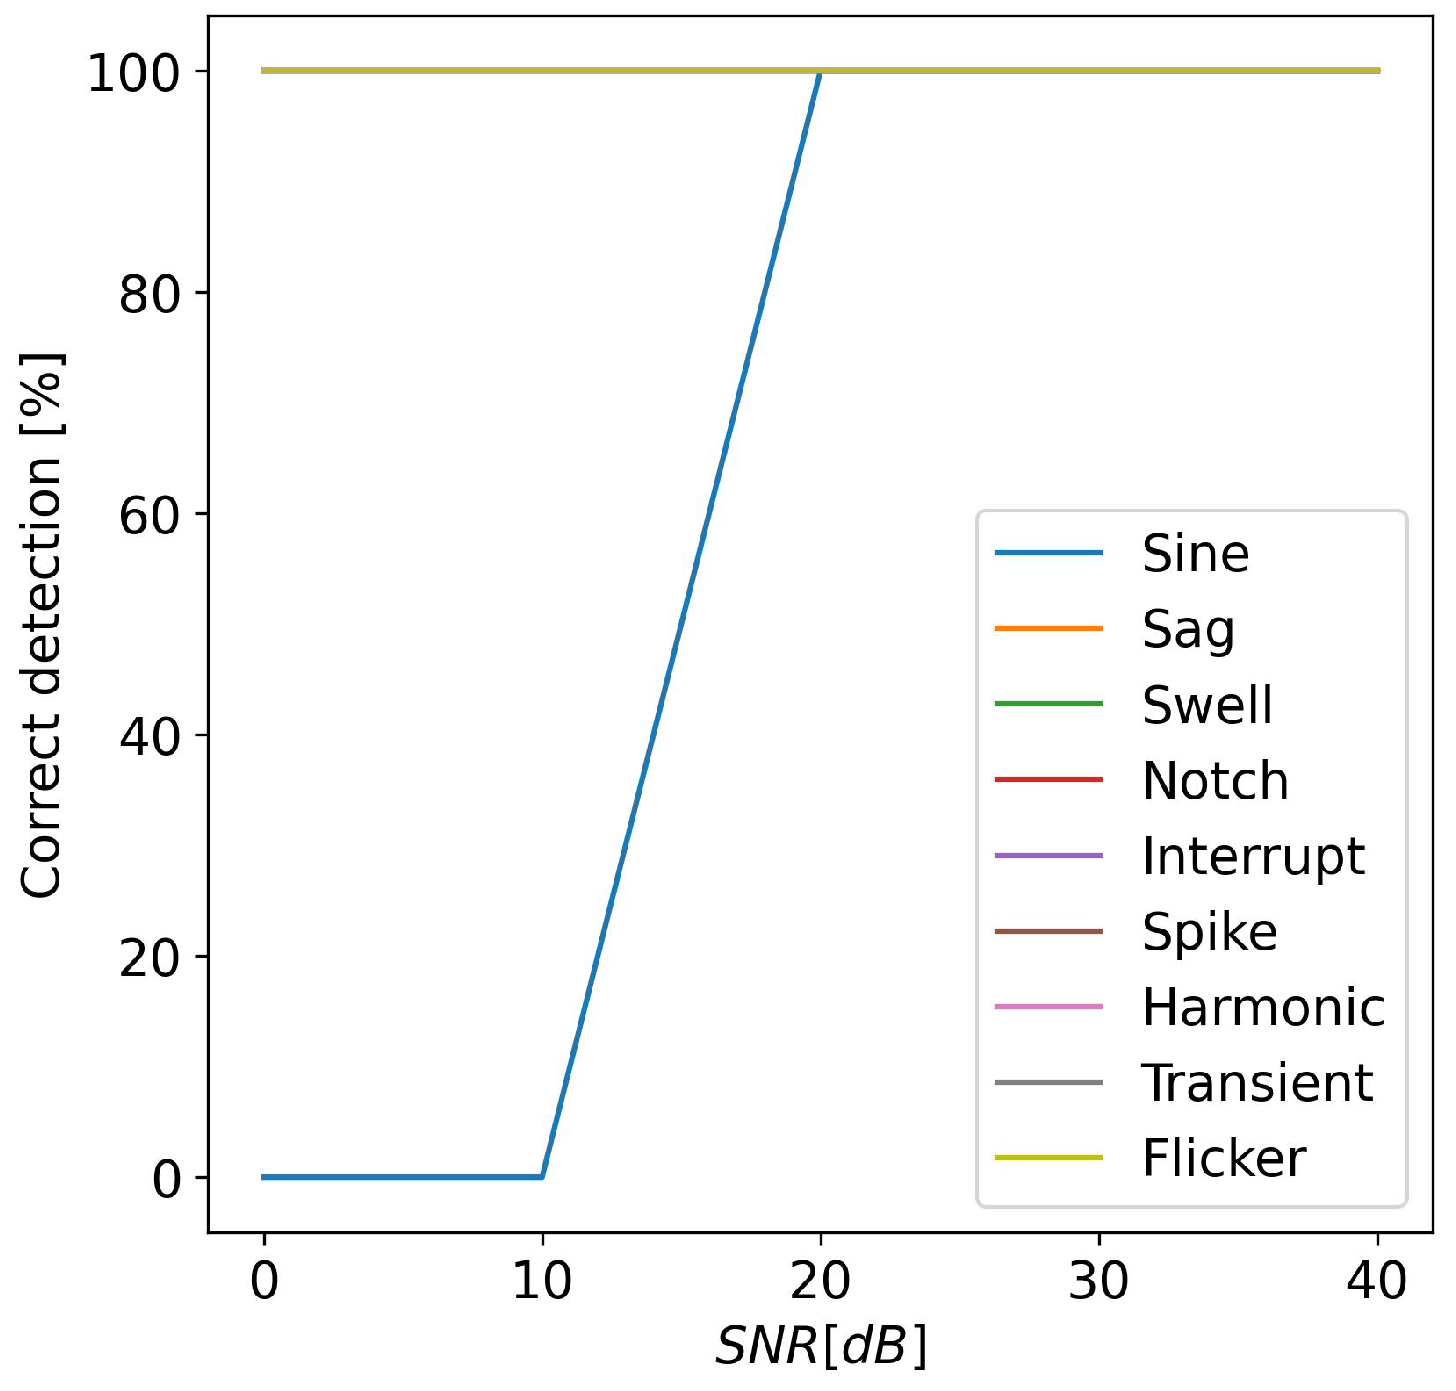
5. Results
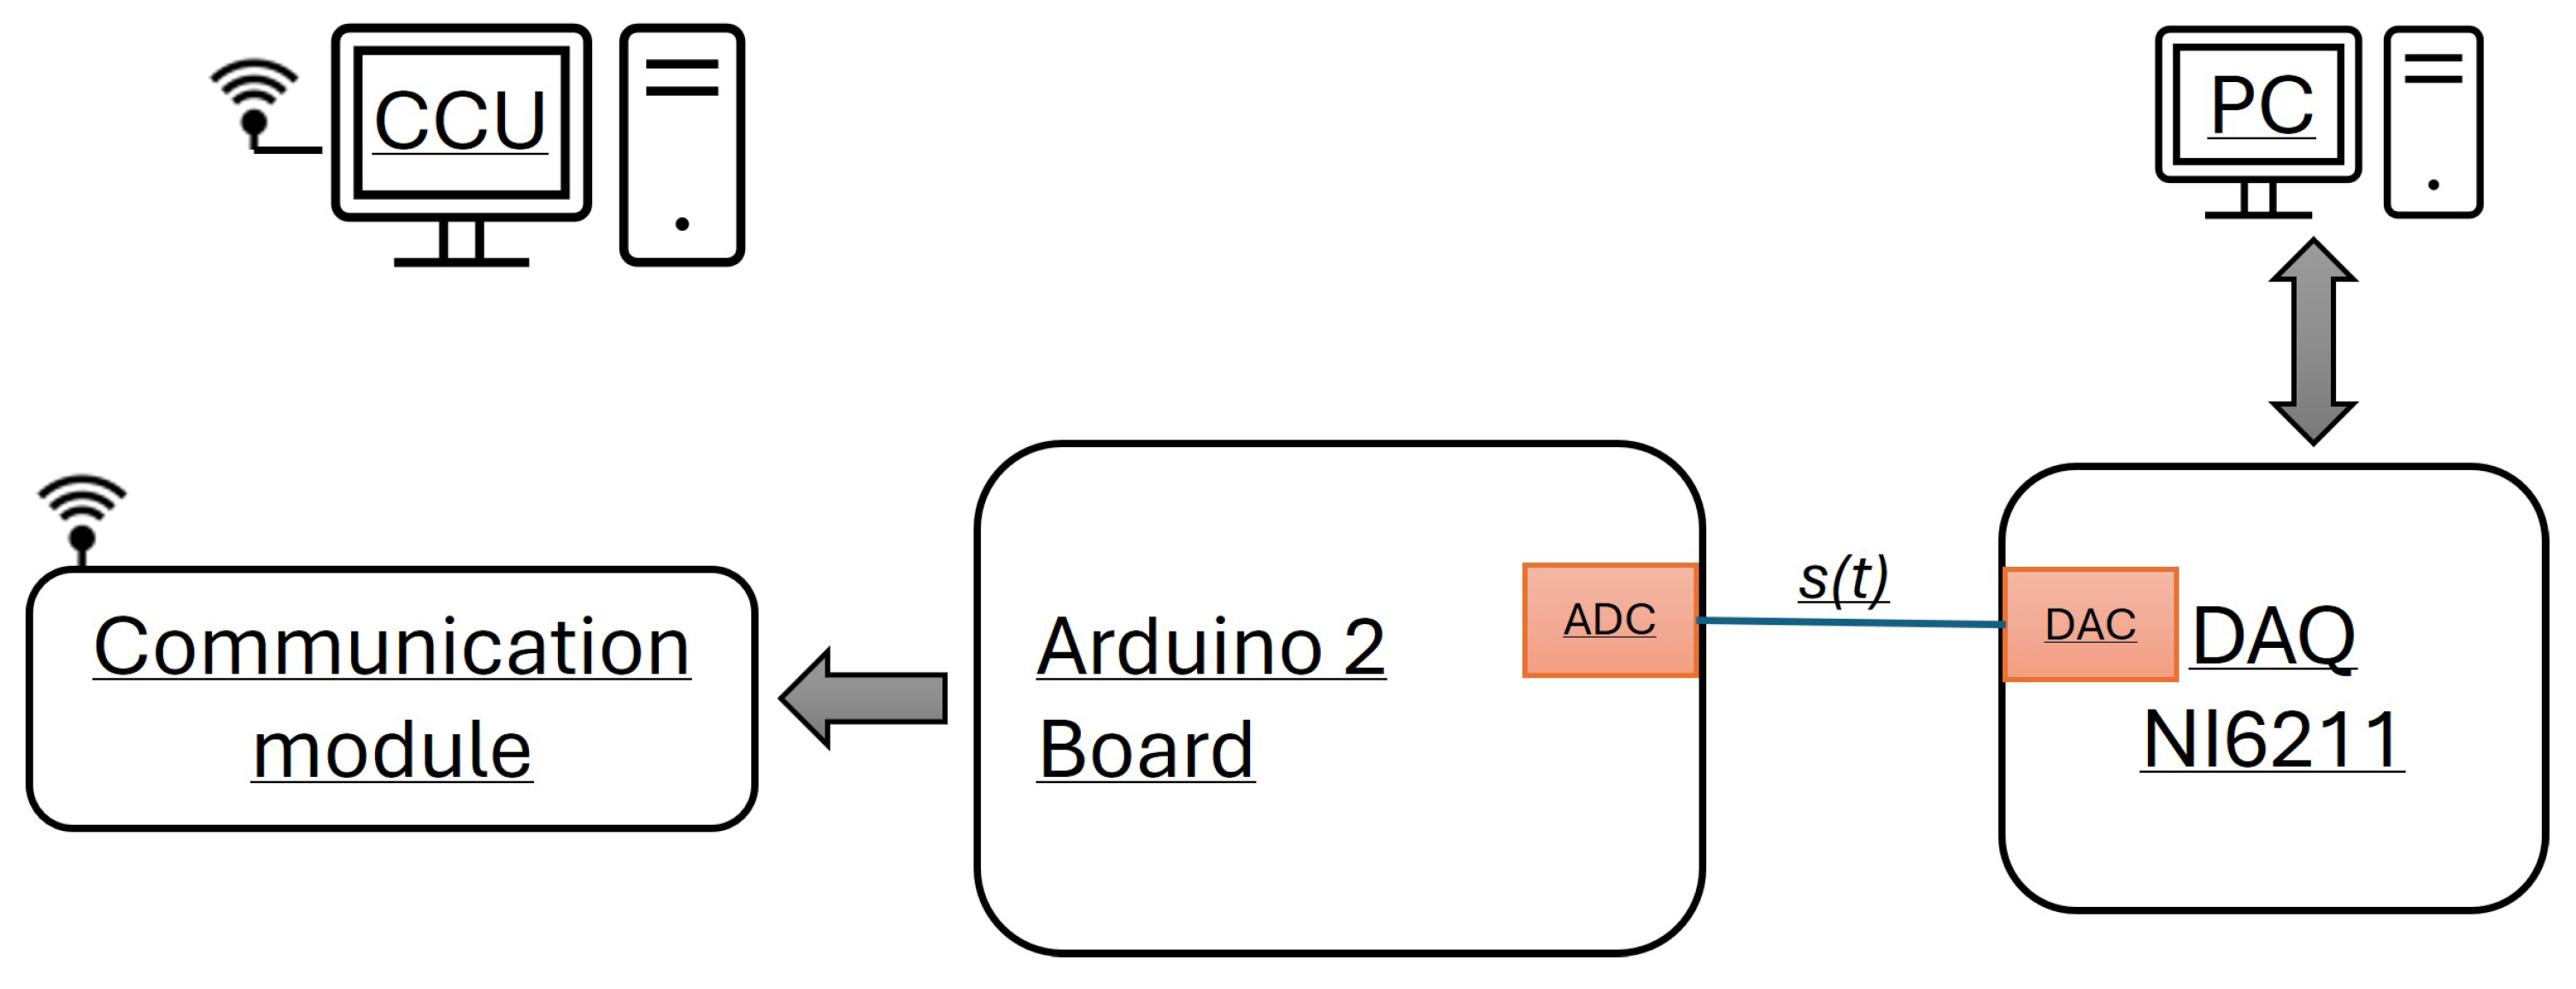
Experimental Results
6. Future Work
- The development of LDN prototypes with different communication standards, both wired and wireless;
- The characterization of the system even in the presence of more than one PQ events at the same time;
- The product engineering of the LDN;
- The development of a methodology and of a prototype suitable for three-phase systems. The literature analyzed shows few studies on unbalanced three-phase systems, in particular in the case of renewable energy sources [56].
7. Conclusions
Author Contributions
Funding
Institutional Review Board Statement
Informed Consent Statement
Data Availability Statement
Conflicts of Interest
Abbreviations
| APQEC | Automatic PQ Events Classifier |
| BM | Buffer Manager |
| CB | Circular Buffer |
| CCU | Central Classification Unit |
| CNN | Convolutional Neural Network |
| EMD | Empirical Mode Decomposition |
| FFT | Fast Fourier Transform |
| FIFO | First in First out |
| HHT | Huanh–Hilbert Transform |
| IMF | Intrinsic Mode Function |
| LDN | Locally Distributed Node |
| PQ | Power Quality |
| SAW | Sliding Analysis Window |
| SNR | Signal-to-Noise Ratio |
| STFT | Short Time Fourier Transform |
References
- Gargoom, A.M.; Ertugrul, N.; Soong, W.L. Automatic Classification and Characterization of Power Quality Events. IEEE Trans. Power Deliv. 2008, 23, 2417–2425. [Google Scholar] [CrossRef]
- Singh, D.B.; Chandra, A.; Al-Haddad, K. Power Quality: Problems and Mitigation Techniques; Wiley: Hoboken, NJ, USA, 2015. [Google Scholar]
- Shao, H.; Henriques, R.; Morais, H.; Tedeschi, E. Power quality monitoring in electric grid integrating offshore wind energy: A review. Renew. Sustain. Energy Rev. 2024, 191, 114094. [Google Scholar] [CrossRef]
- Abidullah, N.A.; Abdullah, A.R.; Shamsudin, N.H.; Ahmad, N.H.T.H.; Jopri, M.H. Real-time power quality signals monitoring system. In Proceedings of the IEEE Student Conference on Research and Developement, Putrajaya, Malaysia, 16–17 December 2013; pp. 433–438. [Google Scholar]
- Masoum, M.; Jamali, S.; Ghaffarzadeh, N. Detection and classification of power quality disturbances using discrete wavelet transform and wavelet networks. IET Sci. Meas. Technol. 2010, 4, 193–205. [Google Scholar] [CrossRef]
- Biswal, B.; Dash, P.; Panigrahi, B. Non-stationary power signal processing for pattern recognition using HS-transform. Appl. Soft Comput. 2009, 9, 107–117. [Google Scholar] [CrossRef]
- IEEE 1159-2019; IEEE Recommended Practice for Monitoring Electric Power Quality. IEEE: Piscataway, NJ, USA, 2019; Volume 9.
- IEC 61000-4-30; Testing and Measurement Techniques—Power Quality Measurement Methods. IEC: London, UK, 2015; Volume 9.
- Khetarpal, P.; Tripathi, M.M. A critical and comprehensive review on power quality disturbance detection and classification. Sustain. Comput. Inform. Syst. 2020, 28, 100417. [Google Scholar] [CrossRef]
- Samanta, I.S.; Panda, S.; Rout, P.K.; Bajaj, M.; Piecha, M.; Blazek, V.; Prokop, L. A Comprehensive Review of Deep-Learning Applications to Power Quality Analysis. Energies 2023, 16, 4406. [Google Scholar] [CrossRef]
- Caicedo, J.E.; Agudelo-Martínez, D.; Rivas-Trujillo, E.; Meyer, J. A Systematic Review of Real-Time Detection and Classification of Power Quality Disturbances. Prot. Control Mod. Power Syst. 2023, 8, 3. [Google Scholar] [CrossRef]
- Saxena, D.; Verma, K.; Singh, S. Power quality event classification: An overview and key issues. Int. J. Eng. Sci. Technol. 2010, 2, 186–199. [Google Scholar] [CrossRef]
- Cebrian, J.C.; Giacomini, J.; Carneiro, C.A.; Silva, G.B.; Morales-Paredes, H.K. A Novel Methodology to Estimate Probability Density Function of Voltage Sag Duration and Failure Rates on Power Distribution Systems. IEEE Access 2023, 11, 16863–16874. [Google Scholar] [CrossRef]
- Mahela, O.P.; Shaik, A.G.; Gupta, N. A critical review of detection and classification of power quality events. Renew. Sustain. Energy Rev. 2015, 41, 495–505. [Google Scholar] [CrossRef]
- Ucar, F.; Alcin, O.F.; Dandil, B.; Ata, F. Power Quality Event Detection Using a Fast Extreme Learning Machine. Energies 2018, 11, 145. [Google Scholar] [CrossRef]
- Rodrigues, N.M.; Janeiro, F.M.; Ramos, P.M. Deep Learning for Power Quality Event Detection and Classification Based on Measured Grid Data. IEEE Trans. Instrum. Meas. 2023, 72, 9003311. [Google Scholar] [CrossRef]
- Topaloglu, I. Deep Learning Based a New Approach for Power Quality Disturbances Classification in Power Transmission System. J. Electr. Eng. Technol. 2023, 18, 77–88. [Google Scholar] [CrossRef]
- Khetarpal, P.; Nagpal, N.; Al-Numay, M.S.; Siano, P.; Arya, Y.; Kassarwani, N. Power Quality Disturbances Detection and Classification Based on Deep Convolution Auto-Encoder Networks. IEEE Access 2023, 11, 46026–46038. [Google Scholar] [CrossRef]
- Carní, D.L.; Fedele, G. Multi-Sine Fitting Algorithm enhancement for sinusoidal signal characterization. Comput. Stand. Interfaces 2012, 34, 535–540. [Google Scholar] [CrossRef]
- Carni, D.L.; Lamonaca, F. Toward an Automatic Power Quality Measurement System: An Effective Classifier of Power Signal Alterations. IEEE Trans. Instrum. Meas. 2022, 71, 2514208. [Google Scholar] [CrossRef]
- Hong, H.J. From cloud computing to fog computing: Unleash the power of edge and end devices. In Proceedings of the 2017 IEEE International Conference on Cloud Computing Technology and Science (CloudCom), Hong Kong, China, 1–14 December 2017; pp. 331–334. [Google Scholar] [CrossRef]
- Kumar, R.; Singh, B.; Shahani, D.; Chandra, A.; Al-Haddad, K. Recognition of Power-Quality Disturbances Using S-Transform-Based ANN Classifier and Rule-Based Decision Tree. IEEE Trans. Ind. Appl. 2015, 51, 1249–1258. [Google Scholar] [CrossRef]
- Mishra, S.; Bhende, C.; Panigrahi, B. Detection and classification of power quality disturbances using S-transform and probabilistic neural network. IEEE Trans. Power Deliv. 2008, 23, 280–287. [Google Scholar] [CrossRef]
- Naderian, S.; Salemnia, A. Method for classification of PQ events based on discrete Gabor transform with FIR window and T2FK-based SVM and its experimental verification. IET Gener. Transm. Distrib. 2017, 11, 133–141. [Google Scholar] [CrossRef]
- Thirumala, K.; Pal, S.; Jain, T.; Umarikar, A.C. A classification method for multiple power quality disturbances using EWT based adaptive filtering and multiclass SVM. Neurocomputing 2019, 334, 265–274. [Google Scholar] [CrossRef]
- Thirumala, K.; Umarikar, A.C.; Jain, T. A new classification model based on SVM for single and combined power quality disturbances. In Proceedings of the 2016 National Power Systems Conference (NPSC), Bhubaneswar, India, 19–21 December 2016. [Google Scholar]
- Wei, J.; Chammam, A.; Feng, J.; Alshammari, A.; Tehranian, K.; Innab, N.; Deebani, W.; Shutaywi, M. Power system monitoring for electrical disturbances in wide network using machine learning. Sustain. Comput. Inform. Syst. 2024, 42, 100959. [Google Scholar] [CrossRef]
- Liao, H.; Milanović, J.V.; Rodrigues, M.; Shenfield, A. Voltage Sag Estimation in Sparsely Monitored Power Systems Based on Deep Learning and System Area Mapping. IEEE Trans. Power Deliv. 2018, 33, 3162–3172. [Google Scholar] [CrossRef]
- Soni, P.; Mondal, D.; Chatterjee, S.; Mishra, P. Deep Learning Technique for Recurrence Plot-based Classification of Power Quality Disturbances. In Proceedings of the 2022 IEEE International Power and Renewable Energy Conference (IPRECON), Kollam, India, 16–18 December 2022; pp. 1–5. [Google Scholar]
- Cui, C.; Duan, Y.; Hu, H.; Wang, L.; Liu, Q. Detection and Classification of Multiple Power Quality Disturbances Using Stockwell Transform and Deep Learning. IEEE Trans. Instrum. Meas. 2022, 71, 2519912. [Google Scholar] [CrossRef]
- Xiao, X.; Li, K. Multi-Label Classification for Power Quality Disturbances by Integrated Deep Learning. IEEE Access 2021, 9, 152250–152260. [Google Scholar] [CrossRef]
- Salles, R.S.; Ribeiro, P.F. The use of deep learning and 2-D wavelet scalograms for power quality disturbances classification. Electr. Power Syst. Res. 2023, 214, 108834. [Google Scholar] [CrossRef]
- Zhang, H.; Wu, W.; Li, K.; Zheng, X.; Xu, X.; Wei, X.; Zhao, C. Multi-strategy active learning for power quality disturbance identification. Appl. Soft Comput. 2024, 154, 111326. [Google Scholar] [CrossRef]
- Kitzig, J.P.; Schlaghecke, S.; Bumiller, G. Power Quality Measurement System with PMU Functionality Based on Interpolated Sampling. IEEE Trans. Instrum. Meas. 2019, 68, 1014–1025. [Google Scholar] [CrossRef]
- Cristaldi, L.; Ferrero, A.; Salicone, S. A distributed system for electric power quality measurement. IEEE Trans. Instrum. Meas. 2002, 51, 776–781. [Google Scholar] [CrossRef]
- Gu, Y.; Bollen, M. Time-frequency and time-scale domain analysis of voltage disturbances. IEEE Trans. Power Deliv. 2000, 15, 1279–1284. [Google Scholar] [CrossRef]
- Wright, P. Short-time Fourier transforms and Wigner-Ville distributions applied to the calibration of power frequency harmonic analyzers. IEEE Trans. Instrum. Meas. 1999, 48, 475–478. [Google Scholar] [CrossRef]
- Jurado, F.; Saenz, J.R. Comparison between discrete STFT and wavelets for the analysis of power quality events. Electr. Power Syst. Res. 2002, 62, 183–190. [Google Scholar] [CrossRef]
- Huang, S.J.; Hsieh, C.T.; Huang, C.L. Application of Morlet wavelets to supervise power system disturbances. IEEE Trans. Power Deliv. 1999, 14, 235–243. [Google Scholar] [CrossRef]
- Chilukuri, M.; Dash, P. Multiresolution S-transform-based fuzzy recognition system for power quality events. IEEE Trans. Power Deliv. 2004, 19, 323–330. [Google Scholar] [CrossRef]
- Li, J.; Liu, H.; Wang, D.; Bi, T. Classification of Power Quality Disturbance Based on S-Transform and Convolution Neural Network. Front. Energy Res. 2021, 9, 325. [Google Scholar] [CrossRef]
- Abubakar, M.; Nagra, A.A.; Faheem, M.; Mudassar, M.; Sohail, M. High-Precision Identification of Power Quality Disturbances Based on Discrete Orthogonal S-Transforms and Compressed Neural Network Methods. IEEE Access 2023, 11, 85571–85588. [Google Scholar] [CrossRef]
- De Yong, D.; Bhowmik, S.; Magnago, F. An Effective Power Quality Classifier Using Wavelet Transform and Support Vector Machines. Expert Syst. Appl. 2015, 42, 6075–6081. [Google Scholar] [CrossRef]
- Carni, D.L.; Kermani, M.; Lamonaca, F. A power signal alteration analyzer based on empirical mode decomposition. In Proceedings of the 2022 IEEE International Workshop on Metrology for Living Environment, MetroLivEn 2022-Proceedings, Cosenza, Italy, 25–27 May 2022; pp. 298–302. [Google Scholar] [CrossRef]
- Boudraa, A.O.; Cexus, J.C. EMD-based signal filtering. IEEE Trans. Instrum. Meas. 2007, 56, 2196–2202. [Google Scholar] [CrossRef]
- Komaty, A.; Boudraa, A.O.; Augier, B.; Dare-Emzivat, D. EMD-based filtering using similarity measure between probability density functions of IMFs. IEEE Trans. Instrum. Meas. 2014, 63, 27–34. [Google Scholar] [CrossRef]
- Carnì, D.L.; Balestrieri, E.; Tudosa, I.; Lamonaca, F. Application of machine learning techniques and empirical mode decomposition for the classification of analog modulated signals. Acta Imeko 2020, 9, 66–74. [Google Scholar] [CrossRef]
- Andrade, L.C.; Oleskovicz, M.; Fernandes, R.A. Adaptive threshold based on wavelet transform applied to the segmentation of single and combined power quality disturbances. Appl. Soft Comput. 2016, 38, 967–977. [Google Scholar] [CrossRef]
- de Andrade, L.C.M.; Oleskovicz, M.; Souza Fernandes, R.A. Analysis of Wavelet Transform applied to the segmentation of disturbance signals with different sampling rates. In Proceedings of the 2014 IEEE PES General Meeting|Conference & Exposition, National Harbor, MD, USA, 27–31 July 2014; pp. 1–5. [Google Scholar]
- Gu, I.; Bollen, M.; Styvaktakis, E. The use of time-varying AR models for the characterization of voltage disturbances. In Proceedings of the IEEE Power Engineering Society Winter Meeting, Conference Proceedings, Singapore, 23–27 January 2000; Volume 4, pp. 2943–2948. [Google Scholar]
- Lee, C.Y.; Shen, Y.X. Optimal Feature Selection for Power-Quality Disturbances Classification. IEEE Trans. Power Deliv. 2011, 26, 2342–2351. [Google Scholar] [CrossRef]
- Carnì, D.L. Static characterization of arbitrary waveform generator based on modified multisine fitting and zero crossing detection algorithms. J. Eng. Sci. Technol. Rev. 2017, 10, 11–17. [Google Scholar] [CrossRef]
- Oubrahim, Z.; Amirat, Y.; Benbouzid, M.; Ouassaid, M. Power Quality Disturbances Characterization Using Signal Processing and Pattern Recognition Techniques: A Comprehensive Review. Energies 2023, 16, 2685. [Google Scholar] [CrossRef]
- Chakraborty, A.; Chatterjee, S.; Mandal, R. Power quality recognition in noisy environment employing deep feature extraction from cross stockwell spectrum time–frequency images. Electr. Eng. 2024, 106, 443–458. [Google Scholar] [CrossRef]
- Liu, M.; Chen, Y.; Zhang, Z.; Deng, S.; Wang, Q. Highly accurate detection of power quality disturbance using segmented and modified S-transform. Electr. Power Syst. Res. 2022, 212, 108664. [Google Scholar] [CrossRef]
- Viciana, E.; Arrabal-Campos, F.M.; Alcayde, A.; Baños, R.; Montoya, F.G. All-in-one three-phase smart meter and power quality analyzer with extended IoT capabilities. Measurement 2023, 206, 112309. [Google Scholar] [CrossRef]


| Protocols | Data Rate | Range |
|---|---|---|
| Zigbee | 250 kbps | up to 200 m |
| Bluetooth Low energy | 1 Mbps | 15–30 m |
| SigFox | 100 bps UL | 10 km urban |
| 600 bps DL | 50 km rural | |
| 6lowpan | 250 kbps | 15–30 m |
| LoRaWan | 29 bps–50 kbps | 2–15 km |
| Z-wave | 40–100 kbps | 30 m (indoors) |
| 100 m (outdoors) | ||
| Bluetooth | 1, 3, 24 Mbps | 10–100 m |
| IEEE 802.11b | 1, 2, 5.5, 11 Mbps | 35–140 m |
| GPRS | 56, 171.2 kbps | >1 km |
| Mean() [μs] | Std() [μs] | |
|---|---|---|
| 10 | 100 | 15 |
| 25 | 300 | 18 |
| 50 | 600 | 34 |
| 100 | 1000 | 81 |
Disclaimer/Publisher’s Note: The statements, opinions and data contained in all publications are solely those of the individual author(s) and contributor(s) and not of MDPI and/or the editor(s). MDPI and/or the editor(s) disclaim responsibility for any injury to people or property resulting from any ideas, methods, instructions or products referred to in the content. |
© 2024 by the authors. Licensee MDPI, Basel, Switzerland. This article is an open access article distributed under the terms and conditions of the Creative Commons Attribution (CC BY) license (https://creativecommons.org/licenses/by/4.0/).
Share and Cite
Carní, D.L.; Lamonaca, F. Local Distributed Node for Power Quality Event Detection Based on Multi-Sine Fitting Algorithm. Sensors 2024, 24, 2474. https://doi.org/10.3390/s24082474
Carní DL, Lamonaca F. Local Distributed Node for Power Quality Event Detection Based on Multi-Sine Fitting Algorithm. Sensors. 2024; 24(8):2474. https://doi.org/10.3390/s24082474
Chicago/Turabian StyleCarní, Domenico Luca, and Francesco Lamonaca. 2024. "Local Distributed Node for Power Quality Event Detection Based on Multi-Sine Fitting Algorithm" Sensors 24, no. 8: 2474. https://doi.org/10.3390/s24082474
APA StyleCarní, D. L., & Lamonaca, F. (2024). Local Distributed Node for Power Quality Event Detection Based on Multi-Sine Fitting Algorithm. Sensors, 24(8), 2474. https://doi.org/10.3390/s24082474