
Comprehensive Assessment of Artificial Intelligence Tools for Driver Monitoring and Analyzing Safety Critical Events in Vehicles


Abstract
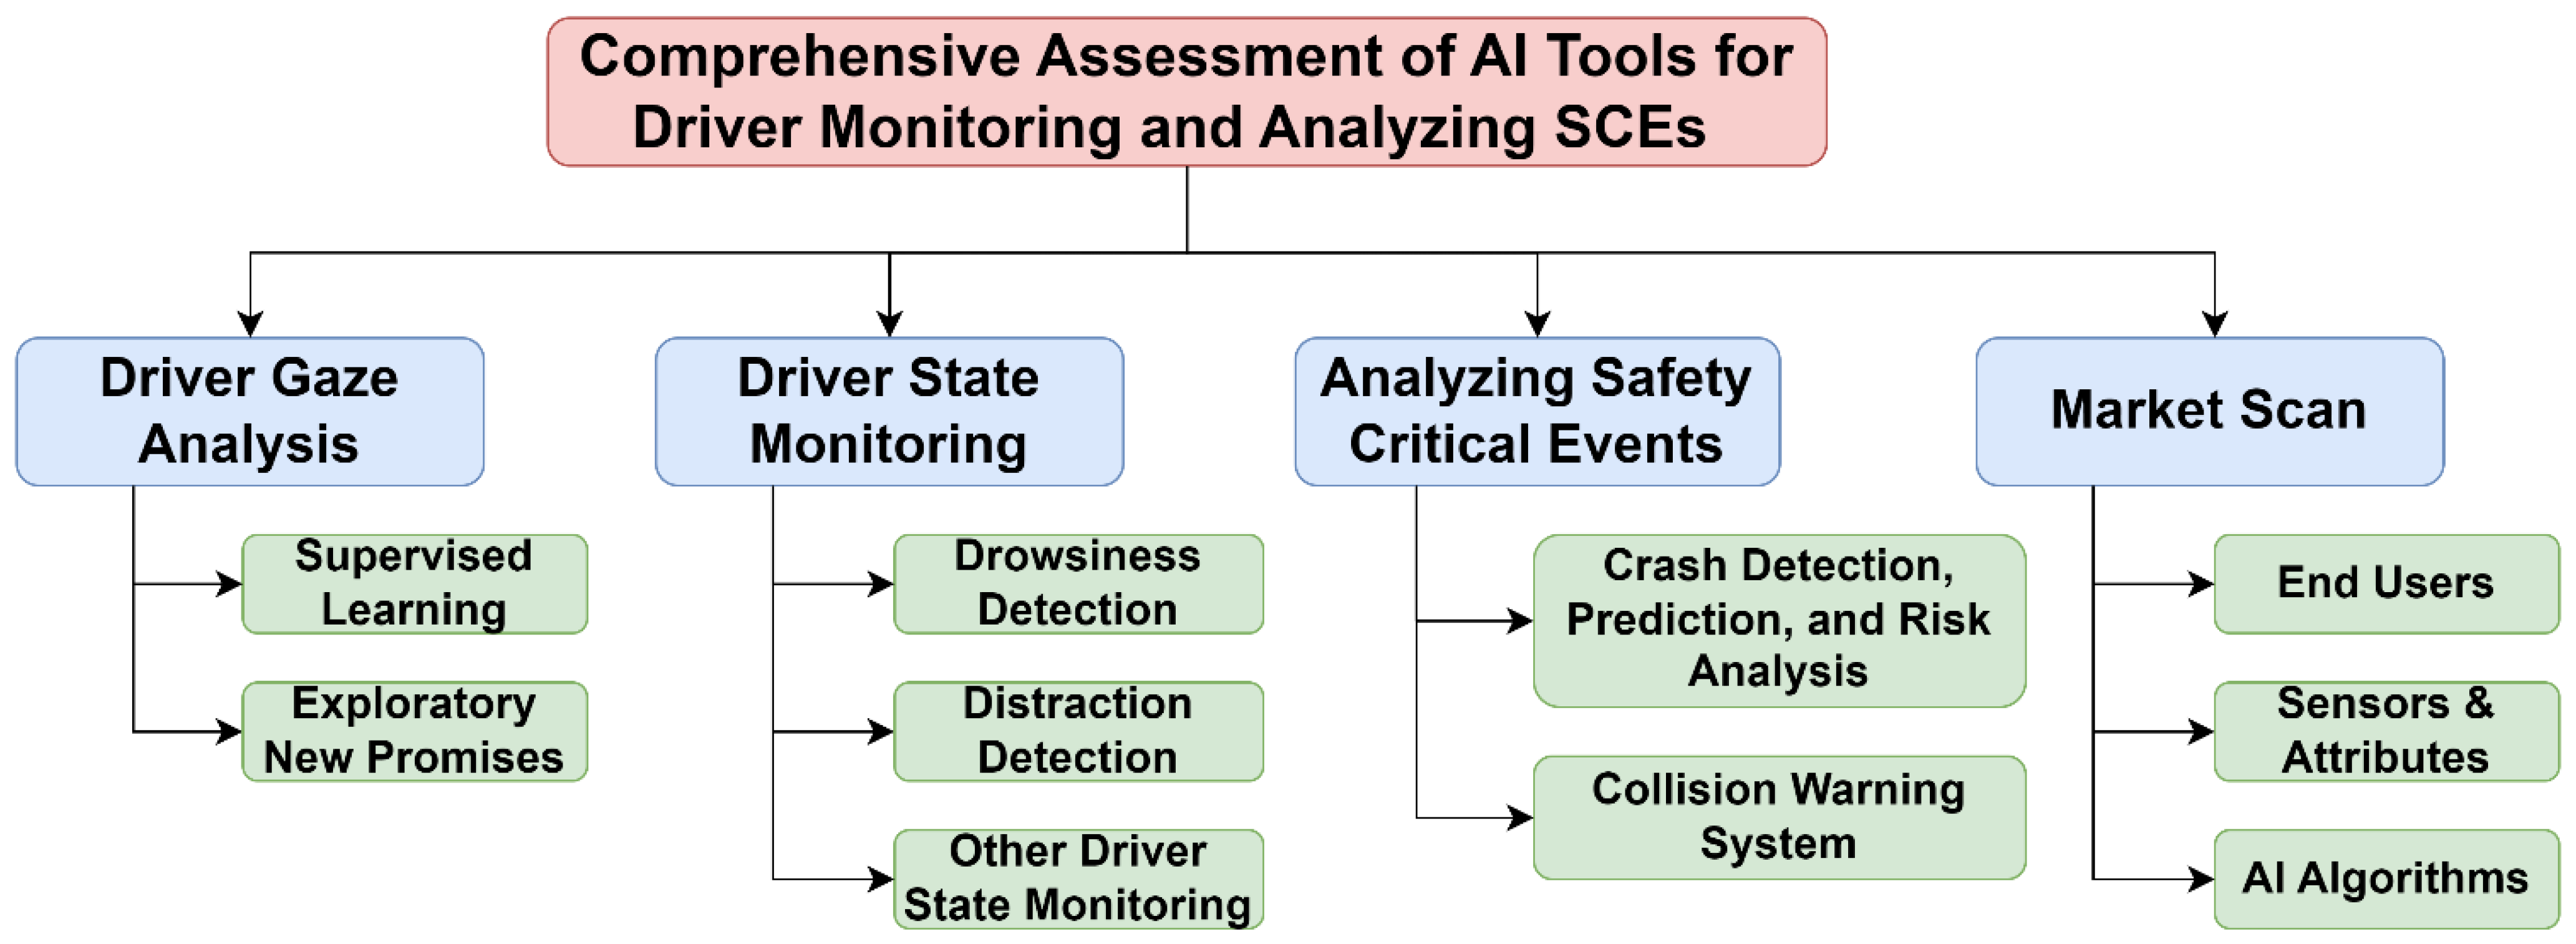
:1. Introduction
- Driver gaze analysis. Summarizes previous works via supervised ML/DL and exploratory new promises for driver gaze tracking, classification, or estimation in terms of devices, datasets, methodologies, and results.
- Driver state monitoring. Includes methods, devices, features, data, and results of drowsiness detection, distraction detection, and others (such as emotion, drunk driving, or other dangerous driving behaviors) via CV, ML, and DL methods.
- SCE analysis. One of the direct outcomes of analyzing SCEs is to understand how driver behaviors relate to overall crash risk. This section reviews the state-of-the-art practice for crash detection, prediction, and risk analysis, and the development of collision warning systems and their impact on drivers’ behavior.
- Market scan. Identifies commercially available DMSs in vehicles that use AI and ML, and summarizes sensor types, industry trends, and gaps in current DMS technologies.

2. Driver Gaze Analysis
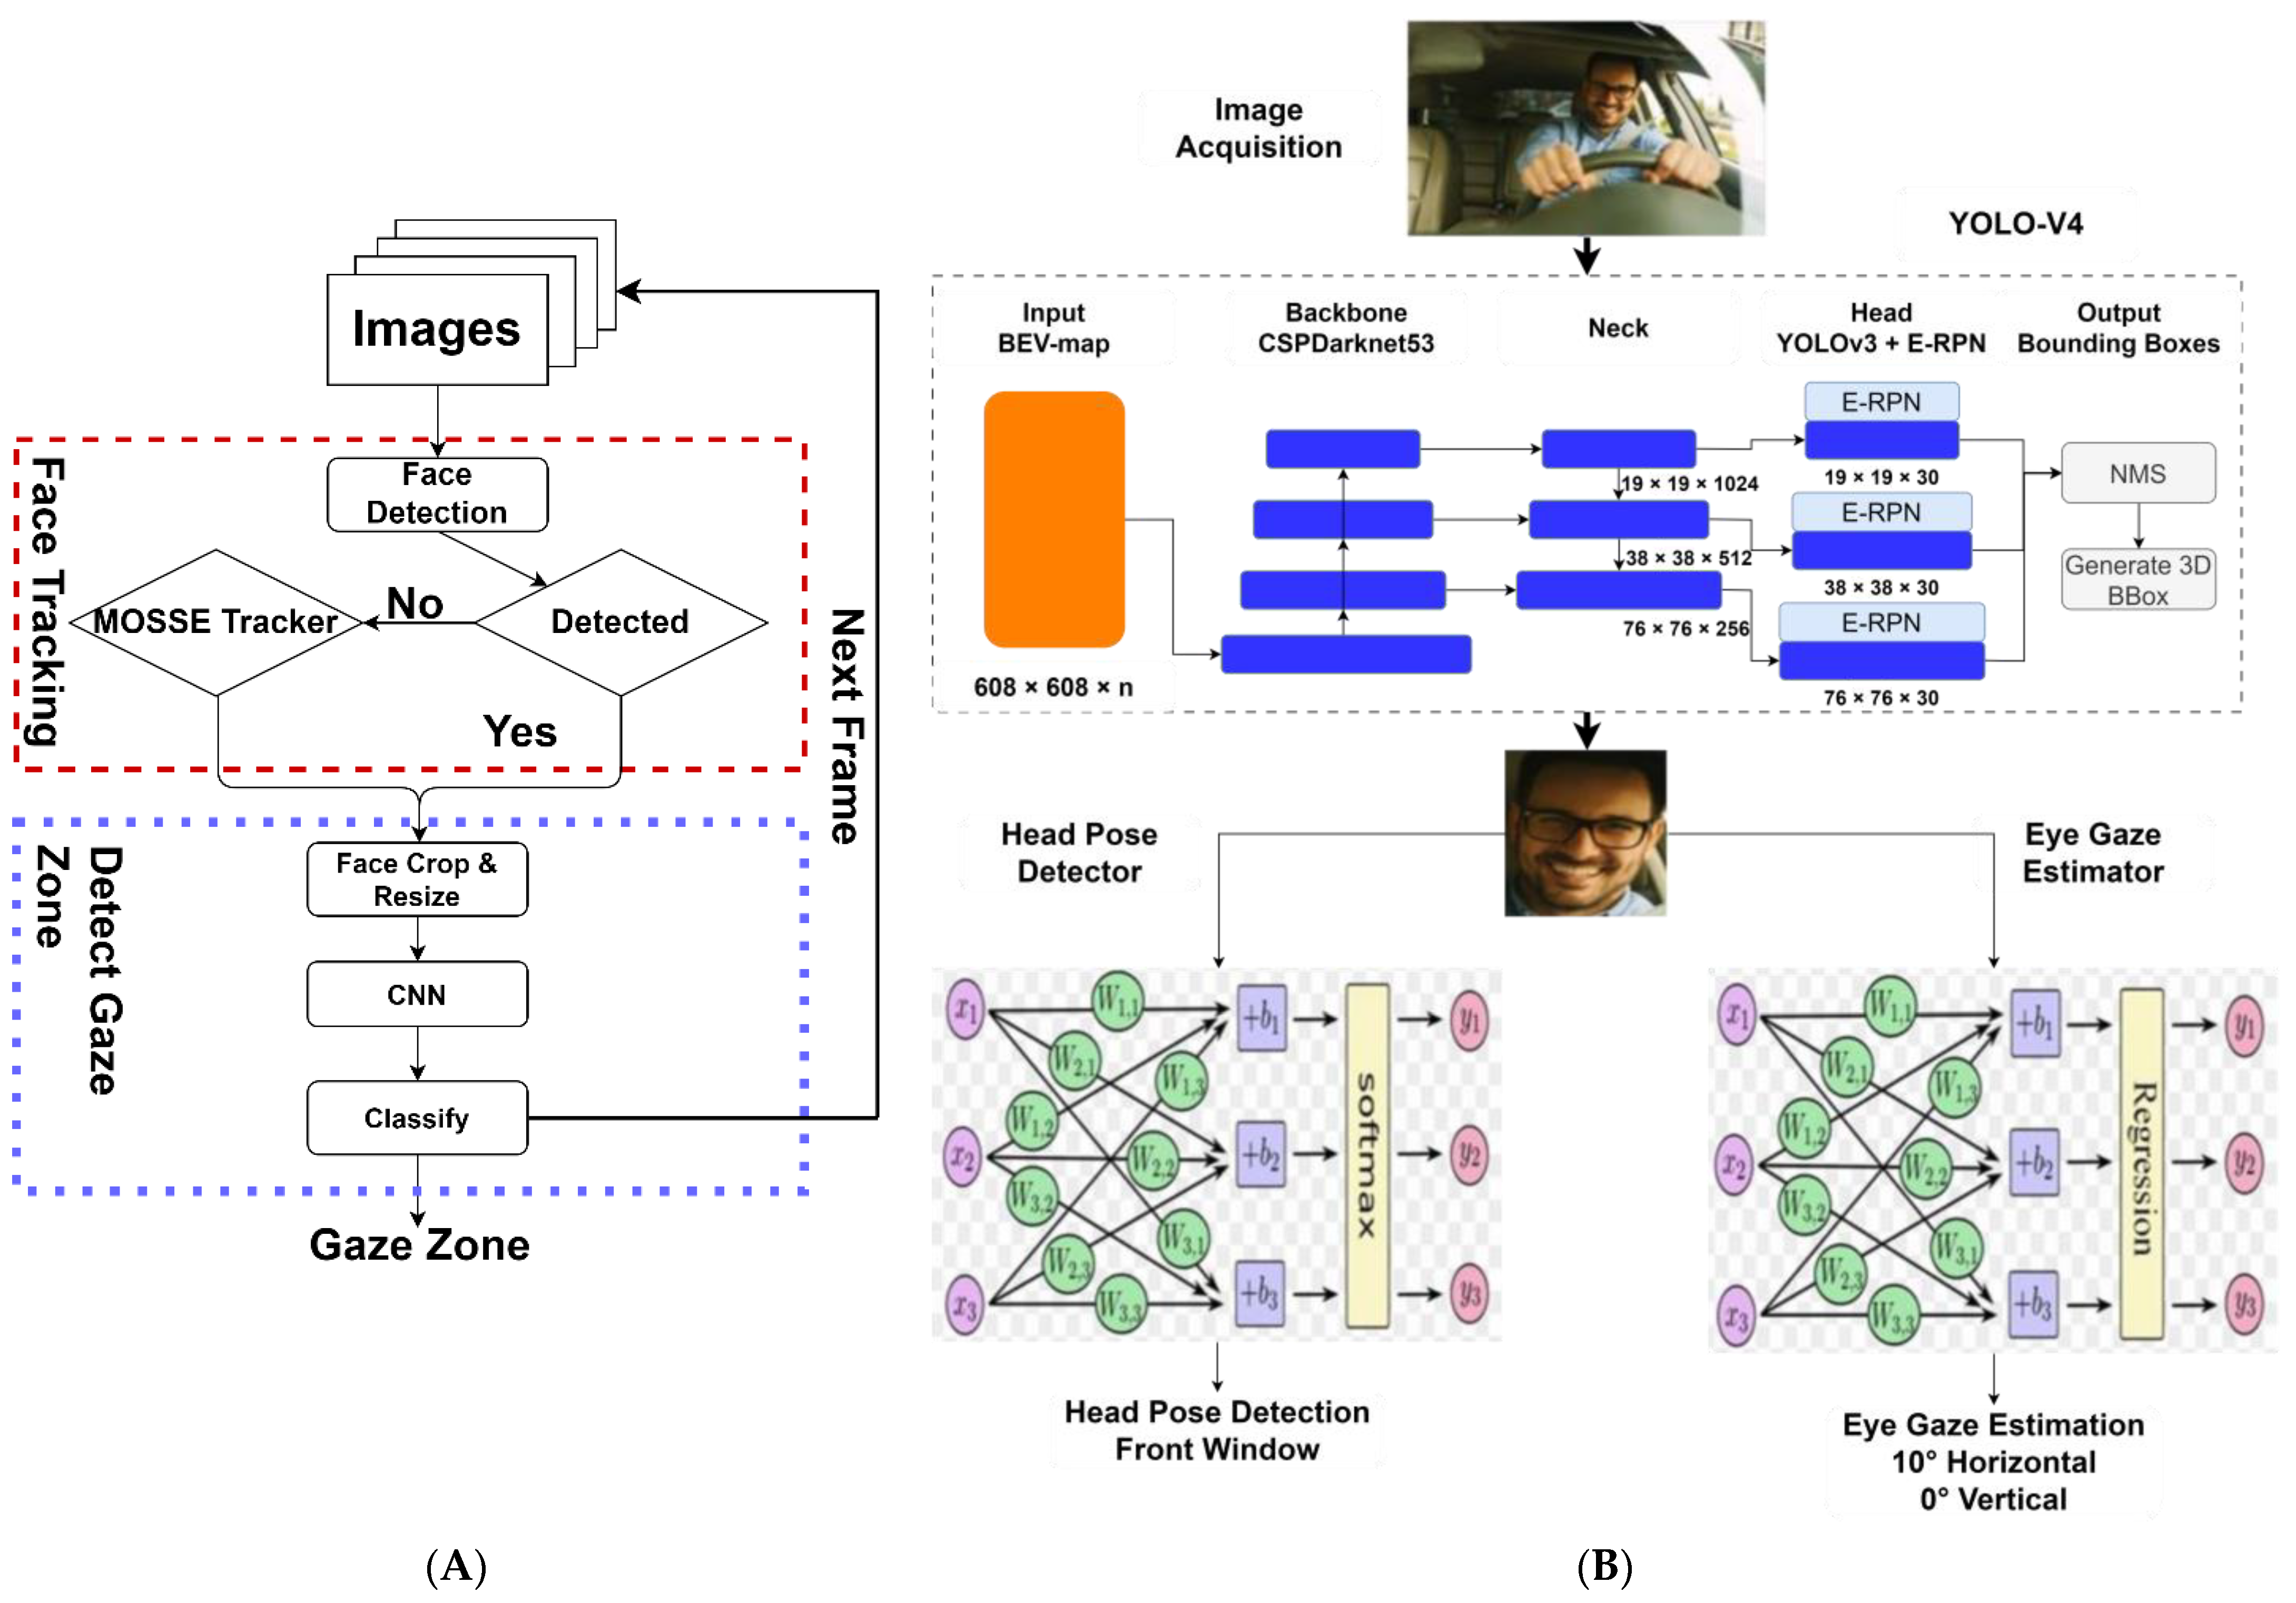
2.1. Supervised Learning
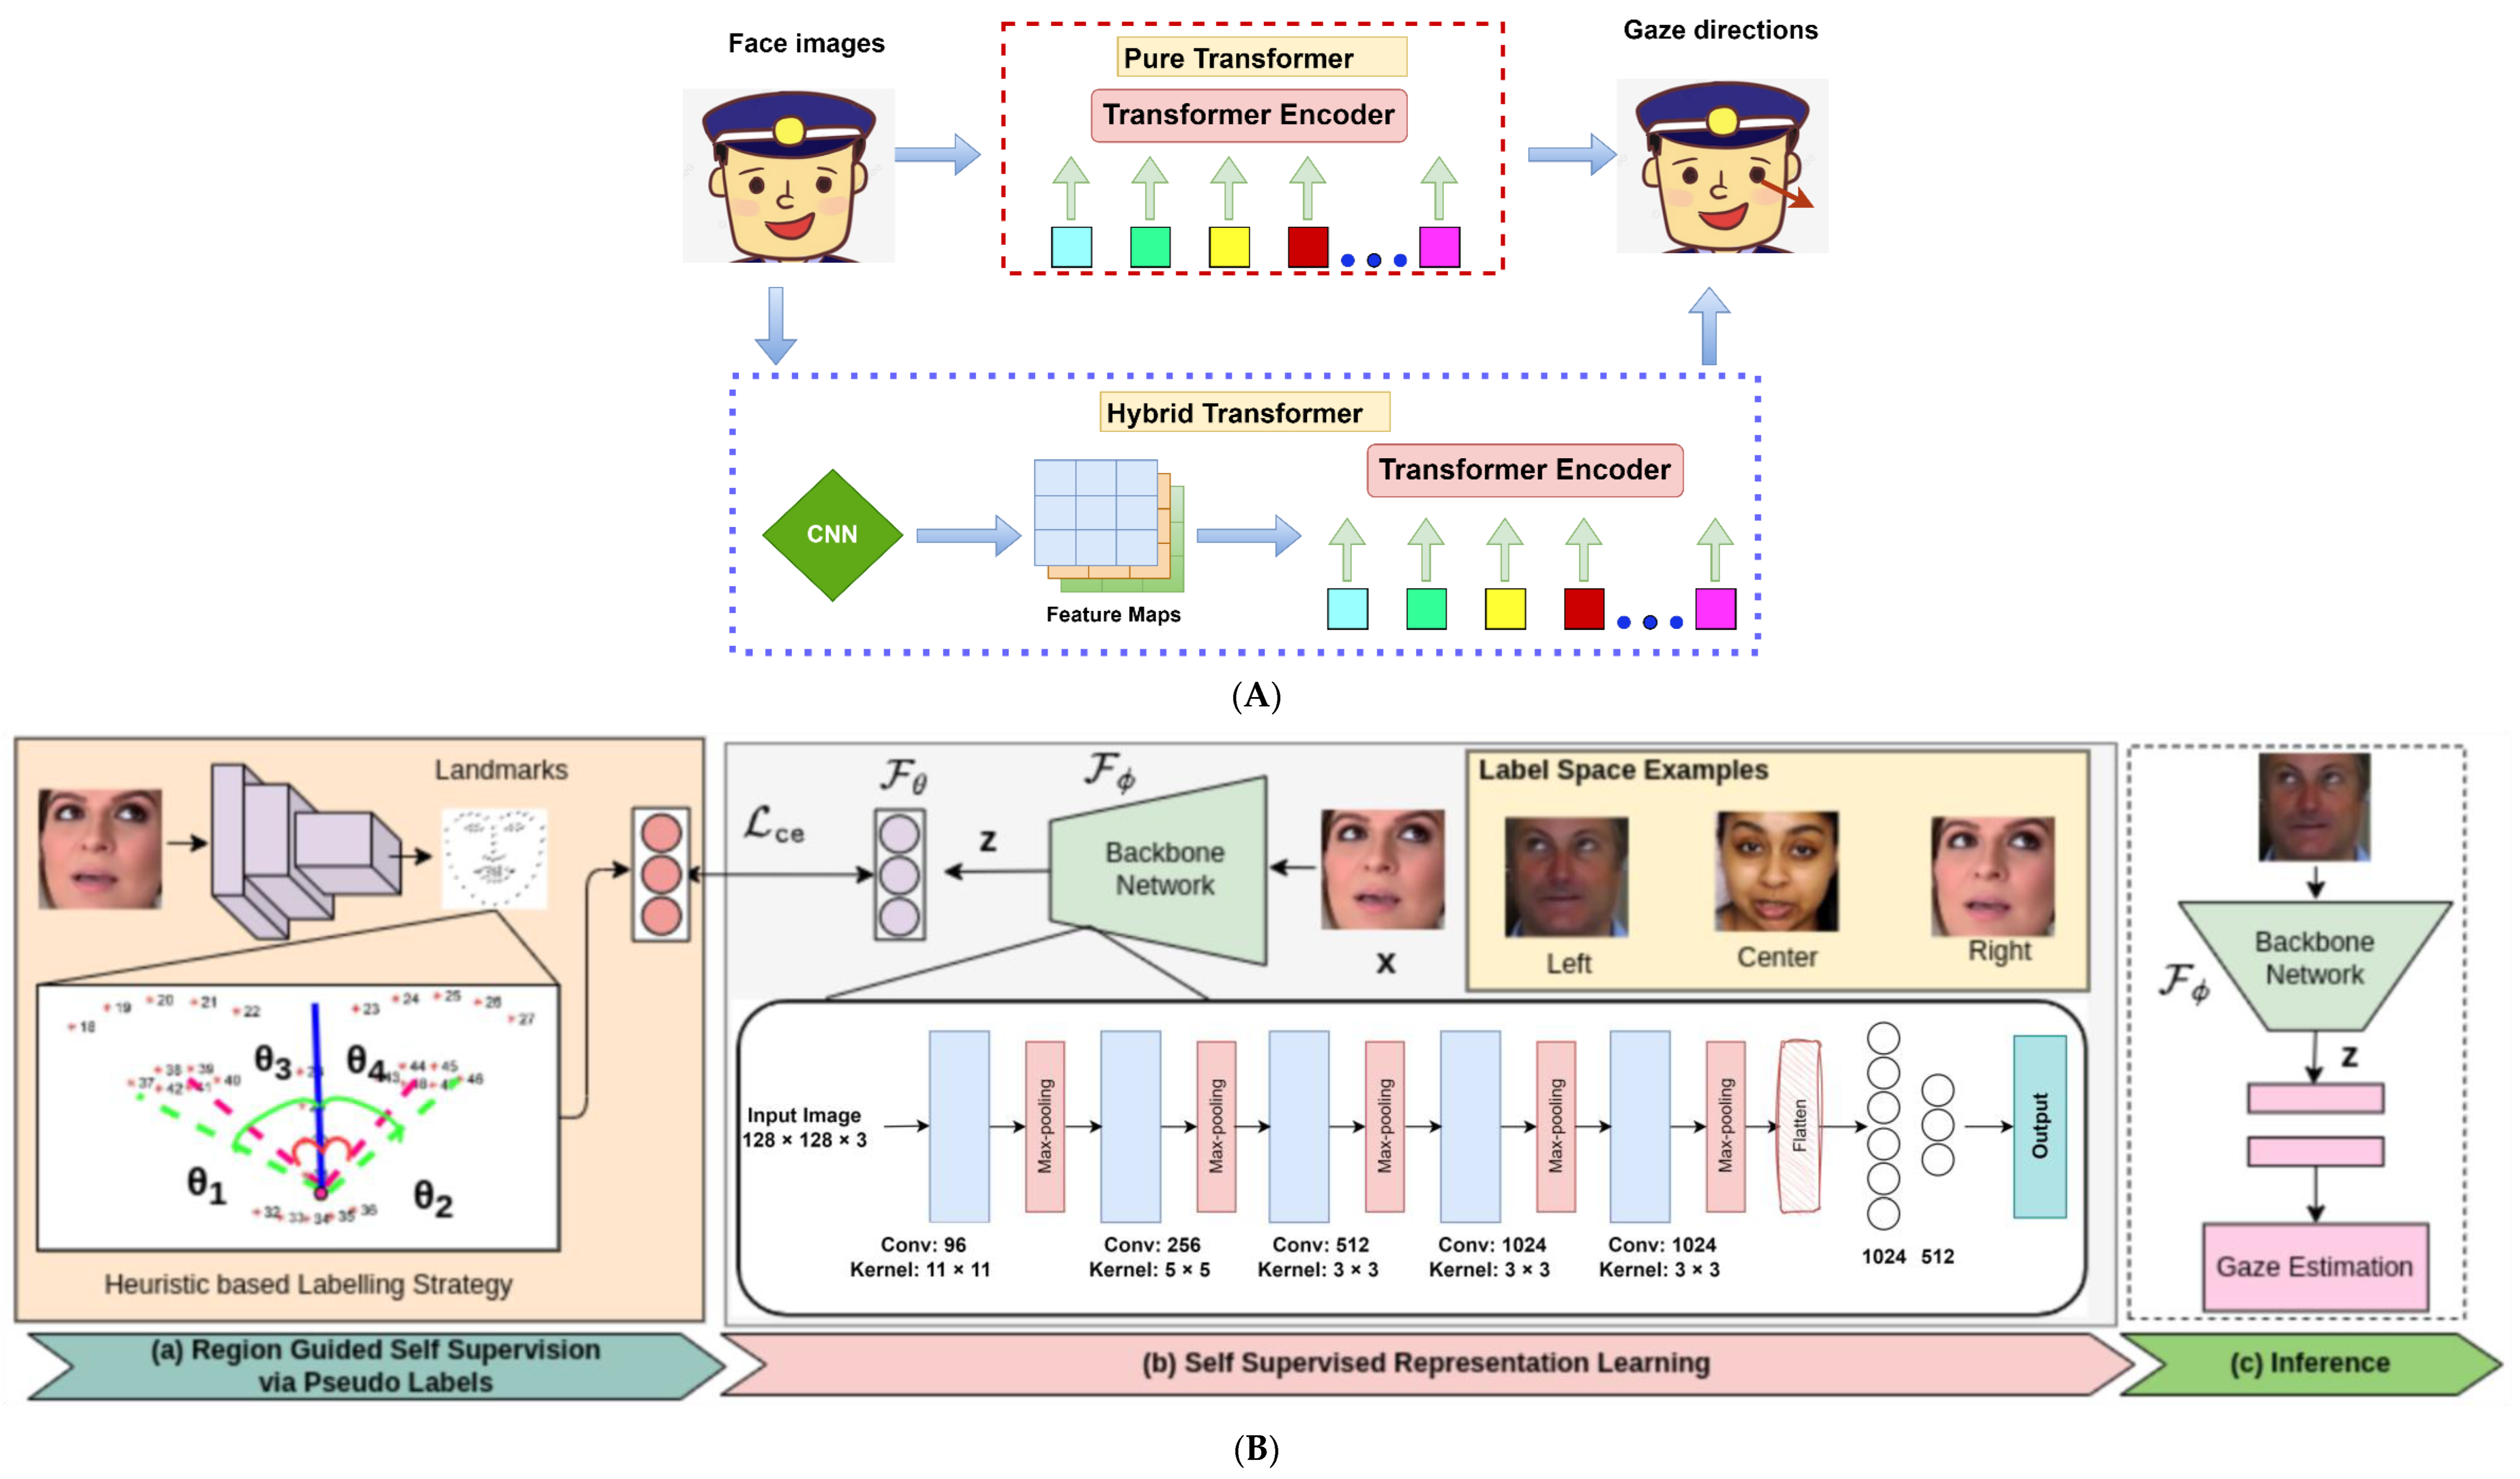
2.2. Exploratory New Promises
- Compared with traditional CV techniques, DL methods (CNN, VGG, ResNet, GAN, etc.) improved the performance of image-based driver gaze analysis in many studies. However, other recent DL models, such as transformer or unsupervised learning, should be explored to improve the accuracy of driver gaze analysis.
- As shown in Table 1, there are some limitations of current datasets for driver’s gaze analysis. Limitations may include, for example: low image resolution; dataset not large enough to have adequate training samples for all gaze zones; and limited data collection during abnormal weather (rain, snow, wind, etc.). More high-resolution images of drivers’ faces or eyes under different scenarios (weather, traffic, roads, illumination, etc.) are desired in the future for model training.
- As shown in Table 1, the number of gaze zones among these studies are not consistent; they range from 5 to 17. Determining the critical driver gaze zones is crucial to maintain safety during driving. Accordingly, a robust algorithm to monitor the identified critical gaze zones of drivers can be developed for better DMS or ADAS.
- In addition to driver’s facial images, more data sources should be included for a comprehensive driver’s gaze analysis during naturalistic driving situations. For instance, images or videos of roads should be collected to monitor road condition, traffic flow, and understand the corresponding driver behavior or gaze movement.
- Current studies mostly focus on classifying drivers’ gaze zones via images or video. A real-time prediction of driver’s gaze during driving among those zones via AI and CV should benefit DMS and ADAS.
- Gaze analysis of truck or bus drivers is absent based on the literature review. Given the distinct visibility challenges posed by the larger and higher cabs of trucks and buses compared to passenger vehicles, there is a need to investigate the critical gaze zones for truck or bus drivers to ensure safe driving practices.

3. Driver State Monitoring
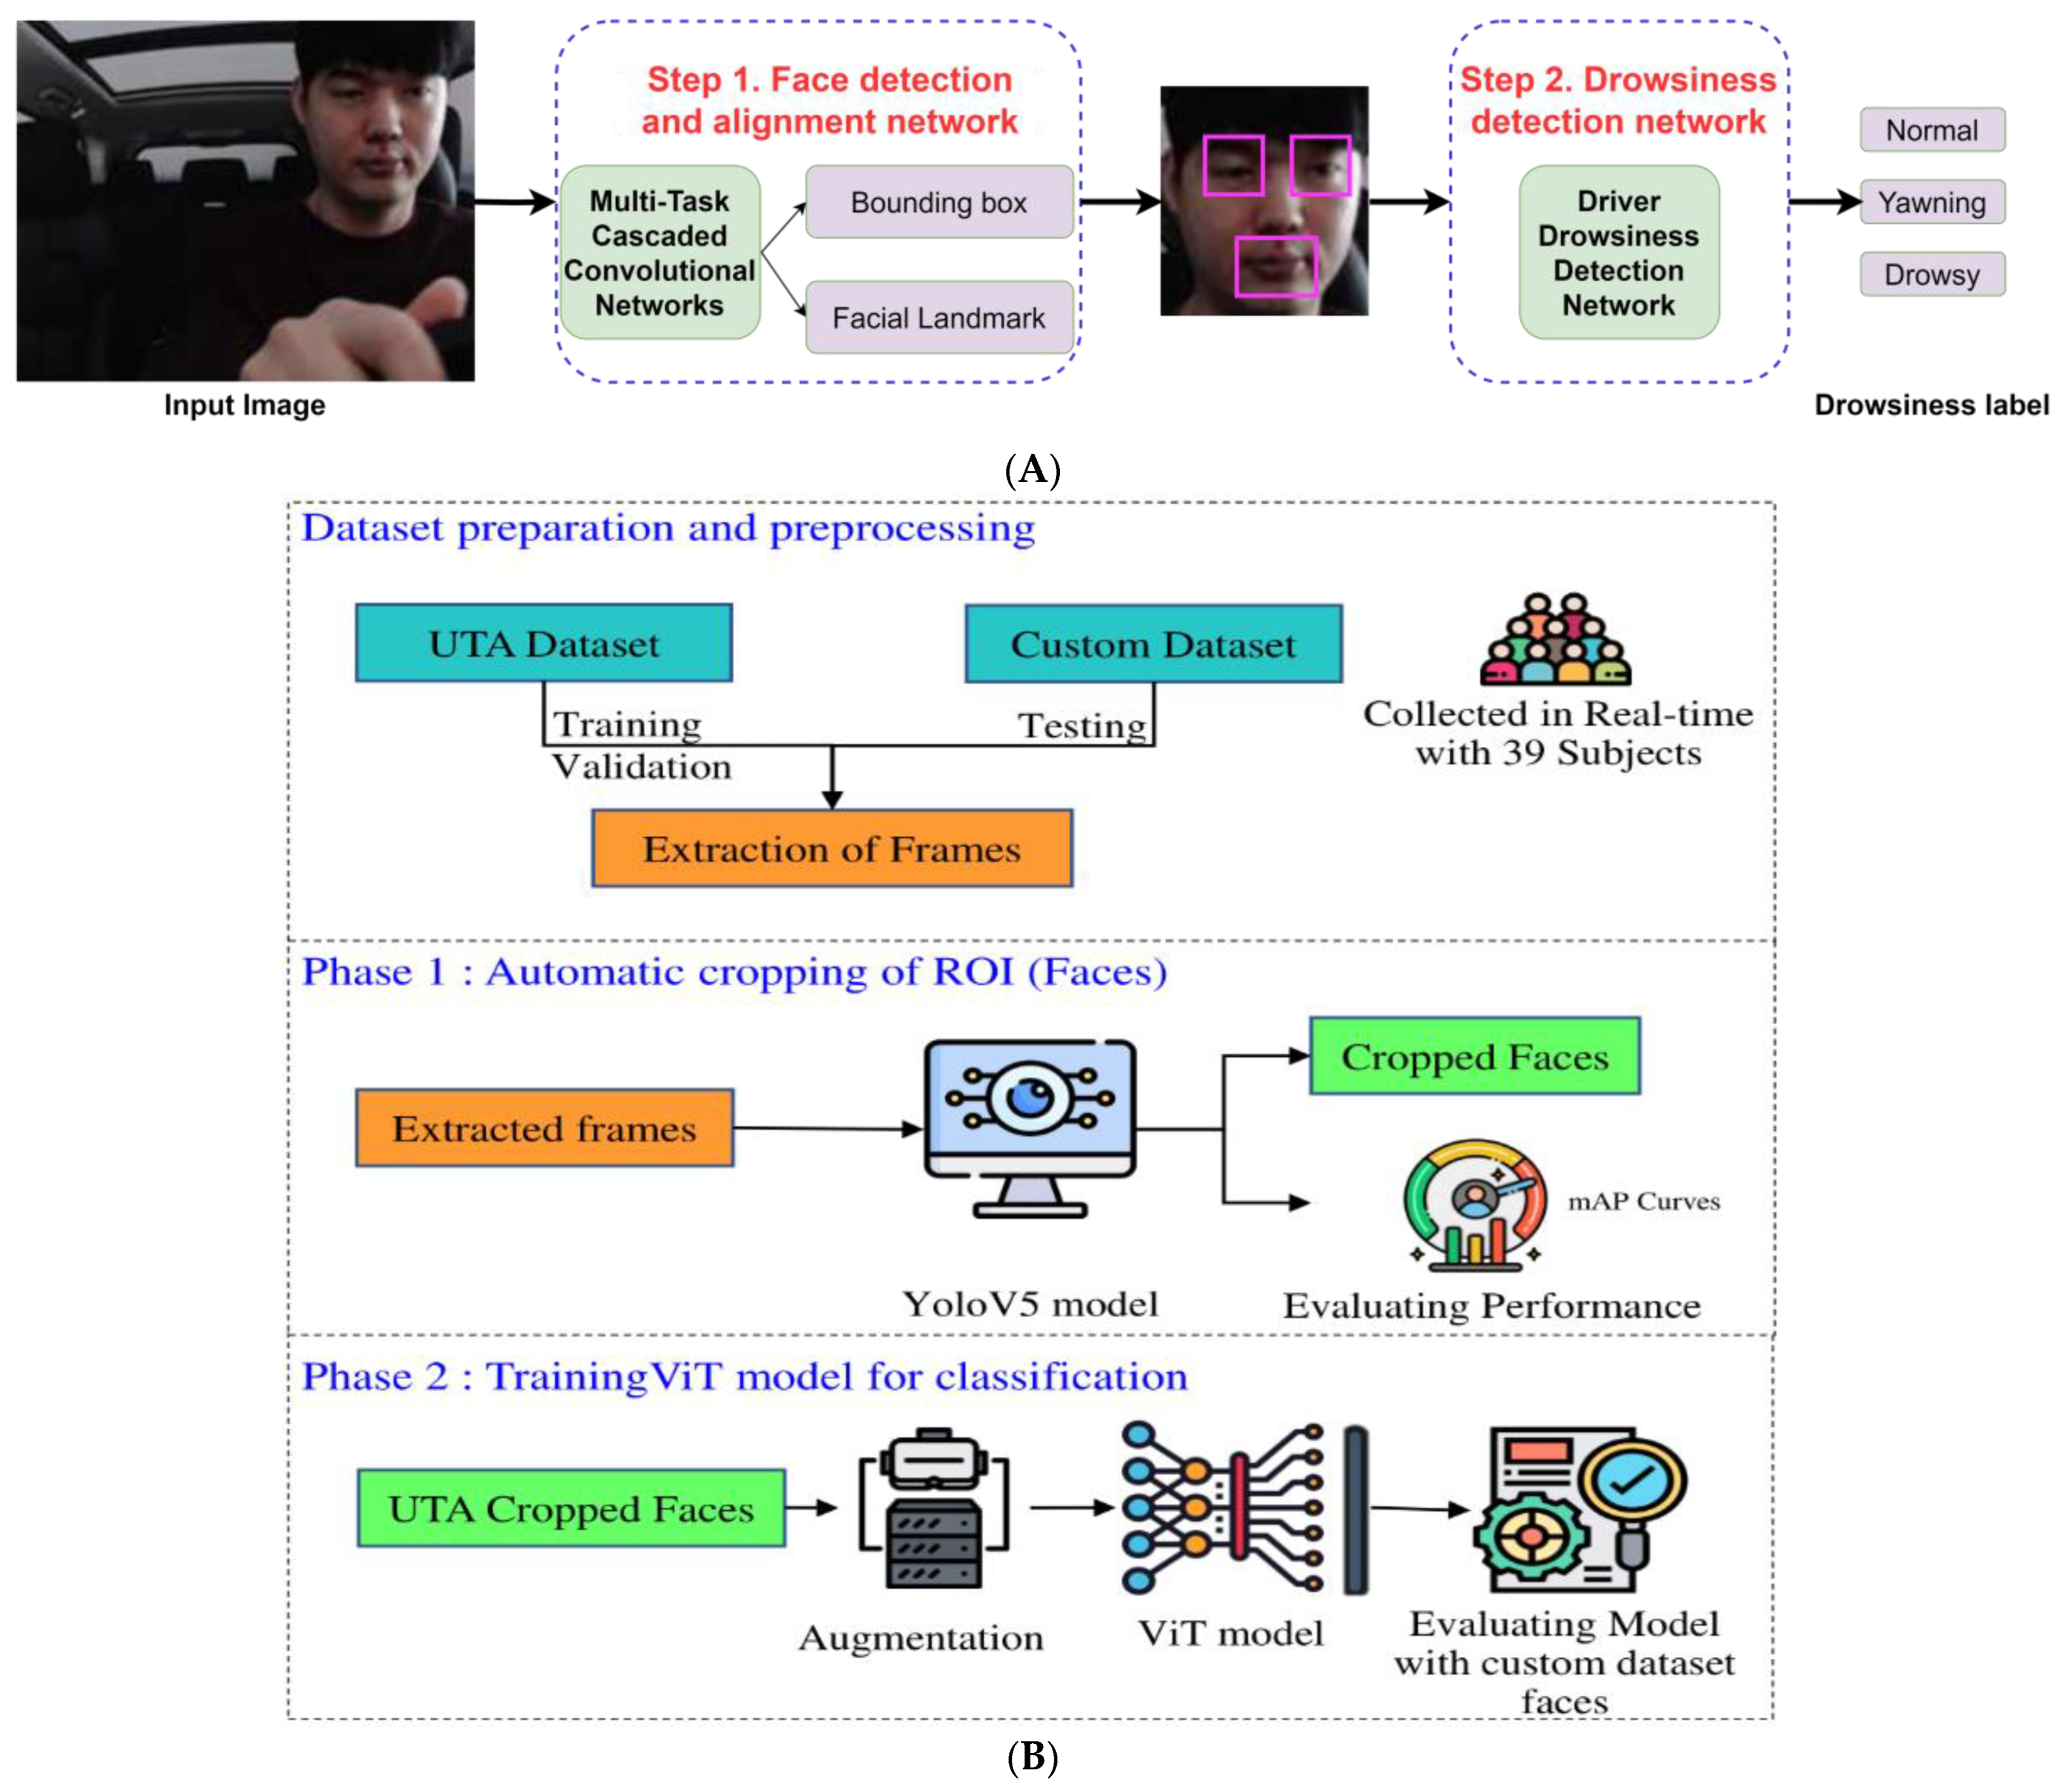
3.1. Driver Drowsiness Detection

3.2. Driver Distraction Detection
3.3. Other Driver State Monitoring
- Driver state monitoring encompasses a wide range of facets, such as identifying drowsiness, detecting distractions, predicting maneuvers, monitoring driver emotions, detecting drunk driving, and identifying driver anomalies.
- DL methods have significantly enhanced the effectiveness of image-based driver state monitoring in various aspects, surpassing traditional CV techniques, just as they have done with driver gaze analysis.
- Noncontact-based drowsiness monitoring using CV and DL methods showed better performance than contact-based methods and were cheaper and easier for installation.
- The future of driver state monitoring is poised to leverage advanced DL models, facilitating the integration of multi-modal (RGB, depth, or IR) and multi-view (front, top, or side) images. This approach will pave the way for more comprehensive and robust driver state monitoring systems in real-time.
- State monitoring of truck or bus drivers is limited, based on the literature review.


4. Analyzing Safety Critical Events
4.1. Crash Detection, Prediction, and Risk Analysis

4.2. Collision Warning System
- When it comes to crash risk analysis using CV, multiple facets are involved, such as crash detection, crash prediction, crash risk analysis, and collision warning systems that take into consideration vehicles, obstacles, and animals.
- There is a trend to apply multimodal data sources into different DL models to perform comprehensive scene analysis and crash risk analysis in real time.
- One significant limitation of current crash risk analysis for ego vehicles is their exclusive focus on images or videos of roadways. To achieve earlier real-time crash prediction, there is a need to integrate information from DMSs (gaze analysis or state monitoring) and road scene analysis into crash risk analysis because many crashes are closely linked to the behavior or state of vehicle drivers.
- The literature review reveals a scarcity of crash risk analysis specifically for trucks or buses.
5. Market Scan of AI Tools
5.1. End Users
5.2. Sensors and Attributes
5.3. AI Algorithms
- Driver Coaching: This classification indicates this company markets their AI algorithm as a way for fleets to identify risky drivers so they can be coached by safety management on proper driving habits. This classification also indicates that the AI algorithm analyzes risky driver behaviors to give drivers a scorecard review.
- Crash Prediction: This classification indicates this company uses an AI algorithm to analyze risky driving behavior and factors in environmental conditions such as weather, time of day, or route to predict whether a driver is at an increased risk for a crash.
- Insurance Claims: This classification indicates a company uses their telematics system with an AI algorithm to exonerate drivers against false claims, reduce insurance costs for drivers classified as “safe” drivers, or mentions reducing insurance costs in some way.
- Crash Reconstruction: This classification indicates this company uses an AI algorithm to reconstruct a crash to determine fault or determine what the driver was doing that may have caused the crash.
- Behavior Prediction: This classification indicates this company uses an AI algorithm to collect driver behavior trends such as seatbelt use during specific times, times they seem drowsy, etc., to determine when a risky driving behavior is most likely.

| Company Name | AI Capability | AI Purpose | AI Purpose Summary |
|---|---|---|---|
| Samsara [97] | Advanced edge computing, live scene analysis, and object detection. |
| Driver coaching, crash prediction, insurance claims. |
| Cambridge Mobile Telematics [102] | AI-driven platform gathers sensor data from millions of devices and fuses them with contextual data to create a unified view of the vehicle and driver behavior |
| Crash predication, insurance claims, crash reconstruction. |
| Geotab [103] | AI connected sensors capture risky driving events |
| Behavior prediction |
| Orion Fleet Intelligence [104] | AI Capabilities detect driver behavior |
| Behavior prediction, driver coaching, insurance claims. |
| Lytx [98] | Advanced CV & AI capture and accurately categorize risky driving behaviors |
| Behavior prediction, crash prediction, insurance claims. |
| Omnitracs [99] | Intelligent Triggering |
| Driver coaching. |
| Trimble [105] | AI technology senses in-cab movementsAI algorithms that can distinguish between driver movements, predict potential scenarios and help reduce collision loss |
| Crash prevention, driver coaching, insurance claims. |
| Azuga [106] | DMS captures video and processes them through AI-engine to analyzes each driver-facing video to look for possible distraction events |
| Driver coaching, crash prevention, insurance claims. |
| Zenduit [107] | DMS captures video and processes them through AI-engine to analyzes each driver-facing video to look for possible distraction events |
| Crash prevention, driver coaching. |
| JJ Keller [108] | AI processor with passive dash cam monitoring |
| Insurance claims |
| Blue Arrow [109] | AI & CV uses harsh acceleration, harsh cornering, and harsh braking events to help fleets avoid possible collisions. With AI, unsafe driving behaviors like drowsiness and distracted driving can be monitored and customized to coach drivers |
| Driver coaching, insurance claims. |
| Fleet Complete [110] | AI on-the-edge processing processes events without the need of a network, allowing event identification to occur quickly and efficiently |
| Driver coaching, insurance claims. |
| Nauto [100] | Predictive AI continuously processes images from the sensor to analyze facial movements and detect unsafe driving behavior |
| Driver coaching, insurance claims, crash prediction. |
- Firstly, criteria about how proprietary AI algorithms define driver states such as distracted driving and drowsy driving are still unclear.
- Secondly, there are no evaluation criteria available for each monitoring system, and it is difficult to compare the AI algorithms between companies without understanding how each system defines its variables.
- Lastly, the information gathered about AI algorithms explained the benefits of the technology, such as decreasing crash risk or improving driver coaching, but did not explain how these results were achieved.
6. Conclusions
- Compared with traditional CV techniques, DL methods improved the performance of image-based driver gaze analysis, driver state monitoring, and SCE analysis in many studies.
- For driver gaze analysis, the image resolution, size and diversity of the training dataset, and the number of gaze zones affected the model’s performance. It is desired to determine which are the critical driver gaze zones to maintain safe driving.
- For driver state monitoring, noncontact-based drowsiness monitoring using CV and DL methods showed better performance than contact-based methods and were cheaper and easier to install.
- The DMSs have a trend to leverage advanced AI models to integrate multi-modal (RGB, depth, or IR) and multi-view (front, top, or side) images of drivers and road scene to compressively analyze SCEs in vehicles.
- One notable limitation in prior studies on the analysis of SCEs is their exclusive focus on images or videos related to traffic or roadways. To achieve earlier real-time crash prediction, it is imperative to incorporate information from DMS (gaze analysis or state monitoring) and road scene analysis into SCE analysis, as identified unsafe driver behaviors and high-risk driver states can serve as early indicators of SCEs, potentially preventing them before they occur.
- Studies involving OEM-integrated DMSs for trucks or buses are absent, as these systems have only recently come online with the advancement of ADAS technologies. As such, the literature review reveals a scarcity of DMS-identified SCEs and of identified crash modification factors from trucks or buses as heavy vehicle-integrated DMS catch up to passenger vehicles.
- The industry is reluctant to share how they implement AI in their DMS in detail, including definitions of different driver states, common evaluation criteria of different DMS, and how AI was used to decrease crash risk or improve driver coaching.
Author Contributions
Funding
Acknowledgments
Conflicts of Interest
References
- Evans, L. The Dominant Role of Driver Behavior in Traffic Safety. Am. J. Public Health 1996, 86, 784–786. [Google Scholar] [CrossRef] [PubMed]
- Blincoe, L.; Miller, T.; Wang, J.-S.; Swedler, D.; Coughlin, T.; Lawrence, B.; Guo, F.; Klauer, S.; Dingus, T. The Economic and Societal Impact of Motor Vehicle Crashes, 2019 (Revised); National Highway Traffic Safety Administration: Washington, DC, USA, 2023. [Google Scholar]
- NHTSA. Risky Driving. Available online: https://www.nhtsa.gov/risky-driving (accessed on 7 February 2023).
- SAE Standard J3016; SAE International Surface Vehicle Recommended Practice. Taxonomy and Definitions for Terms Related to Driving Automation Systems for On-Road Motor Vehicles. SAE: Warrendale, PA, USA, 2021.
- Uffizio. Enhancing Road Safety with Truck Driver Monitoring System. Available online: https://www.uffizio.com/blog/enhancing-road-safety-with-truck-driver-monitoring-system/ (accessed on 22 January 2024).
- Retzer, K.; Tate, D.; Hill, R. Implementing an In-Vehicle Monitoring Program: A Guide for the Oil and Gas Extraction Industry. In Proceedings of the SPE International Conference on Health, Safety, Environment in Oil and Gas Exploration and Production, Perth, Australia, 11–13 September 2012; SPE: Perth, Australia, 2012; p. SPE-156535-MS. [Google Scholar]
- Bell, J.L.; Taylor, M.A.; Chen, G.-X.; Kirk, R.D.; Leatherman, E.R. Evaluation of an In-Vehicle Monitoring System (IVMS) to Reduce Risky Driving Behaviors in Commercial Drivers: Comparison of in-Cab Warning Lights and Supervisory Coaching with Videos of Driving Behavior. J. Saf. Res. 2017, 60, 125–136. [Google Scholar] [CrossRef] [PubMed]
- Kang, H.-B. Various Approaches for Driver and Driving Behavior Monitoring: A Review. In Proceedings of the 2013 IEEE International Conference on Computer Vision Workshops, Sydney, Australia, 2–8 December 2013; pp. 616–623. [Google Scholar]
- Kim, B.; Baek, Y. Sensor-Based Extraction Approaches of In-Vehicle Information for Driver Behavior Analysis. Sensors 2020, 20, 5197. [Google Scholar] [CrossRef] [PubMed]
- Talebloo, F.; Mohammed, E.A.; Far, B. Deep Learning Approach for Aggressive Driving Behaviour Detection. arXiv 2021, arXiv:2111.04794. [Google Scholar]
- Balali, V.; Tavakoli, A.; Heydarian, A. A Multimodal Approach for Monitoring Driving Behavior and Emotions; Report 20–27; Mineta Transportation Institute: San José, CA, USA, 2020. [Google Scholar]
- Das, K.; Sharak, S.; Riani, K.; Abouelenien, M.; Burzo, M.; Papakostas, M. Multimodal Detection of Drivers Drowsiness and Distraction. In Proceedings of the 2021 International Conference on Multimodal Interaction, Montréal, QC, Canada, 18–22 October 2021; ACM: Montréal, QC, Canada, 2021; pp. 416–424. [Google Scholar]
- Li, Y.; Moreau, J.; Ibanez-Guzman, J. Unconventional Visual Sensors for Autonomous Vehicles. arXiv 2022, arXiv:2205.09383. [Google Scholar]
- Zhang, W.; Cheng, B.; Lin, Y. Driver Drowsiness Recognition Based on Computer Vision Technology. Tinshhua Sci. Technol. 2012, 17, 354–362. [Google Scholar] [CrossRef]
- Zhang, Y.; Yang, X.; Feng, Z. Driving Distraction Detection Based on Gaze Activity. Electron. Lett. 2021, 57, 857–859. [Google Scholar] [CrossRef]
- Sarker, I.H. Deep Learning: A Comprehensive Overview on Techniques, Taxonomy, Applications and Research Directions. SN Comput. Sci. 2021, 2, 420. [Google Scholar] [CrossRef] [PubMed]
- Tavakoli, A.; Heydarian, A. Multimodal Driver State Modeling through Unsupervised Learning. Accid. Anal. Prev. 2022, 170, 106640. [Google Scholar] [CrossRef]
- Gao, Z.; Liu, Y.; Zheng, J.Y.; Yu, R.; Wang, X.; Sun, P. Predicting Hazardous Driving Events Using Multi-Modal Deep Learning Based on Video Motion Profile and Kinematics Data. In Proceedings of the 2018 21st International Conference on Intelligent Transportation Systems (ITSC), Maui, HI, USA, 4–7 November 2018; pp. 3352–3357. [Google Scholar]
- Arvin, R.; Khattak, A.J.; Qi, H. Safety Critical Event Prediction through Unified Analysis of Driver and Vehicle Volatilities: Application of Deep Learning Methods. Accid. Anal. Prev. 2021, 151, 105949. [Google Scholar] [CrossRef]
- Li, Z.; Yu, B.; Wang, Y.; Chen, Y.; Kong, Y.; Xu, Y. A Novel Collision Warning System Based on the Visual Road Environment Schema: An Examination from Vehicle and Driver Characteristics. Accid. Anal. Prev. 2023, 190, 107154. [Google Scholar] [CrossRef] [PubMed]
- Hussain, F.; Ali, Y.; Li, Y.; Haque, M.M. Real-Time Crash Risk Forecasting Using Artificial-Intelligence Based Video Analytics: A Unified Framework of Generalised Extreme Value Theory and Autoregressive Integrated Moving Average Model. Anal. Methods Accid. Res. 2023, 40, 100302. [Google Scholar] [CrossRef]
- Tian, D.; Chuang, Z.; Xuting, D.; Xixian, W. An Automatic Car Accident Detection Method Based on Cooperative Vehicle Infrastructure Systems. IEEE Access 2019, 7, 127453–127463. [Google Scholar] [CrossRef]
- Khan, M.Q.; Lee, S. Gaze and Eye Tracking: Techniques and Applications in ADAS. Sensors 2019, 19, 5540. [Google Scholar] [CrossRef]
- Ghosh, S.; Dhall, A.; Hayat, M.; Knibbe, J.; Ji, Q. Automatic Gaze Analysis: A Survey of Deep Learning Based Approaches. arXiv 2022, arXiv:2108.05479. [Google Scholar] [CrossRef] [PubMed]
- Cheng, Y.; Wang, H.; Bao, Y.; Lu, F. Appearance-Based Gaze Estimation with Deep Learning: A Review and Benchmark. arXiv 2021, arXiv:2104.12668. [Google Scholar]
- Palmero, C.; Sharma, A.; Behrendt, K.; Krishnakumar, K.; Komogortsev, O.V.; Talathi, S.S. OpenEDS2020 Challenge on Gaze Tracking for VR: Dataset and Results. Sensors 2021, 21, 4769. [Google Scholar] [CrossRef] [PubMed]
- Shah, S.M.; Sun, Z.; Zaman, K.; Hussain, A.; Shoaib, M.; Pei, L. A Driver Gaze Estimation Method Based on Deep Learning. Sensors 2022, 22, 3959. [Google Scholar] [CrossRef] [PubMed]
- Lu, S.; Li, R.; Jiao, J.; Kang, J.; Zhao, N.; Li, M. An Eye Gaze Tracking Method of Virtual Reality Headset Using A Single Camera and Multi-Light Source. J. Phys. Conf. Ser. 2020, 1518, 012020. [Google Scholar] [CrossRef]
- Cazzato, D.; Leo, M.; Distante, C.; Voos, H. When I Look into Your Eyes: A Survey on Computer Vision Contributions for Human Gaze Estimation and Tracking. Sensors 2020, 20, 3739. [Google Scholar] [CrossRef]
- Rezaei, M.; Klette, R. Computer Vision for Driver Assistance: Simultaneous Traffic and Driver Monitoring; Computational Imaging and Vision; Springer International Publishing: Cham, Switzerland, 2017; Volume 45, ISBN 978-3-319-50549-7. [Google Scholar]
- Fridman, L.; Langhans, P.; Lee, J.; Reimer, B. Driver Gaze Region Estimation Without Using Eye Movement. arXiv 2016, arXiv:1507.04760. [Google Scholar]
- Ledezma, A.; Zamora, V.; Sipele, Ó.; Sesmero, M.P.; Sanchis, A. Implementing a Gaze Tracking Algorithm for Improving Advanced Driver Assistance Systems. Electronics 2021, 10, 1480. [Google Scholar] [CrossRef]
- Rani, P.S.; Subhashree, P.; Devi, N.S. Computer Vision Based Gaze Tracking for Accident Prevention. In Proceedings of the 2016 World Conference on Futuristic Trends in Research and Innovation for Social Welfare, Coimbatore, India, 29 February–1 March 2016; pp. 1–6. [Google Scholar]
- Wang, Y.; Yuan, G.; Mi, Z.; Peng, J.; Ding, X.; Liang, Z.; Fu, X. Continuous Driver’s Gaze Zone Estimation Using RGB-D Camera. Sensors 2019, 19, 1287. [Google Scholar] [CrossRef] [PubMed]
- Shan, X.; Wang, Z.; Liu, X.; Lin, M.; Zhao, L.; Wang, J.; Wang, G. Driver Gaze Region Estimation Based on Computer Vision. In Proceedings of the 2020 12th International Conference on Measuring Technology and Mechatronics Automation (ICMTMA), Phuket, Thailand, 28–29 February 2020; pp. 357–360. [Google Scholar]
- Choi, I.-H.; Hong, S.K.; Kim, Y.-G. Real-Time Categorization of Driver’s Gaze Zone Using the Deep Learning Techniques. In Proceedings of the 2016 International Conference on Big Data and Smart Computing (BigComp), Hong Kong, China, 18–20 January 2016; pp. 143–148. [Google Scholar]
- Naqvi, R.; Arsalan, M.; Batchuluun, G.; Yoon, H.; Park, K. Deep Learning-Based Gaze Detection System for Automobile Drivers Using a NIR Camera Sensor. Sensors 2018, 18, 456. [Google Scholar] [CrossRef] [PubMed]
- Vora, S.; Rangesh, A.; Trivedi, M.M. Driver Gaze Zone Estimation Using Convolutional Neural Networks: A General Framework and Ablative Analysis. IEEE Trans. Intell. Veh. 2018, 3, 254–265. [Google Scholar] [CrossRef]
- Rangesh, A.; Zhang, B.; Trivedi, M.M. Driver Gaze Estimation in the Real World: Overcoming the Eyeglass Challenge. In Proceedings of the 2020 IEEE Intelligent Vehicles Symposium (IV), Las Vegas, NV, USA, 19 October–13 November 2020; pp. 1054–1059. [Google Scholar]
- Stappen, L.; Rizos, G.; Schuller, B. X-AWARE: ConteXt-AWARE Human-Environment Attention Fusion for Driver Gaze Prediction in the Wild. In Proceedings of the 2020 International Conference on Multimodal Interaction, Virtual Event, 25–29 October 2020; ACM: New York, NY, USA; pp. 858–867. [Google Scholar]
- Kasahara, I.; Stent, S.; Park, H.S. Look Both Ways: Self-Supervising Driver Gaze Estimation and Road Scene Saliency. In Proceedings of the 17th European Conference, Tel Aviv, Israel, 23–27 October 2022; Avidan, S., Brostow, G., Cissé, M., Farinella, G.M., Hassner, T., Eds.; Lecture Notes in Computer Science. Springer: Cham, Switzerland, 2022; Volume 13673, pp. 126–142. [Google Scholar] [CrossRef]
- Cheng, Y.; Lu, F. Gaze Estimation Using Transformer. In Proceedings of the 2022 26th International Conference on Pattern Recognition (ICPR), Montreal, QC, Canada, 21–25 August 2022; pp. 3341–3347. [Google Scholar]
- Nagpure, V.; Okuma, K. Searching Efficient Neural Architecture with Multi-Resolution Fusion Transformer for Appearance-Based Gaze Estimation. In Proceedings of the IEEE/CVF Winter Conference on Applications of Computer Vision (WACV), Waikoloa, HI, USA, 3–7 January 2023; pp. 890–899. [Google Scholar]
- Liu, J.; Chi, J.; Yang, H.; Yin, X. In the Eye of the Beholder: A Survey of Gaze Tracking Techniques. Pattern Recognit. 2022, 132, 108944. [Google Scholar] [CrossRef]
- Pathirana, P.; Senarath, S.; Meedeniya, D.; Jayarathna, S. Eye Gaze Estimation: A Survey on Deep Learning-Based Approaches. Expert Syst. Appl. 2022, 199, 116894. [Google Scholar] [CrossRef]
- Yu, Y.; Odobez, J.-M. Unsupervised Representation Learning for Gaze Estimation. In Proceedings of the 2020 IEEE/CVF Conference on Computer Vision and Pattern Recognition (CVPR), Seattle, WA, USA, 13–19 June 2020; pp. 7312–7322. [Google Scholar]
- Dubey, N.; Ghosh, S.; Dhall, A. RAZE: Region Guided Self-Supervised Gaze Representation Learning. arXiv 2022, arXiv:2208.02485. [Google Scholar]
- Anderson, N.C.; Bischof, W.F.; Kingstone, A. Eye Tracking in Virtual Reality. In Current Topics in Behavioral Neurosciences; Springer: Berlin/Heidelberg, Germany, 2023. [Google Scholar]
- Blattgerste, J.; Renner, P.; Pfeiffer, T. Advantages of Eye-Gaze over Head-Gaze-Based Selection in Virtual and Augmented Reality under Varying Field of Views. In Proceedings of the Workshop on Communication by Gaze Interaction, Warsaw, Poland, 15 June 2018; pp. 1–9. [Google Scholar]
- Hu, Z.; Zhang, C.; Li, S.; Wang, G.; Manocha, D. SGaze: A Data-Driven Eye-Head Coordination Model for Realtime Gaze Prediction. IEEE Trans. Vis. Comput. Graph. 2019, 25, 2002–2010. [Google Scholar] [CrossRef] [PubMed]
- Vural, E.; Cetin, M.; Ercil, A.; Littlewort, G.; Bartlett, M.; Movellan, J. Drowsy Driver Detection Through Facial Movement Analysis. In Proceedings of the Human–Computer Interaction; Springer: Berlin/Heidelberg, Germany, 2007; Volume 4796, pp. 6–18. [Google Scholar]
- Lopez, M.B.; del-Blanco, C.R.; Garcia, N. Detecting Exercise-Induced Fatigue Using Thermal Imaging and Deep Learning. In Proceedings of the 2017 Seventh International Conference on Image Processing Theory, Tools and Applications (IPTA), Montreal, QC, Canada, 28 November–1 December 2017; pp. 1–6. [Google Scholar]
- Reddy, B.; Kim, Y.-H.; Yun, S.; Seo, C.; Jang, J. Real-Time Driver Drowsiness Detection for Embedded System Using Model Compression of Deep Neural Networks. In Proceedings of the 2017 IEEE Conference on Computer Vision and Pattern Recognition Workshops (CVPRW), Honolulu, HI, USA, 21–27 July 2017; IEEE: Honolulu, HI, USA, 2017; pp. 438–445. [Google Scholar]
- Revelo, A.; Alvarez, R.; Grijalva, F. Human Drowsiness Detection in Real Time, Using Computer Vision. In Proceedings of the 2019 IEEE Fourth Ecuador Technical Chapters Meeting (ETCM), Guayaquil, Ecuador, 13–15 November 2019; pp. 1–6. [Google Scholar]
- Hashemi, M.; Mirrashid, A.; Shirazi, A.B. Driver Safety Development Real Time Driver Drowsiness Detection System Based on Convolutional Neural Network. arXiv 2020, arXiv:2001.05137. [Google Scholar] [CrossRef]
- Draz, H.U.; Ali, M.I.; Khan, M.U.G.; Ahmad, M.; Mahmood, S.; Javaid, M.A. An Embedded Solution of Gaze Estimation for Driver Assistance Using Computer Vision. In Proceedings of the 2021 International Conference on Innovative Computing (ICIC), Lahore, Pakistan, 9–10 November 2021; pp. 1–8. [Google Scholar]
- Krishna, G.S.; Supriya, K.; Vardhan, J.; K, M.R. Vision Transformers and YoloV5 Based Driver Drowsiness Detection Framework. arXiv 2022, arXiv:2209.01401. [Google Scholar]
- Sharak, S.; Das, K.; Riani, K.; Abouelenien, M.; Burzo, M.; Mihalcea, R. Contact Versus Noncontact Detection of Driver’s Drowsiness. In Proceedings of the 2022 26th International Conference on Pattern Recognition (ICPR), Montreal, QC, Canada, 21–25 August 2022; pp. 967–974. [Google Scholar]
- Alameen, S.; Alhothali, A. A Lightweight Driver Drowsiness Detection System Using 3DCNN With LSTM. Comput. Syst. Sci. Eng. 2023, 44, 895–912. [Google Scholar] [CrossRef]
- NHTSA. Distracted Driving. Available online: https://www.nhtsa.gov/risky-driving/distracted-driving (accessed on 8 February 2023).
- Li, W.; Huang, J.; Xie, G.; Karray, F.; Li, R. A Survey on Vision-Based Driver Distraction Analysis. J. Syst. Archit. 2021, 121, 102319. [Google Scholar] [CrossRef]
- Fernández, A.; Usamentiaga, R.; Carús, J.; Casado, R. Driver Distraction Using Visual-Based Sensors and Algorithms. Sensors 2016, 16, 1805. [Google Scholar] [CrossRef] [PubMed]
- Zhao, C.H.; Zhang, B.L.; He, J.; Lian, J. Recognition of Driving Postures by Contourlet Transform and Random Forests. IET Intell. Transp. Syst. 2012, 6, 161. [Google Scholar] [CrossRef]
- Yan, S.; Teng, Y.; Smith, J.S.; Zhang, B. Driver Behavior Recognition Based on Deep Convolutional Neural Networks. In Proceedings of the 2016 12th International Conference on Natural Computation, Fuzzy Systems and Knowledge Discovery (ICNC-FSKD), Changsha, China, 13–15 August 2016; pp. 636–641. [Google Scholar]
- Abosaq, H.A.; Ramzan, M.; Althobiani, F.; Abid, A.; Aamir, K.M.; Abdushkour, H.; Irfan, M.; Gommosani, M.E.; Ghonaim, S.M.; Shamji, V.R.; et al. Unusual Driver Behavior Detection in Videos Using Deep Learning Models. Sensors 2023, 23, 311. [Google Scholar] [CrossRef]
- Yang, S.; Wilson, K.M.; Roady, T.; Kuo, J.; Lenné, M.G. Evaluating Driver Features for Cognitive Distraction Detection and Validation in Manual and Level 2 Automated Driving. Hum. Factors J. Hum. Factors Ergon. Soc. 2022, 64, 746–759. [Google Scholar] [CrossRef] [PubMed]
- Hou, J.H.J.; Xie, X.; Cai, Q.; Deng, Z.; Yang, H.; Huang, H.; Wang, X.; Feng, L.; Wang, Y. Early Warning System for Drivers’ Phone Usage with Deep Learning Network. J. Wirel. Com. Netw. 2022, 2022, 42. [Google Scholar] [CrossRef]
- Jain, A.; Koppula, H.S.; Soh, S.; Raghavan, B.; Singh, A.; Saxena, A. Brain4Cars: Car That Knows Before You Do via Sensory-Fusion Deep Learning Architecture. arXiv 2016, arXiv:1601.00740. [Google Scholar]
- Sharma, P.; Sood, N. Application of IoT and Machine Learning for Real-Time Driver Monitoring and Assisting Device. In Proceedings of the 2020 11th International Conference on Computing, Communication and Networking Technologies (ICCCNT), Kharagpur, India, 1–3 July 2020; pp. 1–7. [Google Scholar]
- Chang, R.C.-H.; Wang, C.-Y.; Li, H.-H.; Chiu, C.-D. Drunk Driving Detection Using Two-Stage Deep Neural Network. IEEE Access 2021, 9, 116564–116571. [Google Scholar] [CrossRef]
- Köpüklü, O.; Zheng, J.; Xu, H.; Rigoll, G. Driver Anomaly Detection: A Dataset and Contrastive Learning Approach. arXiv 2021, arXiv:2009.14660. [Google Scholar]
- Xiang, H.; Zhu, J.; Liang, G.; Shen, Y. Prediction of Dangerous Driving Behavior Based on Vehicle Motion State and Passenger Feeling Using Cloud Model and Elman Neural Network. Front. Neurorobot. 2021, 15, 641007. [Google Scholar] [CrossRef] [PubMed]
- Chan, F.-H.; Chen, Y.-T.; Xiang, Y.; Sun, M. Anticipating Accidents in Dashcam Videos. In Proceedings of the 13th Asian Conference on Computer Vision, Taipei, Taiwan, 20–24 November 2016; Lai, S.-H., Lepetit, V., Nishino, K., Sato, Y., Eds.; Lecture Notes in Computer Science. Springer International Publishing: Cham, Switzerland, 2017; Volume 10114, pp. 136–153, ISBN 978-3-319-54189-1. [Google Scholar]
- Li, P. A Deep Learning Approach for Real-Time Crash Risk Prediction at Urban Arterials. Master’s Thesis, University of Central Florida, Orlando, FL, USA, 2020. [Google Scholar]
- Suzuki, T.; Kataoka, H.; Aoki, Y.; Satoh, Y. Anticipating Traffic Accidents with Adaptive Loss and Large-Scale Incident DB. In Proceedings of the 2018 IEEE/CVF Conference on Computer Vision and Pattern Recognition, Salt Lake City, UT, USA, 18–23 June 2018; pp. 3521–3529. [Google Scholar]
- Choi, J.G.; Kong, C.W.; Kim, G.; Lim, S. Car Crash Detection Using Ensemble Deep Learning and Multimodal Data from Dashboard Cameras. Expert Syst. Appl. 2021, 183, 115400. [Google Scholar] [CrossRef]
- Shi, L.; Qian, C.; Guo, F. Real-Time Driving Risk Assessment Using Deep Learning with XGBoost. Accid. Anal. Prev. 2022, 178, 106836. [Google Scholar] [CrossRef] [PubMed]
- Karim, M.M.; Li, Y.; Qin, R.; Yin, Z. A System of Vision Sensor Based Deep Neural Networks for Complex Driving Scene Analysis in Support of Crash Risk Assessment and Prevention. arXiv 2021, arXiv:2106.10319. [Google Scholar]
- Li, Y.; Karim, M.M.; Qin, R.; Sun, Z.; Wang, Z.; Yin, Z. Crash Report Data Analysis for Creating Scenario-Wise, Spatio-Temporal Attention Guidance to Support Computer Vision-Based Perception of Fatal Crash Risks. Accid. Anal. Prev. 2021, 151, 105962. [Google Scholar] [CrossRef] [PubMed]
- Li, Z.-N.; Huang, X.-H.; Mu, T.; Wang, J. Attention-Based Lane Change and Crash Risk Prediction Model in Highways. IEEE Trans. Intell. Transp. Syst. 2022, 23, 22909–22922. [Google Scholar] [CrossRef]
- Yao, H.; Li, Q.; Leng, J. Physics-Informed Multi-Step Real-Time Conflict-Based Vehicle Safety Prediction. Accid. Anal. Prev. 2023, 182, 106965. [Google Scholar] [CrossRef] [PubMed]
- Schoonbeek, T.J.; Piva, F.J.; Abdolhay, H.R.; Dubbelman, G. Learning to Predict Collision Risk from Simulated Video Data. In Proceedings of the 2022 IEEE Intelligent Vehicles Symposium (IV), Aachen, Germany, 5–9 June 2022; pp. 943–951. [Google Scholar]
- Zheng, L.; Zhang, Y.; Ding, T.; Meng, F.; Li, Y.; Cao, S. Classification of Driver Distraction Risk Levels: Based on Driver’s Gaze and Secondary Driving Tasks. Mathematics 2022, 10, 4806. [Google Scholar] [CrossRef]
- Zhang, Y.; Chen, Y.; Gu, X.; Sze, N.N.; Huang, J. A Proactive Crash Risk Prediction Framework for Lane-Changing Behavior Incorporating Individual Driving Styles. Accid. Anal. Prev. 2023, 188, 107072. [Google Scholar] [CrossRef]
- Loo, B.P.Y.; Fan, Z.; Lian, T.; Zhang, F. Using Computer Vision and Machine Learning to Identify Bus Safety Risk Factors. Accid. Anal. Prev. 2023, 185, 107017. [Google Scholar] [CrossRef] [PubMed]
- Venkateswaran, N.; Hans, W.J.; Padmapriya, N. Deep Learning Based Robust Forward Collision Warning System with Range Prediction. Multimed. Tools Appl. 2021, 80, 20849–20867. [Google Scholar] [CrossRef]
- Wei, P.; Cagle, L.; Reza, T.; Ball, J.; Gafford, J. LiDAR and Camera Detection Fusion in a Real Time Industrial Multi-Sensor Collision Avoidance System. Electronics 2018, 7, 84. [Google Scholar] [CrossRef]
- Rill, R.-A.; Faragó, K.B. Collision Avoidance Using Deep Learning-Based Monocular Vision. SN Comput. Sci. 2021, 2, 375. [Google Scholar] [CrossRef]
- Gómez-Huélamo, C.; Egido, J.D.; Bergasa, L.M.; Barea, R.; López-Guillén, E.; Araluce, J.; Antunes, M. 360° Real-time and Power-efficient 3D DAMOT for Autonomous Driving Applications. Multimed. Tools Appl. 2022, 81, 26915–26940. [Google Scholar] [CrossRef]
- Sharma, S.U.; Shah, D.J. A Practical Animal Detection and Collision Avoidance System Using Computer Vision Technique. IEEE Access 2017, 5, 347–358. [Google Scholar] [CrossRef]
- Gupta, S.; Chand, D.; Kavati, I. Computer Vision Based Animal Collision Avoidance Framework for Autonomous Vehicles. In Proceedings of the 5th International Conference on Computer Vision & Image Processing (CVIP2020), Prayagraj, India, 4–6 December 2020. [Google Scholar]
- Saxena, A.; Gupta, D.K.; Singh, S. An Animal Detection and Collision Avoidance System Using Deep Learning. In Advances in Communication and Computational Technology; Hura, G.S., Singh, A.K., Siong Hoe, L., Eds.; Lecture Notes in Electrical Engineering; Springer Nature Singapore: Singapore, 2021; Volume 668, pp. 1069–1084. ISBN 9789811553400. [Google Scholar]
- Mowen, D.; Munian, Y.; Alamaniotis, M. Improving Road Safety during Nocturnal Hours by Characterizing Animal Poses Utilizing CNN-Based Analysis of Thermal Images. Sustainability 2022, 14, 12133. [Google Scholar] [CrossRef]
- Alghamdi, S.; Algethami, A.; Tan, T. Vehicle-Camel Collisions in Saudi Arabia: Application of Single and Multi-Stage Deep Learning Object Detectors. Ain Shams Eng. J. 2023, 15, 102328. [Google Scholar] [CrossRef]
- Zhao, W.; Gong, S.; Zhao, D.; Liu, F.; Sze, N.N.; Huang, H. Effects of Collision Warning Characteristics on Driving Behaviors and Safety in Connected Vehicle Environments. Accid. Anal. Prev. 2023, 186, 107053. [Google Scholar] [CrossRef]
- Masello, L.; Sheehan, B.; Castignani, G.; Shannon, D.; Murphy, F. On the Impact of Advanced Driver Assistance Systems on Driving Distraction and Risky Behaviour: An Empirical Analysis of Irish Commercial Drivers. Accid. Anal. Prev. 2023, 183, 106969. [Google Scholar] [CrossRef]
- Samsara. Build a World Class Safety Program. Available online: https://www.samsara.com/products/safety/ (accessed on 14 July 2023).
- Lytx. Fleet Safety Program Powered by Video. Available online: https://www.lytx.com/fleet-safety (accessed on 14 July 2023).
- Solera. Video-Based Safety: An Overview. Available online: https://www.omnitracs.com/technology/video-based-safety (accessed on 14 July 2023).
- Nauto. Safer Fleets and Safer Roads for All. Available online: https://www.nauto.com/ (accessed on 14 July 2023).
- Tian, R.; Ruan, K.; Li, L.; Le, J.; Greenberg, J.; Barbat, S. Standardized Evaluation of Camera-Based Driver State Monitoring Systems. IEEE/CAA J. Autom. Sin. 2019, 6, 716–732. [Google Scholar] [CrossRef]
- Cambridge Mobile Telematics. The DriveWell® Platform. Available online: https://www.cmtelematics.com/safe-driving-technology/how-it-works/ (accessed on 14 July 2023).
- Geotab. One Platform for Optimal Fleet Performance. Available online: https://www.geotab.com/ (accessed on 14 July 2023).
- Orion. Multiple Technology Options Enable Customer Tailored Deployments. Available online: https://orionfi.com/technology/ (accessed on 14 July 2023).
- Trimble. Transportation Technology that Connects the Supply Chain. Available online: https://www.trimble.com/en/solutions/industries/transportation (accessed on 14 July 2023).
- Azuga. Fleet Dash Cameras Dual Facing with GPS For Driver Safety. Available online: https://www.azuga.com/dashcam (accessed on 14 July 2023).
- Zenduit. ZenduCAM 360—Multi Camera Solution. Available online: https://zenduit.com/products/zenducam-360-multi-camera-solution/ (accessed on 14 July 2023).
- Keller, J.J. Dash Cam Solutions to Protect Your Fleet. Available online: https://www.jjkeller.com/Category/shop-dash-cameras (accessed on 14 July 2023).
- BlueArrow. In-Vehicle Cameras. Available online: https://bluearrowtelematics.com/in-vehicle-cameras/ (accessed on 14 July 2023).
- FleetComplete. Driver Safety & Driver Coaching with Telematics. Available online: https://www.fleetcomplete.com/fleet-management-solutions/fleet-driver-cargo-safety/ (accessed on 14 July 2023).


| Paper | Neural Network Type | Camera | Dataset Size | Input Data | Features | Camera Resolution | Training Image Resolution | Accuracy | No of Gaze Zones |
|---|---|---|---|---|---|---|---|---|---|
| Choi et al. [36] | CNN | RGB | 35,900 | Color image | Detected face image | 256 × 256 | 227 × 227 | 95% | 9 |
| Fridman et al. [31] | Random Forest | Grayscale | 1,860,761 | Grayscale image | Facial landmarks | 800 × 600 | N.A. | 91.4% | 6 |
| Naqvi et al. [37] | CNN | NIR | 19,566 and 19,542 | Grayscale image | 68 face landmarks and ROI of face, left, and right eye | 1600 × 1200 | 224 × 224 | 92.8% (SCER) and 99.6% (LCER) | 17 |
| Vora et al. [38] | SqueezeNet | RGB | 47,515 | Color image | Upper half of the face image | 2704 × 1524 | 227 × 227 | 95.18% | 7 |
| Wang et al. [34] | Neighbor selection and PLSR | RGB and infrared | 50,000 | Color and depth image | Head pose and gaze angle | 640 × 480 | 320 × 240 | 7.5682 in Mean Absolute Error | 9 |
| Shan et al. [35] | Random Forest | N.A. | 90,791 | Color image | Facial landmarks for head and eye features | N.A. | N.A. | 94.12% | 10 |
| Stappen et al. [40] | InceptionResNetV2 | RGB | 50,000 | Color image | Face + cabin image or facial + Go-CaRD feature | N.A. | 150 × 150 | 71.62% | 9 |
| Rangesh et al. [39] | GPCycleGAN and SqueezeNet | Intel RealSense IR camera | 336,177 | Grayscale image | Landmarks and cropped eye image | 640 × 480 | 256 × 256 | 80.49% | 7 |
| Ledezma et al. [32] | Emgu CV library | RGB and infrared | 27,000 | Color image | Eye ROI and pupil center coordinate | N.A. | N.A. | 81.84% | 5 |
| Shah et al. [27] | YOLO-V4 and InceptionResNet-v2 | RGB | 135,409 | Color image | Face image | N.A. | 299 × 299 | 92.71% | 10 |
| Kasahara et al. [41] | Self-supervision | RGB-D and Kinect Azure cameras | 123,297 | Color image | Face image + roadway scene image | N.A. | N.A. | 6.2 in Mean Absolute Error | N.A. |
| Paper | Application | Neural Network Type | Device | Feature | Data | No. of Classes | Results |
|---|---|---|---|---|---|---|---|
| Vural et al. [51] | Drowsiness detection | Adaboost classifier and MLR | DV camera | Facial actions and head motion | 44,640 samples | 2 | 92% accuracy for Adaboost classifier and 94% accuracy for MLR |
| Reddy et al. [53] | Compressed CNN | Logitech C920 HD Pro Webcam | Image of left eye and mouth | 70,000 images | 3 | 89.5% accuracy | |
| Revelo et al. [54] | Landmarks and MLP neural network | Infrared camera | Eye landmarks or eye image | 2400 images | 2 | 84% for method 1 and 97% for method 2 | |
| Hashemi et al. [55] | CNN | HD webcam camera | Eye image | ZJU and 4185 images | 2 | 96.39% accuracy | |
| Krishna et al. [57] | YOLO-V5 and Vision Transformers | DSLR camera | Face image | UTA-RLDD and 1246 frames | 2 | 95.5% accuracy | |
| Alameen and Alhothali [59] | 3DCNN and LSTM | In-car camera and Kinect camera | Frontal and side images | YawDD and 3MDAD | 2 | >93% accuracy for YawDD and 3MDAD | |
| Lopez et al. [52] | Fatigue classification | AlexNet and SVM | Thermal camera | Face image | 5700 images | 2 | 80% accuracy |
| Zhao et al. [63] | Behavior recognition | Random Forest | CCD camera | Driver side image | SEU | 4 | 88% precision |
| Yan et al. [64] | Behavior recognition | CNN | CCD camera | Driver side image | SEU | 6 | 97.76% precision |
| Köpüklü et al. [71] | Driver anomaly detection | MobileNetV2 | Depth and infrared camera | Driver front and top images | 650 min video | 2 | 0.9673 AUC |
| Das et al. [12] | Drowsiness and distraction detection | Segmented windows and cascaded late fusion | Physiological sensors, RGB cameras, NIR camera, and thermal camera | Thermal feature vector, facial landmarks, and physiological sensors | Around 420 recordings | 2 | 84% F1-score for drowsiness and 78% F1-score for distraction |
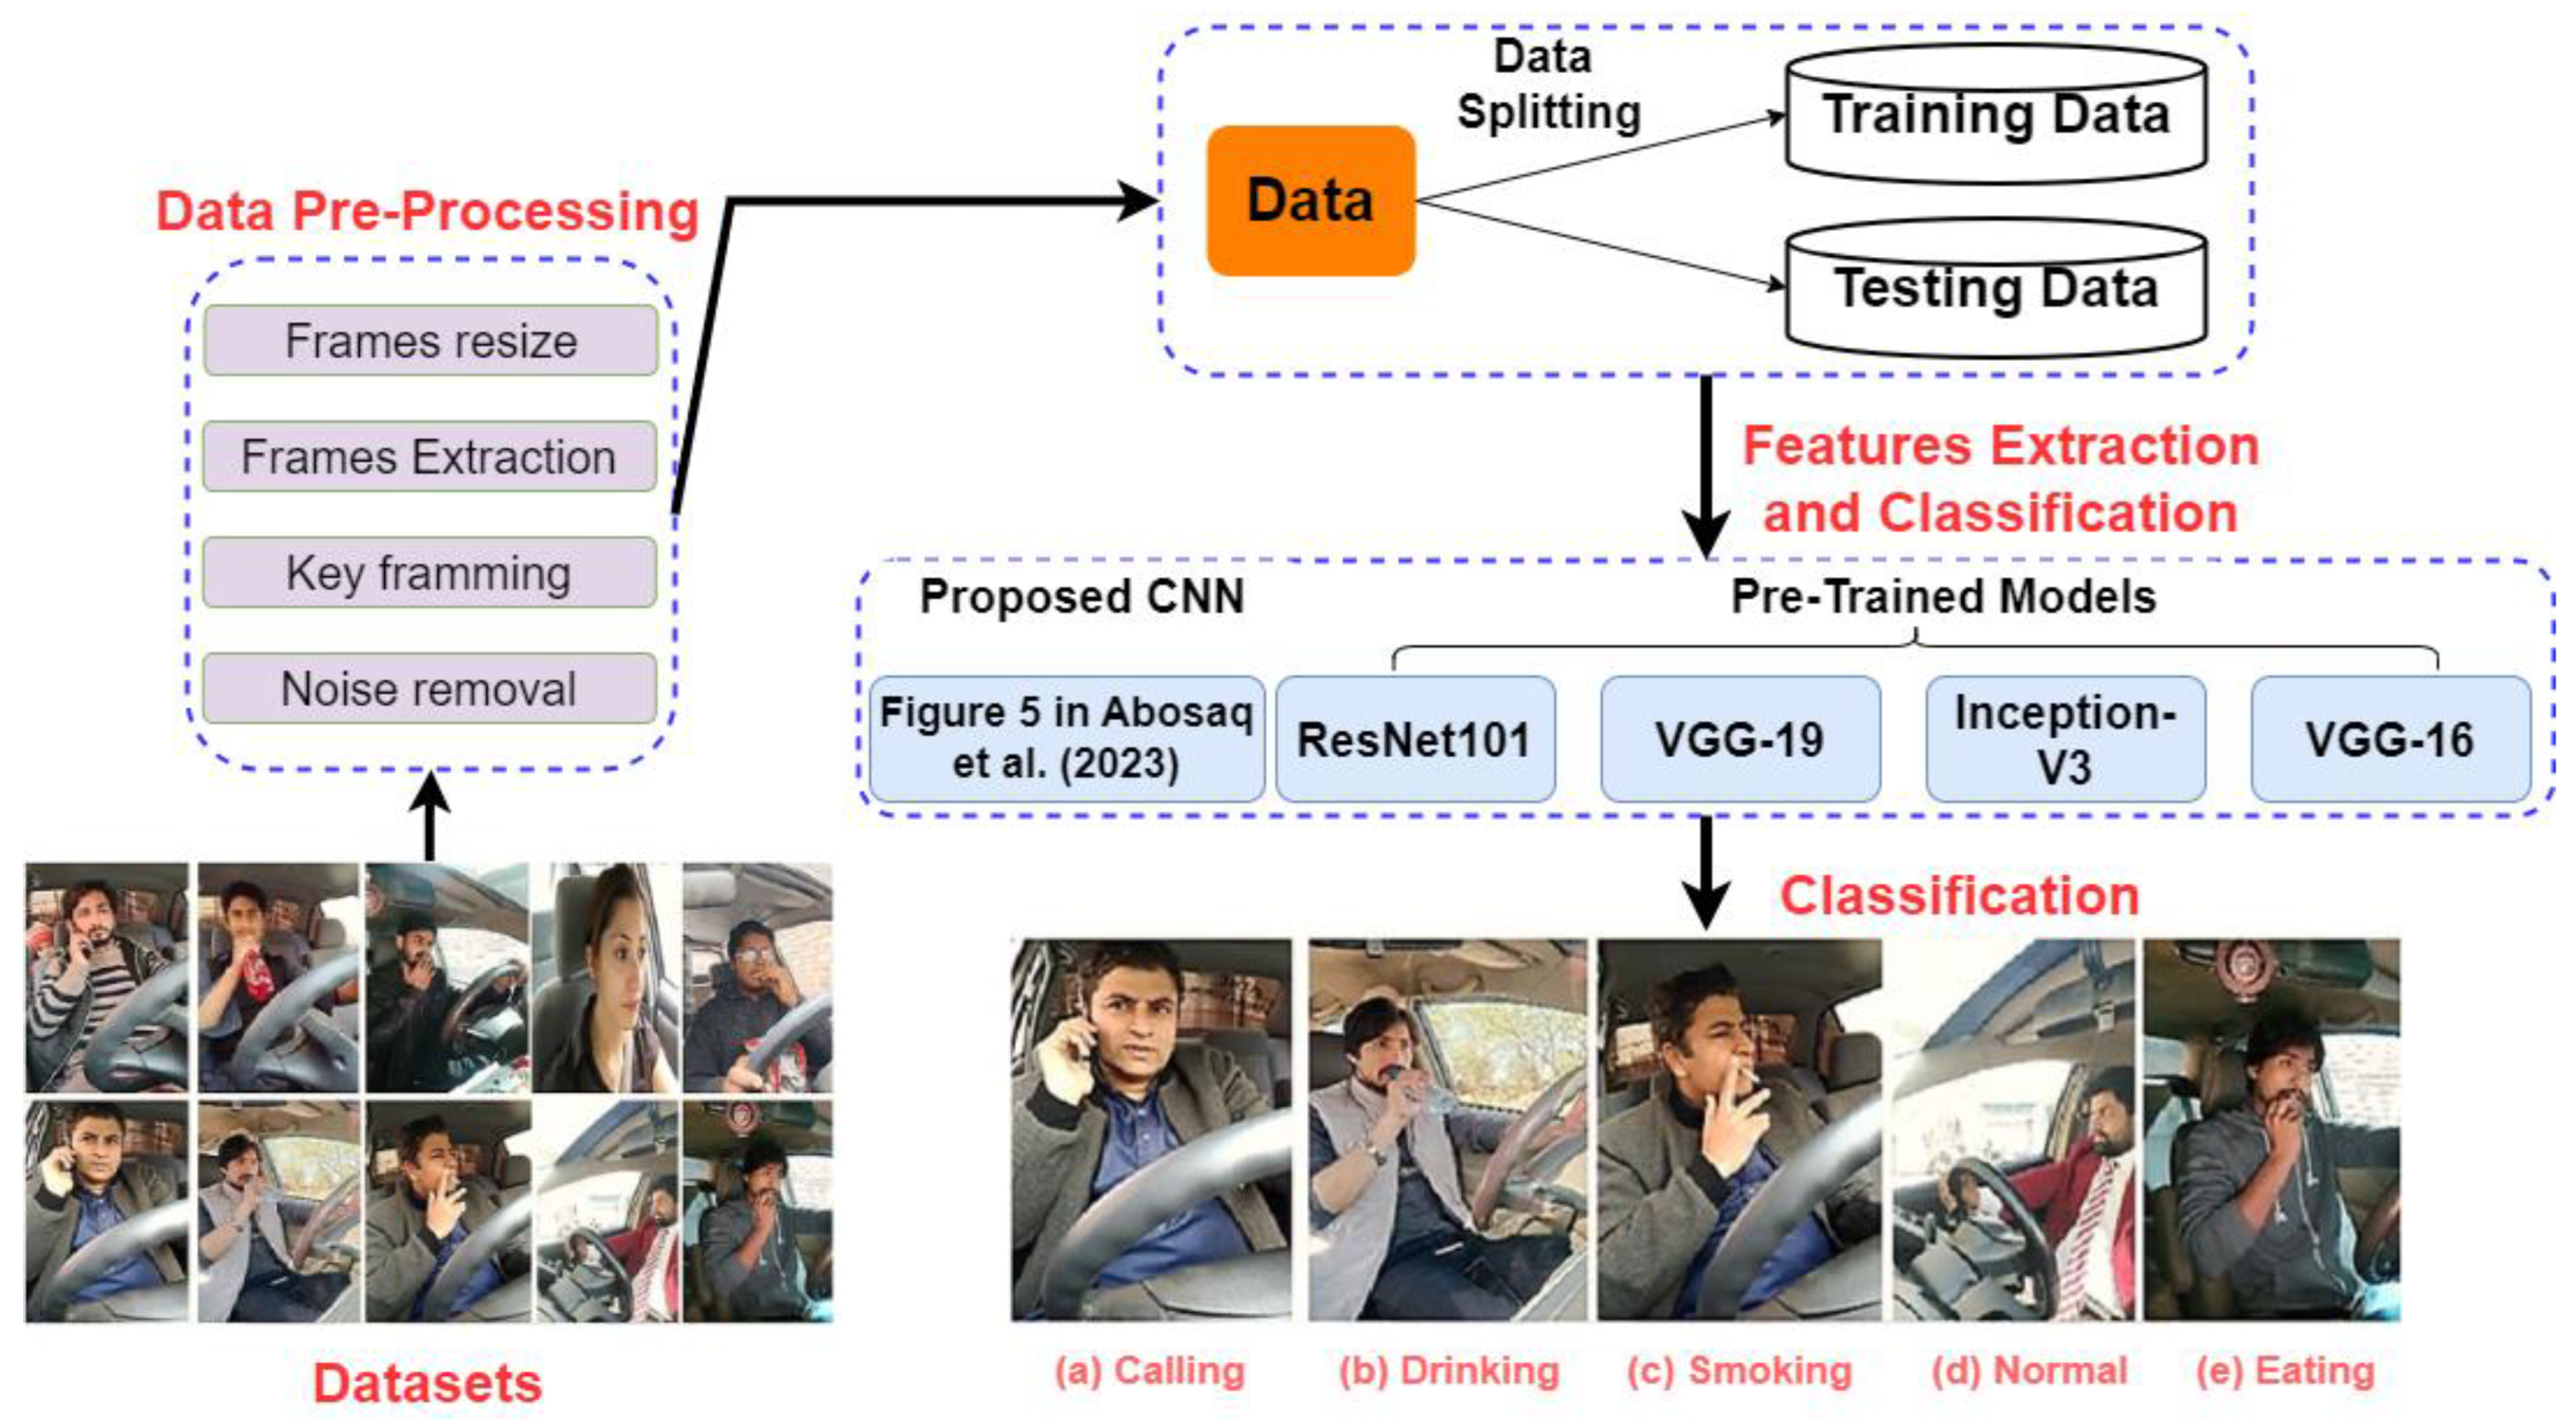
| Abosaq et al. [65] | Unusual behavior detection | CNN | DSLR camera | Driver video | 9120 frames | 5 | 95% precision |
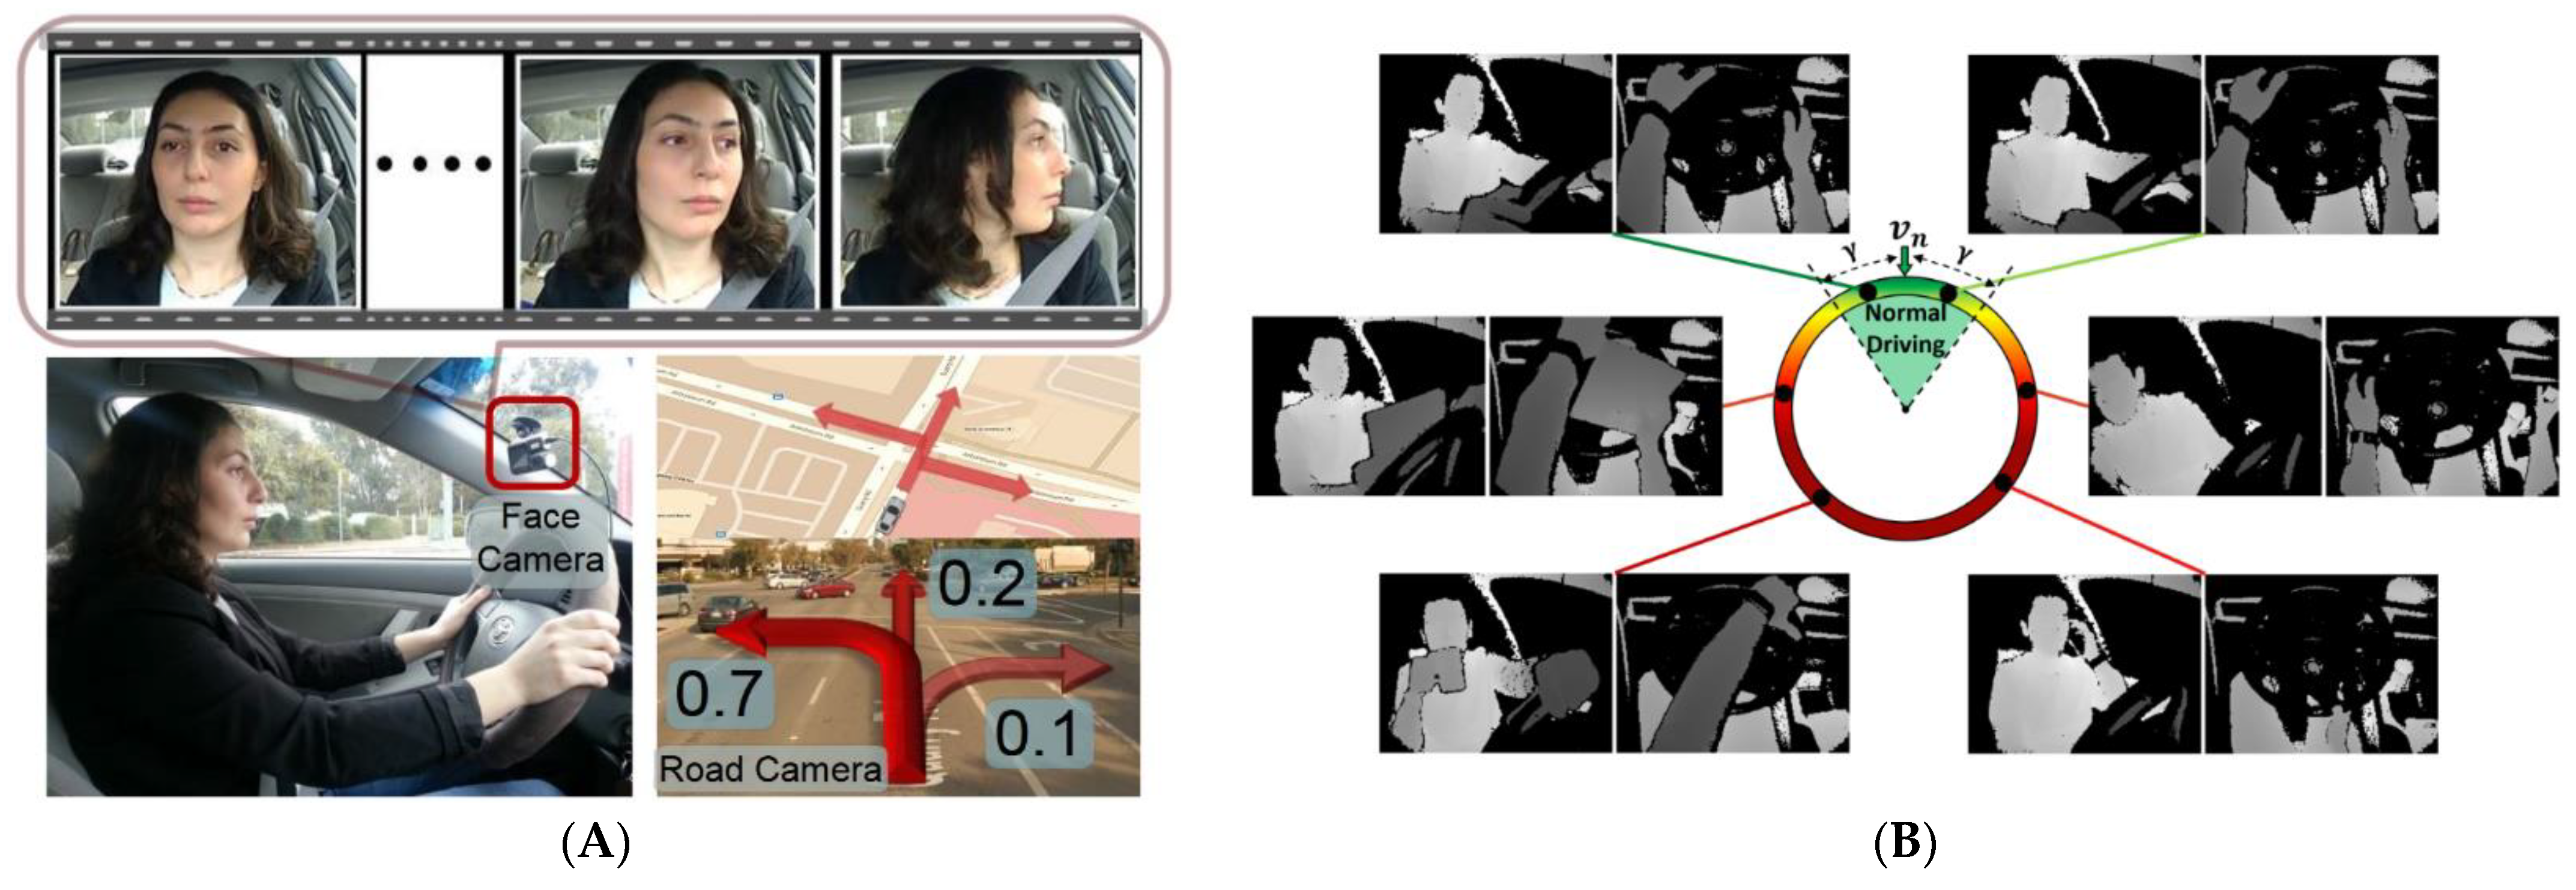
| Jain et al. [68] | Maneuver anticipation | LSTM | GPS, face camera, and road camera | Videos, vehicle dynamics, GPS, and street maps | Brain4Cars | 3 | 90.5% precision |
| Hou et al. [67] | Phone usage detection | Mobilenet-SSD | RGB camera | Driving image | 6796 images | 2 | 99% |
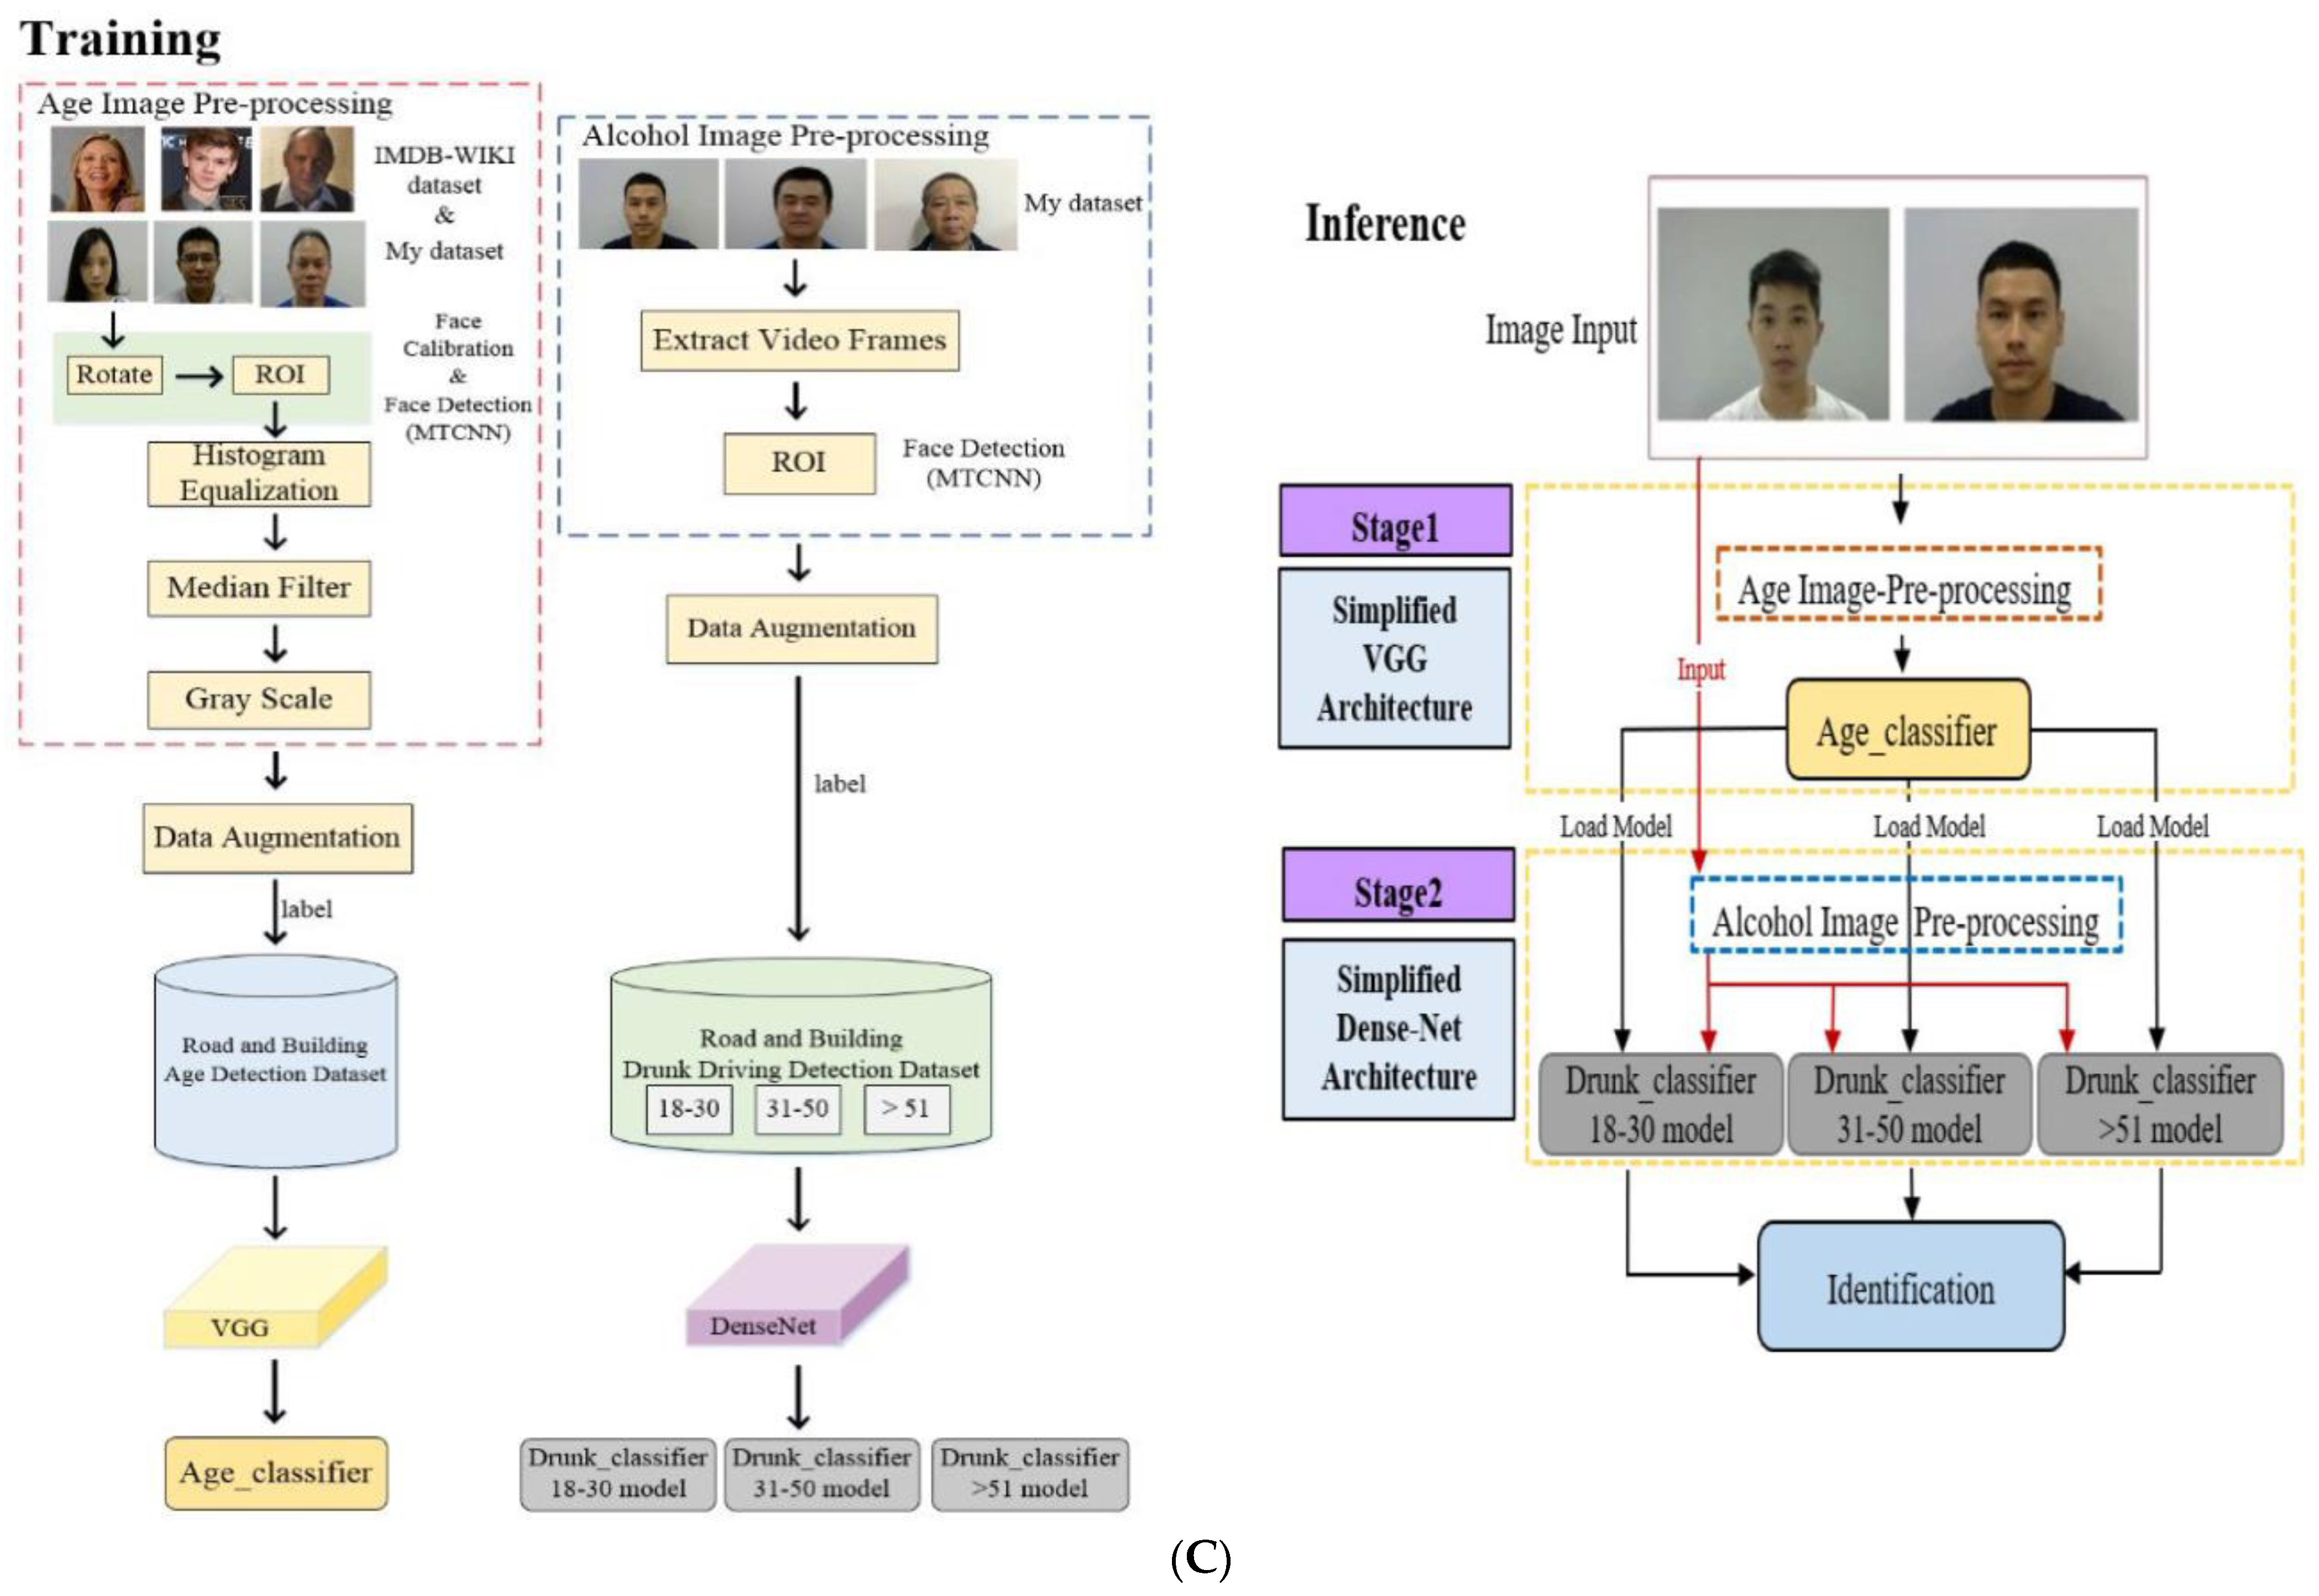
| Chang et al. [70] | Drunk driving detection | VGG and Dense-Net | Logitech C310 webcam | Facial image and breath alcohol concentration | 20,736 images | 2 | 87.44% |
| Paper | Application | Neural Network Type | Data Source | Feature | Results |
|---|---|---|---|---|---|
| Chan et al. [73] | Crash prediction | DSA-RNN | Dashcam video | Appearance and motion feature | Predict car crash 2 s earlier with 80% recall and 56.14% precision |
| Suzuki et al. [75] | AdaLEA | Dashcam video | Global and local feature | Predict car crash 2.36 s earlier with 62.1% mAP and 3.65 s ATTC | |
| Li et al. [79] | Exploratory analysis and association rule mining | Dashcam video and crash report | Temporal distribution of driving scene and fatal crash features | Attention guidance assists CV models to predict fatal crash risk | |
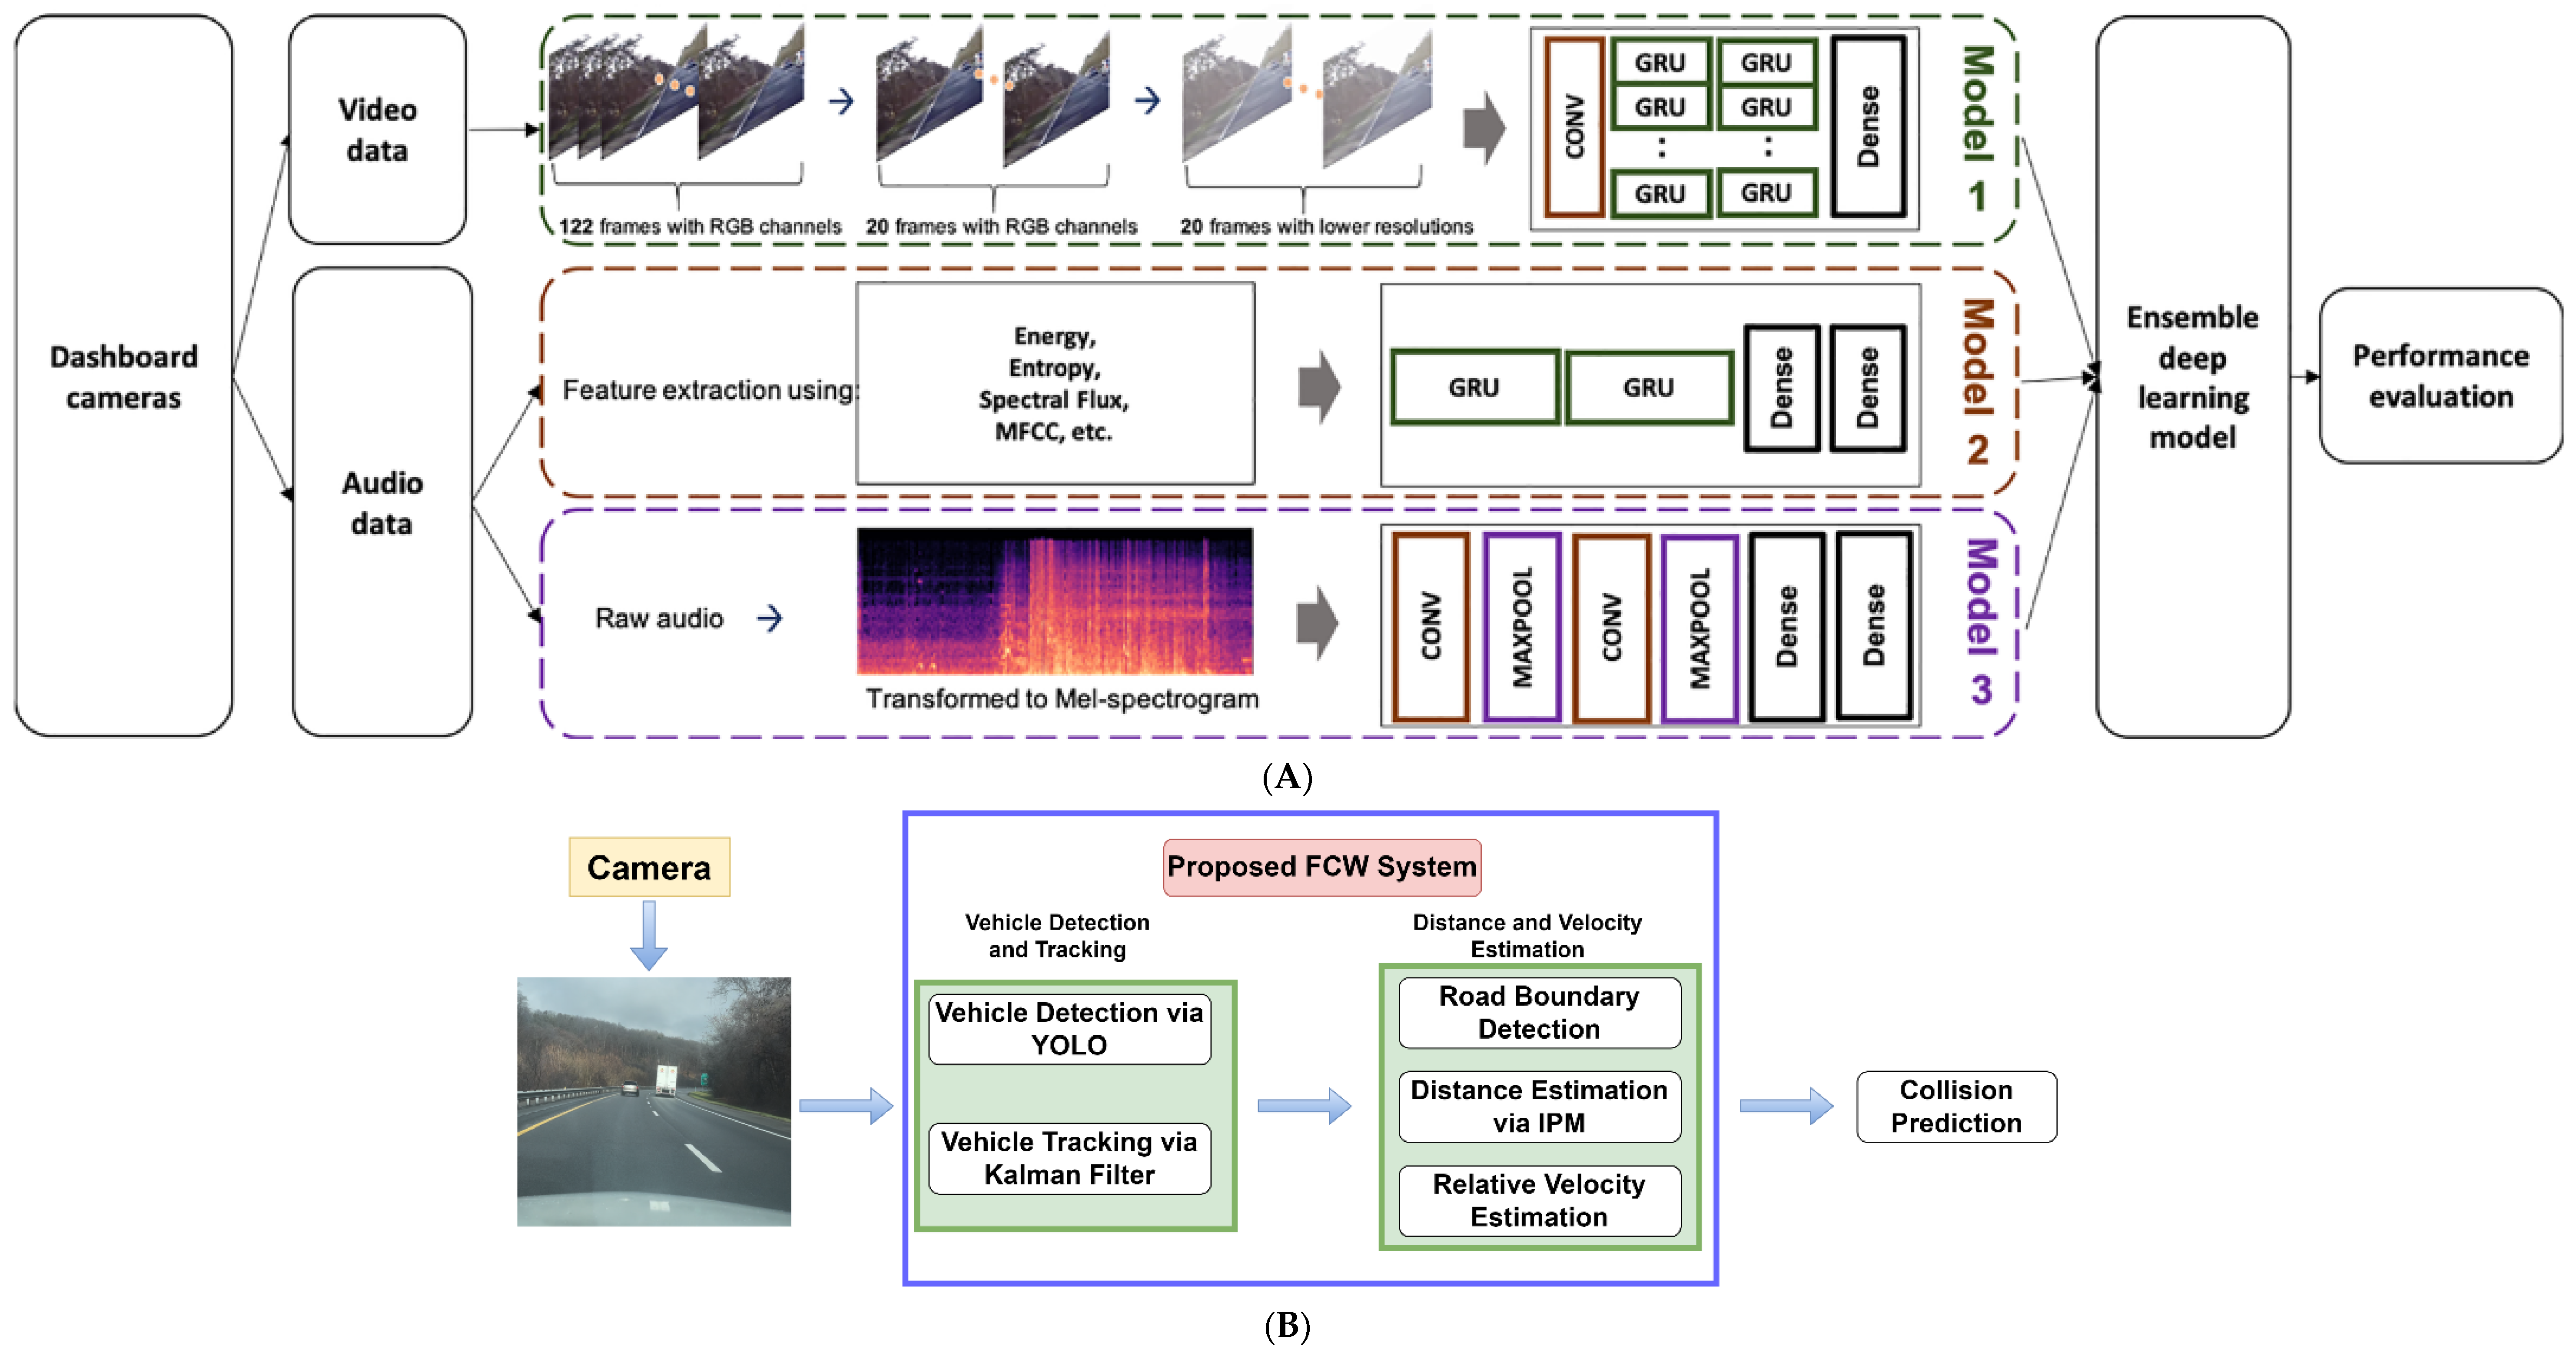
| Choi et al. [76] | Crash detection | CNN and GRU | Dashcam video and audio | Detected cars from image, audio features, and spectrogram image | Car crash detection with AUC = 98.60 for case study 1 and AUC = 89.86 for case study 2 |
| Karim et al. [78] | Crash risk analysis | Multi_Net | Dashcam video | Object detection and segmentation | Generate a likelihood of crash, road function, weather, and time of day to identify crash risk |
| Shi et al. [77] | CNN and GRU | Kinematic data | Triaxial acceleration | Classify crash, near-crash, and normal driving with 97.5% accuracy | |
| Schoonbeek et al. [82] | RiskNet | Front-facing camera | Intermediate representations of video data | Classify safe and unsafe with 91.8% accuracy | |
| Loo et al. [85] | XGBoosting and RF models | Bus dashcam video | Pedestrian tracking, jaywalking index, and sidewalk railing detection | Pedestrian exposure, jaywalking, crowding, and sidewalk railings are critical to address bus–pedestrian crashes | |
| Sharma and Shah [90] | Collision warning system | HOG and cascade classifier | Camera video | Feature extraction and distance calculation | Achieved 82.5% accuracy for animal detection under speeds of 35 km/h |
| Rill and Faragó [88] | YOLOv3 and CNN | Spherical camera and smart glasses | Vehicle detection, depth estimation, and TTC calculation | RMSE ≤ 1.24 s for TTC estimation | |
| Venkateswaran et al. [86] | YOLO and Kalman filter | Camera video | Vehicle detection and tracking, distance estimation | Precision ≥ 0.85 for vehicle detection and RMSE ≤ 9.14 for vehicle tracking | |
| Mowen et al. [93] | CNN | Thermal image | Feature maps | Achieved 82% accuracy to classify animal poses |
Disclaimer/Publisher’s Note: The statements, opinions and data contained in all publications are solely those of the individual author(s) and contributor(s) and not of MDPI and/or the editor(s). MDPI and/or the editor(s) disclaim responsibility for any injury to people or property resulting from any ideas, methods, instructions or products referred to in the content. |
© 2024 by the authors. Licensee MDPI, Basel, Switzerland. This article is an open access article distributed under the terms and conditions of the Creative Commons Attribution (CC BY) license (https://creativecommons.org/licenses/by/4.0/).
Share and Cite
Yang, G.; Ridgeway, C.; Miller, A.; Sarkar, A. Comprehensive Assessment of Artificial Intelligence Tools for Driver Monitoring and Analyzing Safety Critical Events in Vehicles. Sensors 2024, 24, 2478. https://doi.org/10.3390/s24082478
Yang G, Ridgeway C, Miller A, Sarkar A. Comprehensive Assessment of Artificial Intelligence Tools for Driver Monitoring and Analyzing Safety Critical Events in Vehicles. Sensors. 2024; 24(8):2478. https://doi.org/10.3390/s24082478
Chicago/Turabian StyleYang, Guangwei, Christie Ridgeway, Andrew Miller, and Abhijit Sarkar. 2024. "Comprehensive Assessment of Artificial Intelligence Tools for Driver Monitoring and Analyzing Safety Critical Events in Vehicles" Sensors 24, no. 8: 2478. https://doi.org/10.3390/s24082478
APA StyleYang, G., Ridgeway, C., Miller, A., & Sarkar, A. (2024). Comprehensive Assessment of Artificial Intelligence Tools for Driver Monitoring and Analyzing Safety Critical Events in Vehicles. Sensors, 24(8), 2478. https://doi.org/10.3390/s24082478