
Optimizing Lane Departure Warning System towards AI-Centered Autonomous Vehicles
 , ,
, ,
Abstract
1. Introduction
2. Materials and Methods
2.1. LDWS Functionality Tests
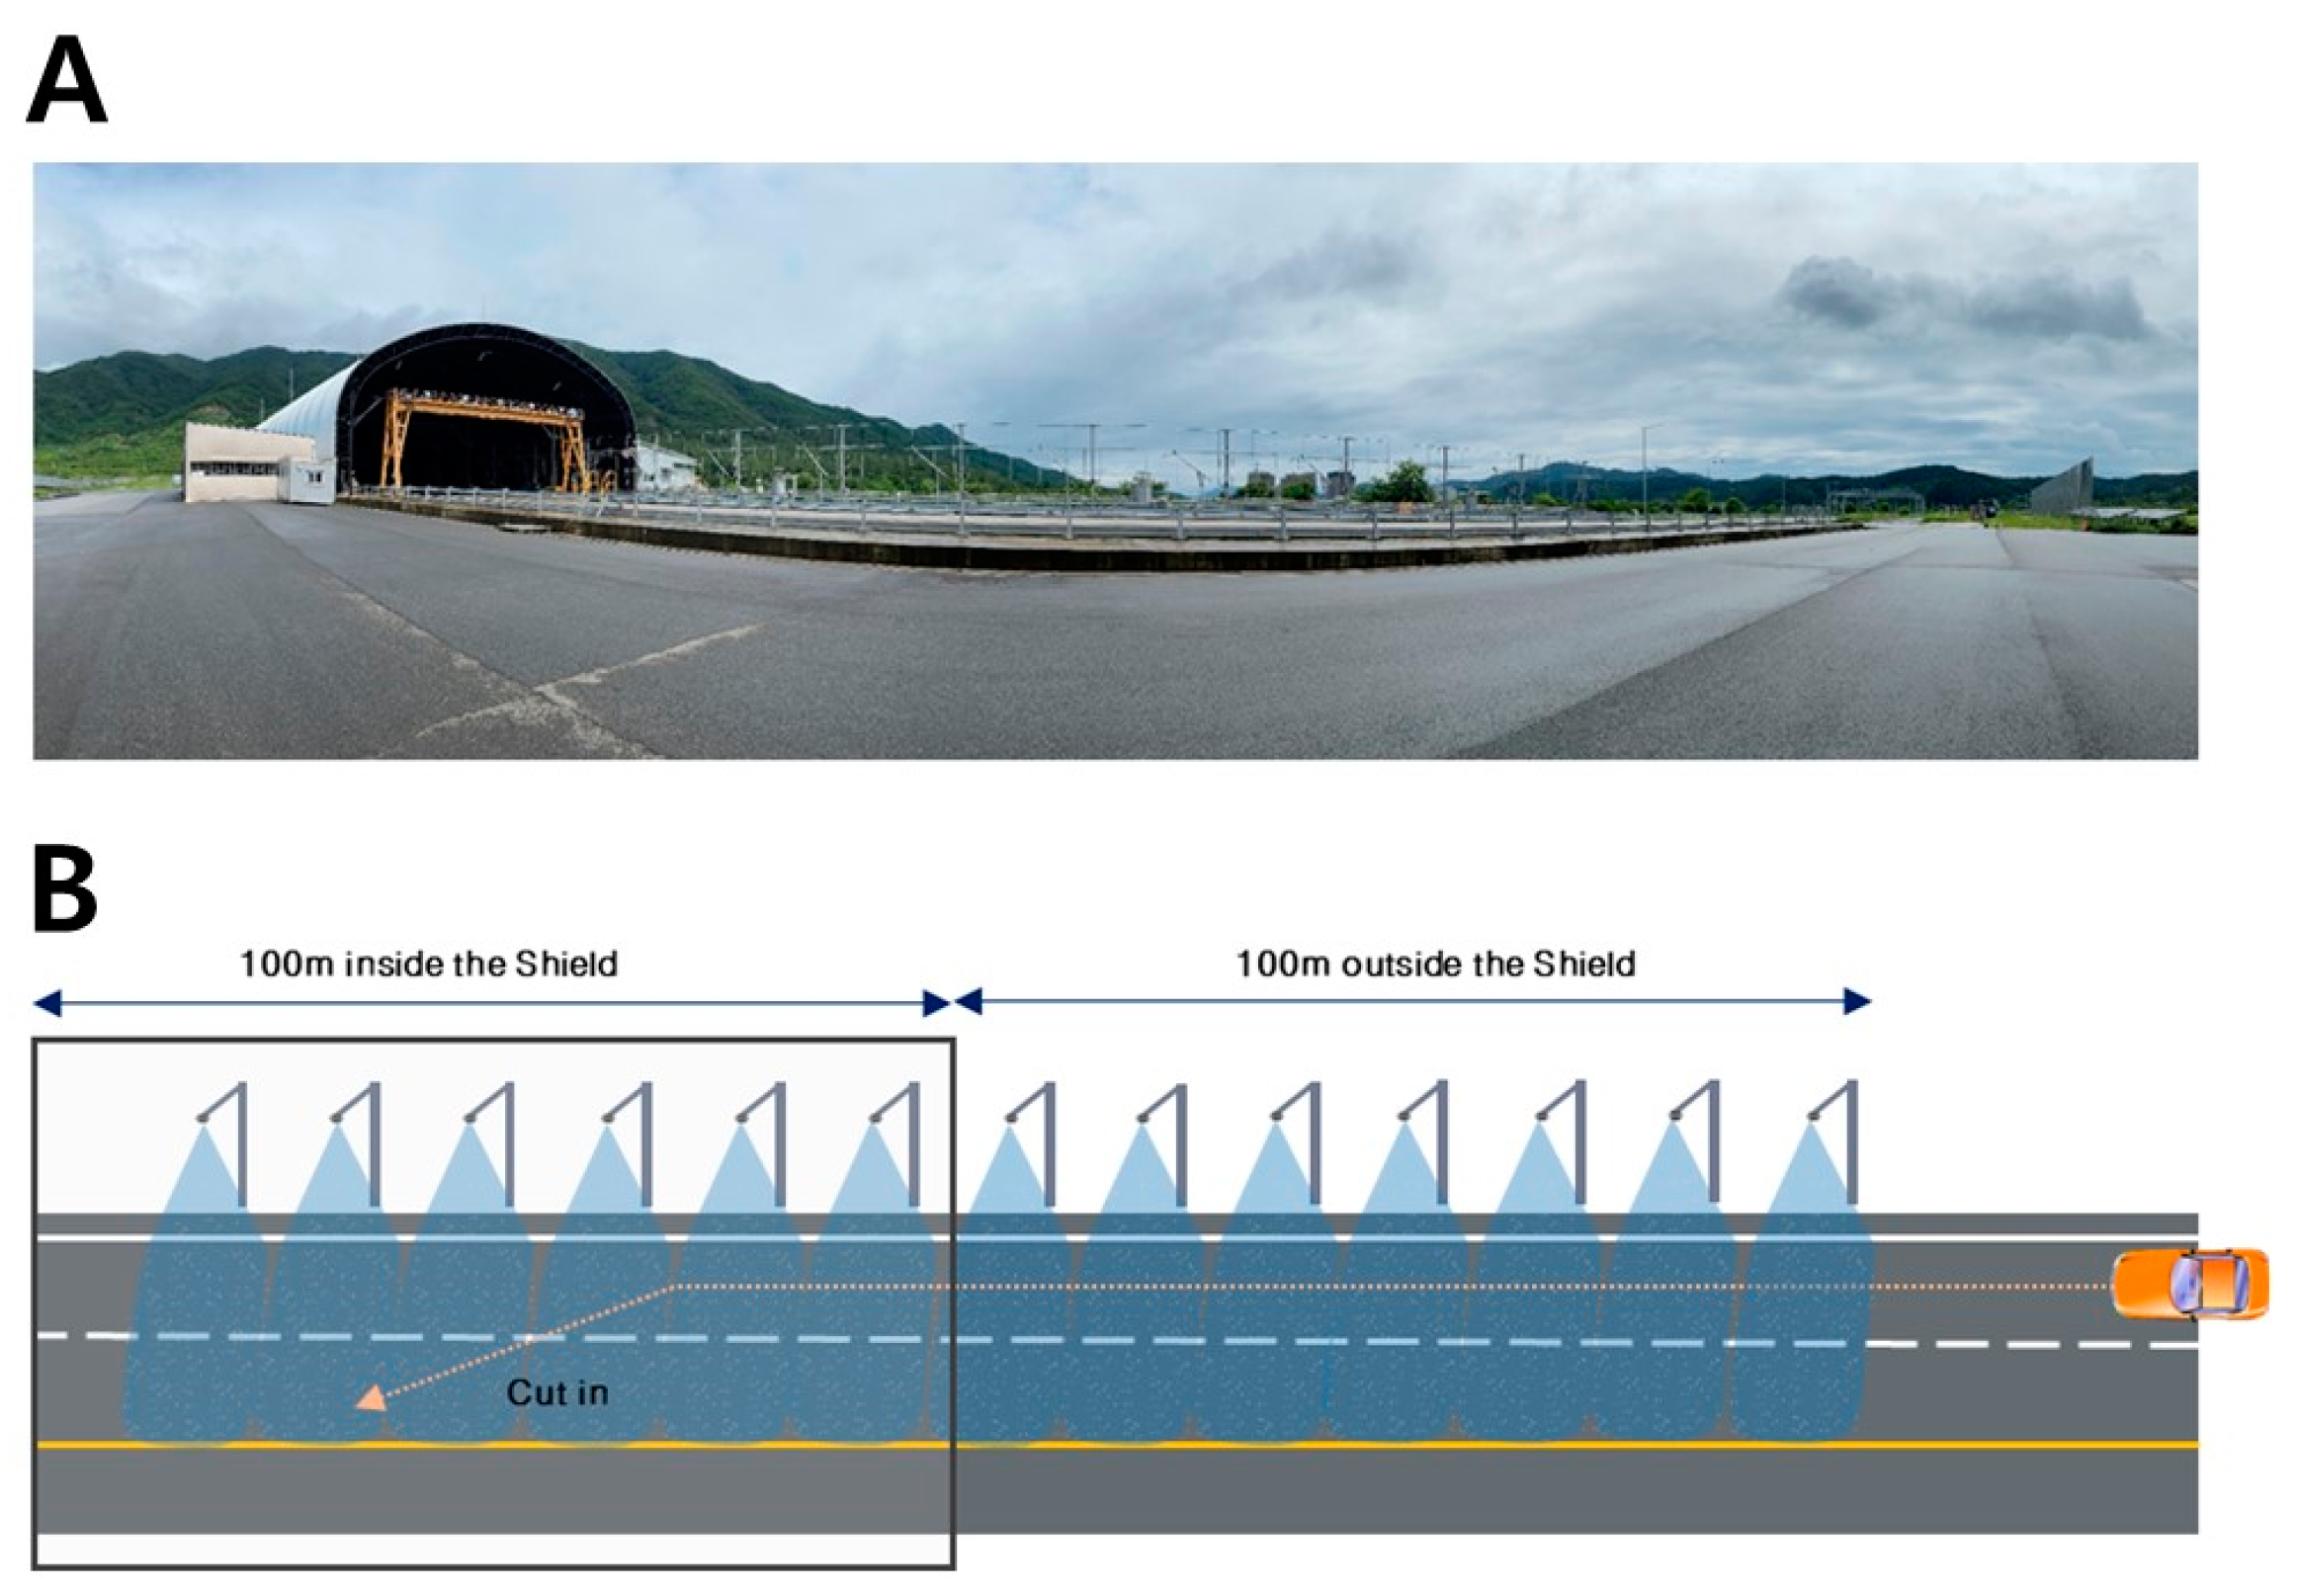
2.2. Experimental Scenarios
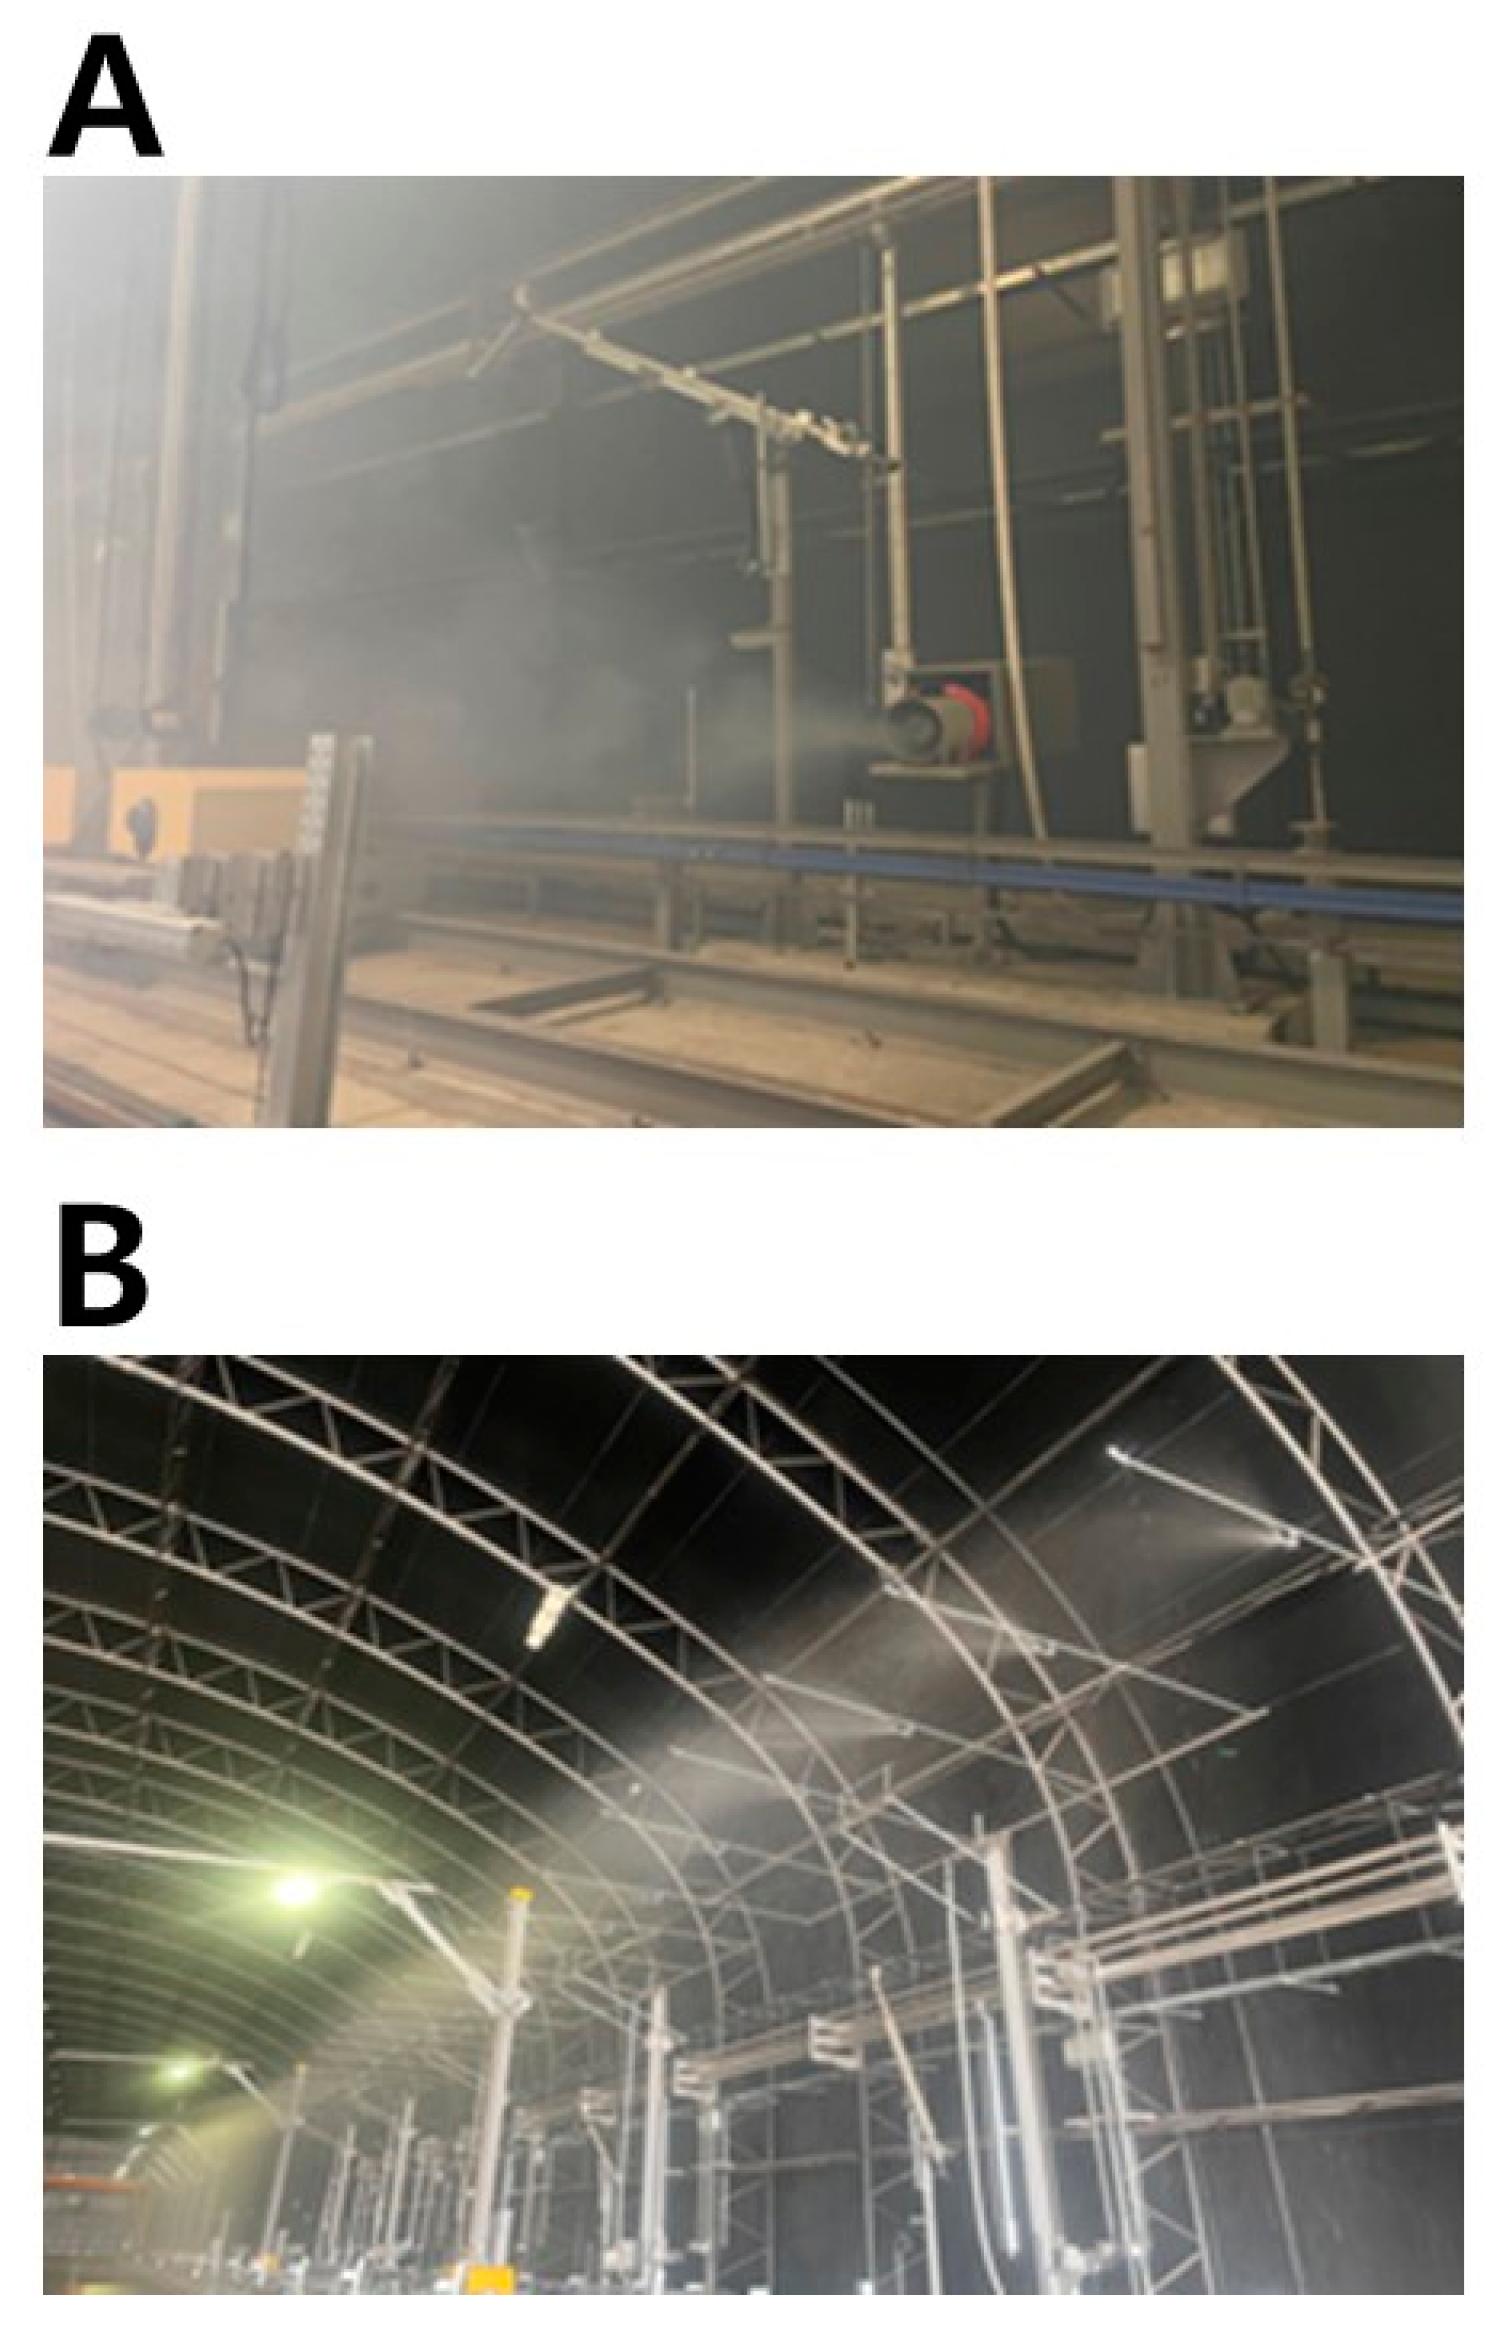
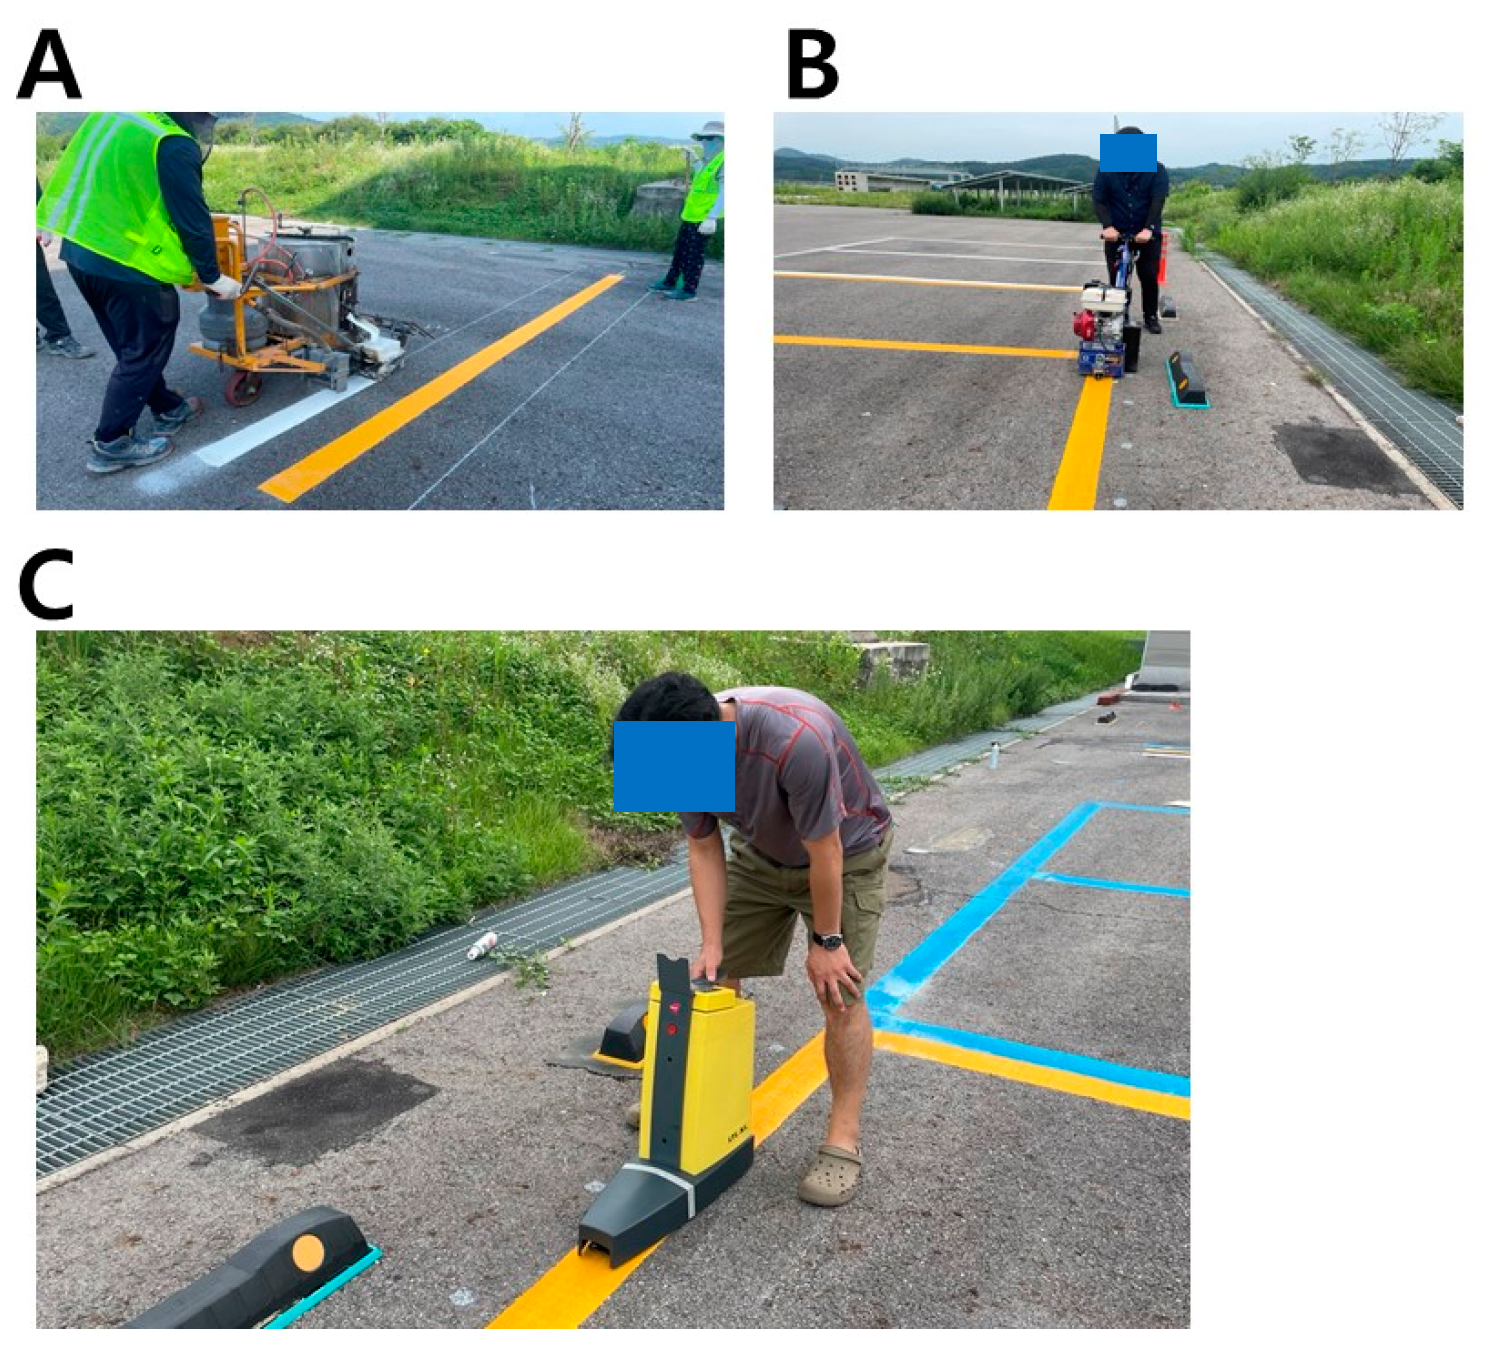
2.3. Scenario Implementation
2.4. Vehicle’s Speed and Trajectory
2.5. Preliminary Test
2.6. Experimental Procedures
2.7. Simulation Framework for Efficient Road Management
| Algorithm 1: Simulation Framework to Calculate Repainting Cost | ||||||
| Input: TR, ST, LW, C, W, D | ||||||
| Output: TotalCost | ||||||
| 1 Update of variables: assign D to Table 3 | ||||||
| 2 NewThreshold〈white, yellow, blue〉 ← predict retro-reflectivity by the fitted non-linear model based on Table 5, Table 6 and Table 7 with inputs of TR, LW | ||||||
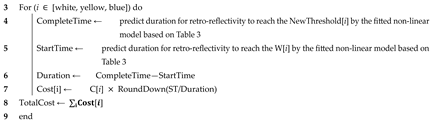 | ||||||
3. Results
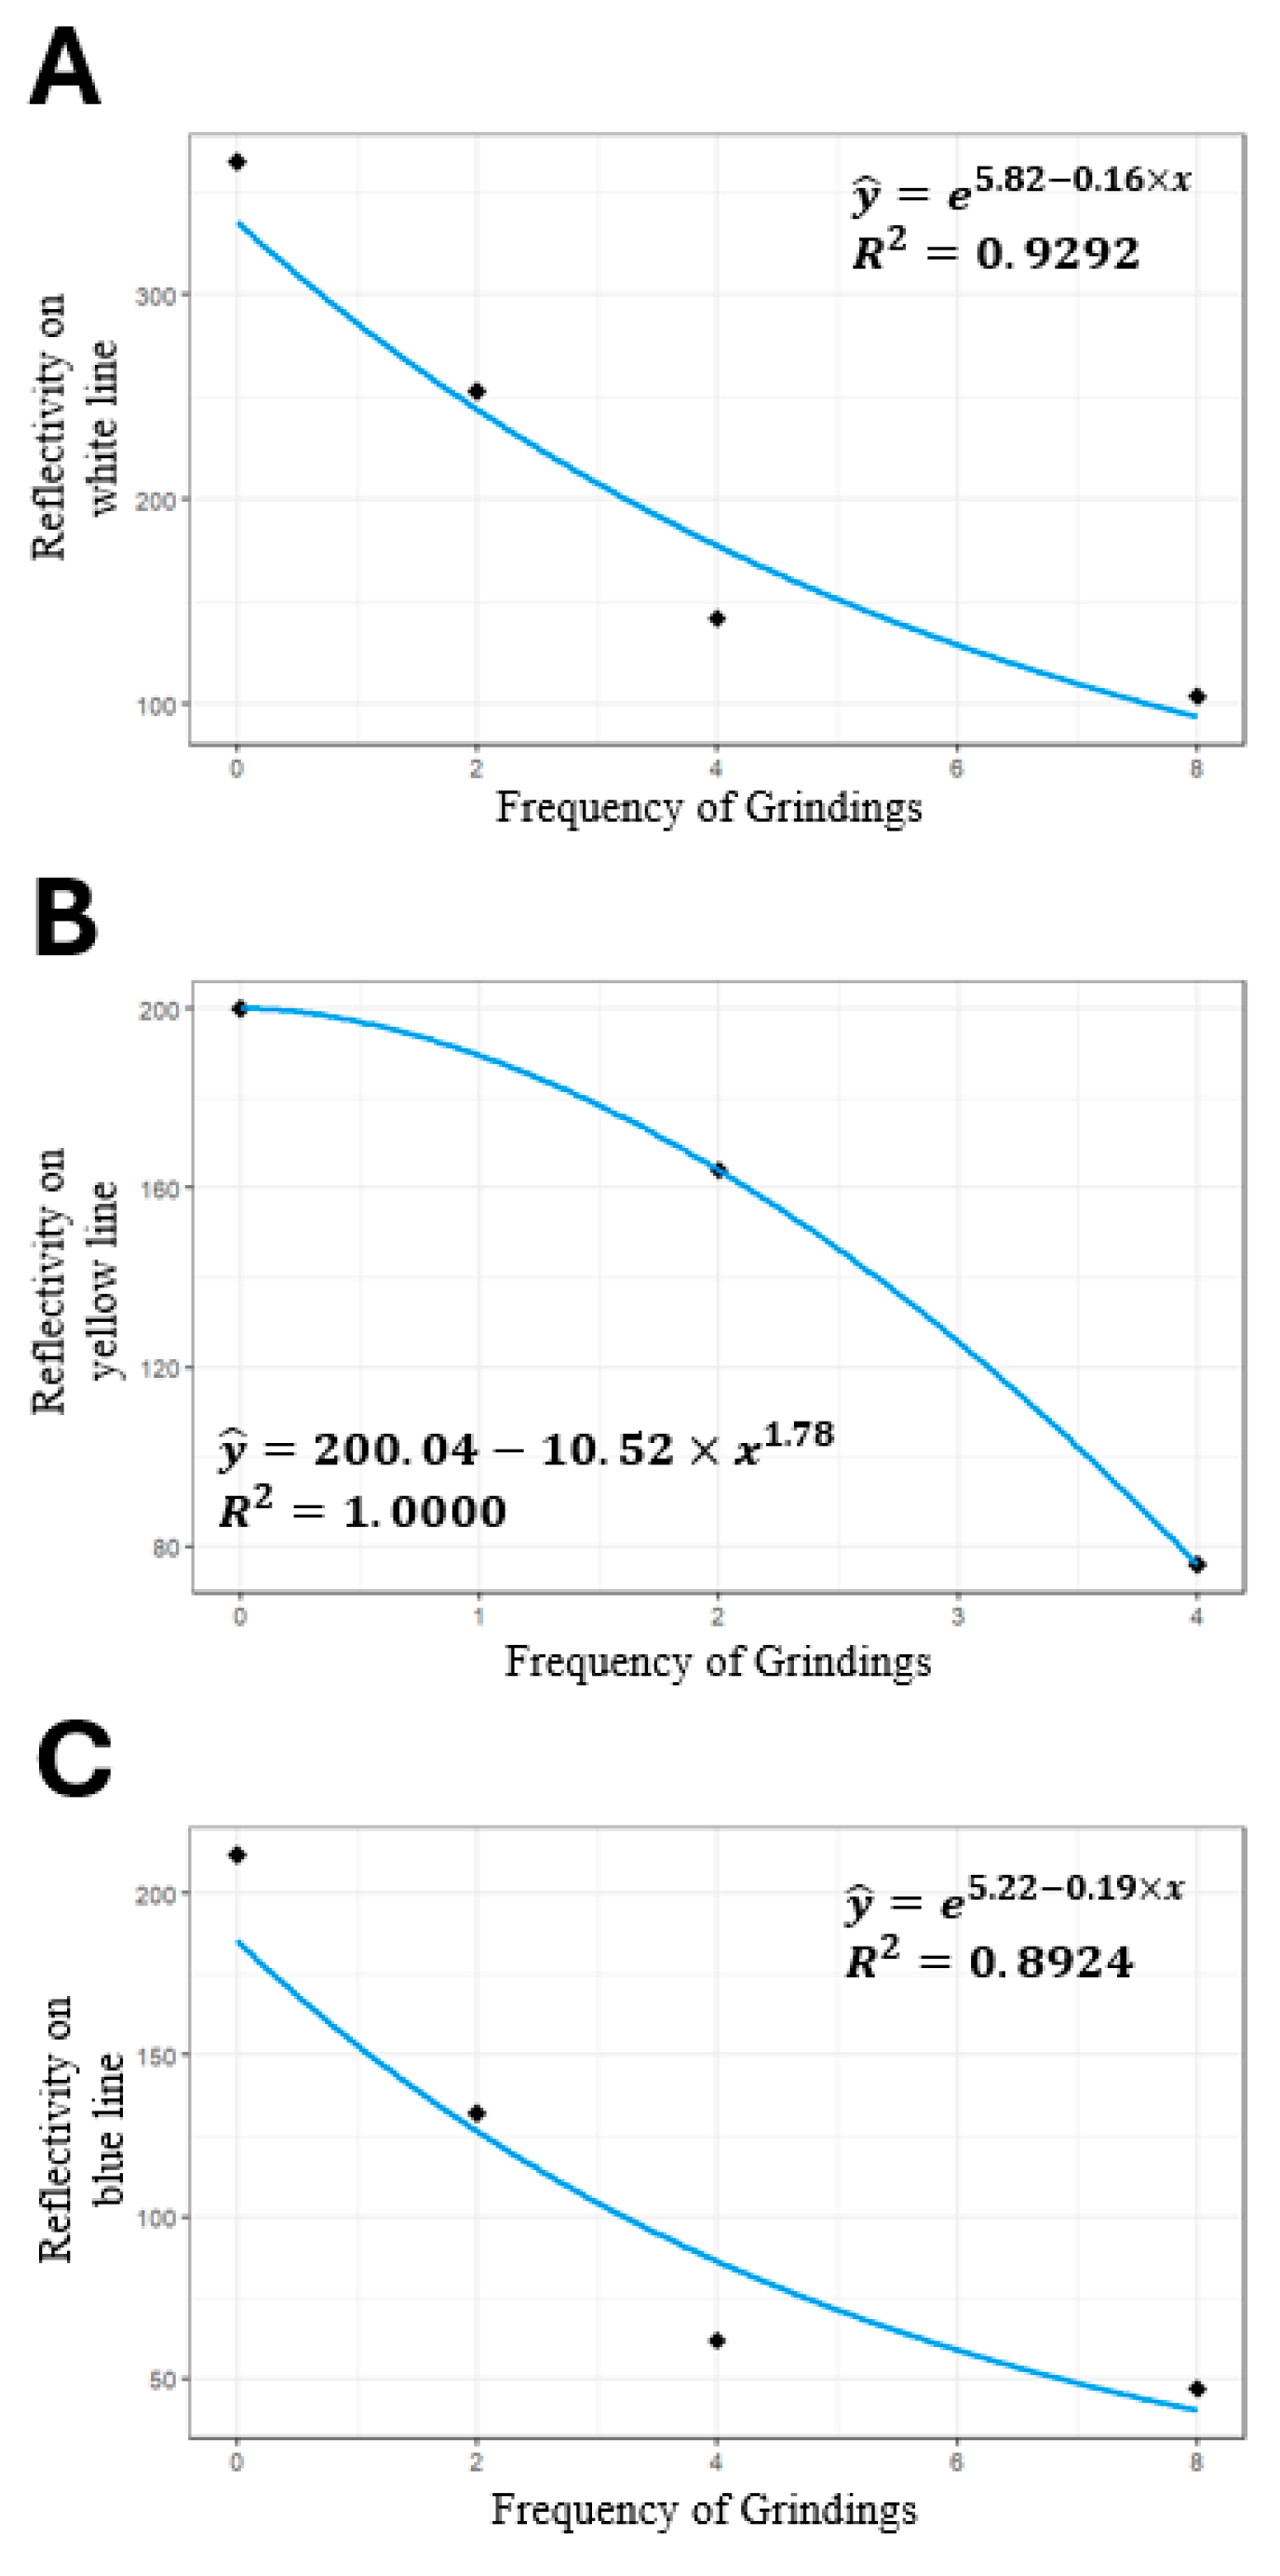
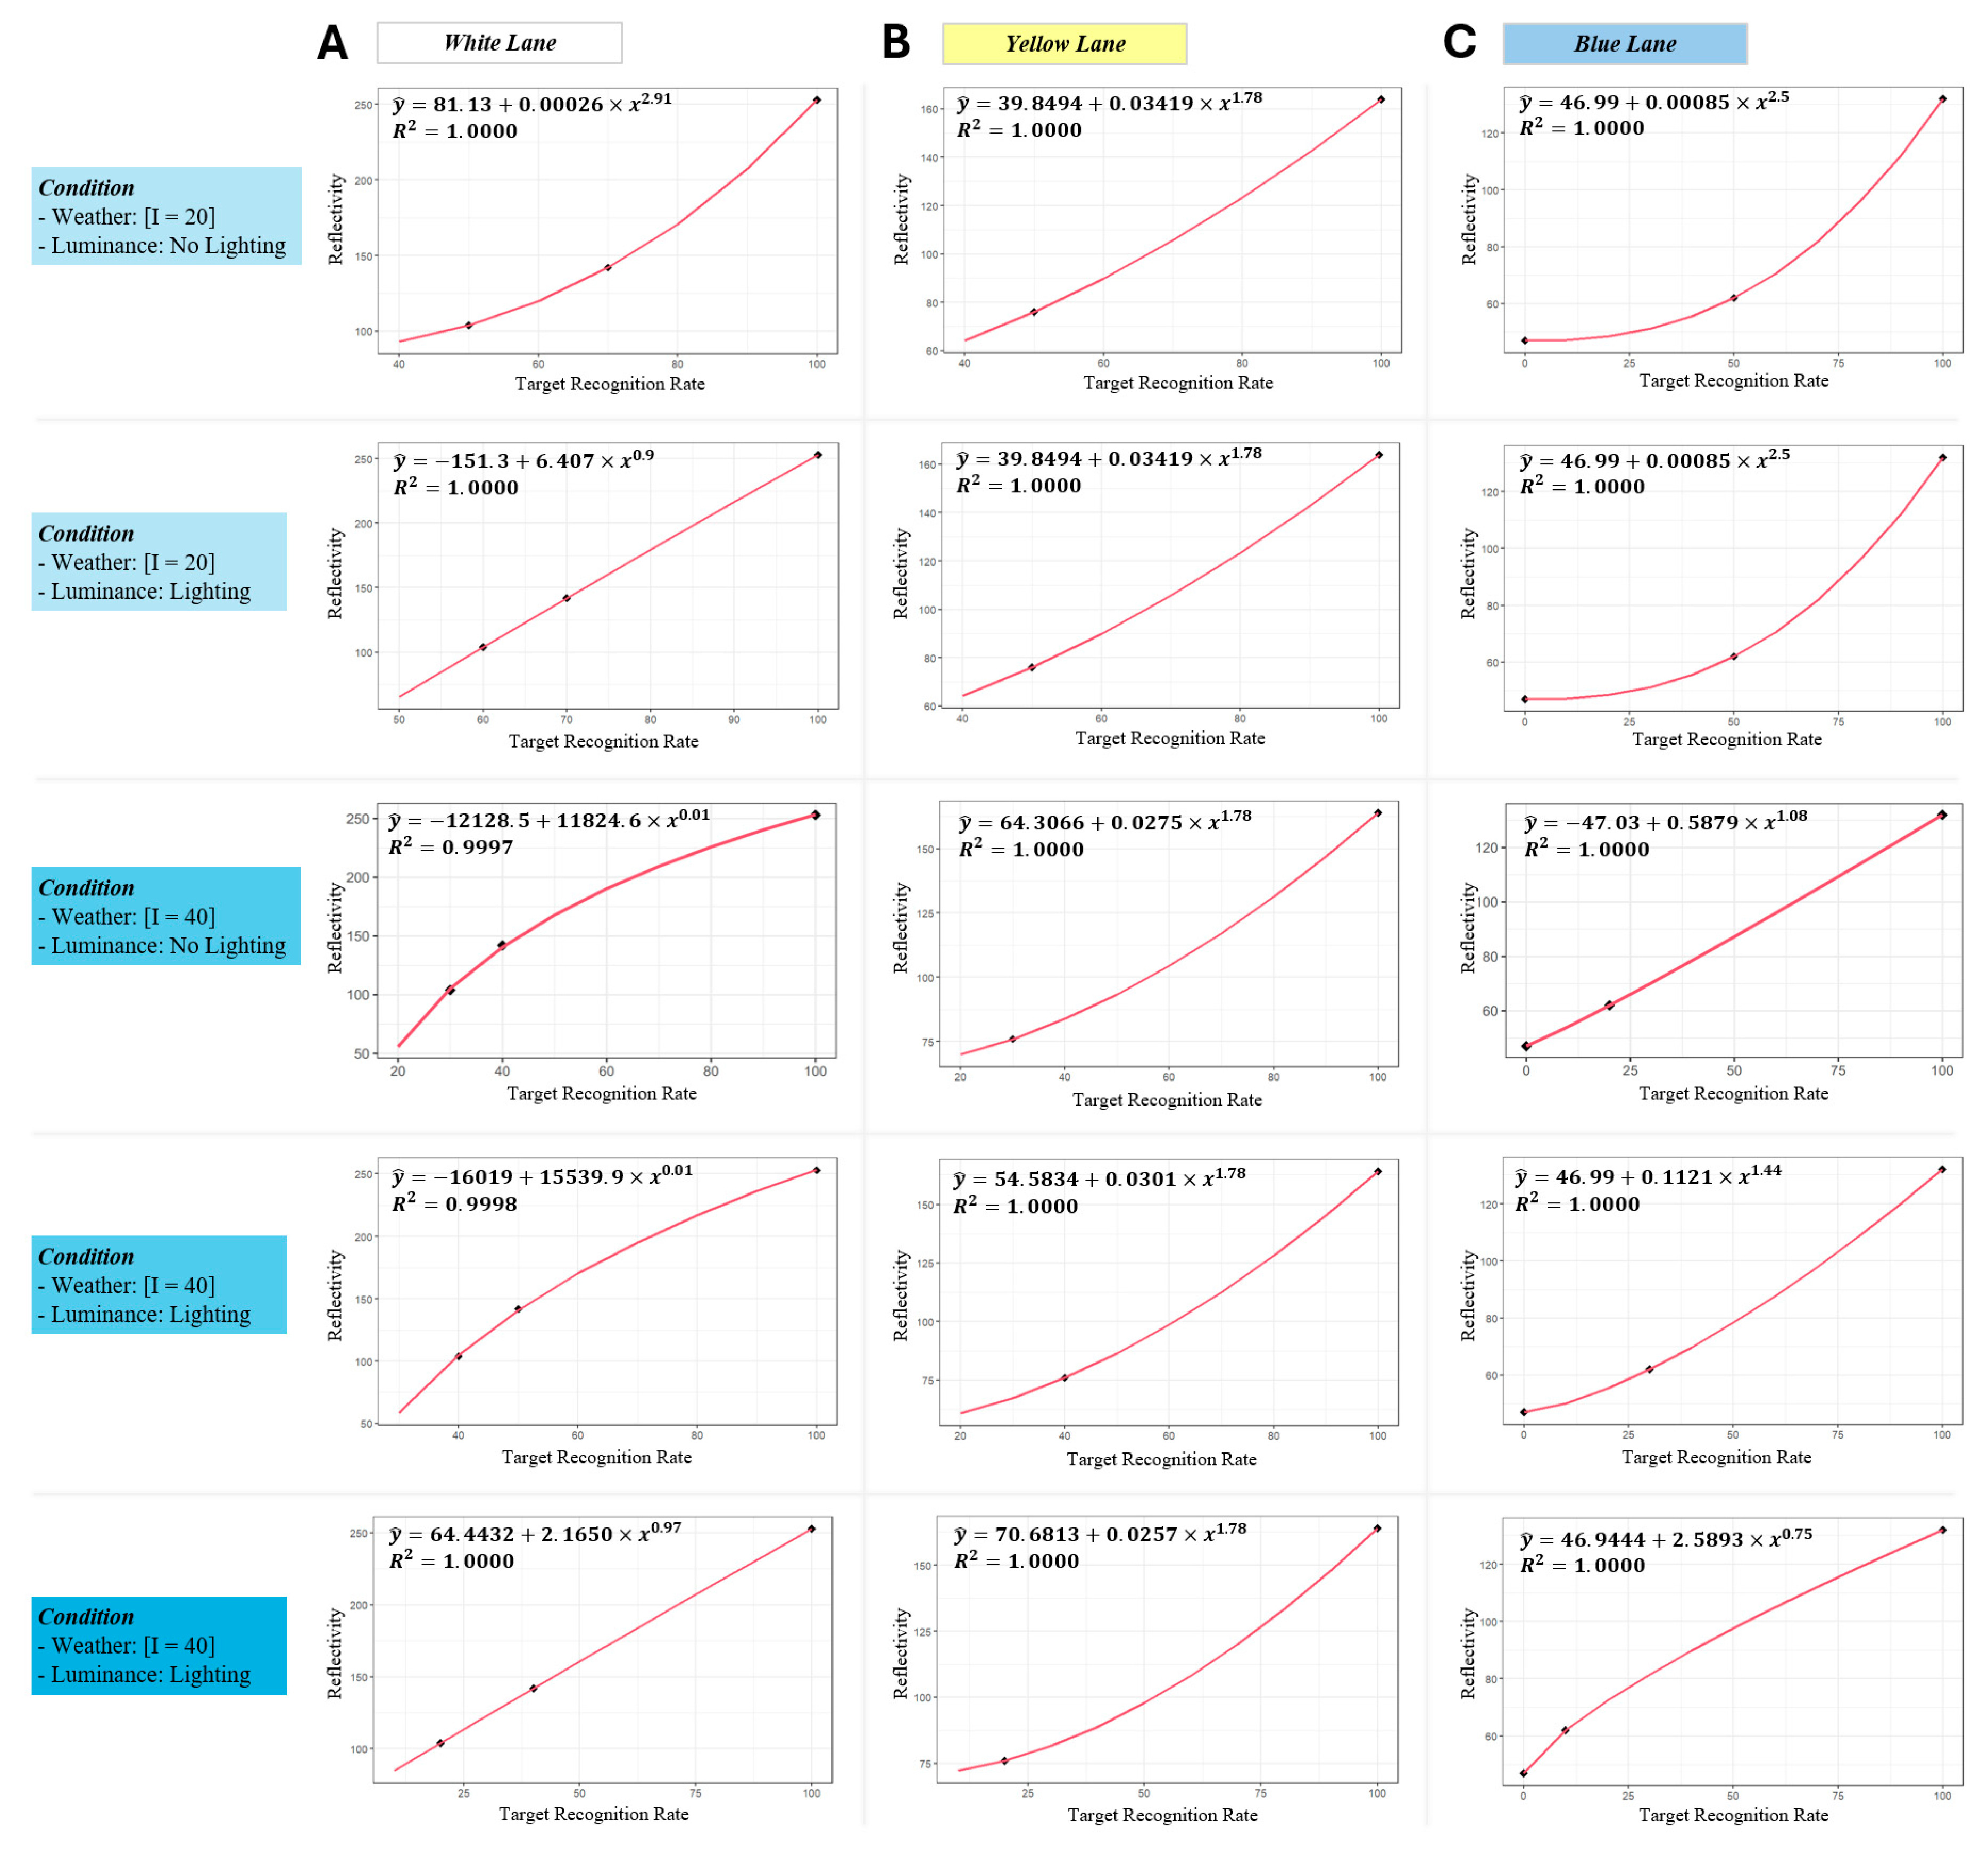
3.1. White Lane
3.2. Yellow Lane
3.3. Blue Lane
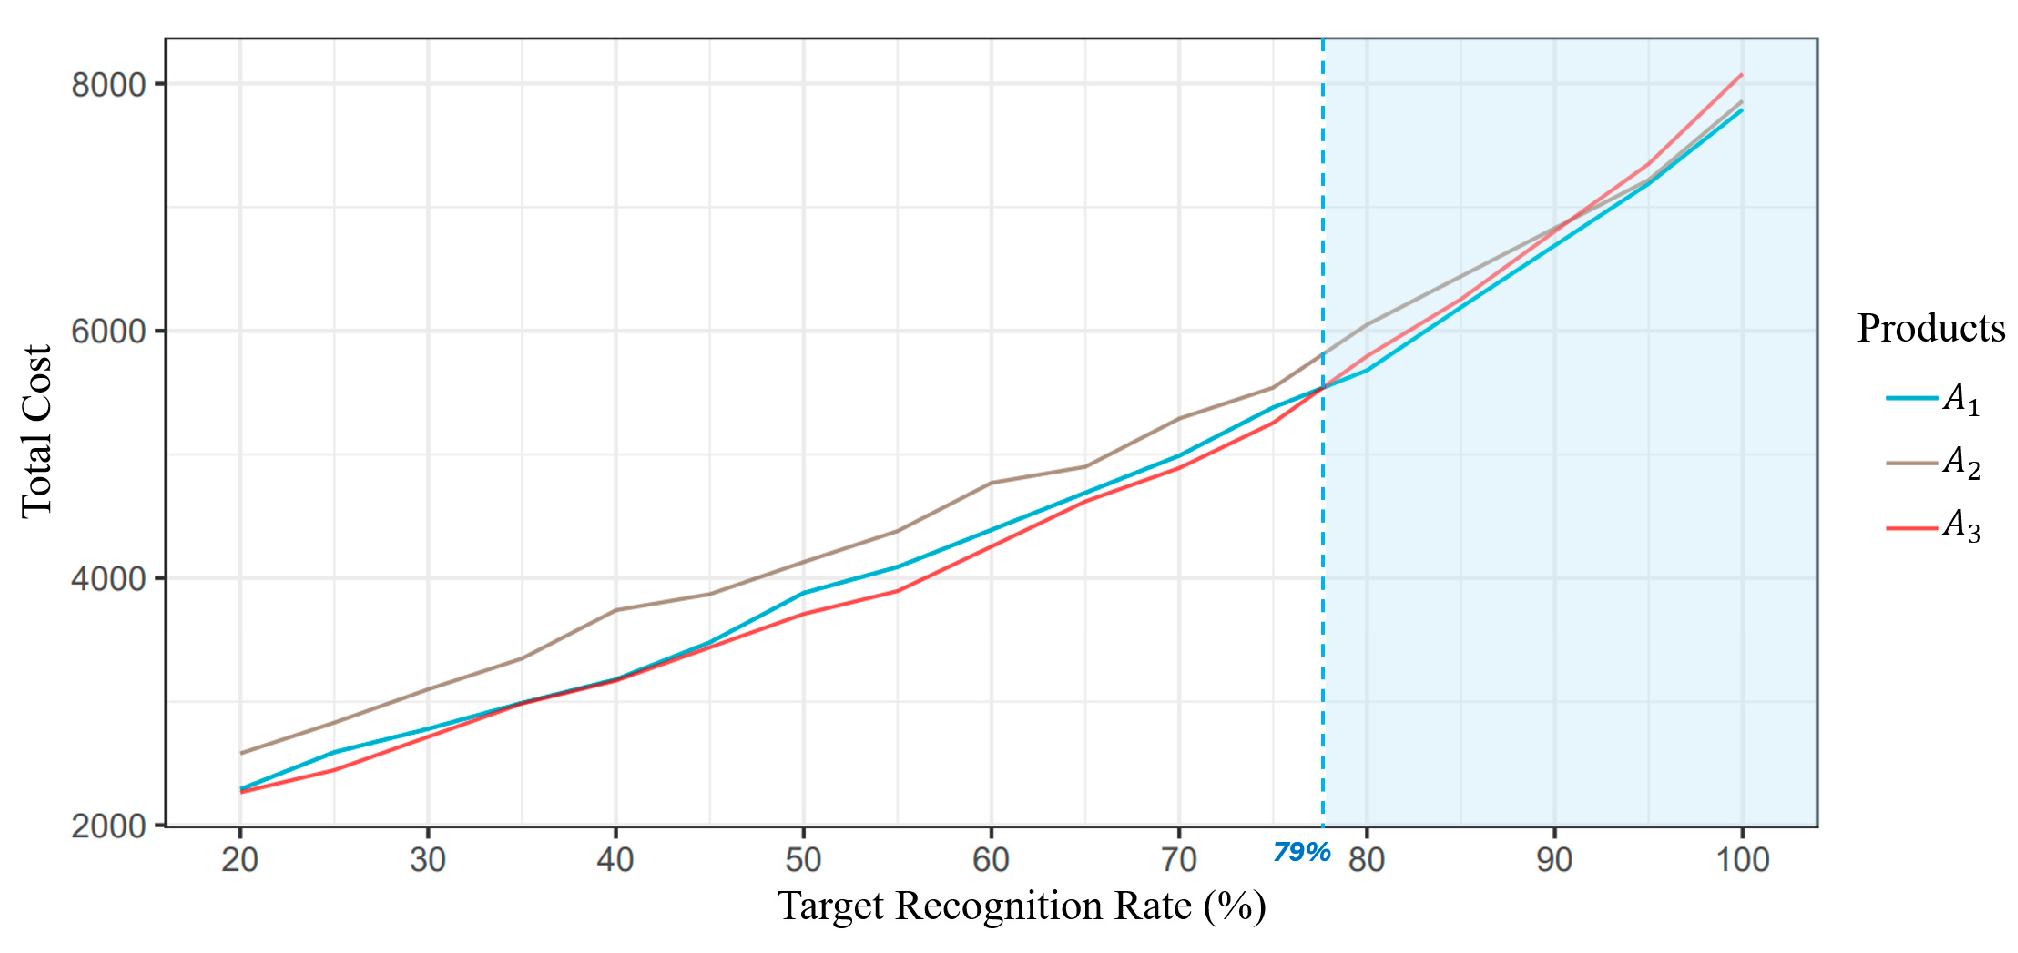
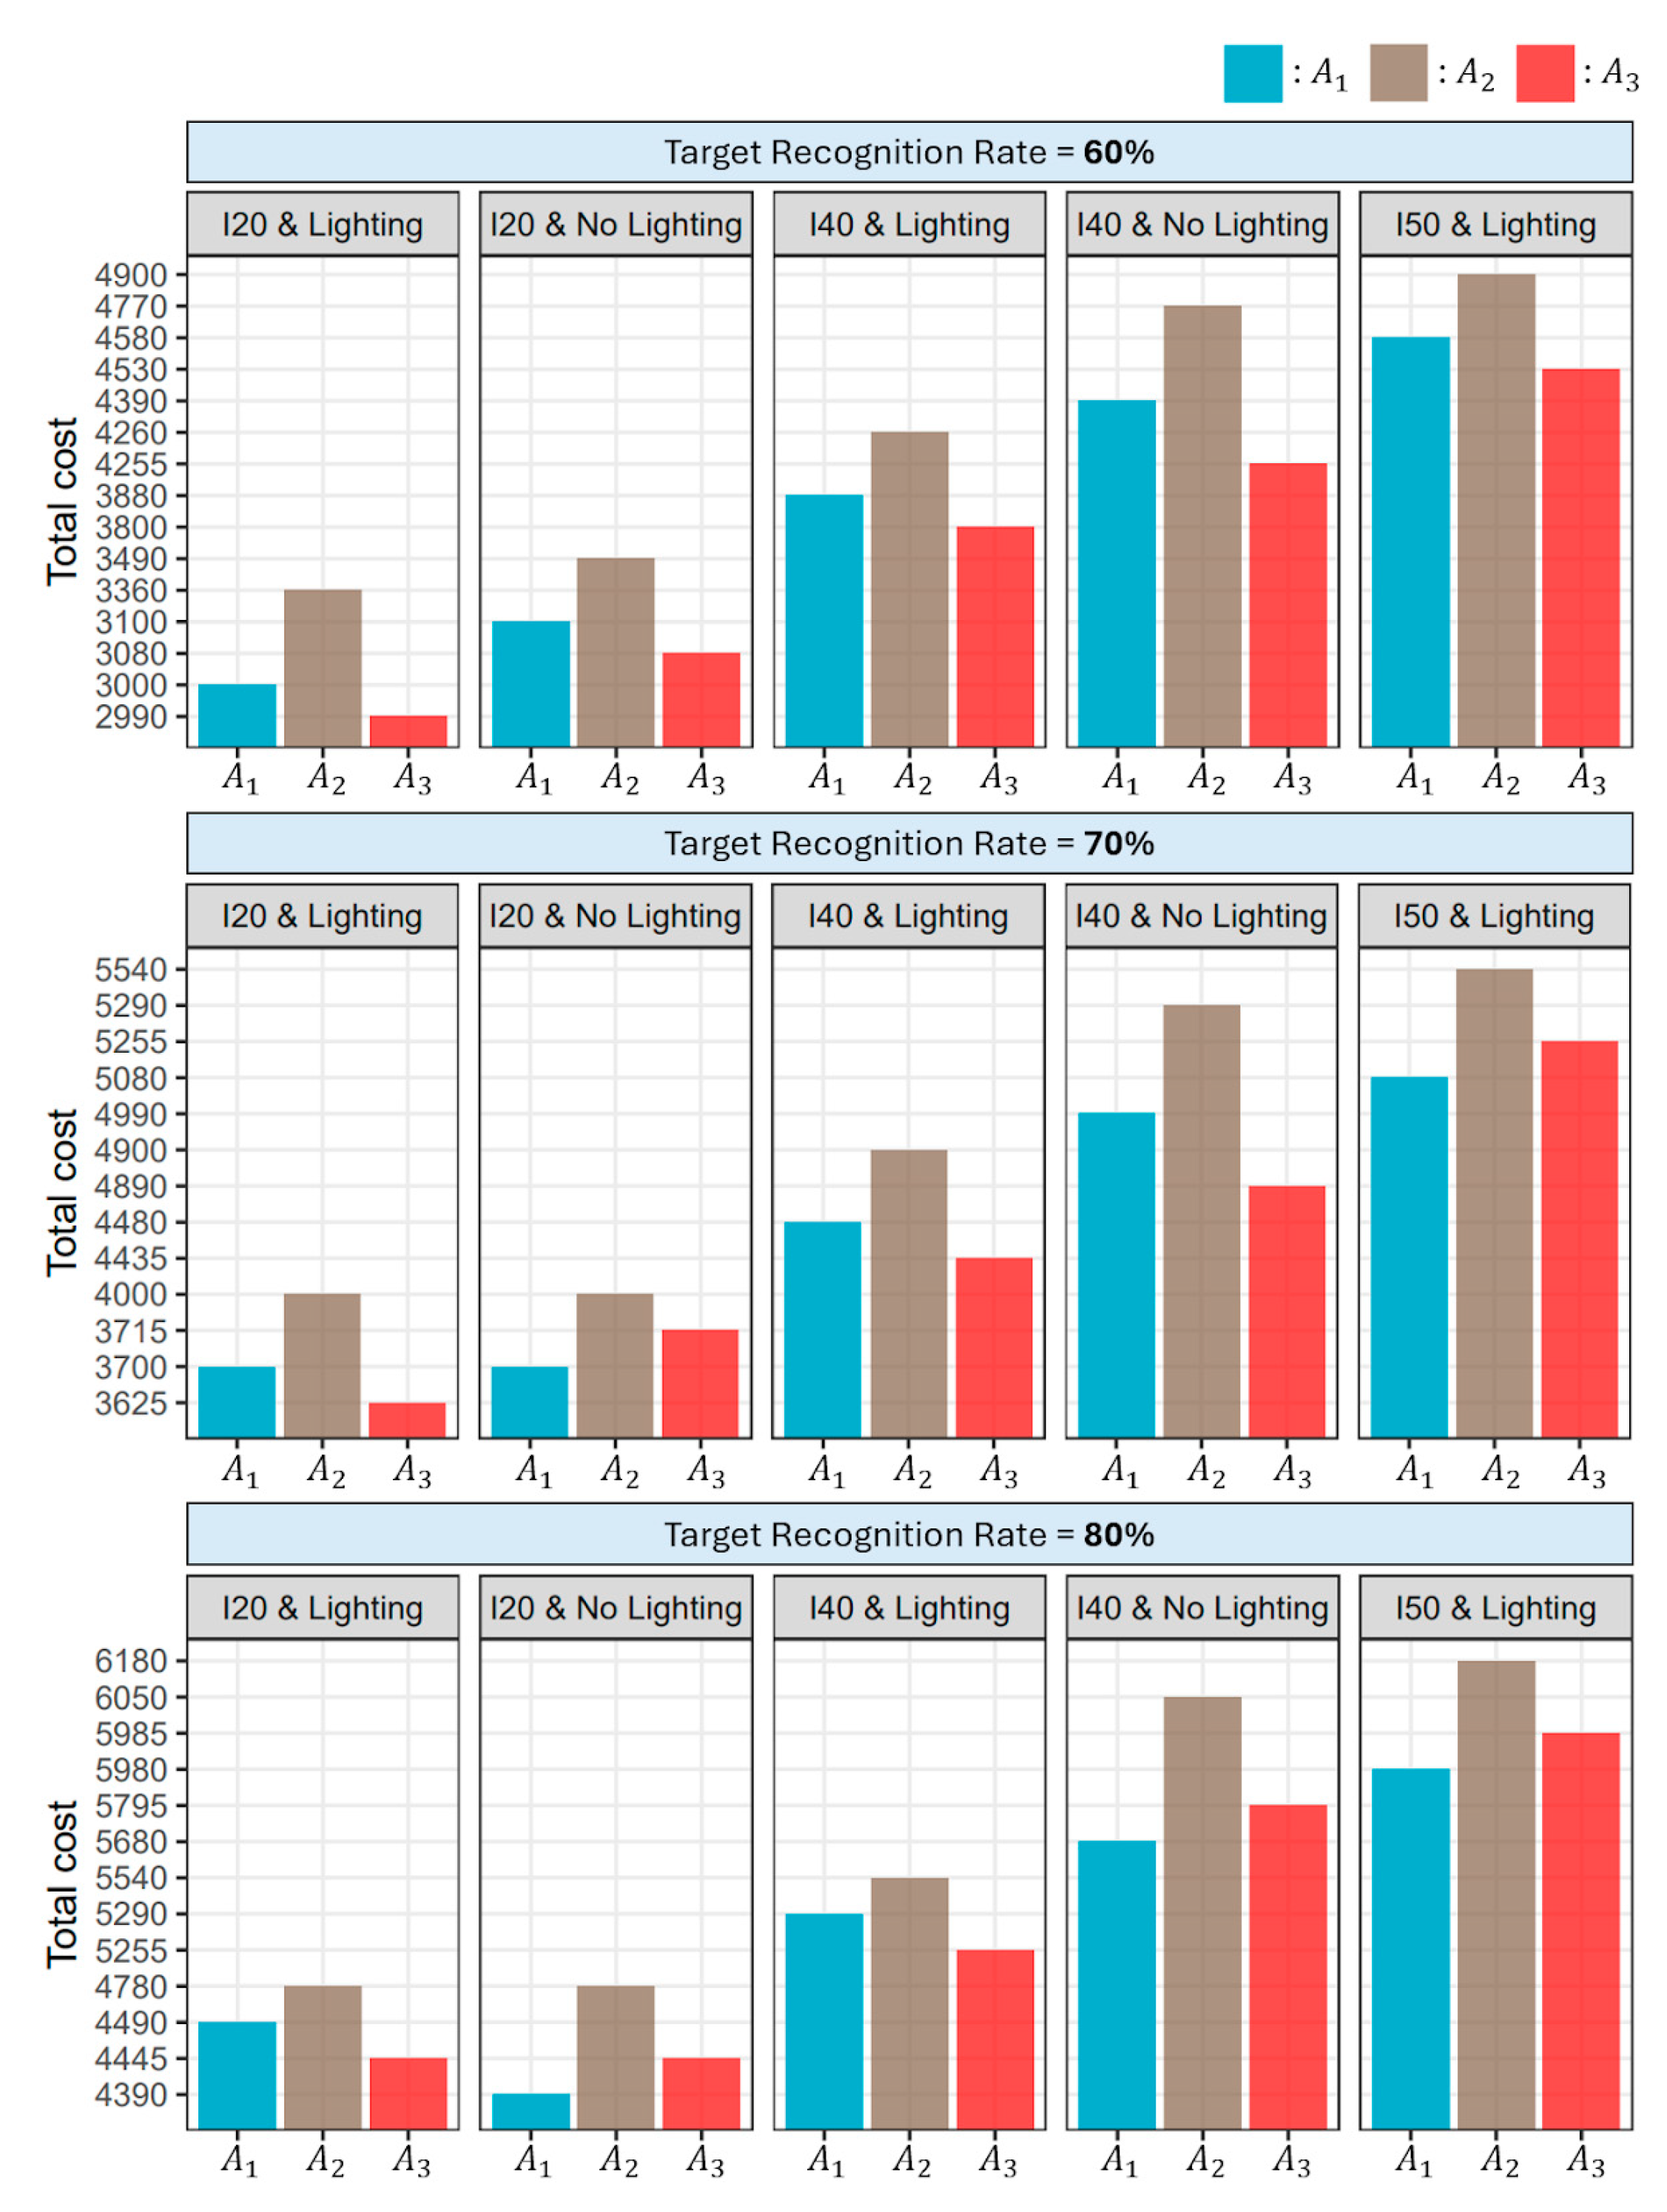
3.4. Simulation
4. Discussion
5. Conclusions
Author Contributions
Funding
Institutional Review Board Statement
Informed Consent Statement
Data Availability Statement
Conflicts of Interest
References
- Wang, C.; Sun, Q.; Li, Z.; Zhang, H.; Ruan, K. Cognitive Competence Improvement for Autonomous Vehicles: A Lane Change Identification Model for Distant Preceding Vehicles. IEEE Access 2019, 7, 83229–83242. [Google Scholar] [CrossRef]
- Jiao, X.; Yang, D.; Jiang, K.; Yu, C.; Wen, T.; Yan, R. Real-Time Lane Detection and Tracking for Autonomous Vehicle Applications. Proc. Inst. Mech. Eng. Part D J. Automob. Eng. 2019, 233, 2301–2311. [Google Scholar] [CrossRef]
- Zakaria, N.J.; Shapiai, M.I.; Abd Ghani, R.; Yassin, M.N.M.; Ibrahim, M.Z.; Wahid, N. Lane Detection in Autonomous Vehicles: A Systematic Review. IEEE Access 2023, 11, 3729–3765. [Google Scholar] [CrossRef]
- Chen, W.; Wang, W.; Wang, K.; Li, Z.; Li, H.; Liu, S. Lane Departure Warning Systems and Lane Line Detection Methods Based on Image Processing and Semantic Segmentation: A Review. J. Traffic Transp. Eng. (Engl. Ed.) 2020, 7, 748–774. [Google Scholar] [CrossRef]
- Wu, J.; Chen, X.; Bie, Y.; Zhou, W. A Co-Evolutionary Lane-Changing Trajectory Planning Method for Automated Vehicles Based on the Instantaneous Risk Identification. Accid. Anal. Prev. 2023, 180, 106907. [Google Scholar] [CrossRef] [PubMed]
- Son, J.; Yoo, H.; Kim, S.; Sohn, K. Real-Time Illumination Invariant Lane Detection for Lane Departure Warning System. Expert. Syst. Appl. 2015, 42, 1816–1824. [Google Scholar] [CrossRef]
- Jung, C.R.; Kelber, C.R. A Lane Departure Warning System Based on a Linear-Parabolic Lane Model. In Proceedings of the IEEE Intelligent Vehicles Symposium, Parma, Italy, 14–17 June 2004; IEEE: Washington, DC, USA, 2004; pp. 891–895. [Google Scholar]
- Ahmed, Y.A.; Mohamed, A.T.; Aly, A.M.B. Robust Lane Departure Warning System for Adas on Highways. In Proceedings of the 2022 4th Novel Intelligent and Leading Emerging Sciences Conference (NILES), Giza, Egypt, 22–24 October 2022; IEEE: Washington, DC, USA, 2022; pp. 321–324. [Google Scholar]
- Zhang, J.; Si, J.; Yin, X.; Gao, Z.; Moon, Y.S.; Gong, J.; Tang, F. Lane Departure Warning Algorithm Based on Probability Statistics of Driving Habits. Soft Comput. 2021, 25, 13941–13948. [Google Scholar] [CrossRef]
- Haris, M.; Hou, J.; Wang, X. Lane Line Detection and Departure Estimation in a Complex Environment by Using an Asymmetric Kernel Convolution Algorithm. Vis. Comput. 2023, 39, 519–538. [Google Scholar] [CrossRef]
- Pagale, M.; Mulik, S.; Purohit, R.; Thakare, A.; Hanchate, R.; Jadhav, S. Design and Implementation of Lane Detection Using Hough Transformation. In Proceedings of the 2023 2nd International Conference on Applied Artificial Intelligence and Computing (ICAAIC), Salem, India, 4–6 May 2023; IEEE: Washington, DC, USA, 2023; pp. 927–932. [Google Scholar]
- Malligere Shivanna, V.; Guo, J.-I. Object Detection, Recognition, and Tracking Algorithms for ADASs—A Study on Recent Trends. Sensors 2023, 24, 249. [Google Scholar] [CrossRef]
- Dilek, E.; Dener, M. Computer Vision Applications in Intelligent Transportation Systems: A Survey. Sensors 2023, 23, 2938. [Google Scholar] [CrossRef]
- Sultana, S.; Ahmed, B.; Paul, M.; Islam, M.R.; Ahmad, S. Vision-Based Robust Lane Detection and Tracking in Challenging Conditions. IEEE Access 2023, 11, 67938–67955. [Google Scholar] [CrossRef]
- Anbalagan, S.; Srividya, P.; Thilaksurya, B.; Senthivel, S.G.; Suganeshwari, G.; Raja, G. Vision-Based Ingenious Lane Departure Warning System for Autonomous Vehicles. Sustainability 2023, 15, 3535. [Google Scholar] [CrossRef]
- Dewangan, D.K.; Sahu, S.P. Towards the Design of Vision-Based Intelligent Vehicle System: Methodologies and Challenges. Evol. Intell. 2023, 16, 759–800. [Google Scholar] [CrossRef]
- Ghanem, S.; Kanungo, P.; Panda, G.; Satapathy, S.C.; Sharma, R. Lane Detection under Artificial Colored Light in Tunnels and on Highways: An IoT-Based Framework for Smart City Infrastructure. Complex. Intell. Syst. 2023, 9, 3601–3612. [Google Scholar] [CrossRef]
- Hadi, M.; Sinha, P.; Easterling IV, J.R. Effect of Environmental Conditions on Performance of Image Recognition-Based Lane Departure Warning System. Transp. Res. Rec. 2007, 2000, 114–120. [Google Scholar] [CrossRef]
- Diamandouros, K.; Gatscha, M. Rainvision: The Impact of Road Markings on Driver Behaviour–Wet Night Visibility. Transp. Res. Procedia 2016, 14, 4344–4353. [Google Scholar] [CrossRef]
- Najeh, I.; Daucher, D.; Redondin, M.; Bouillaut, L. Feedback Data Processing for Maintenance Optimization and Grouping—An Application to Road Markings. Future Transp. 2023, 3, 768–790. [Google Scholar] [CrossRef]
- Panda, B. A Cost-Benefit Optimization Model For Maintenance and Rehabilitation Activities of Roads 2013.
- Vaitkus, A.; Čygas, D.; Motiejūnas, A.; Pakalnis, A.; Miškinis, D. Improvement of Road Pavement Maintenance Models and Technologies. Balt. J. Road Bridge Eng. 2016, 11, 242–249. [Google Scholar] [CrossRef]
- Carlson, P.; Park, E.-S.; Pike, A.; Porter, R.J.; Miles, J.; Boulanger, B.; Smadi, O.; Hawkins, N.; Chalmers, S.; Darmiento, F. Pavement Marking Demonstration Projects: State of Alaska and State of Tennessee; United States Federal Highway Administration: Washington, DC, USA, 2013.
- Burghardt, T.E.; Babić, D.; Pashkevich, A. Performance and Environmental Assessment of Prefabricated Retroreflective Spots for Road Marking. Case Stud. Constr. Mater. 2021, 15, e00555. [Google Scholar] [CrossRef]
- Fu, H.; Wilmot, C.G. Evaluating Alternative Pavement Marking Materials. Public. Work. Manag. Policy 2013, 18, 279–297. [Google Scholar] [CrossRef]
- Hadi, M.; Sinha, P. Effect of Pavement Marking Retroreflectivity on the Performance of Vision-Based Lane Departure Warning Systems. J. Intell. Transp. Syst. 2011, 15, 42–51. [Google Scholar] [CrossRef]
- NPA. Manual for Installing and Managing Traffic Road Markings; NPA: Seoul, Republic of Korea, 2020.
- Erdelean, I.; Schaub, A.; Stefan, C.; Vanžura, M.; Praendl-Zika, V.; Hula, A. Assessment of Physical Road Infrastructure to Support Automated Vehicles in an Urban Environment. Transp. Res. Procedia 2023, 72, 2385–2392. [Google Scholar] [CrossRef]
- Burghardt, T.E.; Popp, R.; Helmreich, B.; Reiter, T.; Böhm, G.; Pitterle, G.; Artmann, M. Visibility of Various Road Markings for Machine Vision. Case Stud. Constr. Mater. 2021, 15, e00579. [Google Scholar] [CrossRef]
- Jamal, A.; Reza, I.; Shafiullah, M. Modeling Retroreflectivity Degradation of Traffic Signs Using Artificial Neural Networks. IATSS Res. 2022, 46, 499–514. [Google Scholar] [CrossRef]


| Irradiation Angle | Observation Angle | Conditions | Retro-Reflectivity (mcd/(m2∙Lux)) | |||
|---|---|---|---|---|---|---|
| White | Yellow | Blue | ||||
| 88.76° (1.24°) | 1.05° (2.29°) | Installation | 240 | 150 | 80 | Standard |
| Repainting | 100 | 70 | 40 | Recommend | ||
| Rainfall (wet) | 100 | 70 | 40 | Recommend | ||
| Parameters | Conditions |
|---|---|
| Road marking color | White, yellow, and blue |
| Road marking wearing(grinding frequency) | No grinding, 2 grindings, 4 grindings, and 8 grindings |
| Luminance | Daytime, nighttime (road lighting on and vehicle lighting on), and nighttime (road lighting off and vehicle lighting on) |
| Weather conditions | Normal (dry), wet, rainfall (20 mm/h), rainfall (40 mm/h), fog low visibility (below 50 m), and fog high visibility (below 100 m) |
| Color | Initial | 2 Grindings | 4 Grindings | 8 Grindings |
|---|---|---|---|---|
| White | 365 | 253 | 142 | 104 |
| Yellow | 200 | 164 | 76 | - |
| Blue | 212 | 132 | 62 | 47 |
| Product | Elements | Colors | ||
|---|---|---|---|---|
| White | Yellow | Blue | ||
(Our) | Repainting cost (C) | 100 | 110 | 90 |
| Retro-reflectivity at installation (W) | 365 | 200 | 212 | |
| Duration per grind extent (D) | 100 | 120 | 80 | |
| Repainting cost (C) | 130 | 140 | 120 | |
| Retro-reflectivity at installation (W) | 380 | 215 | 220 | |
| Duration per grind extent (D) | 105 | 130 | 85 | |
| Repainting cost (C) | 90 | 95 | 85 | |
| Retro-reflectivity at installation (W) | 360 | 195 | 205 | |
| Duration per grind extent (D) | 95 | 100 | 95 | |
| 365 mcd/(m2 Lux) | 253 mcd/(m2 Lux) | 142 mcd/(m2 Lux) | 104 mcd/(m2 Lux) | |
|---|---|---|---|---|
| Dry and Lighting | 100 | 100 | 100 | 100 |
| Dry and No Lighting | 100 | 100 | 100 | 100 |
| Wet and Lighting | 100 | 100 | 90 | 90 |
| Wet and No Lighting | 100 | 100 | 90 | 90 |
| I = 20 (mm/h) and Lighting | 100 | 100 | 70 | 60 |
| I = 20 (mm/h) and No Lighting | 100 | 100 | 70 | 50 |
| I = 40 (mm/h) and Lighting | 100 | 100 | 50 | 40 |
| I = 40 (mm/h) and No Lighting | 100 | 100 | 40 | 30 |
| I = 50 (mm/h) and Lighting | 100 | 100 | 40 | 20 |
| 200 mcd/(m2 Lux) | 164 mcd/(m2 Lux) | 76 mcd/(m2 Lux) | |
|---|---|---|---|
| Dry and Lighting | 100 | 100 | 100 |
| Dry and No Lighting | 100 | 100 | 100 |
| Wet and Lighting | 100 | 100 | 90 |
| Wet and No Lighting | 100 | 100 | 90 |
| I = 20 (mm/h) and Lighting | 100 | 100 | 50 |
| I = 20 (mm/h) and No Lighting | 100 | 100 | 50 |
| I = 40 (mm/h) and Lighting | 100 | 100 | 40 |
| I = 40 (mm/h) and No Lighting | 100 | 100 | 30 |
| I = 50 (mm/h) and Lighting | 100 | 100 | 20 |
| 212 mcd/(m2 Lux) | 132 mcd/(m2 Lux) | 62 mcd/(m2 Lux) | 47 mcd/(m2 Lux) | |
|---|---|---|---|---|
| Dry and Lighting | 100 | 100 | 100 | 100 |
| Dry and No Lighting | 100 | 100 | 100 | 100 |
| Wet and Lighting | 100 | 100 | 90 | 90 |
| Wet and No Lighting | 100 | 100 | 90 | 90 |
| I = 20 (mm/h) and Lighting | 100 | 100 | 50 | 0 |
| I = 20 (mm/h) and No Lighting | 100 | 100 | 50 | 0 |
| I = 40 (mm/h) and Lighting | 100 | 100 | 30 | 0 |
| I = 40 (mm/h) and No Lighting | 100 | 100 | 20 | 0 |
| I = 50 (mm/h) and Lighting | 100 | 100 | 10 | 0 |
Disclaimer/Publisher’s Note: The statements, opinions and data contained in all publications are solely those of the individual author(s) and contributor(s) and not of MDPI and/or the editor(s). MDPI and/or the editor(s) disclaim responsibility for any injury to people or property resulting from any ideas, methods, instructions or products referred to in the content. |
© 2024 by the authors. Licensee MDPI, Basel, Switzerland. This article is an open access article distributed under the terms and conditions of the Creative Commons Attribution (CC BY) license (https://creativecommons.org/licenses/by/4.0/).
Share and Cite
Jeong, S.; Ko, J.; Lee, S.; Kang, J.; Kim, Y.; Park, S.Y.; Mun, S. Optimizing Lane Departure Warning System towards AI-Centered Autonomous Vehicles. Sensors 2024, 24, 2505. https://doi.org/10.3390/s24082505
Jeong S, Ko J, Lee S, Kang J, Kim Y, Park SY, Mun S. Optimizing Lane Departure Warning System towards AI-Centered Autonomous Vehicles. Sensors. 2024; 24(8):2505. https://doi.org/10.3390/s24082505
Chicago/Turabian StyleJeong, Siwoo, Jonghyeon Ko, Sukki Lee, Jihoon Kang, Yeni Kim, Soon Yong Park, and Sungchul Mun. 2024. "Optimizing Lane Departure Warning System towards AI-Centered Autonomous Vehicles" Sensors 24, no. 8: 2505. https://doi.org/10.3390/s24082505
APA StyleJeong, S., Ko, J., Lee, S., Kang, J., Kim, Y., Park, S. Y., & Mun, S. (2024). Optimizing Lane Departure Warning System towards AI-Centered Autonomous Vehicles. Sensors, 24(8), 2505. https://doi.org/10.3390/s24082505