
Study of the Prediction of Vibrations in Soft Soil Foundations Based on Field Tests
Abstract
:1. Introduction
2. Project Background
3. Free-Field Vibration Test
4. Analysis of the Test Data
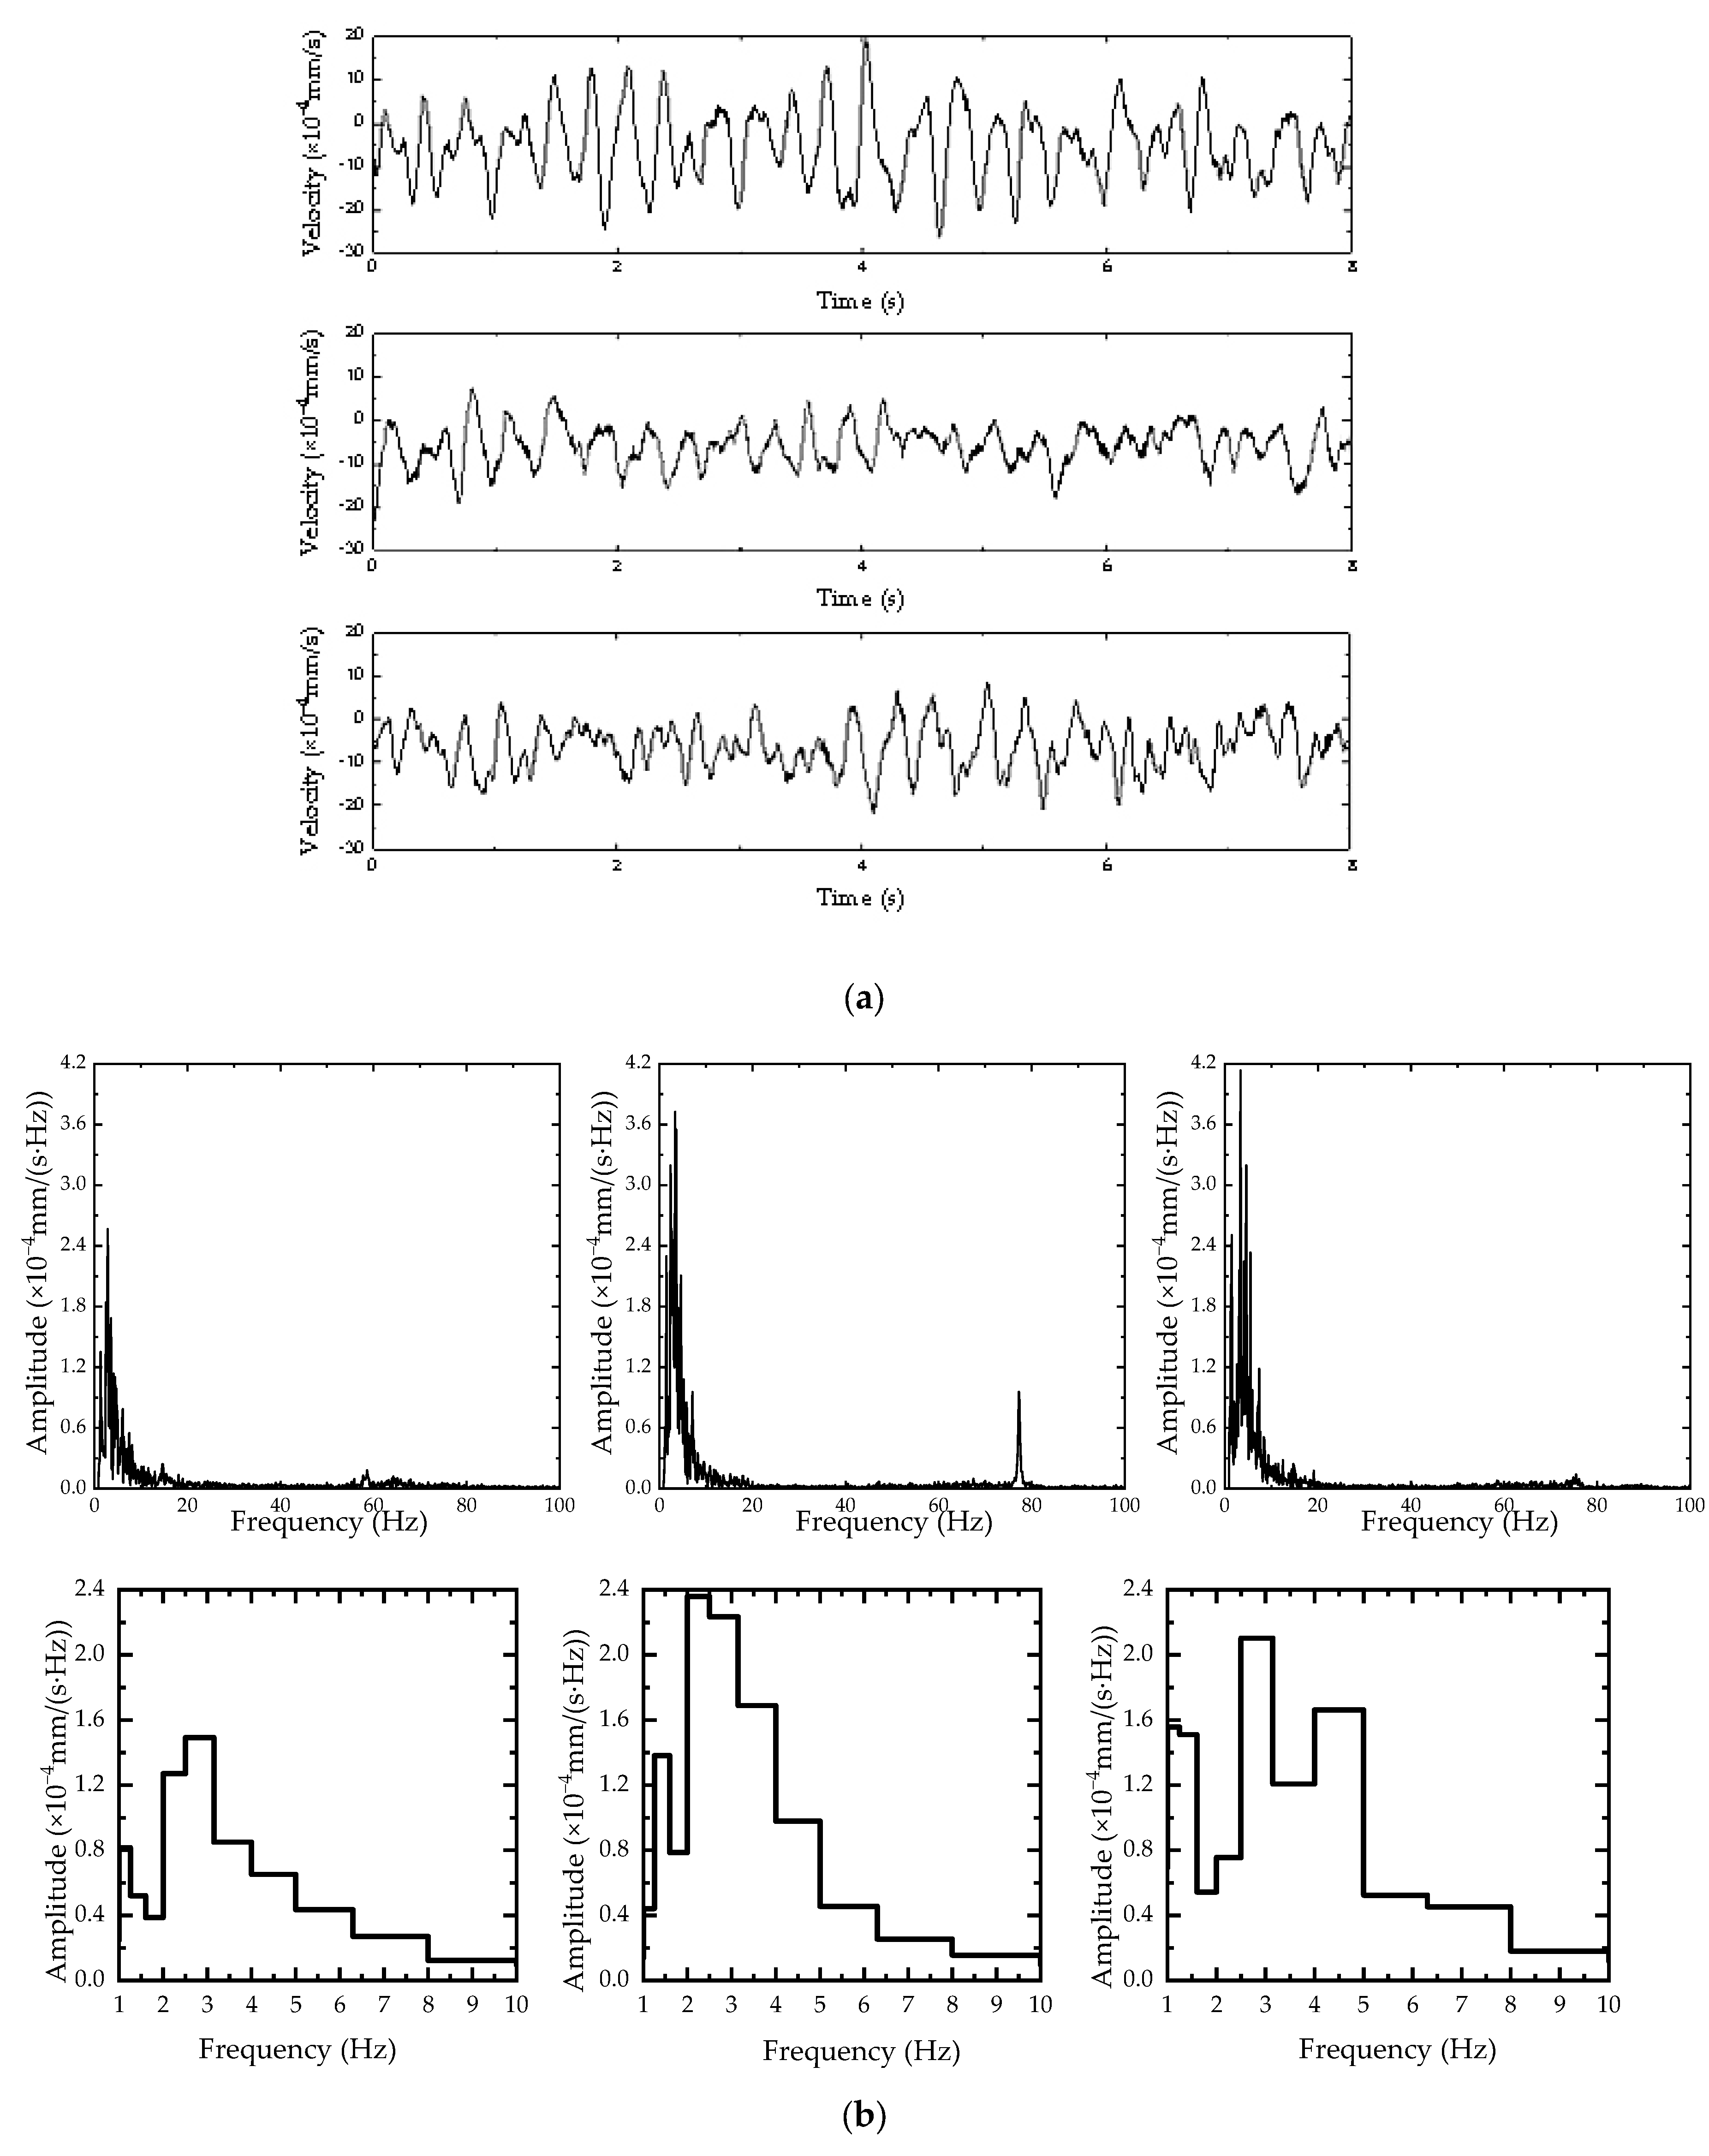
4.1. Vibration Response of Soil under Pulsation
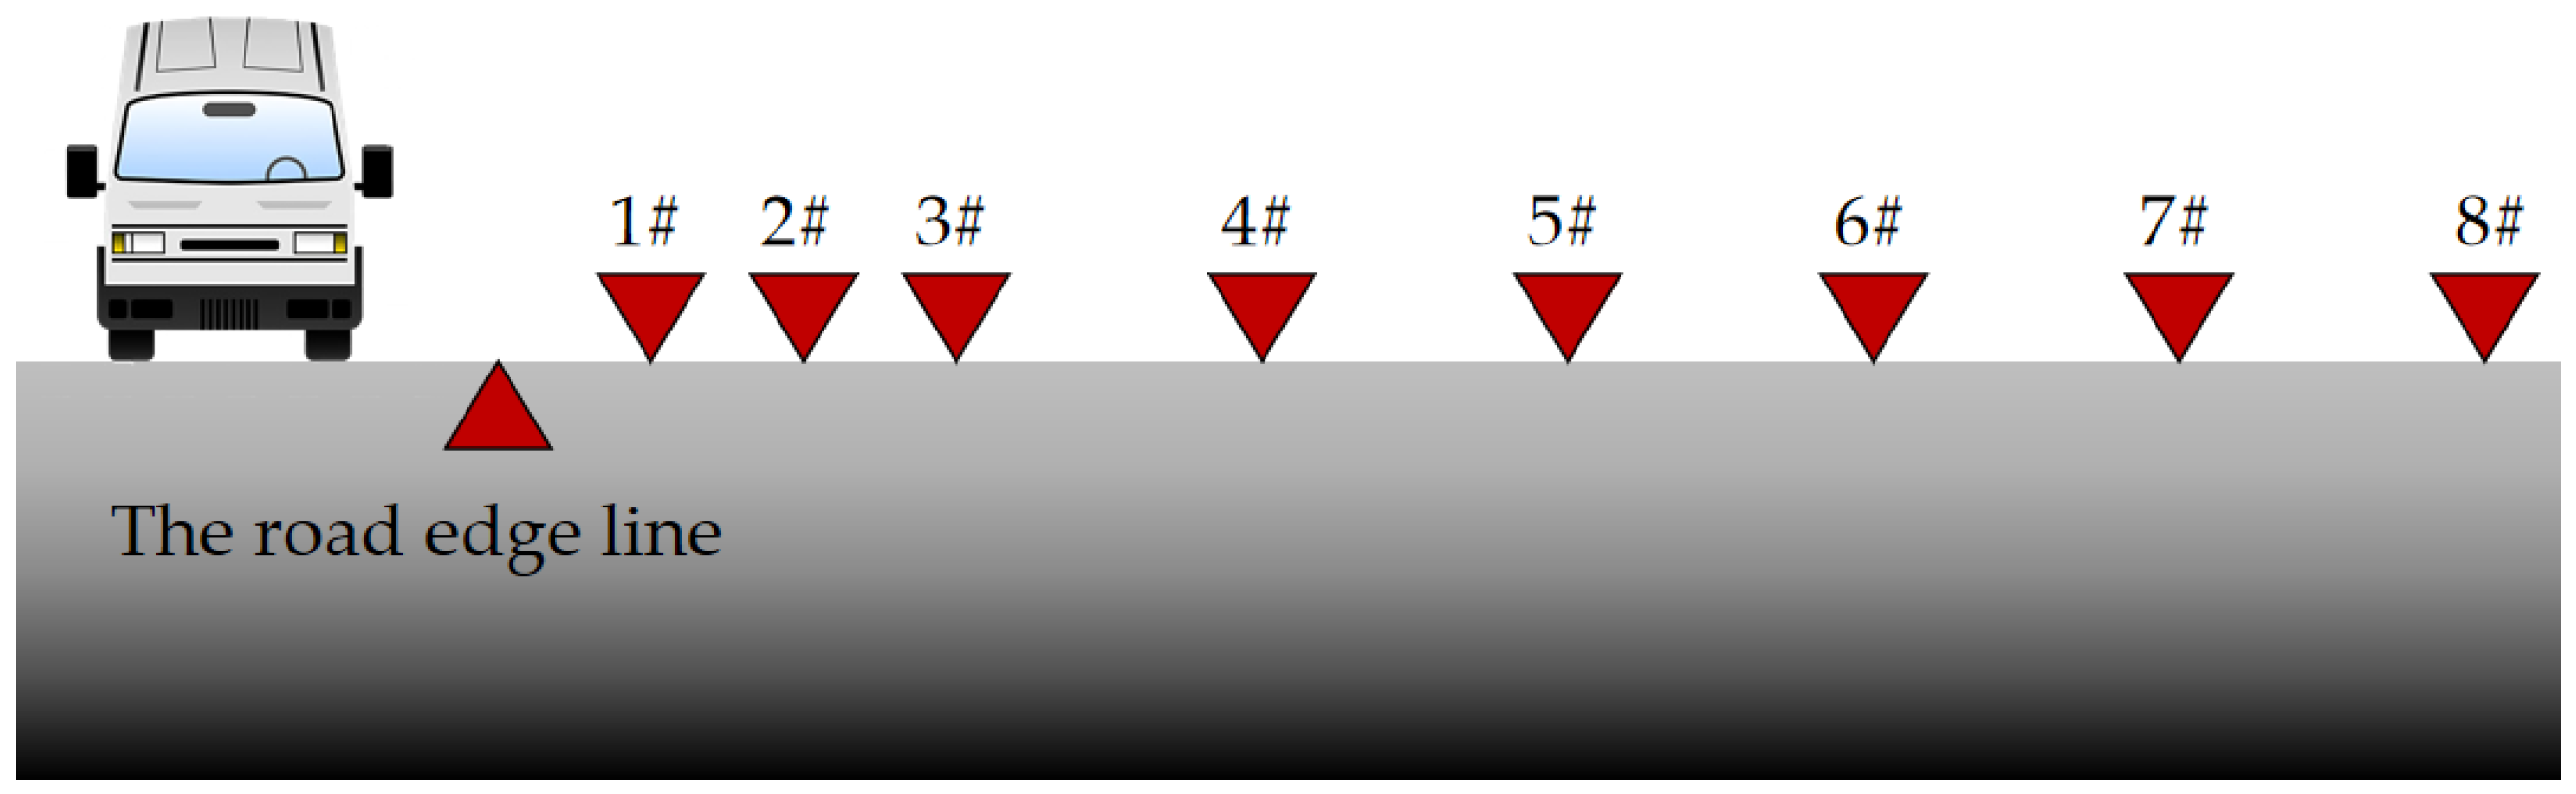
4.2. Soil Vibration Response under the Influence of a Vehicle Driving on a Road
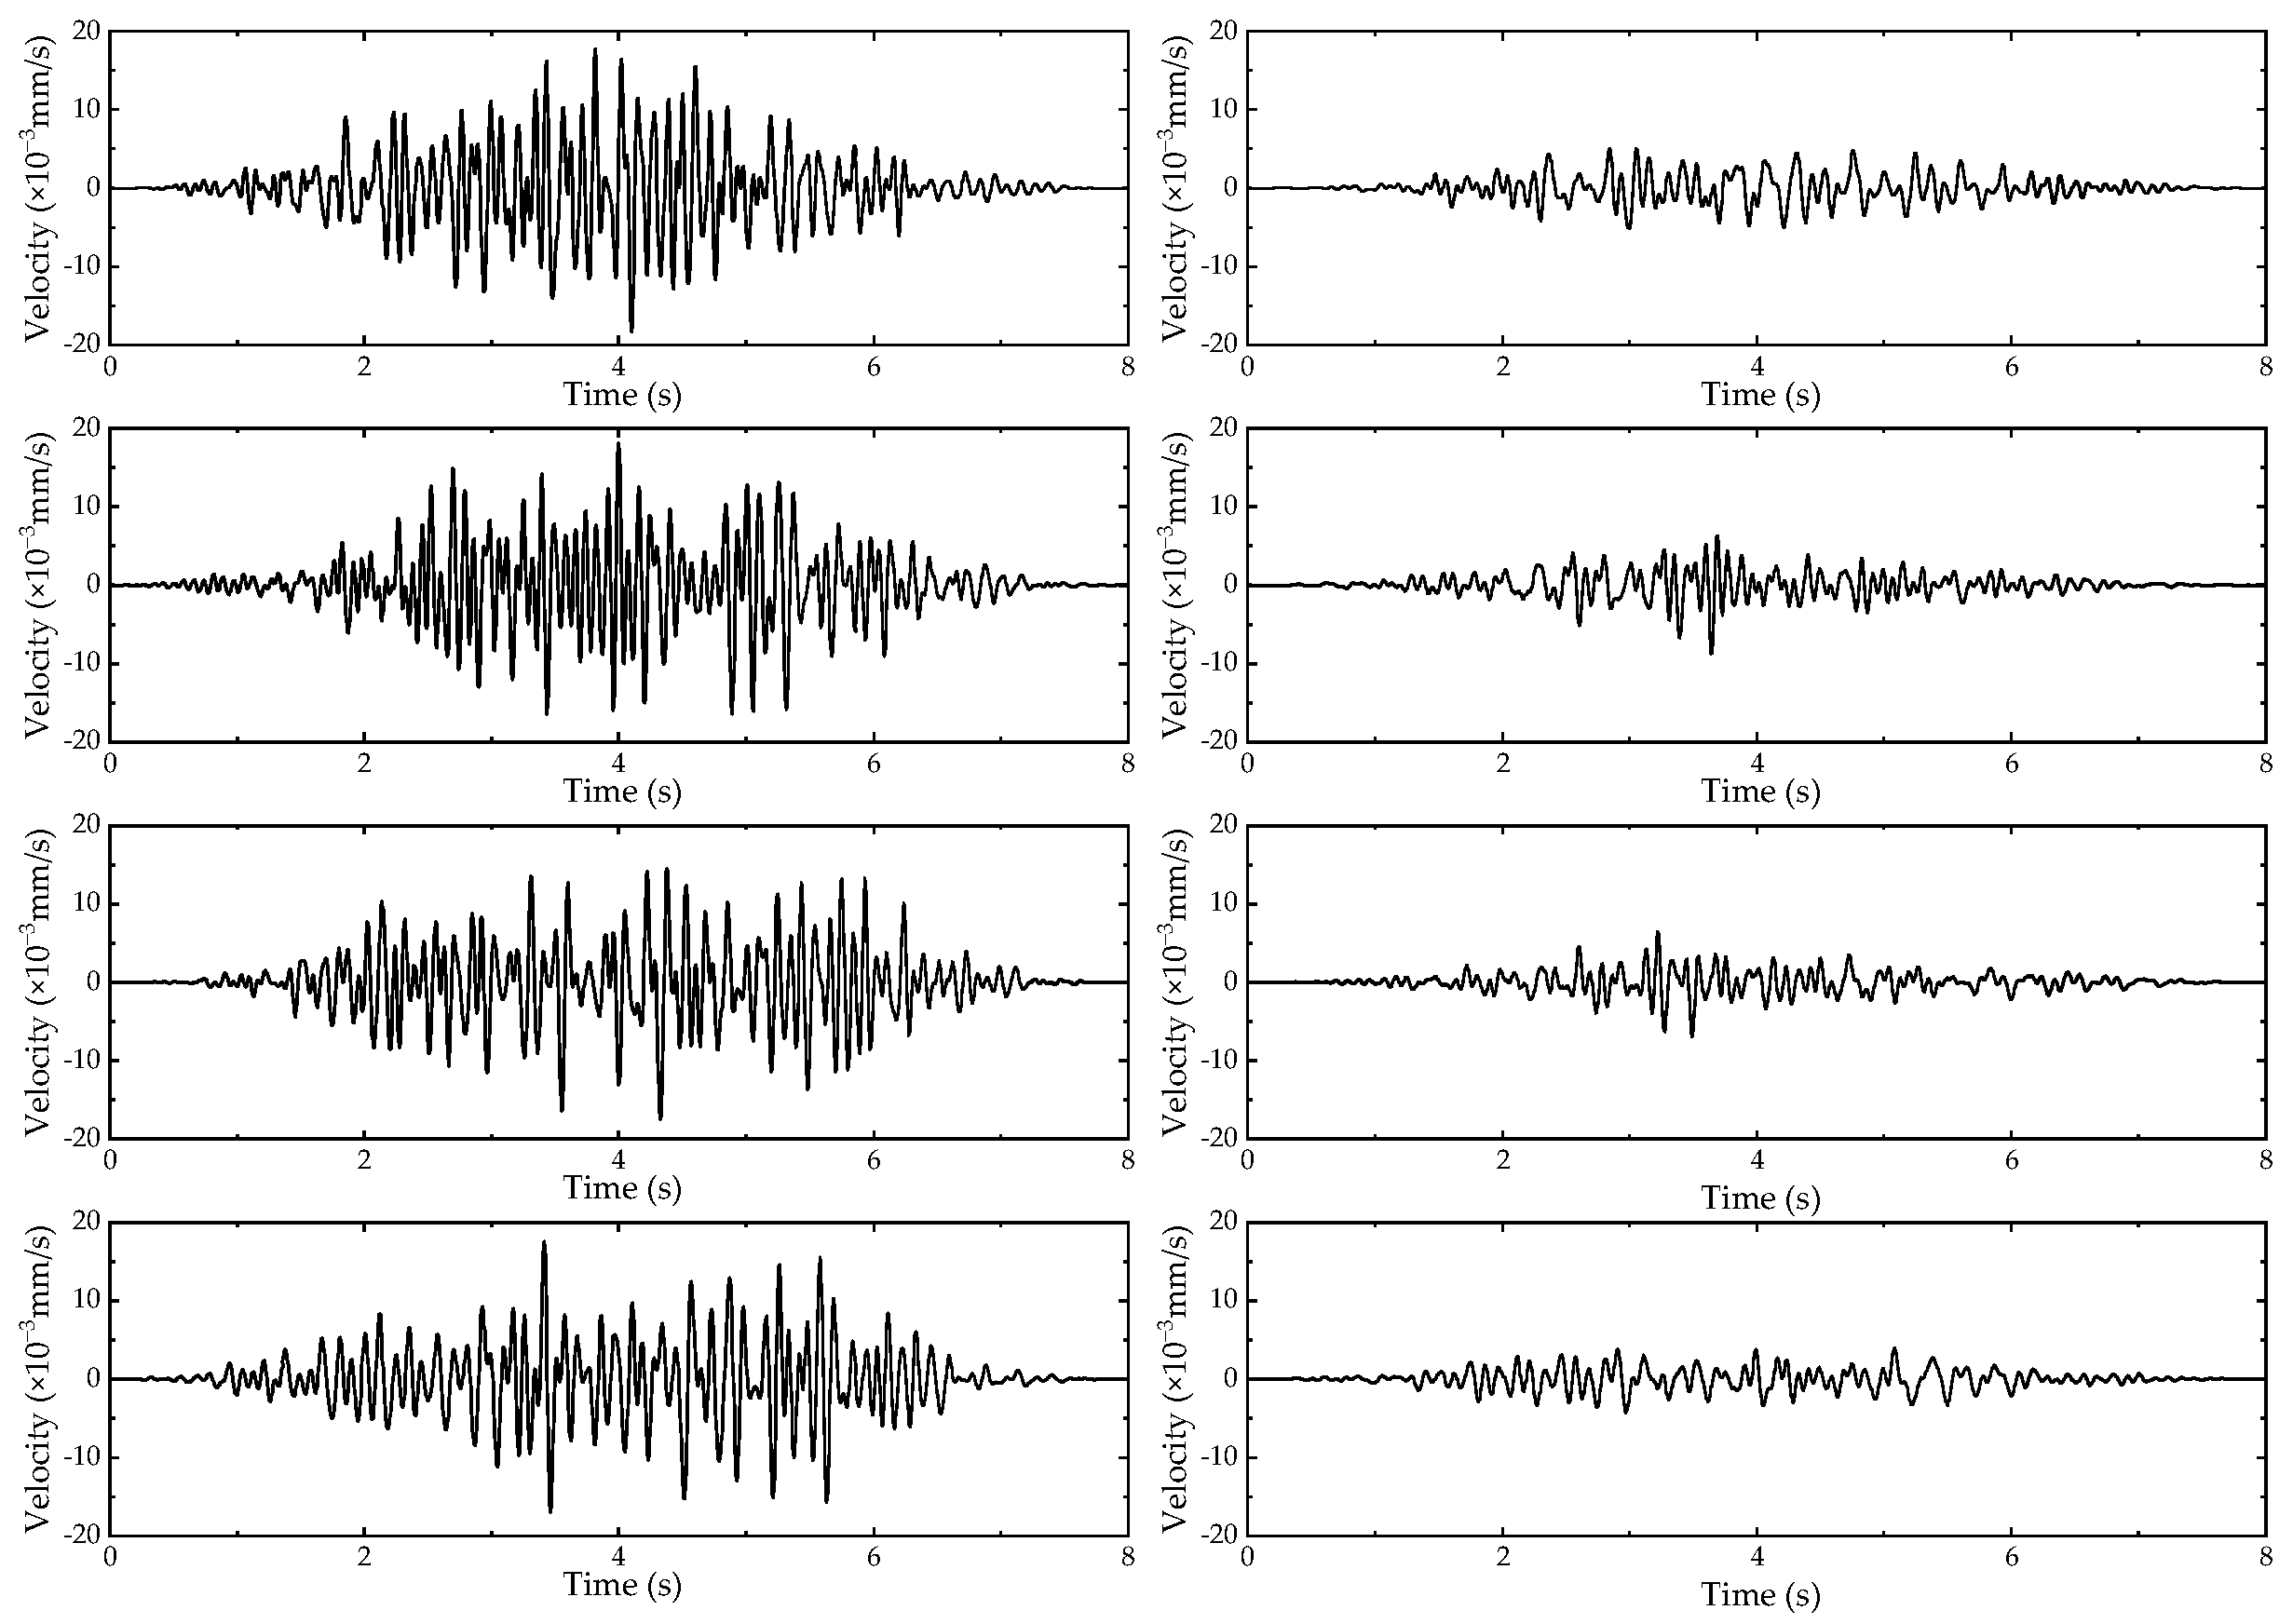
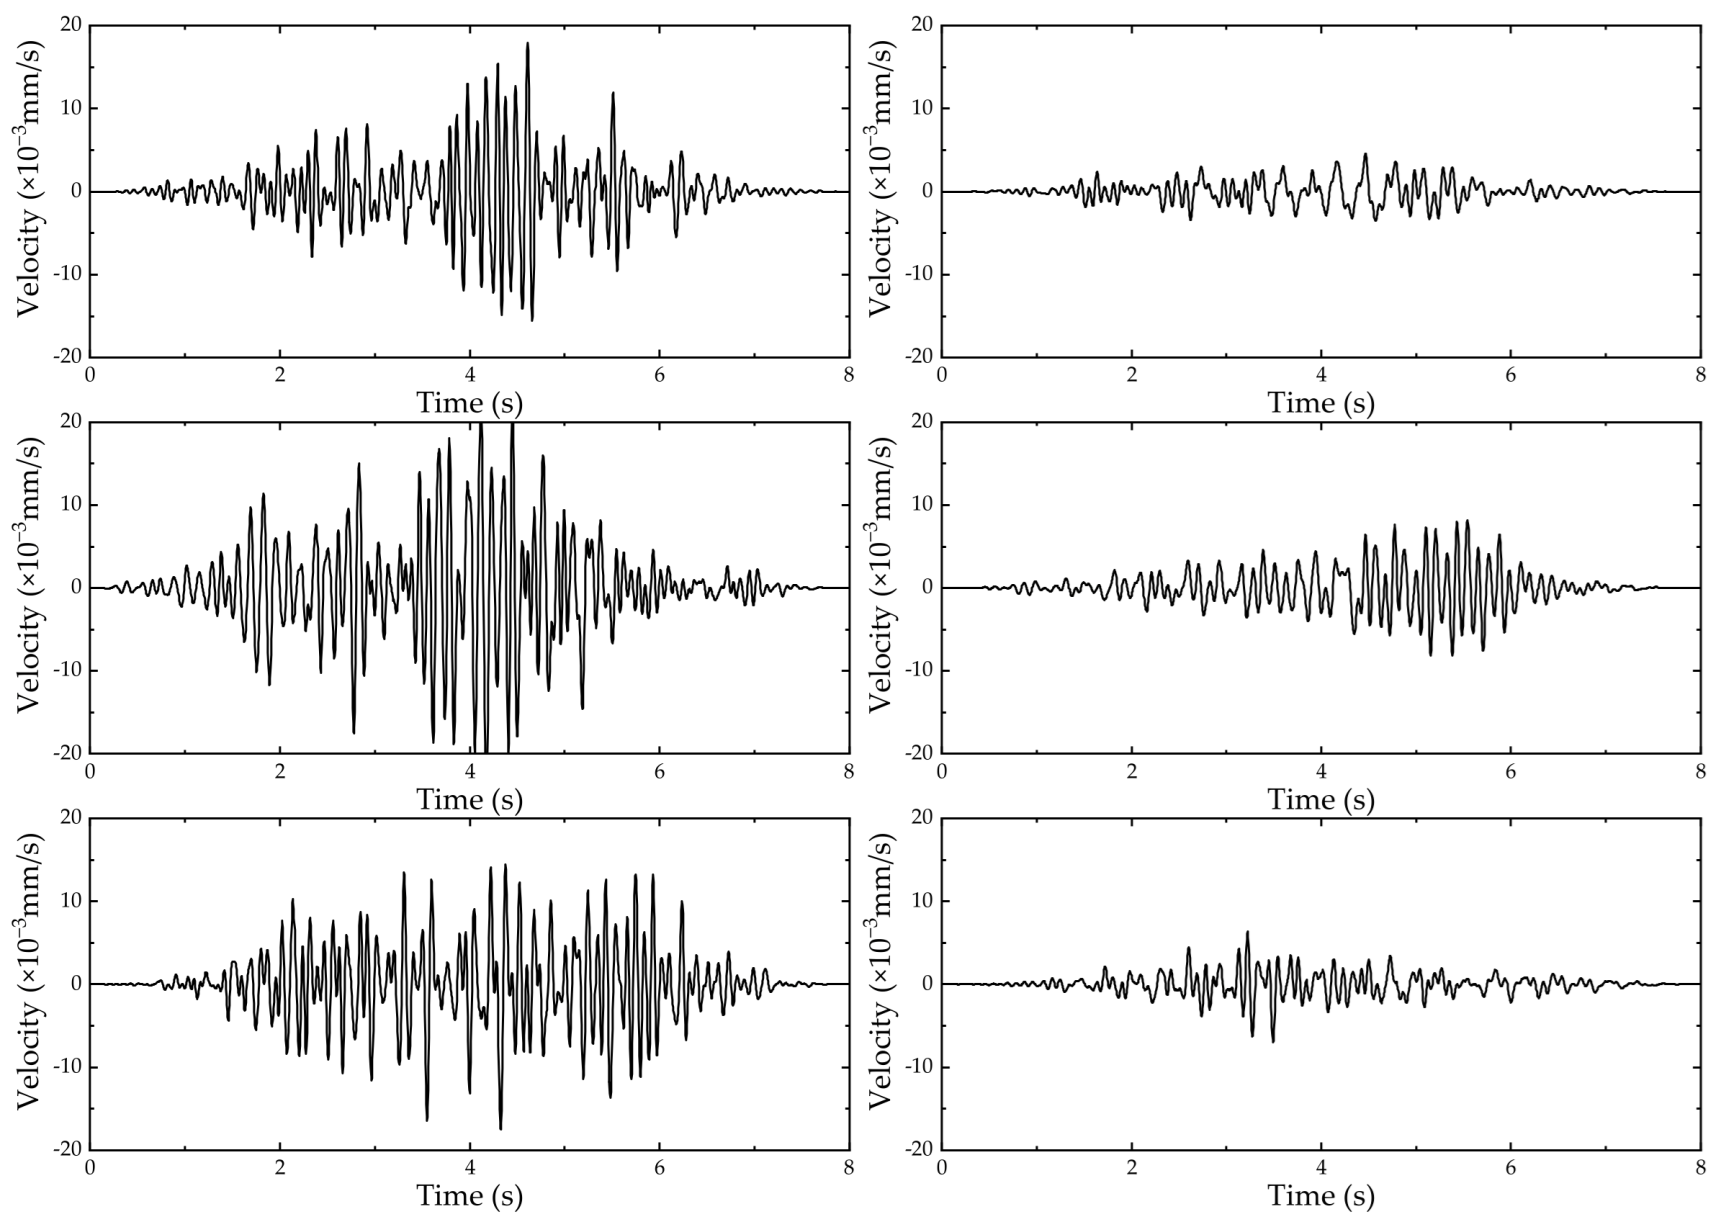
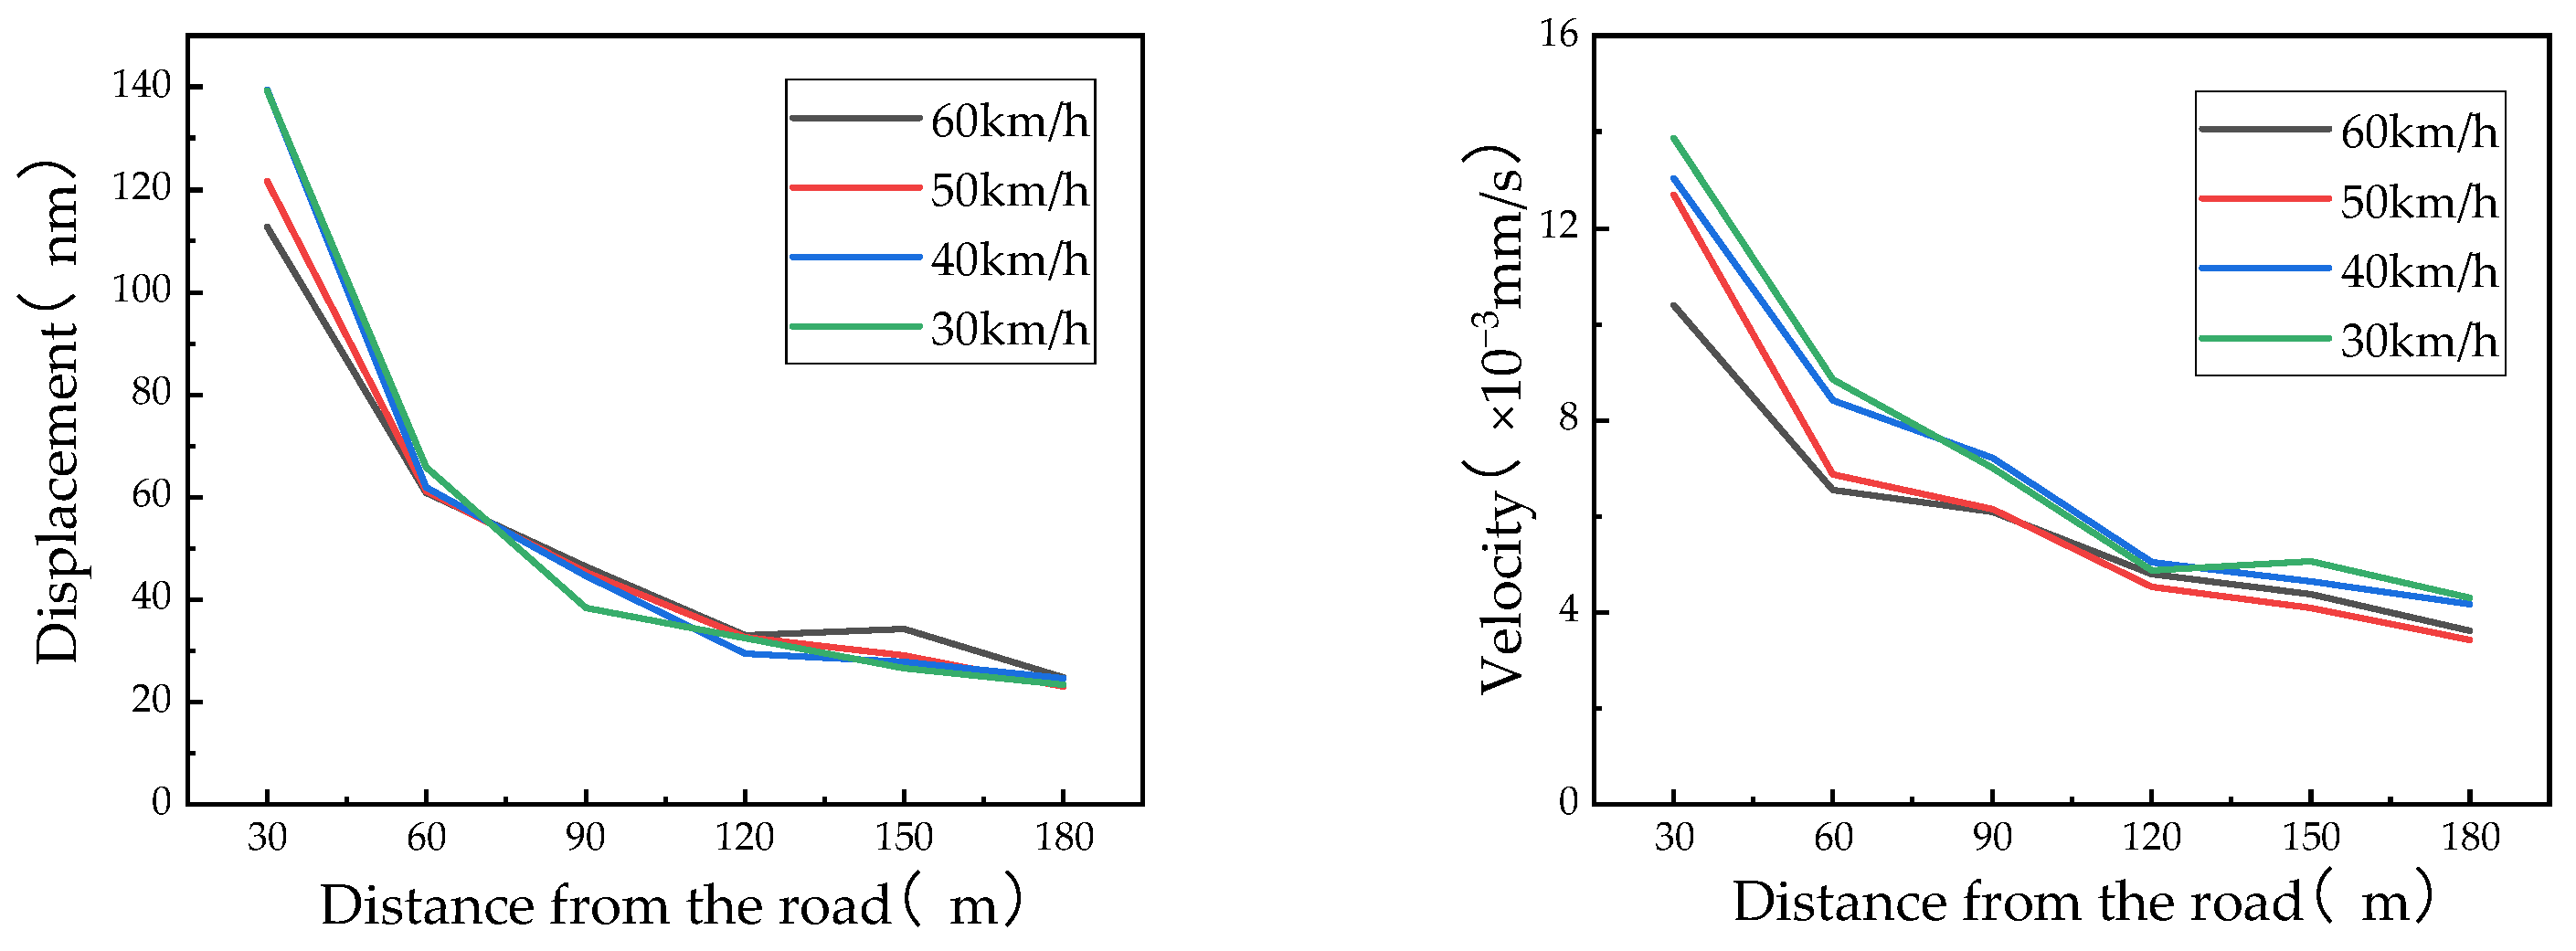
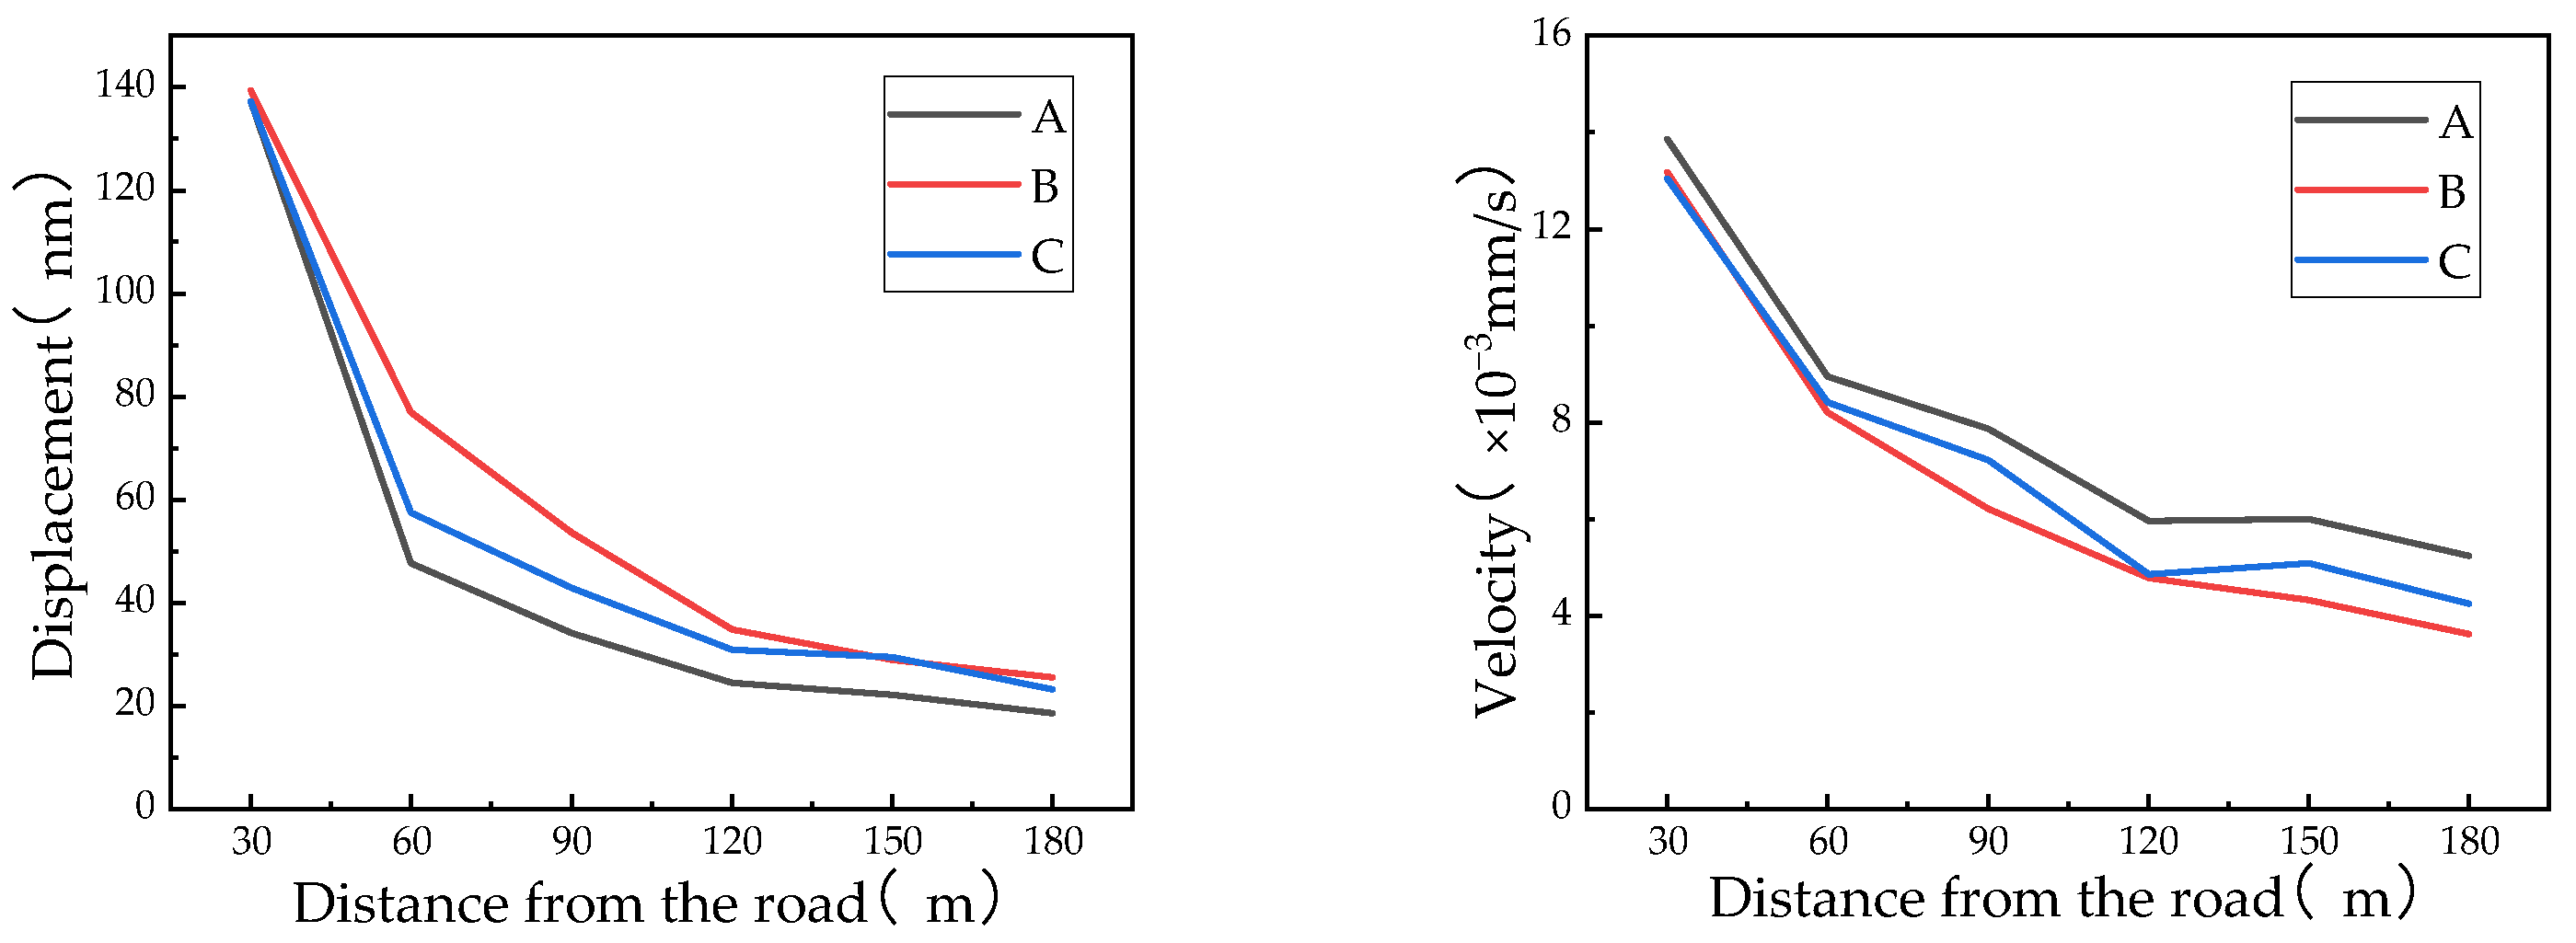
4.2.1. Time Domain
- (1)
- Under any working condition, the vibration time-domain results at the same test point exhibit little difference, indicating that the soil vibration response is less affected by the vehicle speed and type. The RMS of the time-domain analysis revealed that the influence of the vehicle speed and type on the vibration response is minimal, which is consistent with the above conclusion.
- (2)
- As the distance from the vibration source increases, the vibration in the soil attenuates, with the attenuation amplitude in the near field being significantly greater than that in the far field. This pattern arises because the geometric damping and material damping of the soil dissipate the energy of the vibration during propagation until the vibration reaches a point where the energy is almost completely dissipated.
- (3)
- Compared to that under the operating conditions of series A, the vibration velocity under the operating conditions of series B is significantly faster. This indicates that the site is sensitive to vehicle vibration; thus, vehicle vibration has a significant impact on the site and the instability of the soft soil foundation. To better design and plan the laboratory, it is necessary to comprehensively evaluate the safety of the site and carry out foundation treatments.
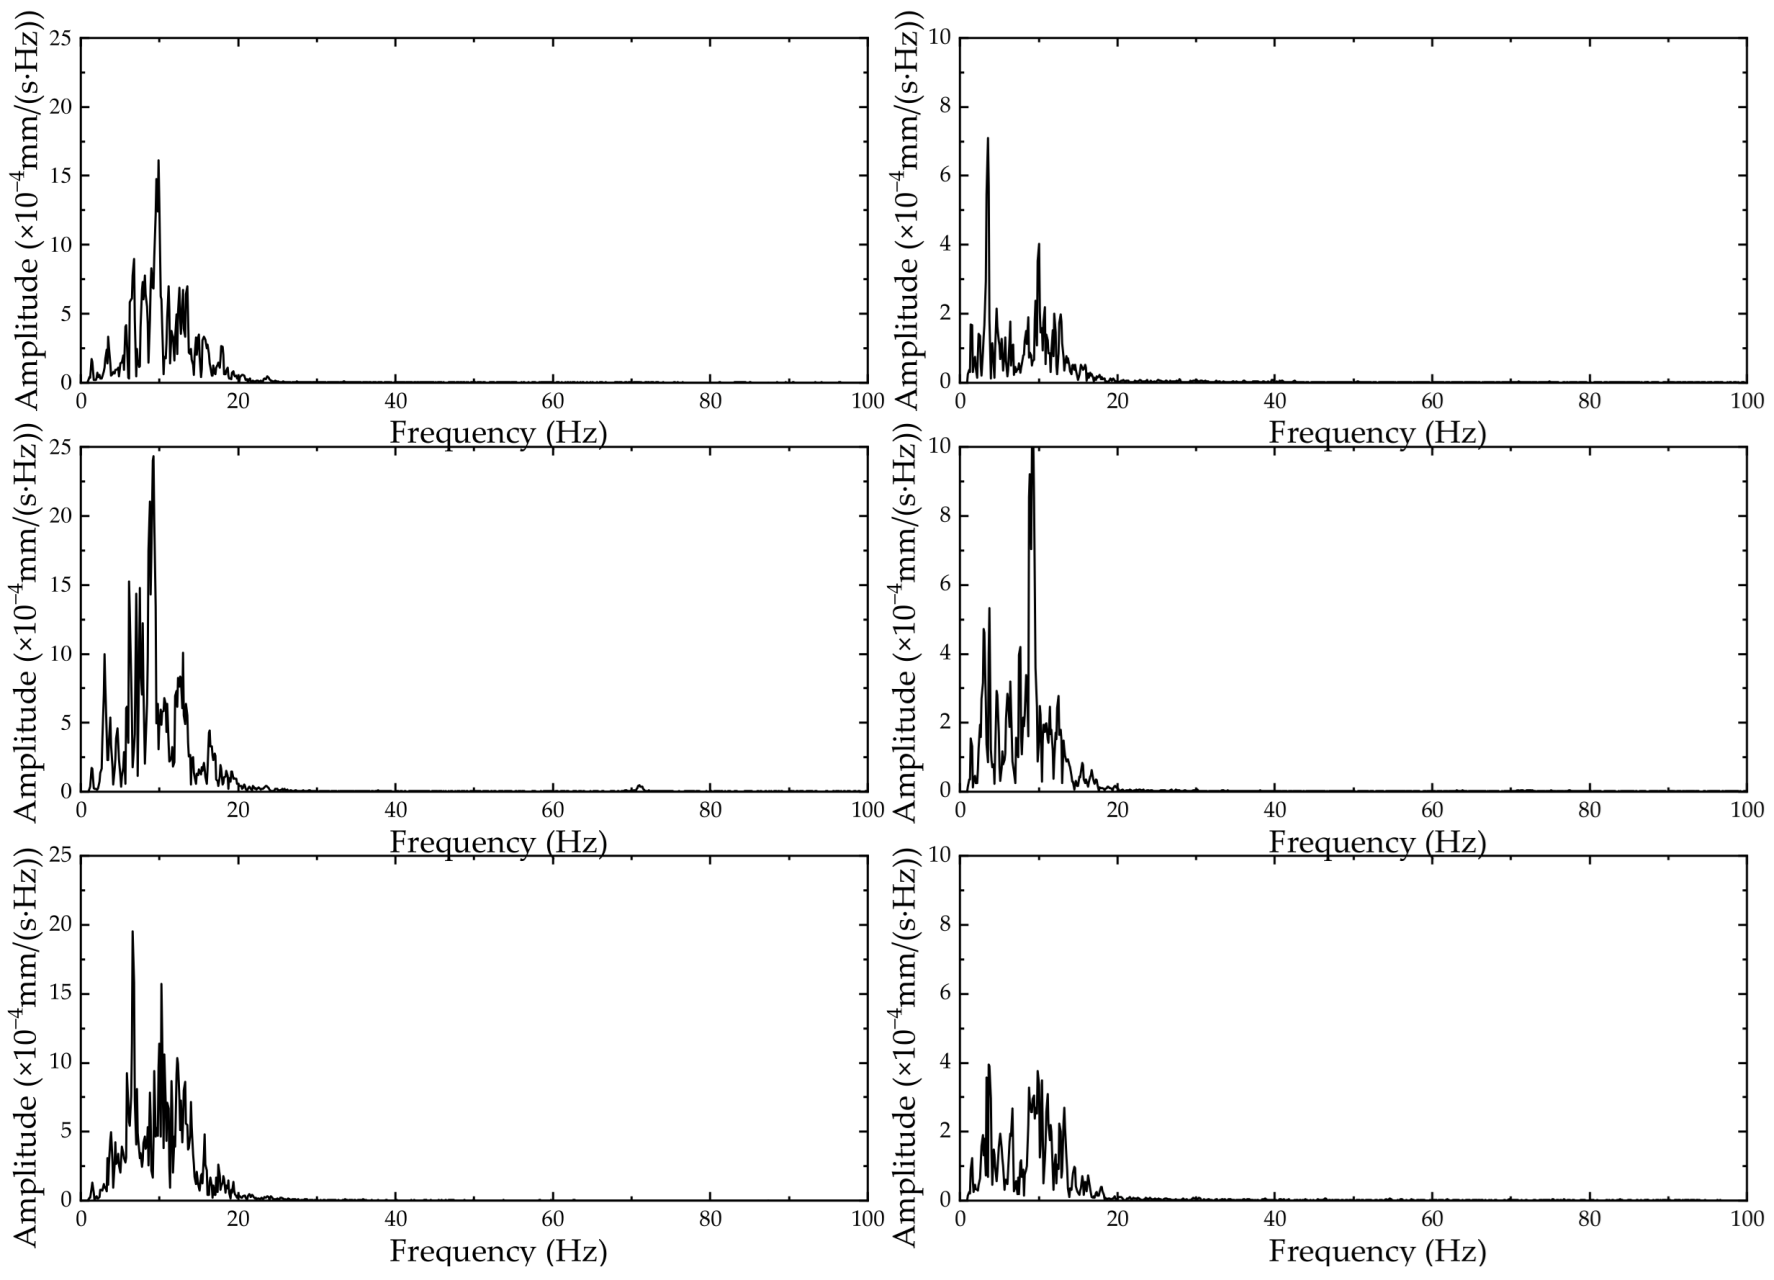
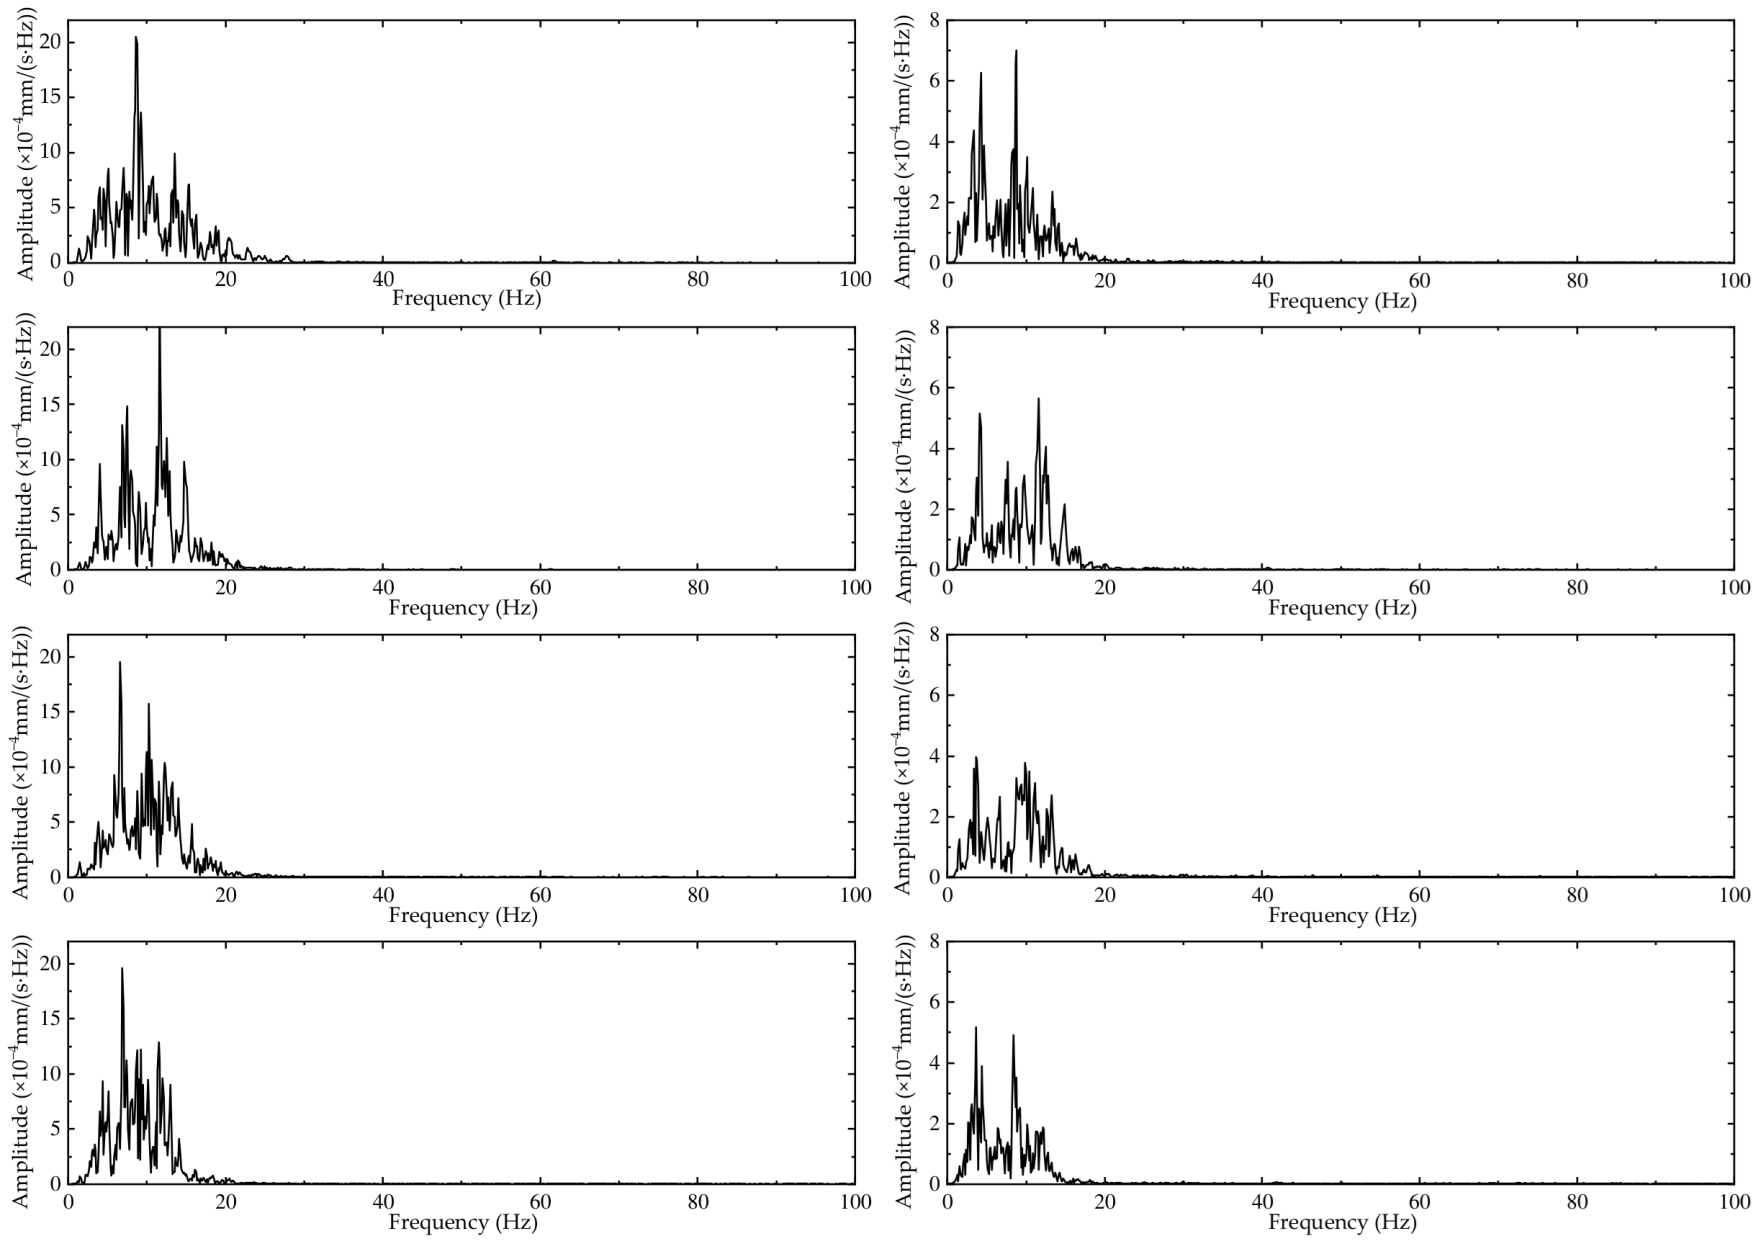
4.2.2. Frequency Domain
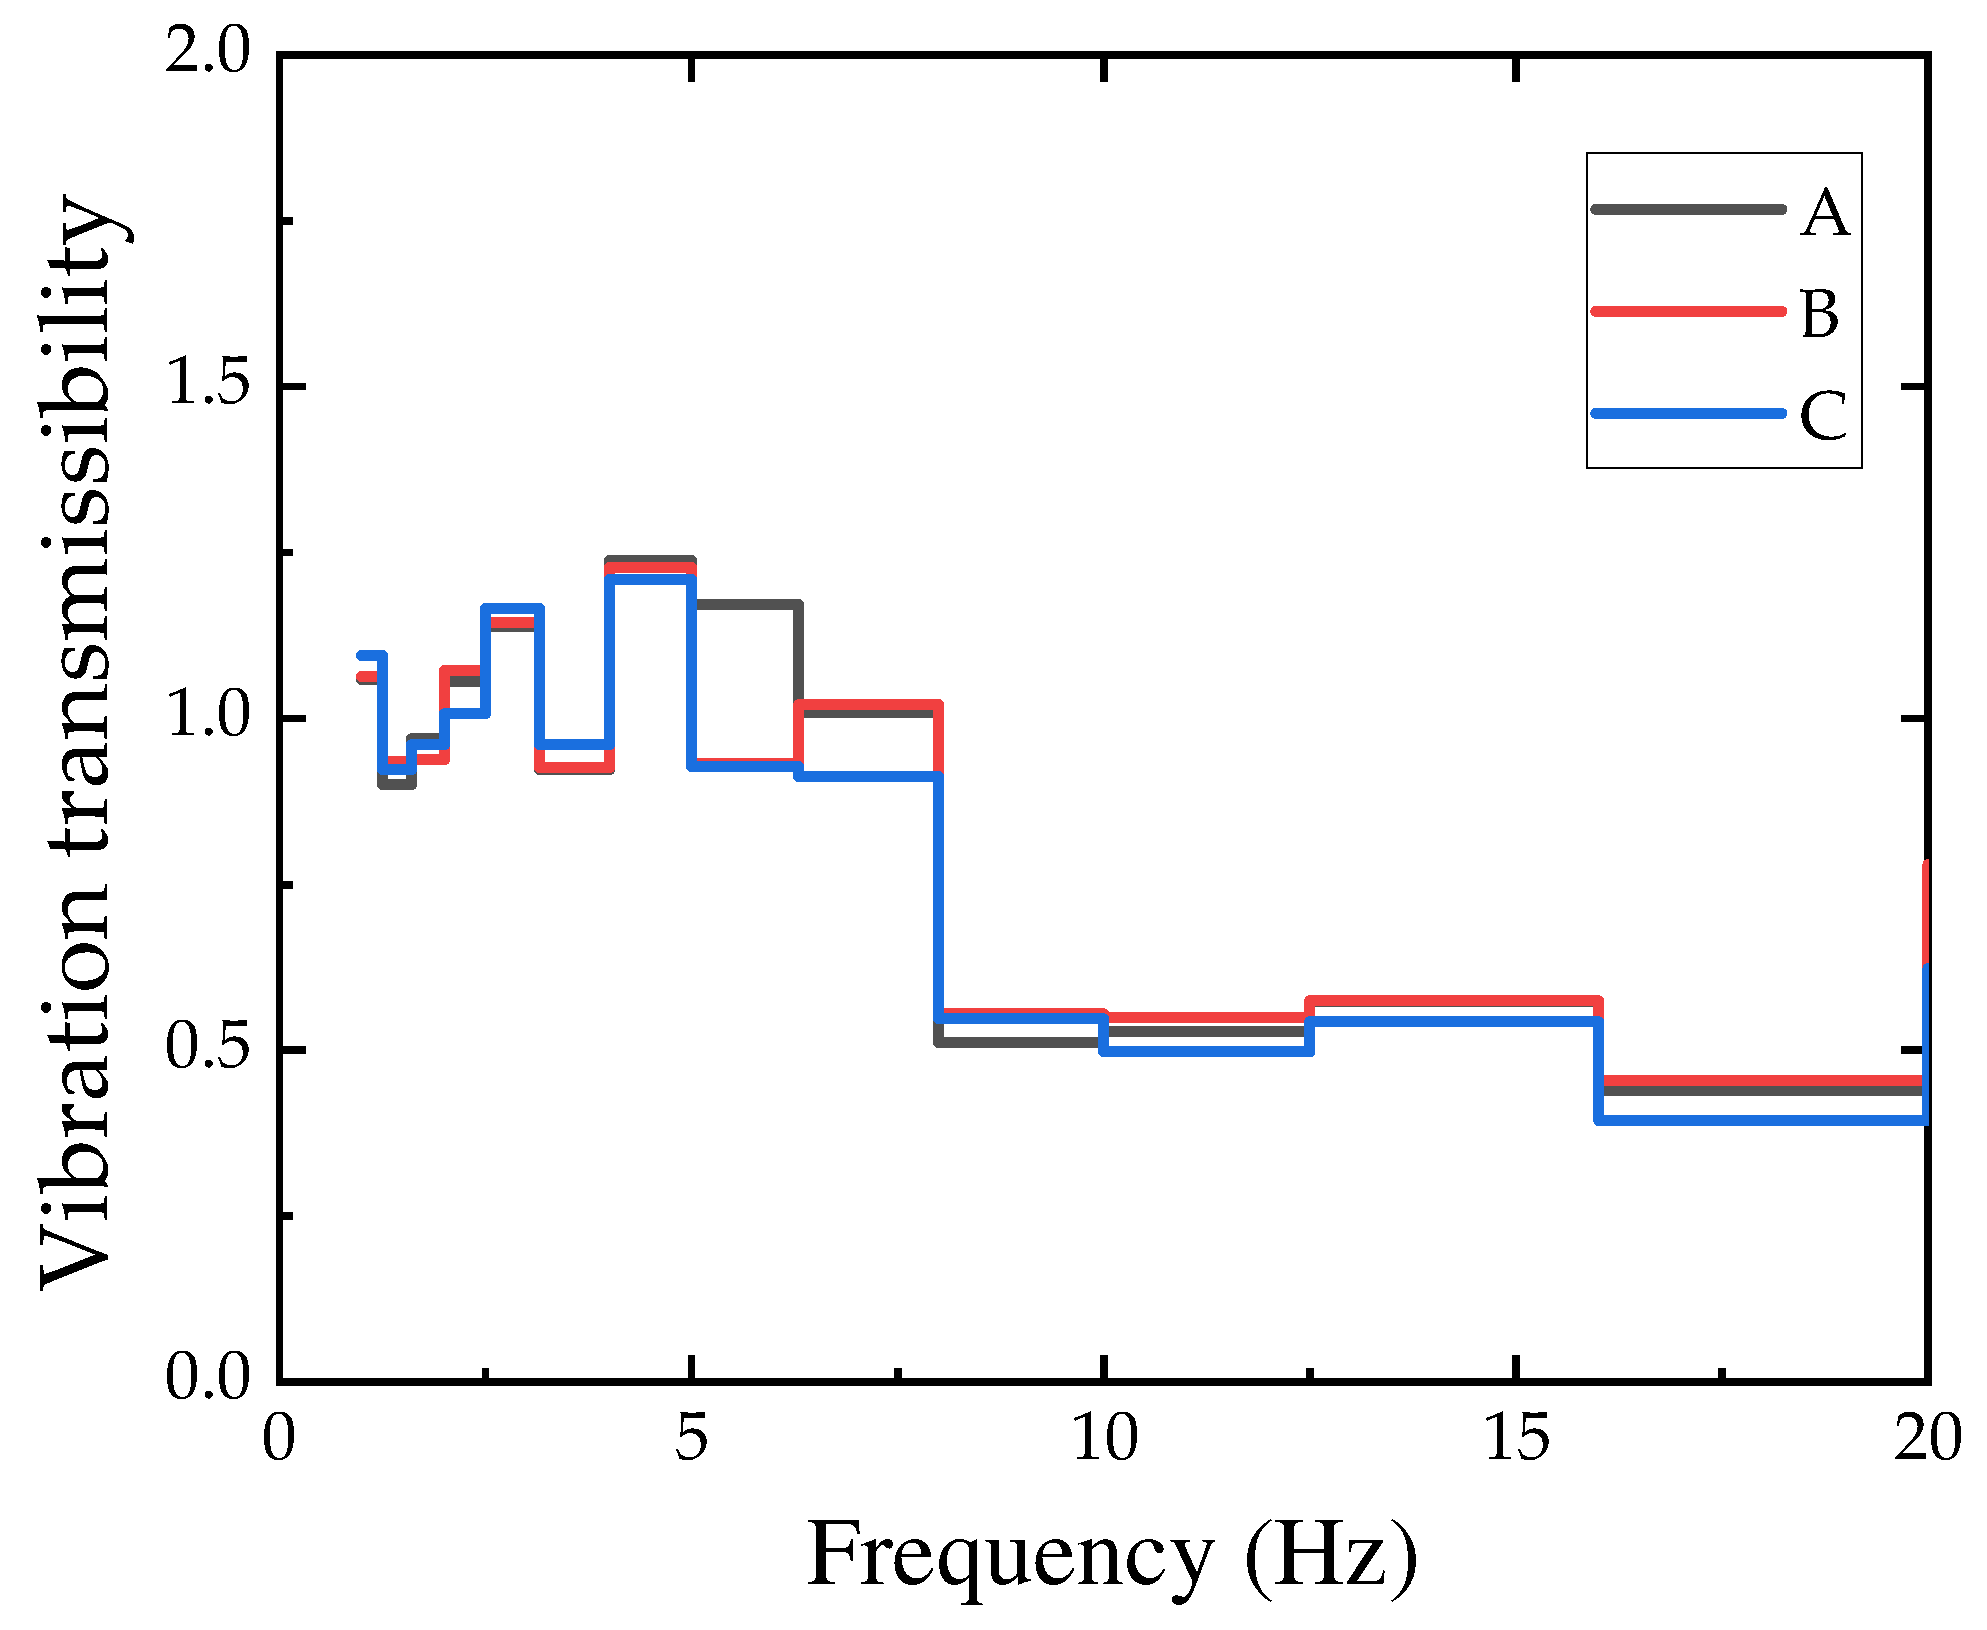
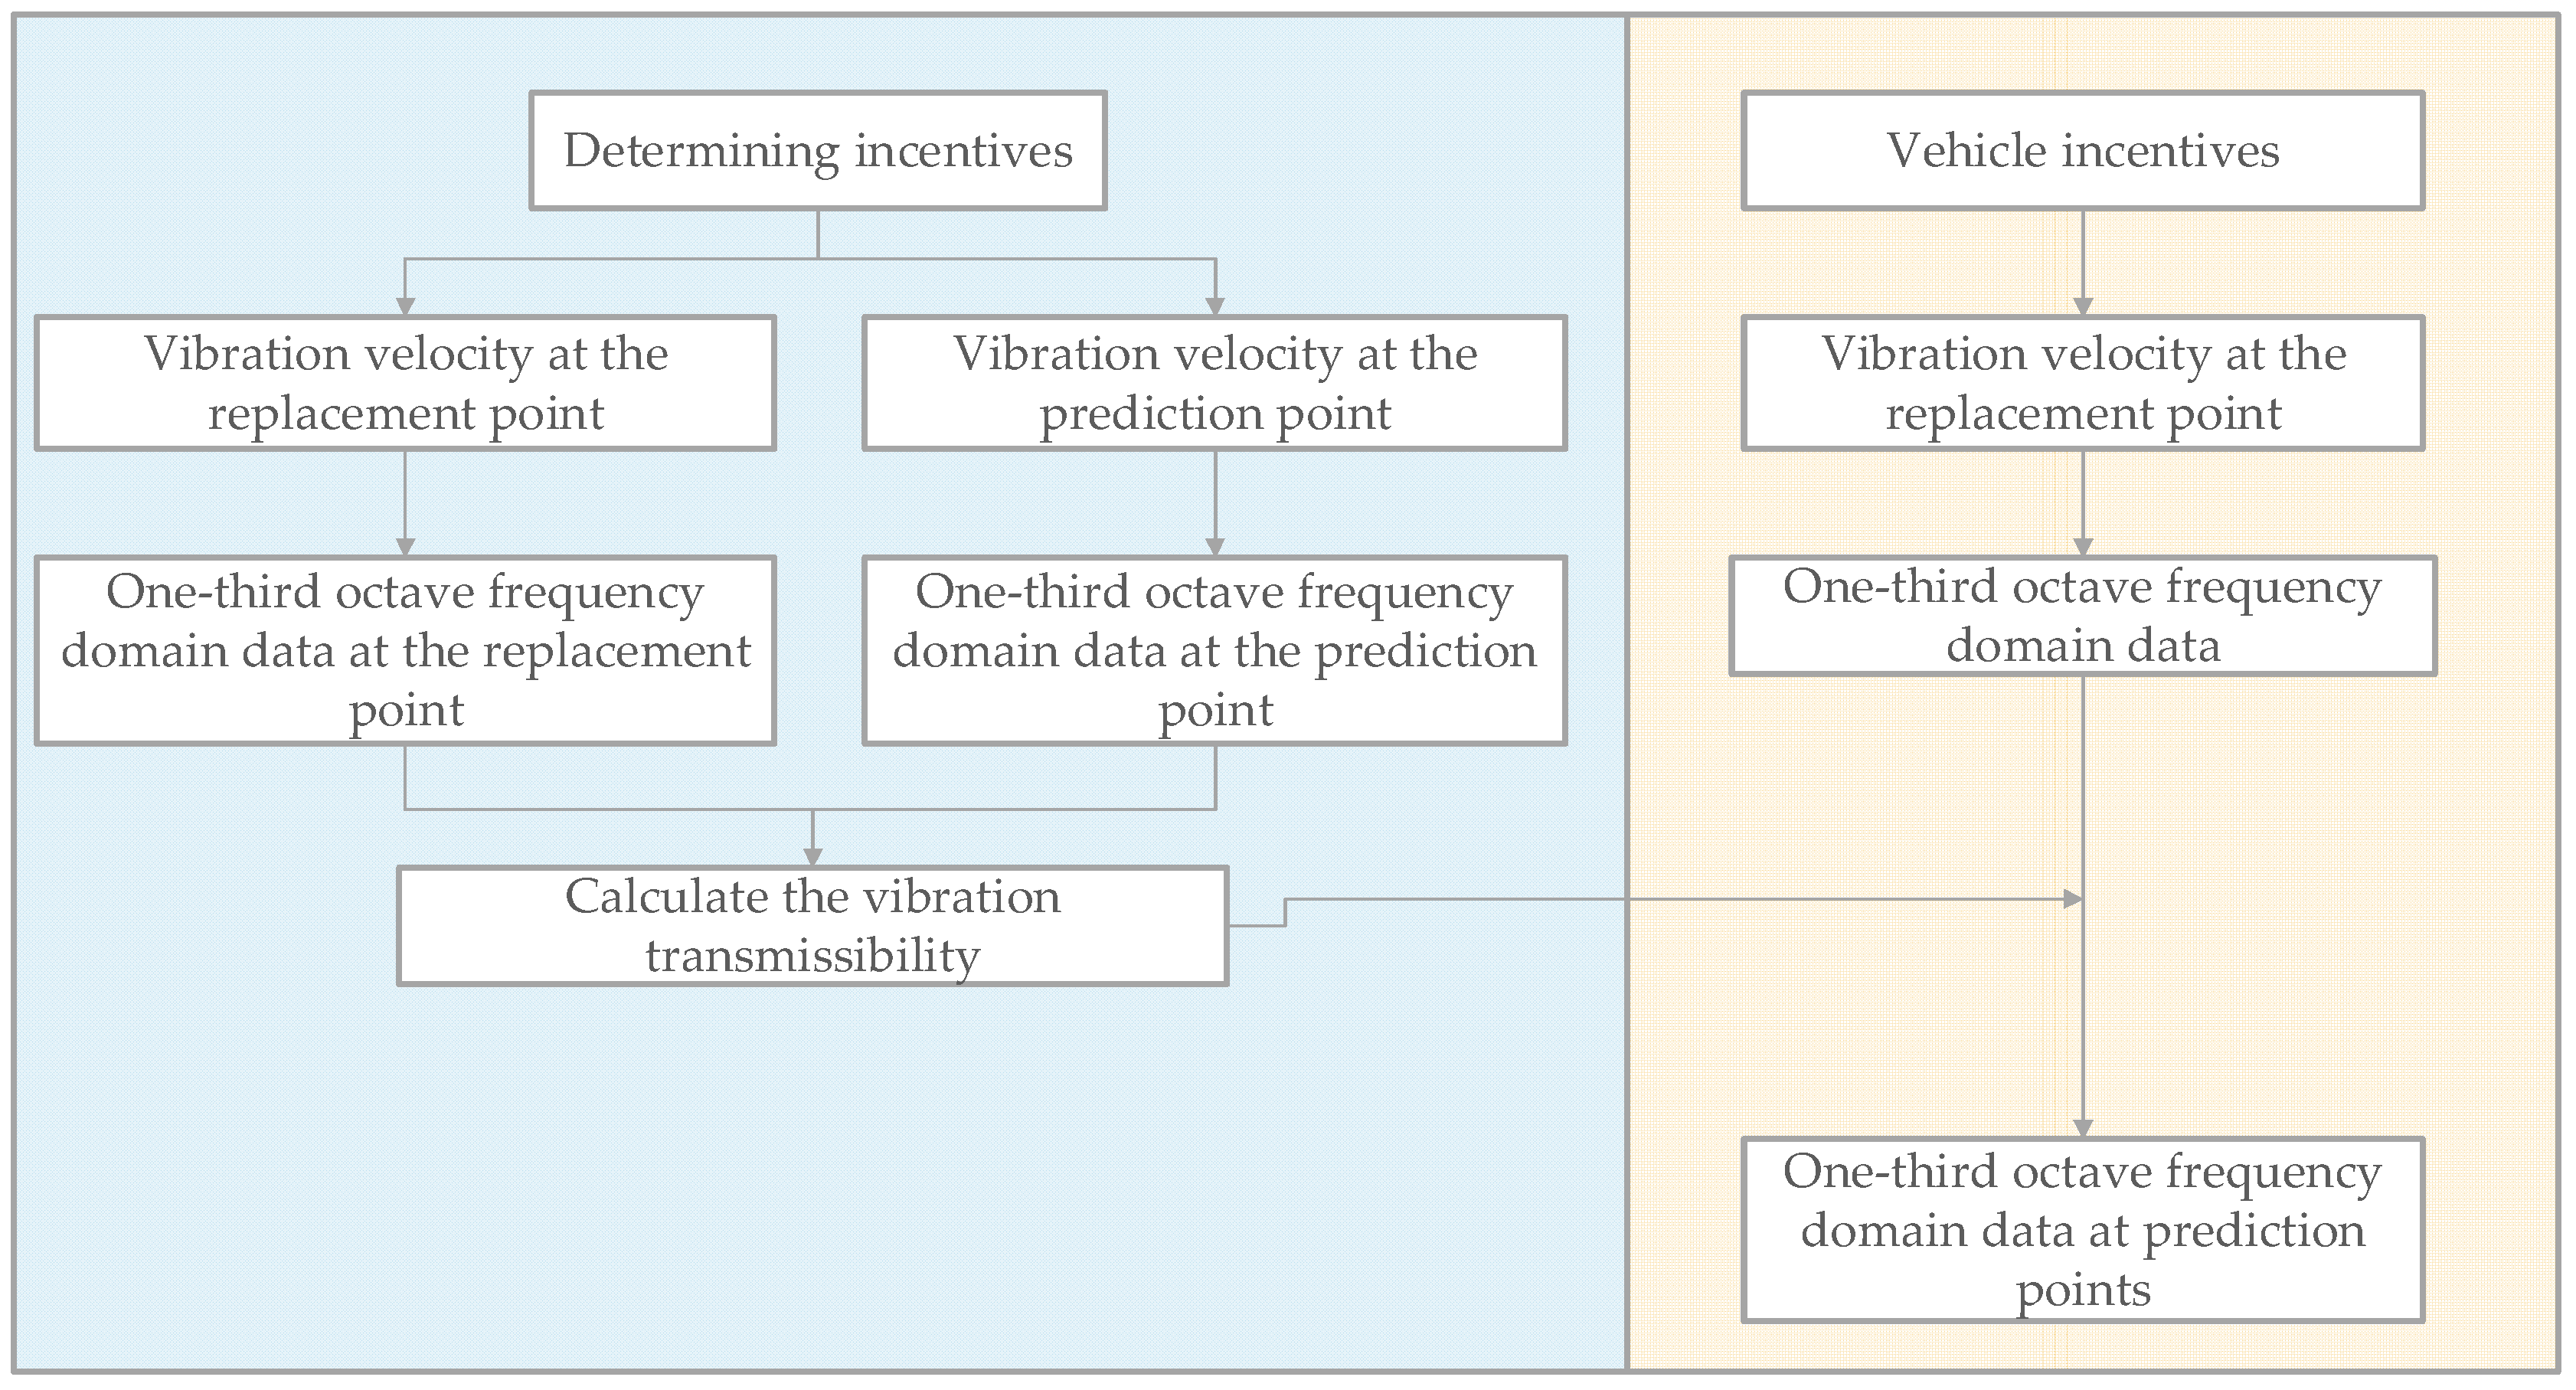
4.2.3. Vibration Transmissibility
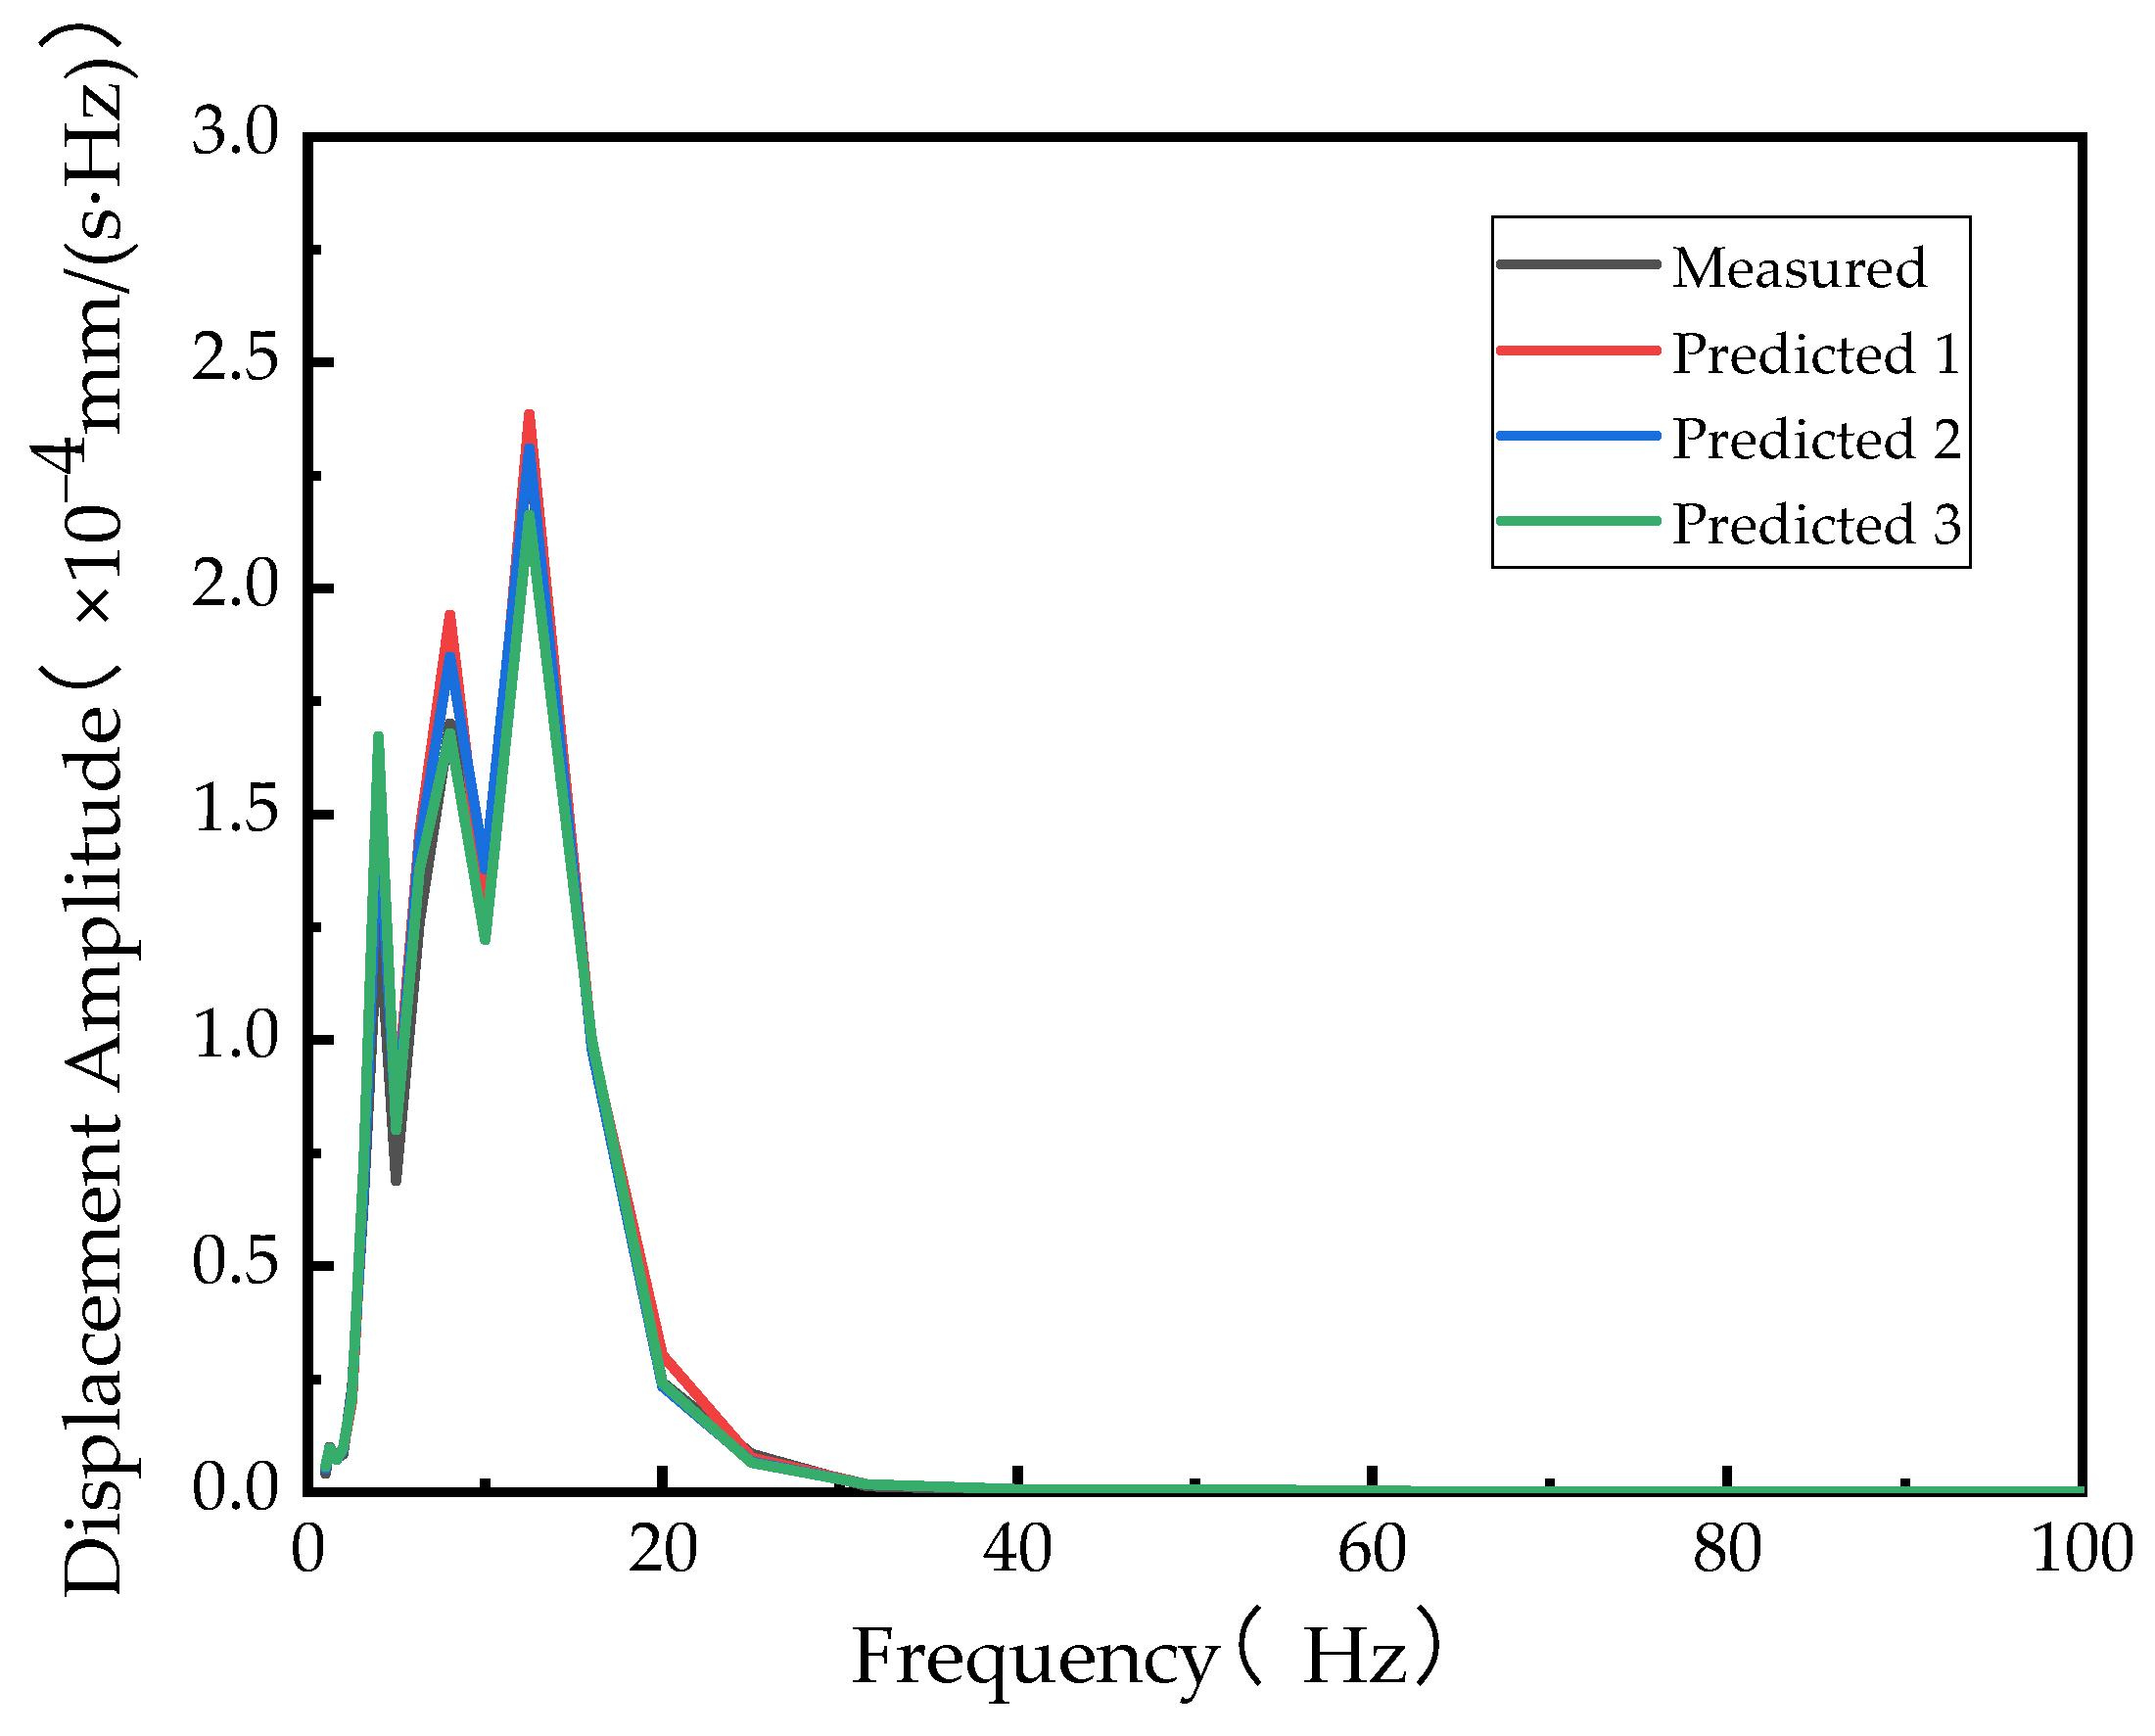
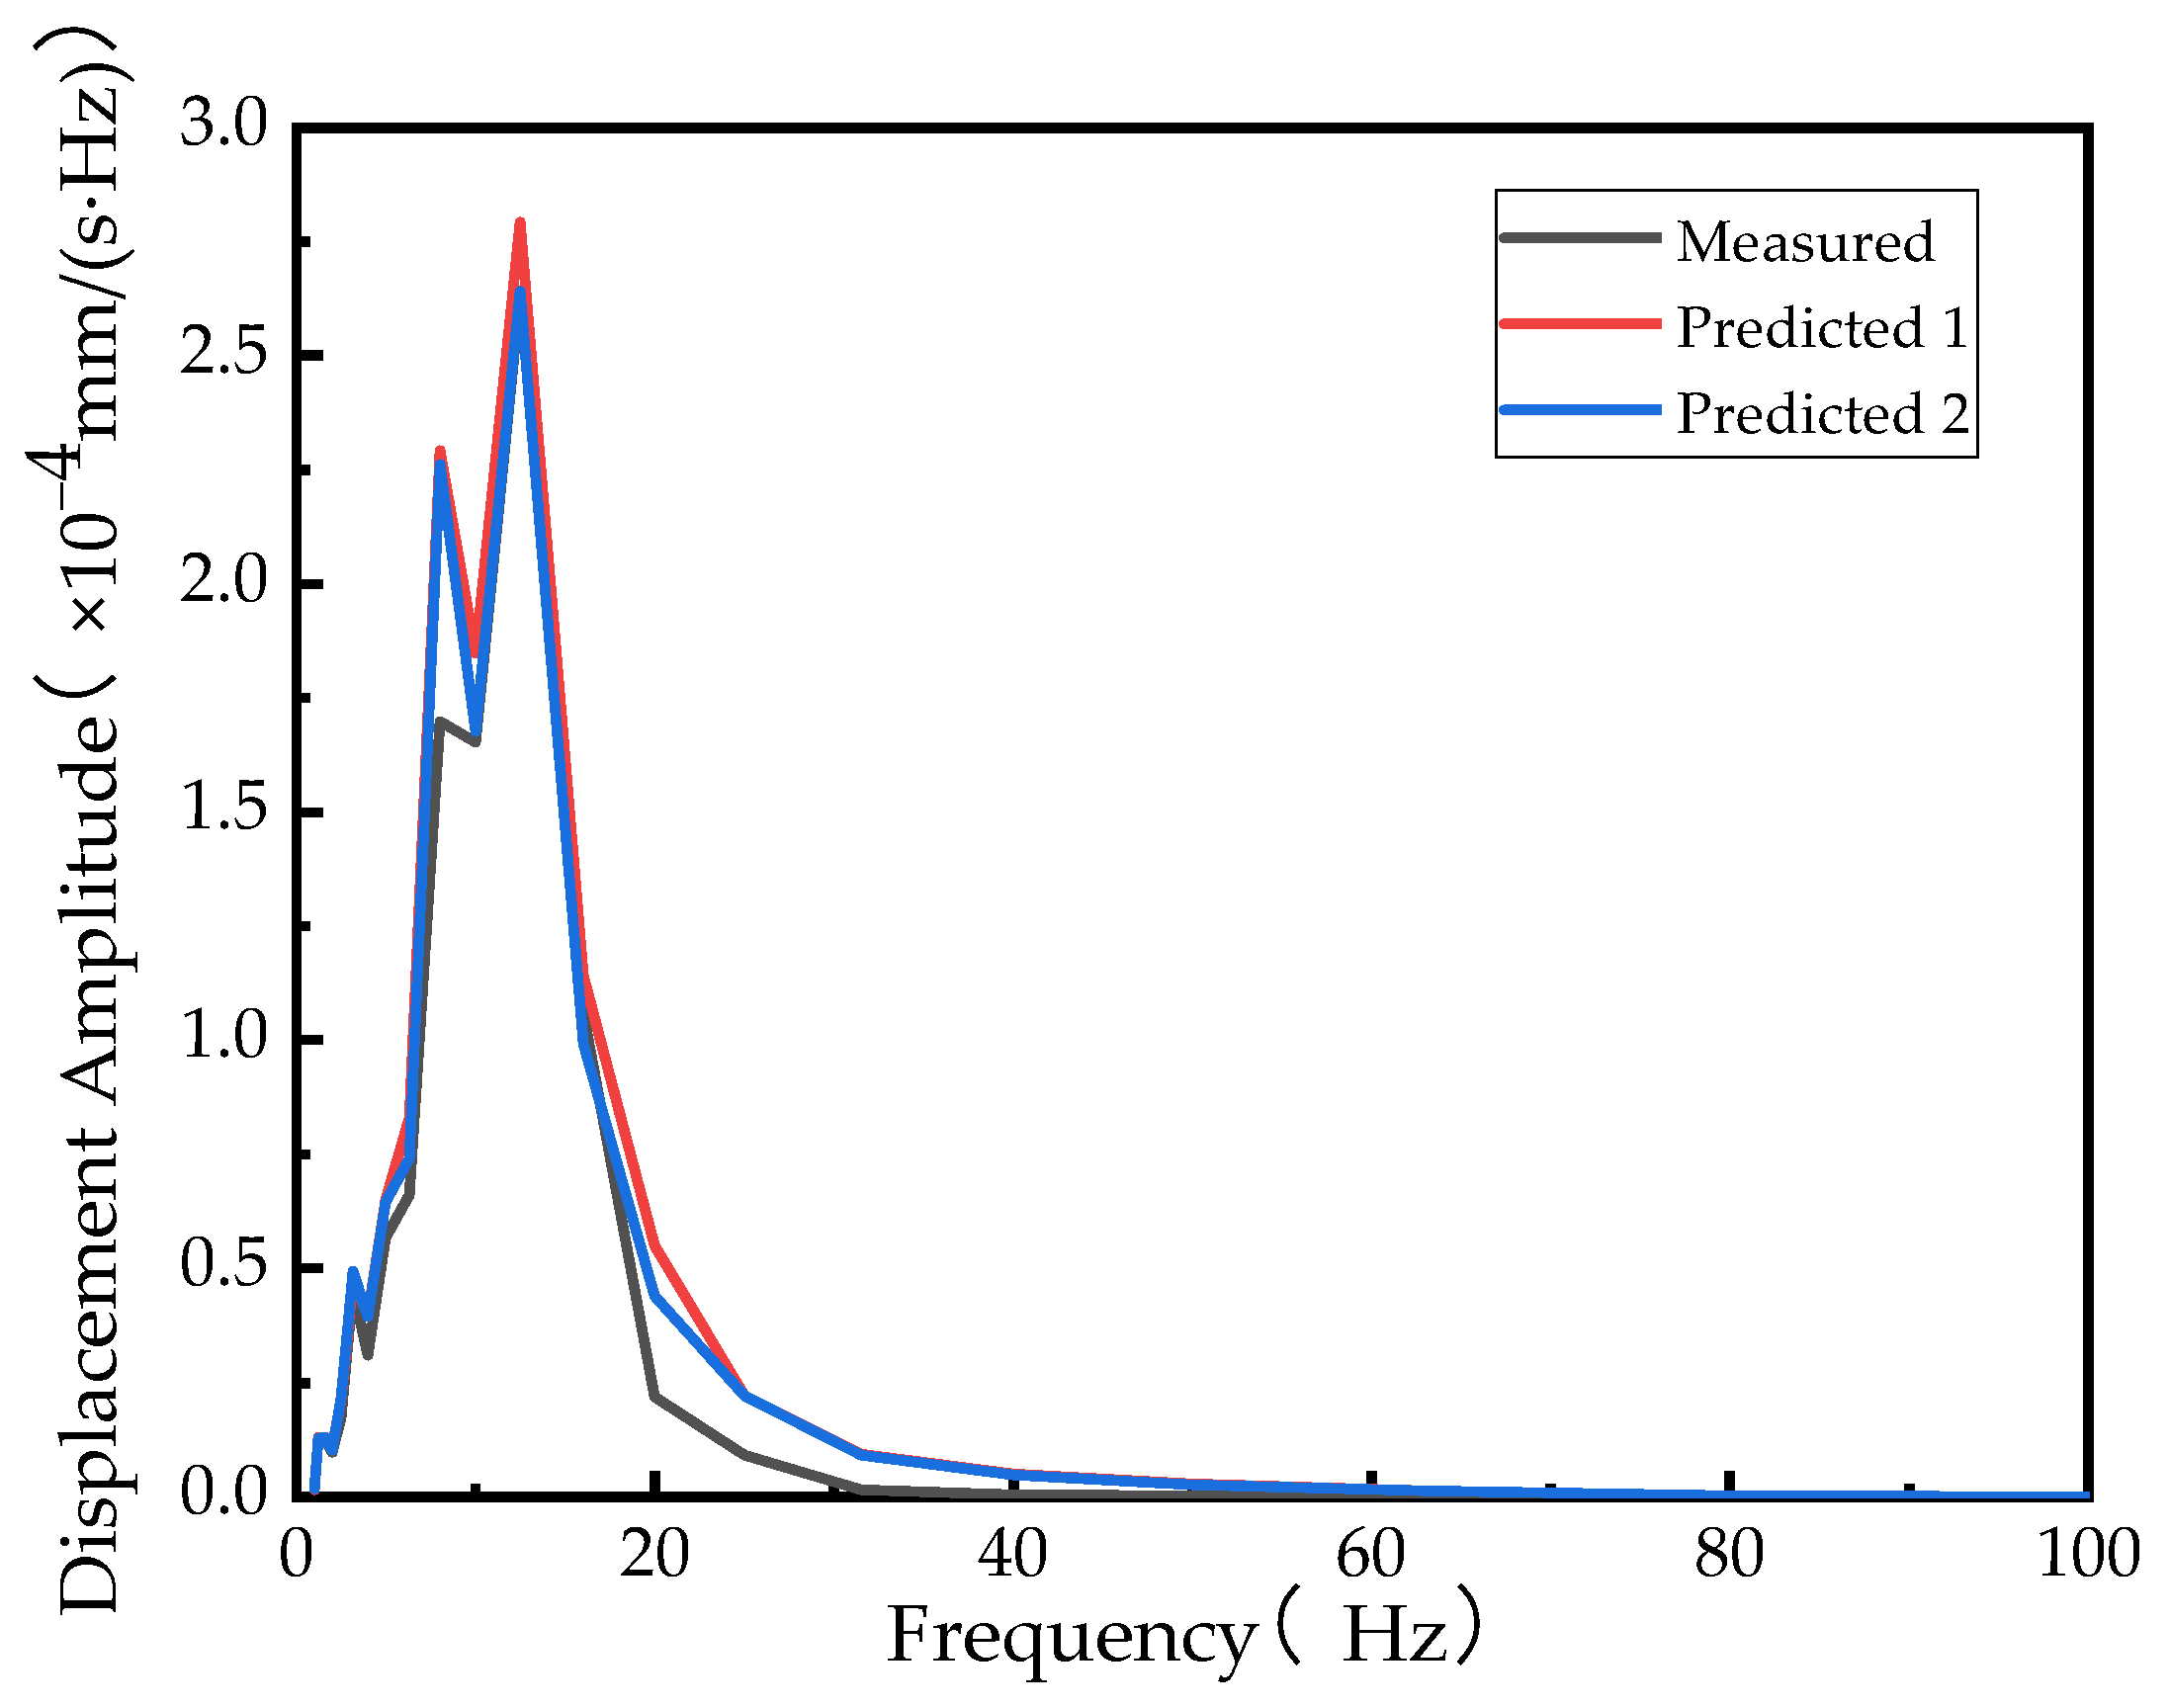
4.3. Prediction of Soil Vibrations with a Vehicle Driving on a Road
5. Conclusions
- (1)
- The vibration response of soft soil foundations under traffic loads is primarily characterized by low frequencies. To prevent vibrations from affecting the progress of experiments, appropriate reinforcement measures should be taken to effectively reduce the transmission of vibration to the foundation. However, conventional foundation treatment methods may not necessarily be suitable for this specific type of foundation; hence, further research on vibration control for soft soil foundations is necessary in the future.
- (2)
- Under traffic loads, the vibration response of soft soil foundations is prone to resonance at the natural frequency of the foundations. Therefore, this issue needs to be considered in the planning of construction sites and the control of traffic in nearby areas.
- (3)
- The transmissibility between fixed points remains constant with changes in vehicle type and speed. The effectiveness and accuracy of the vibration prediction method based on transmissibility have been verified, providing guidance for the implementation and design of soft soil foundations, offering direction for microvibration control, and suggesting layouts for subsequent laboratory setups.
Author Contributions
Funding
Institutional Review Board Statement
Informed Consent Statement
Data Availability Statement
Conflicts of Interest
References
- Lamb, E.H. On the propagation of tremors over the surface of an elastic solid. Philos. Trans. R. Soc. Lond. 1904, 203, 1–43. [Google Scholar]
- Brownjohn, J.M.W.; Pan, T.C.; Middleton, C. Floor vibration serviceability in a multistory factory building. J. Perform. Constr. Facil. 2016, 30, 203–216. [Google Scholar] [CrossRef]
- Lee, C.; Wang, Y. Assessment of Floor Micro-Vibrations Induced by Moving Vehicles in High Technology Factories Using a Fragility-Based Method. IOP Conf. Ser. Earth Environ. Sci. 2019, 283, 67–74. [Google Scholar] [CrossRef]
- Yuan, Z.; Zhang, Z.; Zeng, L. Key technologies in active micro-vibration isolation systems: Modeling, sensing, actuation, and control algorithms. Measurement 2023, 222, 1–20. [Google Scholar] [CrossRef]
- Verhas, H.P. Prediction of the propagation of train-induced ground vibration. J. Sound Vib. 1979, 66, 371–376. [Google Scholar] [CrossRef]
- Kurzweil, L.G. Ground-borne noise and vibration from underground rail systems. J. Sound Vib. 1979, 66, 363–370. [Google Scholar] [CrossRef]
- Cui, Z.; Ji, Z. Discussion on the prediction of the impact of vibration on the ground environment in metro tunnels. Noise Vib. Control 1996, 9–14. [Google Scholar]
- Gu, X.; Liu, X. An analysis of metro environmental vibration prediction methods. Environ. Eng. 1996, 35–39. [Google Scholar]
- Xu, Z.; Ren, M.; Yang, Z. Environment Vibration Measurement and Analysis of First Line Guangzhou Subway. Environ. Technol. 2002, 12–14. [Google Scholar]
- Yang, X. Propagation and attenuation of man-made ground vibration. In Proceedings of the First Environmental Geotechnical Engineering Symposium, Shanghai, China, 15–18 June 2002; Tongji University Press: Shanghai, China, 2002; pp. 35–41. [Google Scholar]
- Melke, J. Noise and vibration from underground railway lines: Proposals for a prediction procedure. J. Sound Vib. 1988, 120, 391–406. [Google Scholar] [CrossRef]
- Ding, D. Study on Low Frequency Characteristics of Environmental Vibrations Due to Metro Trains. Master’s Thesis, Beijing Jiaotong University, Beijing, China, 2009. [Google Scholar]
- Zhang, H.; Yang, J.; Sun, G. Numerical simulation and model prediction for environmental vibrations induced by metro operation. J. Southeast Univ. 2012, 42, 988–993. [Google Scholar]
- Sheng, X.; Jones, C.; Thompson, D.J. Ground vibration generated by a harmonic load moving in a circular tunnel in a layered ground. J. Low Freq. Nois Vib. Act. Control 2003, 22, 83–96. [Google Scholar] [CrossRef]
- Sheng, X.; Jones, C.; Thompson, D.J. A theoretical study on the influence of the track on train-induced ground vibration. J. Sound Vib. 2004, 272, 909–936. [Google Scholar] [CrossRef]
- Tassoulas, J.L.; Kausel, E. Elements for the numerical analysis of wave motion in layered media. Int. J. Numer. Methods Eng. 2010, 19, 1005–1032. [Google Scholar] [CrossRef]
- Kausel, E. Thin-layer method: Formulation in the time domain. Int. J. Numer. Methods Eng. 2010, 37, 927–941. [Google Scholar] [CrossRef]
- Degrande, G. Free field vibrations during the passage of a high speed train: Validation of a numerical model by means of experimental results. In Proceedings of the 13th ASCE Engineering Mechanics Division Conference, Baltimore, MA, USA, 13–16 June 1999. [Google Scholar]
- Bian, X. Dynamic Analyses of Ground and Tunnel Responses Due to High-Speed Train Moving Loads. Master’s Thesis, Zhejiang University, Hangzhou, China, 2005. [Google Scholar]
- Pan, C.; Xie, Z. Vibration Testing and Analysis of Trains in Metro Interval Tunnels. China Civ. Eng. J. 1990, 23, 21–28. [Google Scholar]
- Chua, K.H.; Lo, K.W.; Balendra, T. Building Response due to Subway Train Traffic. J. Geotech. Eng. 1995, 11, 747–754. [Google Scholar] [CrossRef]
- Watts, G.R. Traffic-Induced Ground-Borne Vibrations in Dwellings. Research Report-Transport and Road Research Laboratory. 1987. Available online: https://www.researchgate.net/publication/312620298_Traffic-induced_ground-borne_vibrations_in_dwellings (accessed on 14 April 2024).
- Yao, J. Research on Environmental Vibration Caused by Rail Transit and Vibration Isolation Measures Considering Soil-Structure Dynamic Interaction. Doctoral Dissertation, Beijing Jiaotong University, Beijing, China, 2010. [Google Scholar]
- Kouroussis, G.; Florentin, J.; Verlinden, O. Ground vibrations induced by InterCity/InterRegion trains: A numerical prediction based on the multibody/finite element modeling approach. J. Vib. Control 2016, 22, 4192–4210. [Google Scholar] [CrossRef]
- Zhang, C.; Zhang, N.; Zhang, Y.; Liu, X. Prediction of Traffic Vibration Environment of Ancient Wooden Structures Based on the Response Transfer Ratio Function. Sensors 2022, 22, 8414. [Google Scholar] [CrossRef]
- Hu, J.; Bian, X. Experimental and numerical studies on dynamic responses of tunnel and soils due to train traffic loads. Tunn. Undergr. Space Technol. 2022, 128, 104628. [Google Scholar] [CrossRef]
- Beena, K.S.; Sandeep, M.N.; Indraratna, B.; Malisetty, R.S. Near-field vibrations in railway track on soft subgrades for semi high-speed trains. Transp. Eng. 2023, 12, 176–185. [Google Scholar] [CrossRef]
- Xie, W.; Gao, G.; Song, J. Prediction of ground vibration under combined seismic and high-speed train loads considering earthquake intensity and site category. Soils Found. 2024, 64, 101412. [Google Scholar] [CrossRef]
- Lombaert, G.; Degrande, G. The experimental validation of a numerical model for the prediction of the vibrations in the free field produced by road traffic. J. Sound Vib. 2003, 262, 309–331. [Google Scholar] [CrossRef]
- Ren, X.; Wu, J.; Tang, Y. Propagation and attenuation characteristics of the vibration in soft soil foundations induced by high-speed trains. Soil Dyn. Earthq. Eng. 2019, 117, 374–383. [Google Scholar] [CrossRef]
- Haghighi, E.; Pooshideh, S.M.; Ghadami, A. Building isolation against train-induced vibrations considering the effects of soil and structure: A numerical and experimental study. Soil Dyn. Earthq. Eng. 2023, 175, 108251. [Google Scholar] [CrossRef]
- Liang, T.; Li, T.; Dong, R. Research on the Attenuation of Vibration Waves Generated by Highway Vehicles. J. Jilin Univ. 2003, 33, 382–386. [Google Scholar]
- Hassan, O. Building Acoustics and Vibration: Theory and Practice; World Scientific: Singapore, 2009. [Google Scholar]
- Shi, C.; Ren, Q. Testing and Analysis of Micro-vibration at a High-tech Plant Site. China Water Transp. 2021, 21, 157–158. [Google Scholar]
- Wang, Q.; Jia, J.; Yang, J. Research on micro-vibration control of scientific installations in soft soil foundations. Build. Struct. 2023, 53, 95–101. [Google Scholar]


| Number of Soil Layers | Average Thickness of Soil Layers (m) | Compressive Modulus 1 (MPa) | Bearing Capacity 2 (kPa) | Shear Wave Velocity 3 (m/s) |
|---|---|---|---|---|
| ① Plain fill | 0.5 | 4 | 70 | 120 |
| ② Mucky soil | 3.2 | 4.7 | 60 | 95 |
| ③ Silty clay | 15 | 11.9 | 180 | 230 |
| ④ Coarse sand | 3.6 | 20 | 230 | 280 |
| ⑤ Residual gravel clay soil | 1.5 | 12.2 | 200 | 260 |
| ⑥ Completely decomposed granite | 0.9 | 22 | 300 | 300 |
| ⑦ Weathered granite | 1.1 | 65.8 | 580 | 550 |
| ⑧ Moderately weathered granite | The burial depth of the top layer changes greatly | Excluding compression | 3000 | >800 |
| Number | Instruments Name | Photograph | Instrument Model | Parameter |
|---|---|---|---|---|
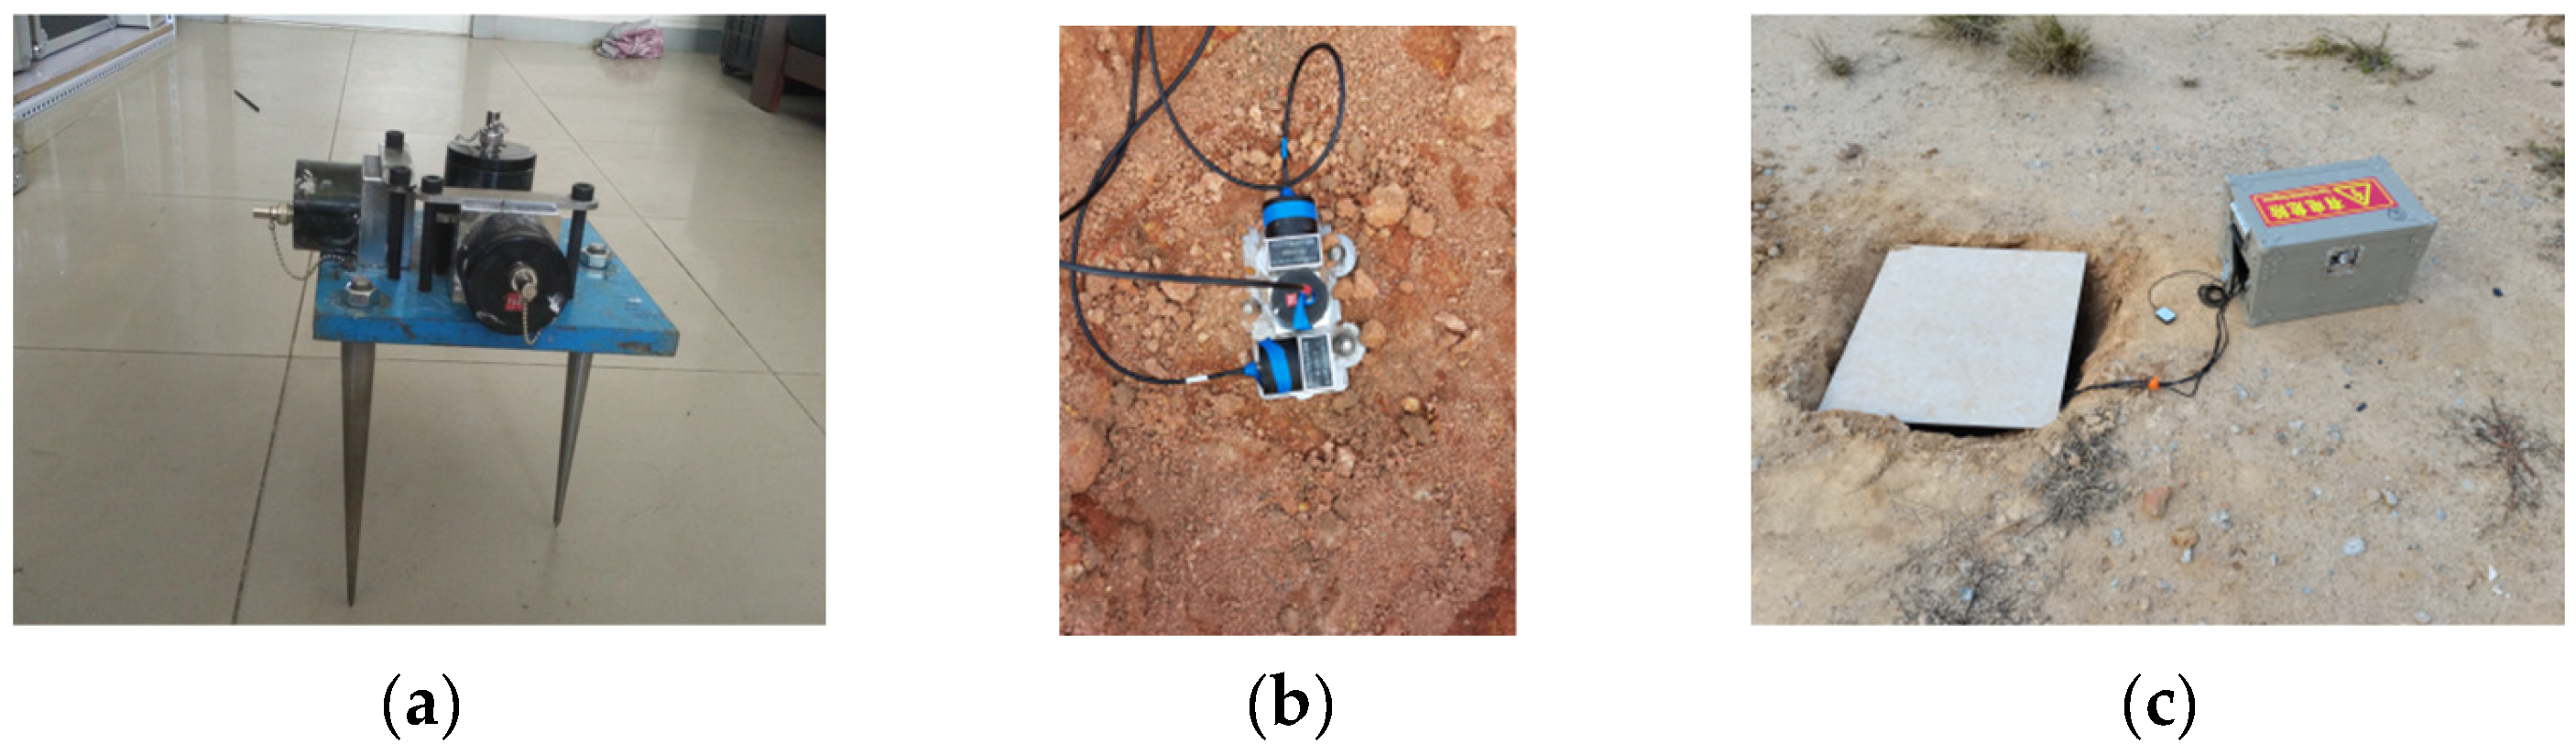
| 1 | vibration transducer | 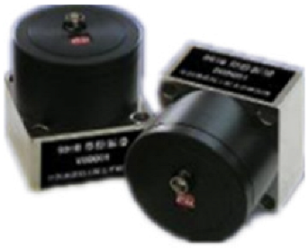 | 941B; Institute of Engineering Mechanics, CEA. | Sensitivity: 23v·s/m; Frequency response: 0.25–100 Hz. |
| 2 | data acquisition instrument |  | INV3062T; China Orient Institute of Noise & Vibration. | bit Delta-Sigma acquisition; 25–120 dB dynamic range; 4-channel parallel. |
| Vehicle Type | Photograph | Load |
|---|---|---|
| A |  | Lighter |
| B | 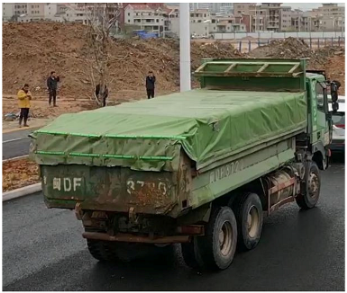 | Heavier |
| C | 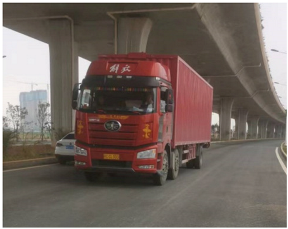 | Moderately heavy |
| Content | Series | Test Condition | Description |
|---|---|---|---|
| Vibration testing | A | Ground pulsation | Excellent frequency and amplitude of soil vibration due to ground pulsation at different depths, with no interference from other vibration sources in the test area. |
| B | Vibration response of soil under the influence of highway traffic loads | The vibration response and the attenuation characteristics under different traffic loads with no interference from other vibration sources in the site area. |
Disclaimer/Publisher’s Note: The statements, opinions and data contained in all publications are solely those of the individual author(s) and contributor(s) and not of MDPI and/or the editor(s). MDPI and/or the editor(s) disclaim responsibility for any injury to people or property resulting from any ideas, methods, instructions or products referred to in the content. |
© 2024 by the authors. Licensee MDPI, Basel, Switzerland. This article is an open access article distributed under the terms and conditions of the Creative Commons Attribution (CC BY) license (https://creativecommons.org/licenses/by/4.0/).
Share and Cite
Lin, J.; Zhang, N.; Zhang, Y. Study of the Prediction of Vibrations in Soft Soil Foundations Based on Field Tests. Sensors 2024, 24, 2564. https://doi.org/10.3390/s24082564
Lin J, Zhang N, Zhang Y. Study of the Prediction of Vibrations in Soft Soil Foundations Based on Field Tests. Sensors. 2024; 24(8):2564. https://doi.org/10.3390/s24082564
Chicago/Turabian StyleLin, Jiaxin, Nan Zhang, and Yunshi Zhang. 2024. "Study of the Prediction of Vibrations in Soft Soil Foundations Based on Field Tests" Sensors 24, no. 8: 2564. https://doi.org/10.3390/s24082564