
A Highly Sensitive Light-Induced Thermoelastic Spectroscopy Sensor Using a Charge Amplifier to Improve the Signal-to-Noise Ratio


Abstract
1. Introduction
2. Amplifier Design
3. Experimental Setup
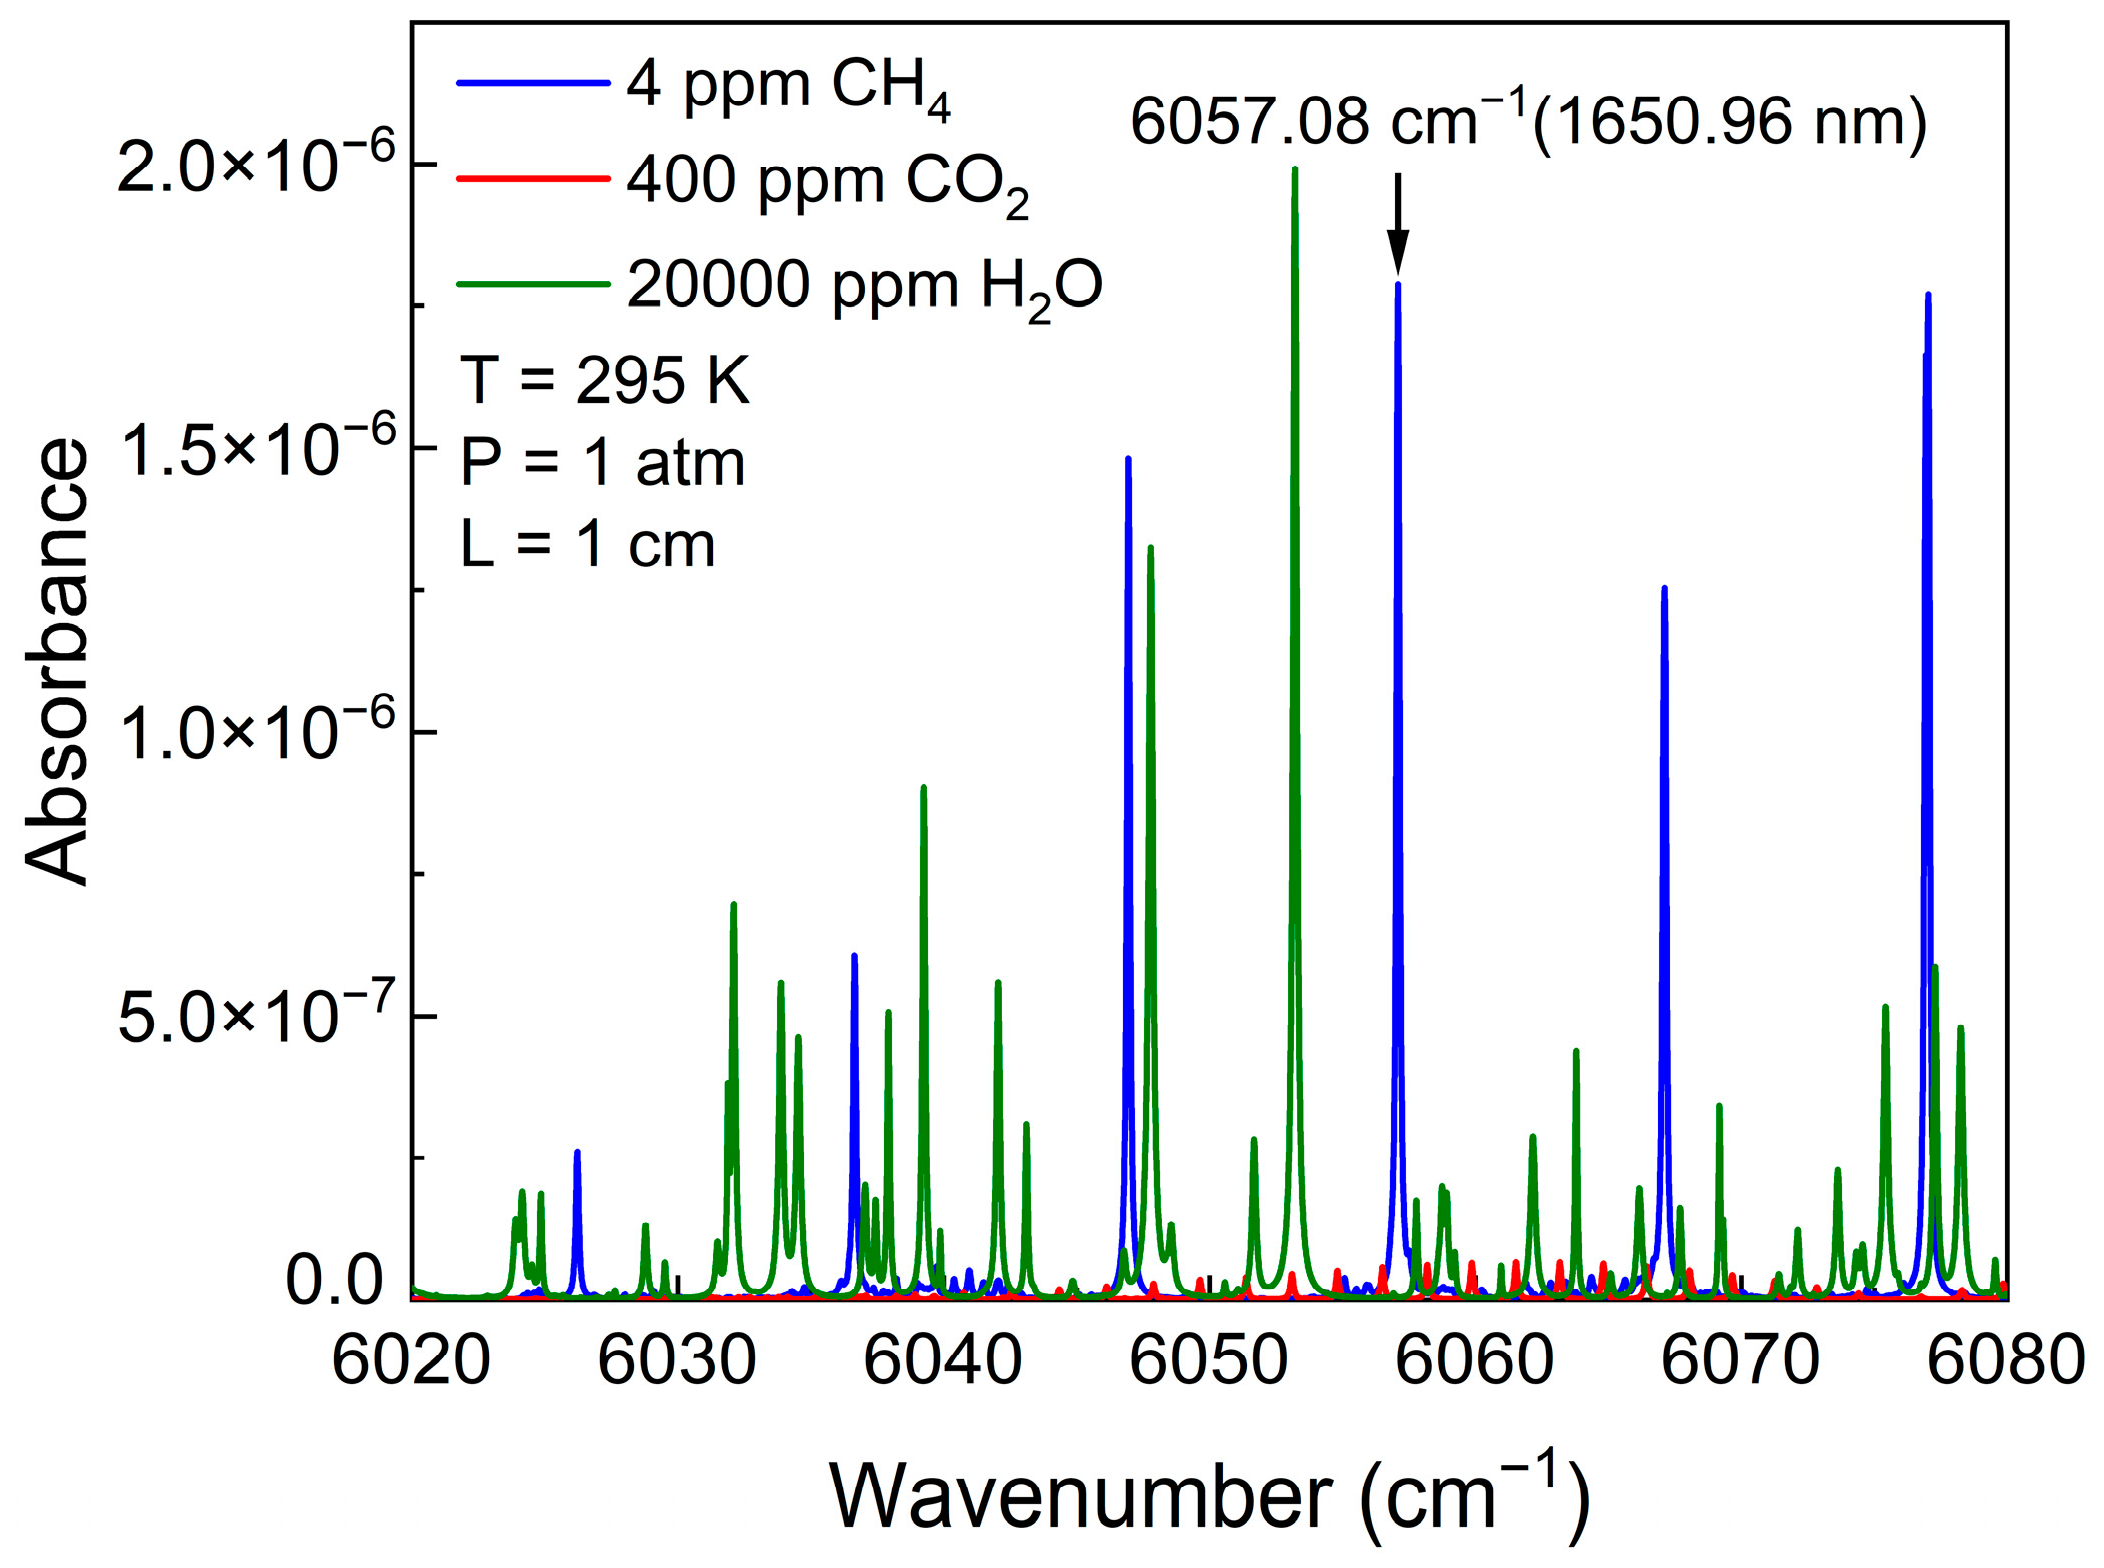
3.1. CH4 Absorption Line Selection
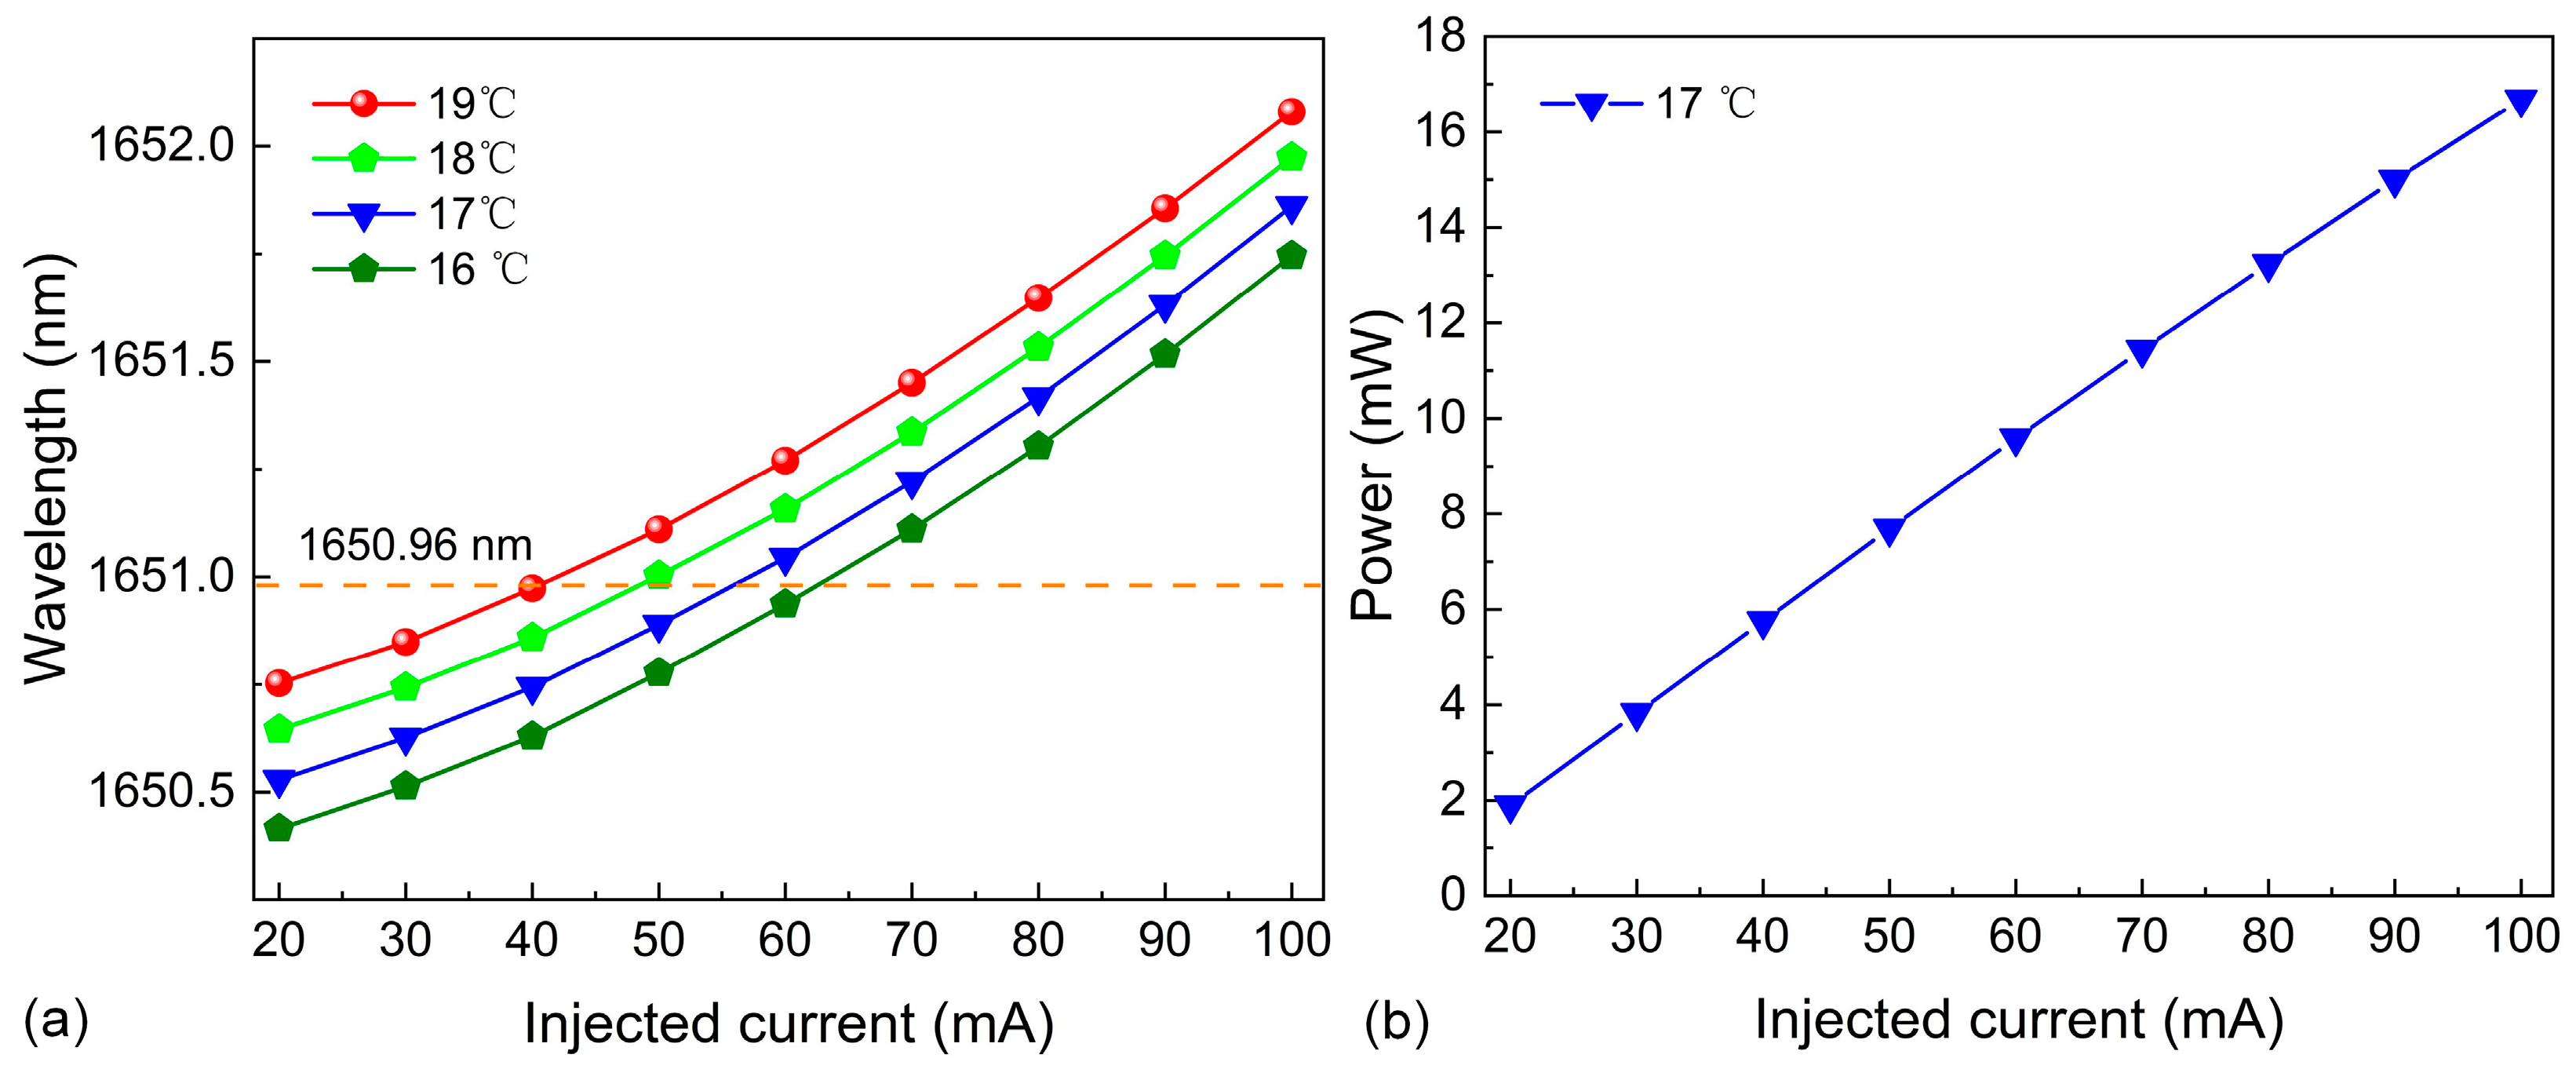
3.2. The Output Characteristics of DFB Diode Laser
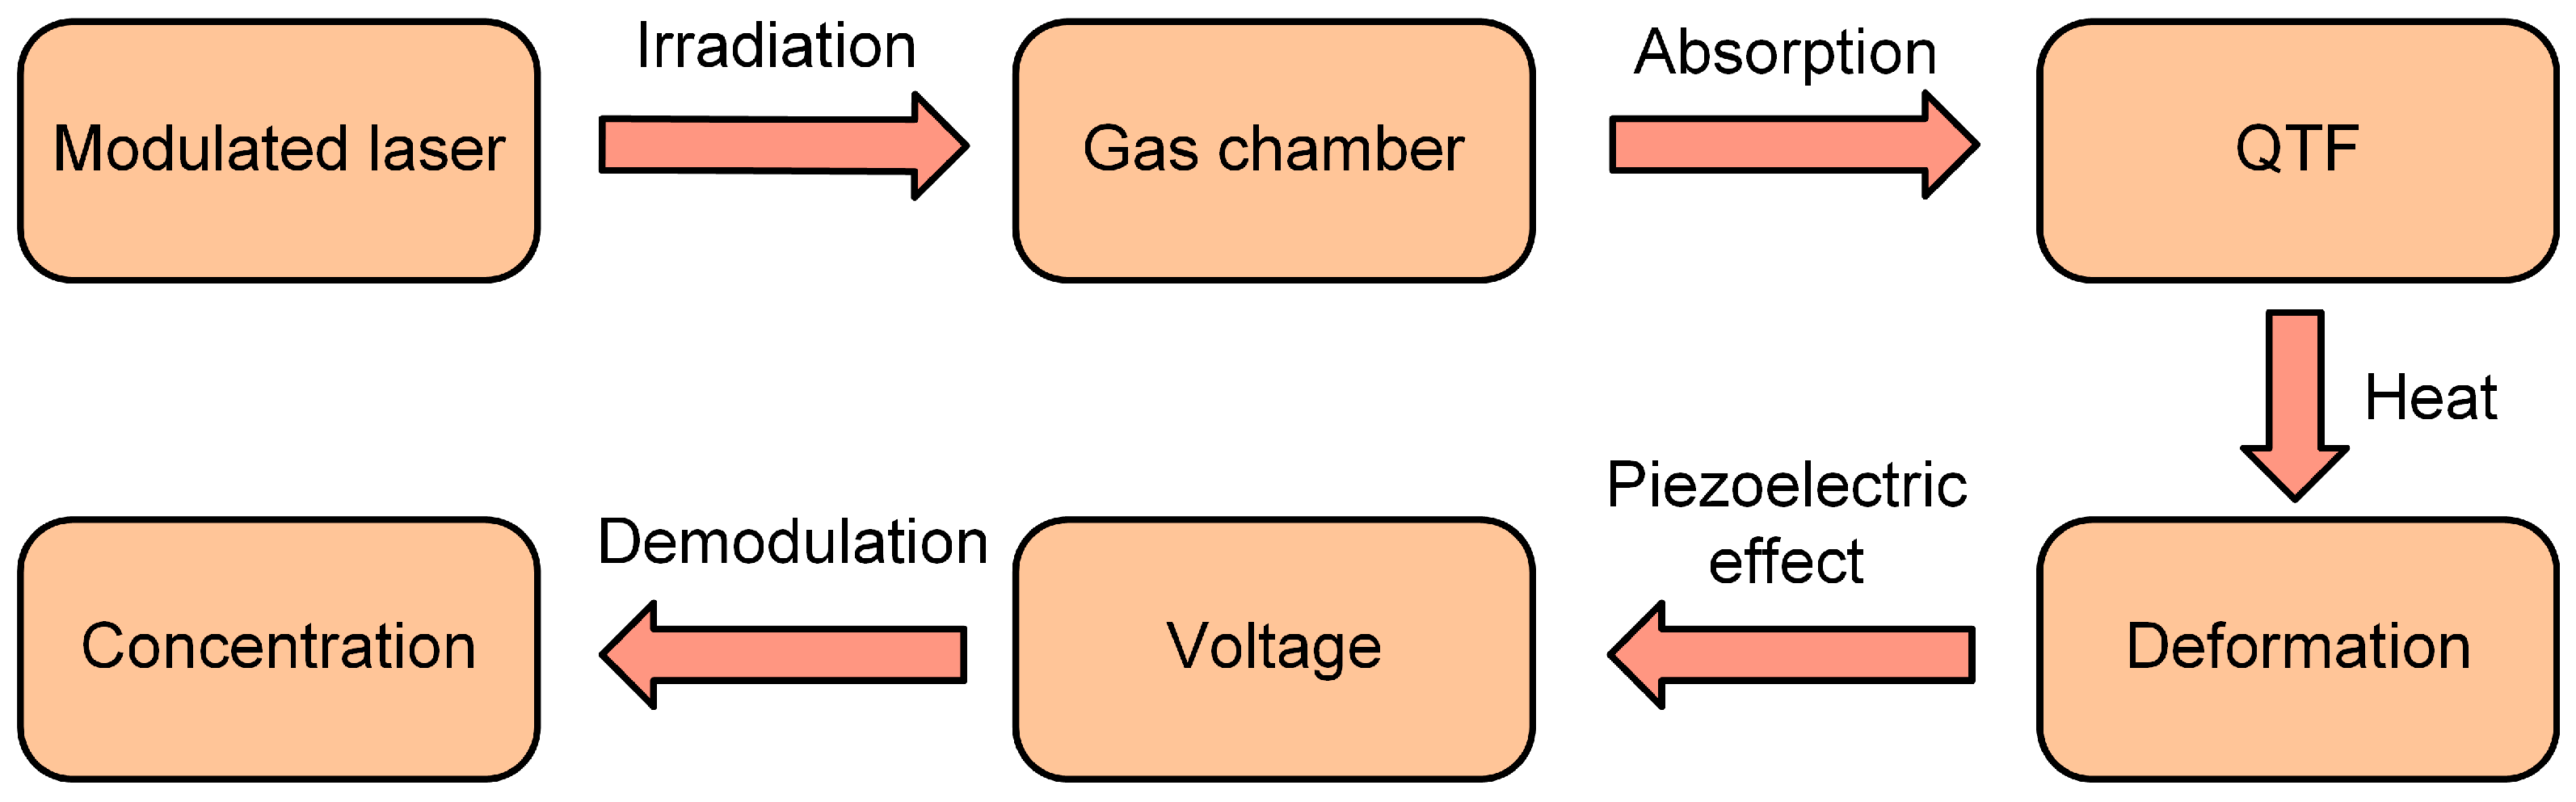
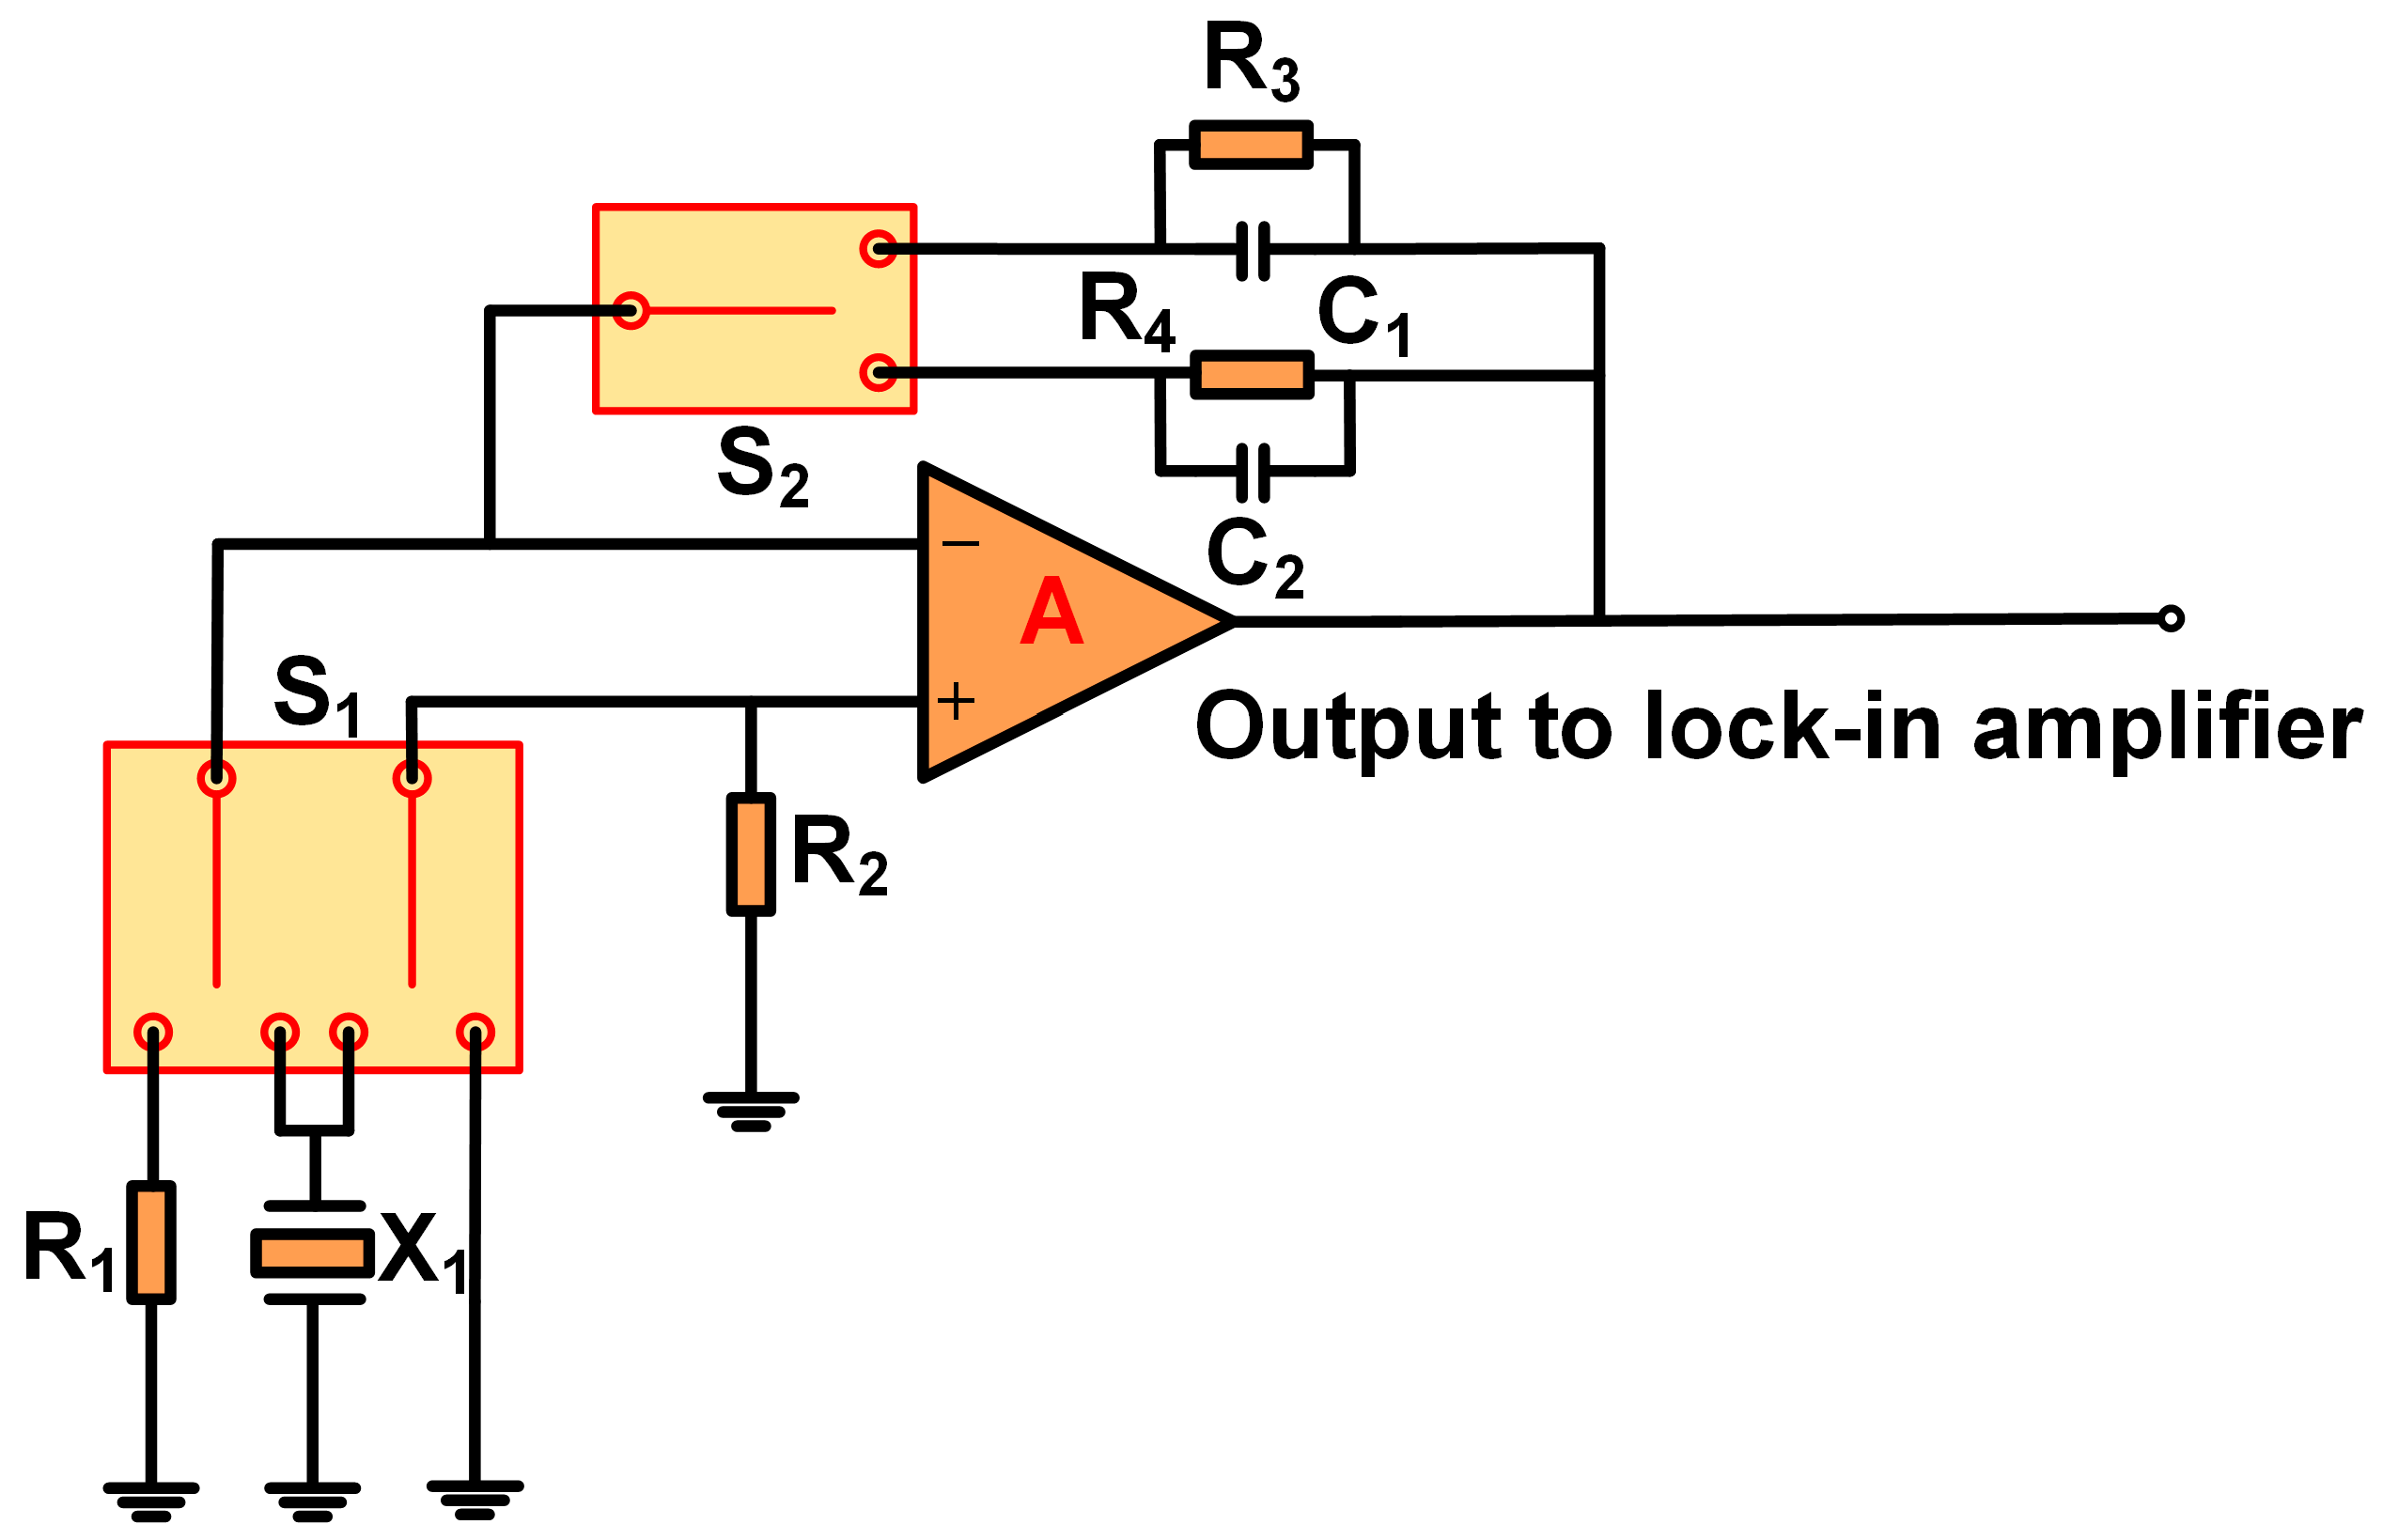
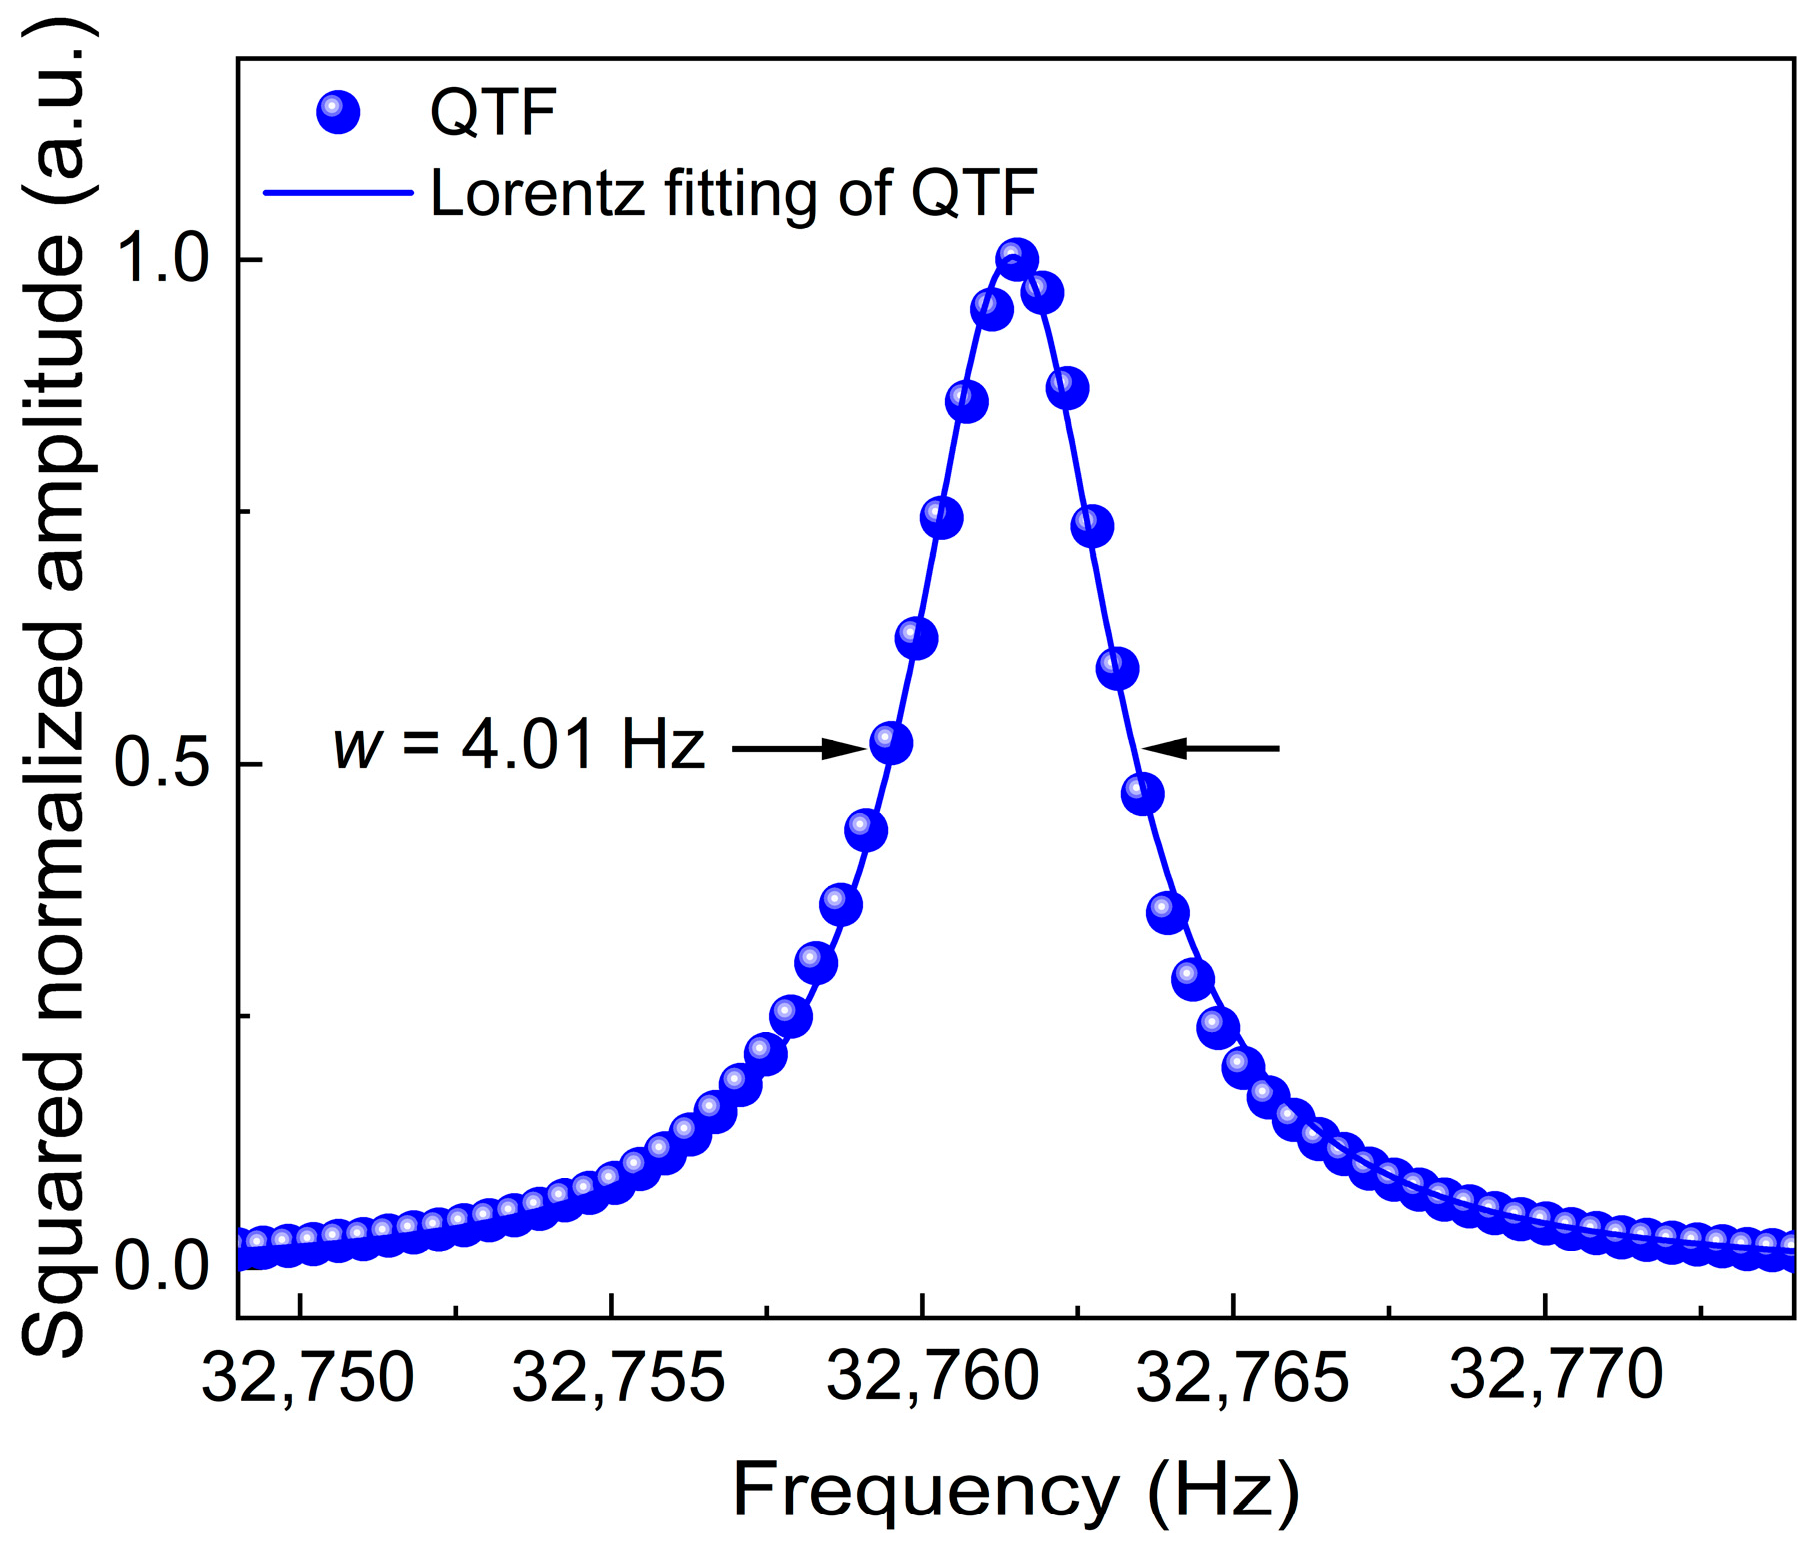
3.3. LITES Sensor Configuration
4. Results and Discussions
5. Conclusions
Author Contributions
Funding
Institutional Review Board Statement
Informed Consent Statement
Data Availability Statement
Conflicts of Interest
References
- Sirola, M.; Koskinen, M.; Polvinen, T.; Pihlatie, M. Tracing state structure for ecological processes in Soil including greenhouse gas exchange with lower atmosphere. Sensors 2024, 24, 3507. [Google Scholar] [CrossRef]
- Gao, X.; Qi, Q.; Yang, G. Responses of biogenic trace gases to atmospheric deposition and acid-processed atmospheric deposition in the oligotrophic western Pacific Ocean. Mar. Environ. Res. 2025, 204, 106934. [Google Scholar] [CrossRef] [PubMed]
- Guo, Y.; Zheng, X.; Bo, L.; Gu, Z.; Zhang, C.; Liu, Y. UV-activated gas sensor based on ordered mesoporous ZnO–TiO2 heterogeneous composites for trace NO2 detection at room temperature. Talanta 2025, 285, 127415. [Google Scholar] [CrossRef]
- Gamalathge, T.; Tai, N.; Jiang, X.; Wang, X.; Li, L.; Yung, Y. Impacts of California wildfires on CO2 and other trace gases. Geophys. Res. Lett. 2024, 51, 109352. [Google Scholar]
- Schwietzke, S.; Sherwood, O.; Ruhwiler, L.; Miller, J.; Etiope, G.; Dlugokencky, E.; Michel, S.; Arling, V.; Vaughn, B.; White, J.; et al. Upward revision of global fossil fuel methane emissions based on isotope database. Nature 2016, 538, 88–91. [Google Scholar] [CrossRef] [PubMed]
- Ren, Y.; Du, J.; Zhang, M.; Li, J. Laser absorption spectroscopy based on dual-convolutional neural network algorithms for multiple trace gases analysis. Sens. Actuator B-Chem. 2024, 420, 136476. [Google Scholar] [CrossRef]
- Van Roozendael, M.; Hendrick, F.; Friedrich, M.; Fayt, C.; Bais, A.; Beirle, S.; Bösch, T.; Comas, M.; Friess, U.; Karagkiozidis, D.; et al. Fiducial reference measurements for air quality monitoring using ground-based MAX-DOAS instruments (FRM4DOAS). Remote Sens. 2024, 16, 4523. [Google Scholar] [CrossRef]
- Lang, Z.; Qiao, S.; Ma, Y. Fabry-perot-based phase demodulation of heterodyne light-induced thermoelastic spectroscopy. Light Adv. Manuf. 2023, 4, 23. [Google Scholar] [CrossRef]
- Kulkarni, S.; Ghosh, R. Ultra-sensitive CuAl2O4 Nanoflakes for ppb level detection of Isopropanol. Ceram. Int. 2024, 50, 46356–46363. [Google Scholar] [CrossRef]
- Li, T.; Zhao, P.; Wang, P.; Kummara, V.; Jin, W.; Zhang, A. Miniature optical fiber photoacoustic spectroscopy gas sensor based on a 3D micro-printed planar-spiral spring optomechanical resonator. Photoacoustics 2024, 40, 100657. [Google Scholar] [CrossRef] [PubMed]
- Xu, S.; Zhou, X.; Xu, S.; Zhang, Y.; Shi, Y.; Cong, X.; Xu, Q.; Tian, Y.; Jiang, Y.; Guo, H.; et al. Molecularly specific detection towards trace nitrogen dioxide by utilizing Schottky-junction-based Gas Sensor. Nat. Commun 2024, 15, 5991. [Google Scholar] [CrossRef] [PubMed]
- Ma, D.; Mao, W.; Tan, W.; Gao, J.; Zhang, Z.; Xie, Y. Emission source tracing based on bionic algorithm mobile sensors with artificial olfactory system. Robotica 2022, 40, 976–996. [Google Scholar] [CrossRef]
- Nisbet, E.; Fisher, R.; Lowry, D.; France, J.; Allen, G.; Bakkaloglu, S.; Broderick, T.; Cain, M.; Coleman, M.; Fernandez, J.; et al. Methane mitigation: Methods to reduce emissions, on the path to the Paris agreement. Rev. Geophys. 2020, 58, e2019RG000675. [Google Scholar] [CrossRef]
- Casas-Ferreira, A.; Nogal-Sánchez, M.; Pérez-Pavón, J.; Moreno-Cordero, B. Non-separative mass spectrometry methods for non-invasive medical diagnostics based on volatile organic compounds: A review. Anal. Chim. Acta 2019, 1045, 10–22. [Google Scholar] [CrossRef] [PubMed]
- Dhall, S.; Mehta, B.; Tyagi, A.; Sood, K. A review on environmental gas sensors: Materials and technologies. Sens. Int. 2021, 2, 100116. [Google Scholar] [CrossRef]
- Chamassi, K.; Trzpil, W.; Arinero, R.; Rousseau, R.; Vicet, A.; Bahriz, M. Capacitive silicon micro-electromechanical resonator for enhanced photoacoustic spectroscopy. Appl. Phys. Lett. 2019, 115, 081106. [Google Scholar] [CrossRef]
- Dong, S.; He, D.; Zhang, Q.; Huang, C.; Hu, Z.; Zhang, C.; Nie, L.; Wang, K.; Luo, W.; Yu, J.; et al. Early cancer detection by serum biomolecular fingerprinting spectroscopy with machine learning. eLight 2023, 3, 17. [Google Scholar] [CrossRef]
- Wang, R.; Qiao, S.; He, Y.; Ma, Y. Highly sensitive laser spectroscopy sensing based on a novel four-prong quartz tuning fork. Opto-Electron. Adv. 2025, 8, 240275. [Google Scholar] [CrossRef]
- Fu, B.; Gao, R.; Yao, N.; Zhang, H.; Li, C.; Lin, J.; Wang, M.; Qiao, L.; Cheng, Y. Soliton microcomb generation by cavity polygon modes. Opto-Electron. Adv. 2024, 7, 240061. [Google Scholar] [CrossRef]
- Hu, H.; Flöry, T.; Stummer, V.; Pugzlys, A.; Zeiler, M.; Xie, X.; Zheltikov, A.; Baltuska, A. Hyper spectral resolution stimulated Raman spectroscopy with amplified fs pulse bursts. Light Sci. Appl. 2024, 13, 61. [Google Scholar] [CrossRef] [PubMed]
- Koskinen, V.; Fonsen, J.; Roth, K.; Kauppinen, J. Cantilever enhanced photoacoustic detection of carbon dioxide using a tunable diode laser source. Appl. Phys. B Laser Opt. 2007, 86, 451–454. [Google Scholar] [CrossRef]
- Tshabalala, Z.; Shingange, K.; Dhonge, B.; Ntwaeaborwa, O.; Mhlongo, G.; Motaung, D. Fabrication of ultra-high sensitive and selective CH4 room temperature gas sensing of TiO2 nanorods: Detailed study on the annealing temperature. Sens. Actuator B-Chem. 2017, 238, 402–419. [Google Scholar] [CrossRef]
- Ma, Y.; Qiao, S.; Wang, R.; He, Y.; Fang, C.; Liang, T. A novel tapered quartz tuning fork-based laser spectroscopy sensing. Appl. Phys. Rev. 2024, 11, 041412. [Google Scholar] [CrossRef]
- Couture, H.; Alvara, M.; Freeman, J.; Davitt, A.; Koenig, H.; Kargar, A.; O’Connor, J.; Söldner-Rembold, I.; Ferreira, A.; Jeyaratnam, J.; et al. Estimating carbon dioxide emissions from power plant water vapor plumes using satellite imagery and machine learning. Remote Sens. 2024, 16, 1290. [Google Scholar] [CrossRef]
- Dosi, M.; Lau, I.; Zhuang, Y.; Simakov, D.; Fowler, M.; Pope, M. Ultrasensitive electrochemical methane sensors based on solid polymer electrolyte-infused laser-induced graphene. ACS Appl. Mater. Interfaces 2019, 11, 6166–6173. [Google Scholar] [CrossRef] [PubMed]
- Lang, Z.; Qiao, S.; He, Y.; Ma, Y. Disturbance-immune, fast response LITES gas sensor based on out-plane vibration mode employing micro Fabry-Perot cavity with heterodyne phase demodulation. Sens. Actuator B-Chem. 2024, 419, 136412. [Google Scholar] [CrossRef]
- Filippov, T.; Vervitski, E.; Kofler, H.; Birkan, L.; Levy, S.; Zimmerman, S.; Bulatov, V.; Schechter, I.; Schuetz, R. Sub-ppb detection with gas-phase multiphoton electron extraction spectroscopy under ambient conditions. Sensors 2024, 24, 2040. [Google Scholar] [CrossRef]
- Zhang, C.; He, Y.; Qiao, S.; Liu, Y.; Ma, Y. High-sensitivity trace gas detection based on differential Helmholtz photoacoustic cell with dense spot pattern. Photoacoustics 2024, 38, 100634. [Google Scholar] [CrossRef]
- Chen, X.; Wang, S.; Li, D.; Shi, Z.; Liang, Q. Trace acetylene gas detection based on a miniaturized Y-sphere coupled photoacoustic sensor. Sensors 2024, 24, 7274. [Google Scholar] [CrossRef] [PubMed]
- Sun, H.; Qiao, S.; He, Y.; Liu, Y.; Ma, Y. Highly sensitive CH4, C2H2 and CO simultaneous measurement LITES sensor based on multi-pass cell with overlapped spots pattern and QTFs with low resonant frequency. Opt. Express 2024, 32, 28183–28194. [Google Scholar] [CrossRef]
- Zhang, Z.; Fan, X.; Xu, Y.; Wang, Y.; Tang, Y.; Zhao, R.; Li, C.; Wang, H.; Chen, K. Silicon-cantilever-enhanced single-fiber photoacoustic acetylene gas sensor. Sensors 2023, 23, 7644. [Google Scholar] [CrossRef] [PubMed]
- Qiao, S.; He, Y.; Sun, H.; Patimisco, P.; Sampaolo, A.; Spagnolo, V.; Ma, Y. Ultra-highly sensitive dual gases detection based on photoacoustic spectroscopy by exploiting a long-wave, high-power, wide-tunable, single-longitudinal-mode solid-state laser. Light Sci. Appl. 2024, 13, 100. [Google Scholar] [CrossRef]
- Wang, Y.; Zhang, J.; Zheng, Y.; Xu, Y.; Xu, J.; Jiao, J.; Su, Y.; Lü, H.-F.; Liang, K. Brillouin scattering spectrum for liquid detection and applications in oceanography. Opto-Electron. Adv. 2023, 6, 220016. [Google Scholar] [CrossRef]
- Li, A.; Wu, Y.; Wang, C.; Bao, F.; Yang, Z.; Pan, S. An inversely designed integrated spectrometer with reconfigurable performance and ultra-low power consumption. Opto-Electron. Adv. 2024, 7, 240099. [Google Scholar] [CrossRef]
- Shao, M.; Ji, C.; Tan, J.; Du, B.; Zhao, X.; Yu, J.; Man, B.; Xu, K.; Zhang, C.; Li, Z. Ferroelectrically modulate the Fermi level of graphene oxide to enhance SERS response. Opto-Electron. Adv. 2023, 6, 230094. [Google Scholar] [CrossRef]
- Wang, X.; Qiu, X.; Liu, M.; Liu, F.; Li, M.; Xue, L.; Chen, B.; Zhang, M.; Xie, P. Flat soliton microcomb source. Opto-Electro. Sci. 2023, 2, 230024. [Google Scholar] [CrossRef]
- Zhang, C.; Qiao, S.; He, Y.; Liu, C.; Ma, Y. Multi-resonator T-type photoacoustic cell based photoacoustic spectroscopy gas sensor for simultaneous measurement C2H2, CH4 and CO2. Sens. Actuator B-Chem. 2025, 427, 137168. [Google Scholar] [CrossRef]
- Kosterev, A.; Bakhirkin, Y.; Curl, R.; Tittel, F. Quartz-enhanced photoacoustic spectroscopy. Opt. Lett. 2002, 27, 1902–1904. [Google Scholar] [CrossRef] [PubMed]
- Starecki, T.; Wieczorek, P. A high sensitivity preamplifier for quartz tuning forks in QEPAS (quartz enhanced photoacoustic spectroscopy) applications. Sensors 2017, 17, 2528. [Google Scholar] [CrossRef] [PubMed]
- Wang, F.; Chang, J.; Zhang, Q.; Qin, Z.; Zhu, C. Pivotal techniques evaluation in QEPAS system for engineering applications. Measurement 2019, 135, 376–384. [Google Scholar] [CrossRef]
- Rousseau, R.; Ayache, D.; Trzpil, W.; Bahriz, M.; Vicet, A. Passive electrical damping of a quartz tuning fork as a path to fast resonance tracking in QEPAS. Sensors 2021, 21, 5056. [Google Scholar] [CrossRef] [PubMed]
- Zhang, Q.; Chang, J.; Cong, Z.; Feng, Y.; Wang, Z.; Wang, F.; Sun, J. Pptv-level intra-cavity QEPAS sensor for acetylene detection using a high power Q-switched fiber laser. IEEE Sens. J. 2019, 19, 6181–6186. [Google Scholar] [CrossRef]
- Elefante, A.; Menduni, G.; Rossmadl, H.; Mackowiak, V.; Giglio, M.; Sampaolo, A.; Patimisco, P.; Passaro, V.; Spagnolo, V. Environmental monitoring of methane with quartz-enhanced photoacoustic spectroscopy exploiting an electronic hygrometer to compensate the H2O influence on the sensor signal. Sensors 2020, 20, 2935. [Google Scholar] [CrossRef] [PubMed]
- Bi, S.; Qian, S.; Tian, C.; Zhang, Q.; Yu, Y.; Wang, Z. Trace gas detection system based on photoacoustic and photothermal spectroscopy using ring fiber laser and quartz tuning fork. IEEE Sens. J. 2023, 23, 9229–9236. [Google Scholar] [CrossRef]
- Patimisco, P.; Scamarcio, G.; Tittel, F.; Spagnolo, V. Quartz-enhanced photoacoustic spectroscopy: A review. Sensors 2014, 14, 6165–6206. [Google Scholar] [CrossRef]
- Ma, Y.; He, Y.; Tong, Y.; Yu, X.; Tittel, F. Quartz-tuning-fork enhanced photothermal spectroscopy for ultra-high sensitive trace gas detection. Opt. Express 2018, 26, 32103–32110. [Google Scholar] [CrossRef] [PubMed]
- He, Y.; Wang, Y.; Qiao, S.; Duan, X.; Qi, H.; Ma, Y. Hydrogen-enhanced light-induced thermoelastic spectroscopy sensing. Photonics Res. 2025, 13, 194–200. [Google Scholar] [CrossRef]
- Chen, X.; Liu, H.; Yao, L.; Xu, Z.; Hu, M.; Kan, R. Simultaneous dual-harmonic detection for LITES with a multi-pass configuration based on combined flexural modes of a quartz tuning fork. Opt. Laser Technol. 2024, 174, 110488. [Google Scholar] [CrossRef]
- Liu, Y.; Qiao, S.; Fang, C.; He, Y.; Sun, H.; Liu, J.; Ma, Y. A highly sensitive LITES sensor based on a multi-pass cell with dense spot pattern and a novel quartz tuning fork with low frequency. Opto-Electron. Adv. 2024, 7, 230230. [Google Scholar] [CrossRef]
- Cheng, Y.; Xu, Y.; Chen, T.; Mei, H.; He, S. Differential laser-induced thermoelastic spectroscopy for dual-gas CO2/CH4 detection. Measurement 2025, 240, 115594. [Google Scholar] [CrossRef]
- Ma, H.; Chen, Y.; Qiao, S.; He, Y.; Ma, Y. A high sensitive methane QEPAS sensor based on self-designed trapezoidal-head quartz tuning fork and high power diode laser. Photoacoustics 2025, 42, 100683. [Google Scholar] [CrossRef]
- Sun, H.; He, Y.; Qiao, S.; Liu, Y.; Ma, Y. Highly sensitive and real-simultaneous CH4/C2H2 dual-gas LITES sensor based on Lissajous pattern multi-pass cell. Opto-Electron. Sci. 2024, 3, 240013. [Google Scholar] [CrossRef]
- Qin, L.; Bi, S.; Chen, R.; Zhao, Y.; Shi, J.; Zhang, H.; Wang, Z. Two-component gas sensor of time-division multiplexing technique based on QEPAS and LITES. IEEE Photon. Technol. Lett. 2024, 36, 1085–1088. [Google Scholar] [CrossRef]
- Liu, X.; Qiao, S.; He, Y.; Ma, Y. High stability and fast calibration-free temperature measurement based on light-induced thermoelastic spectroscopy. Ultrafast Sci. 2025, 5, 0083. [Google Scholar] [CrossRef]
- Ma, Y.; Liu, Y.; He, Y.; Qiao, S.; Sun, H. Design of multipass cell with dense spot patterns and its performance in a light-induced thermoelastic spectroscopy-based methane sensor. Light Adv. Manuf. 2025, 6, 1. [Google Scholar] [CrossRef]
- Zhang, Q.; Chang, J.; Wang, Z.; Wang, F.; Jiang, F.; Wang, M. SNR improvement of QEPAS system by preamplifier circuit optimization and frequency locked technique. Photonic Sens. 2018, 8, 127–133. [Google Scholar] [CrossRef]
- Zhao, J.; Bi, S.; Zhang, Q.; Yao, Y.; Wang, Z. A compact integrated dual-spectroscopy gas detection structure based on QEPAS and QEPTS using a QTF. Infrared Phys. Technol. 2023, 131, 104698. [Google Scholar] [CrossRef]
- Wieczorek, P.; Starecki, T.; Tittel, F. Improving the signal to noise ratio of QTF preamplifiers dedicated for QEPAS Applications. Appl. Sci. 2020, 10, 4105. [Google Scholar] [CrossRef]
- Di Gioia, M.; Lombardi, L.; Marzocca, C.; Matarrese, G.; Menduni, G.; Patimisco, P.; Spagnolo, V. Signal-to-noise ratio analysis for the voltage-mode read-out of quartz tuning forks in QEPAS applications. Micromachines 2023, 14, 619. [Google Scholar] [CrossRef] [PubMed]


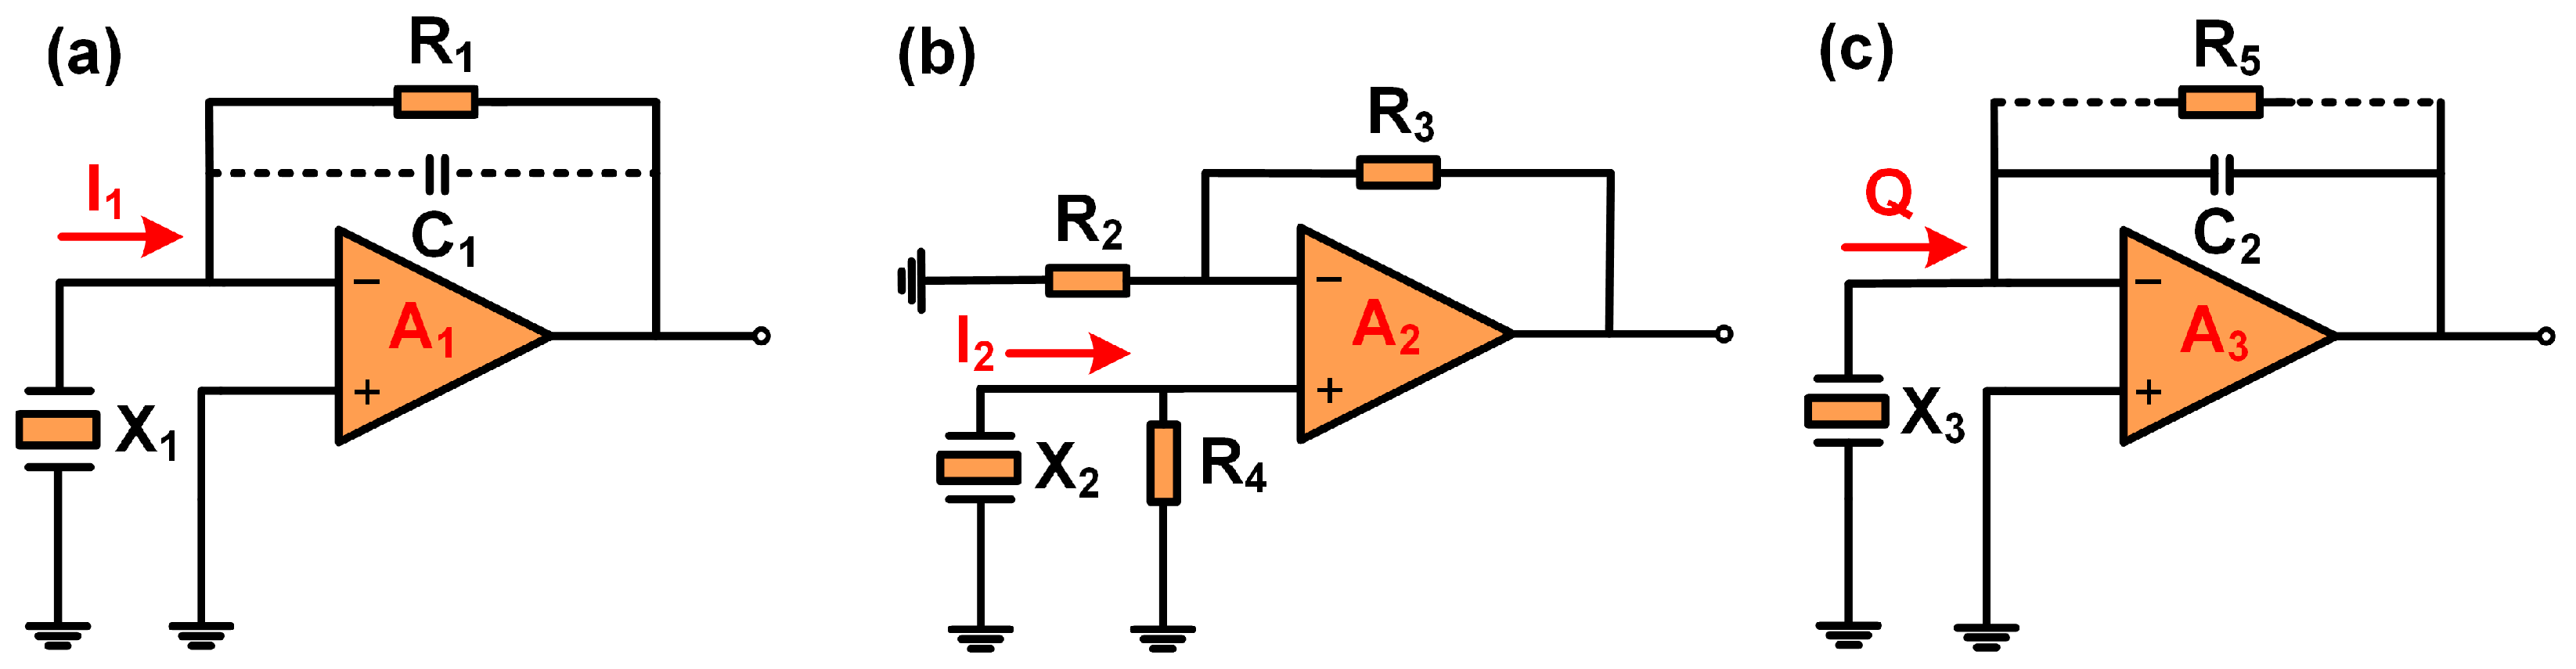
| Amplifier | Input Signal | Output Signal | Configuration | Output Expression |
|---|---|---|---|---|
| TA | Current | Voltage | R1: 2.7 MΩ | |
| VA | Voltage | Voltage | R2: 1 kΩ R3: 10 kΩ R4: 24 kΩ | |
| CA | Charge | Voltage | C2: 20 pF |
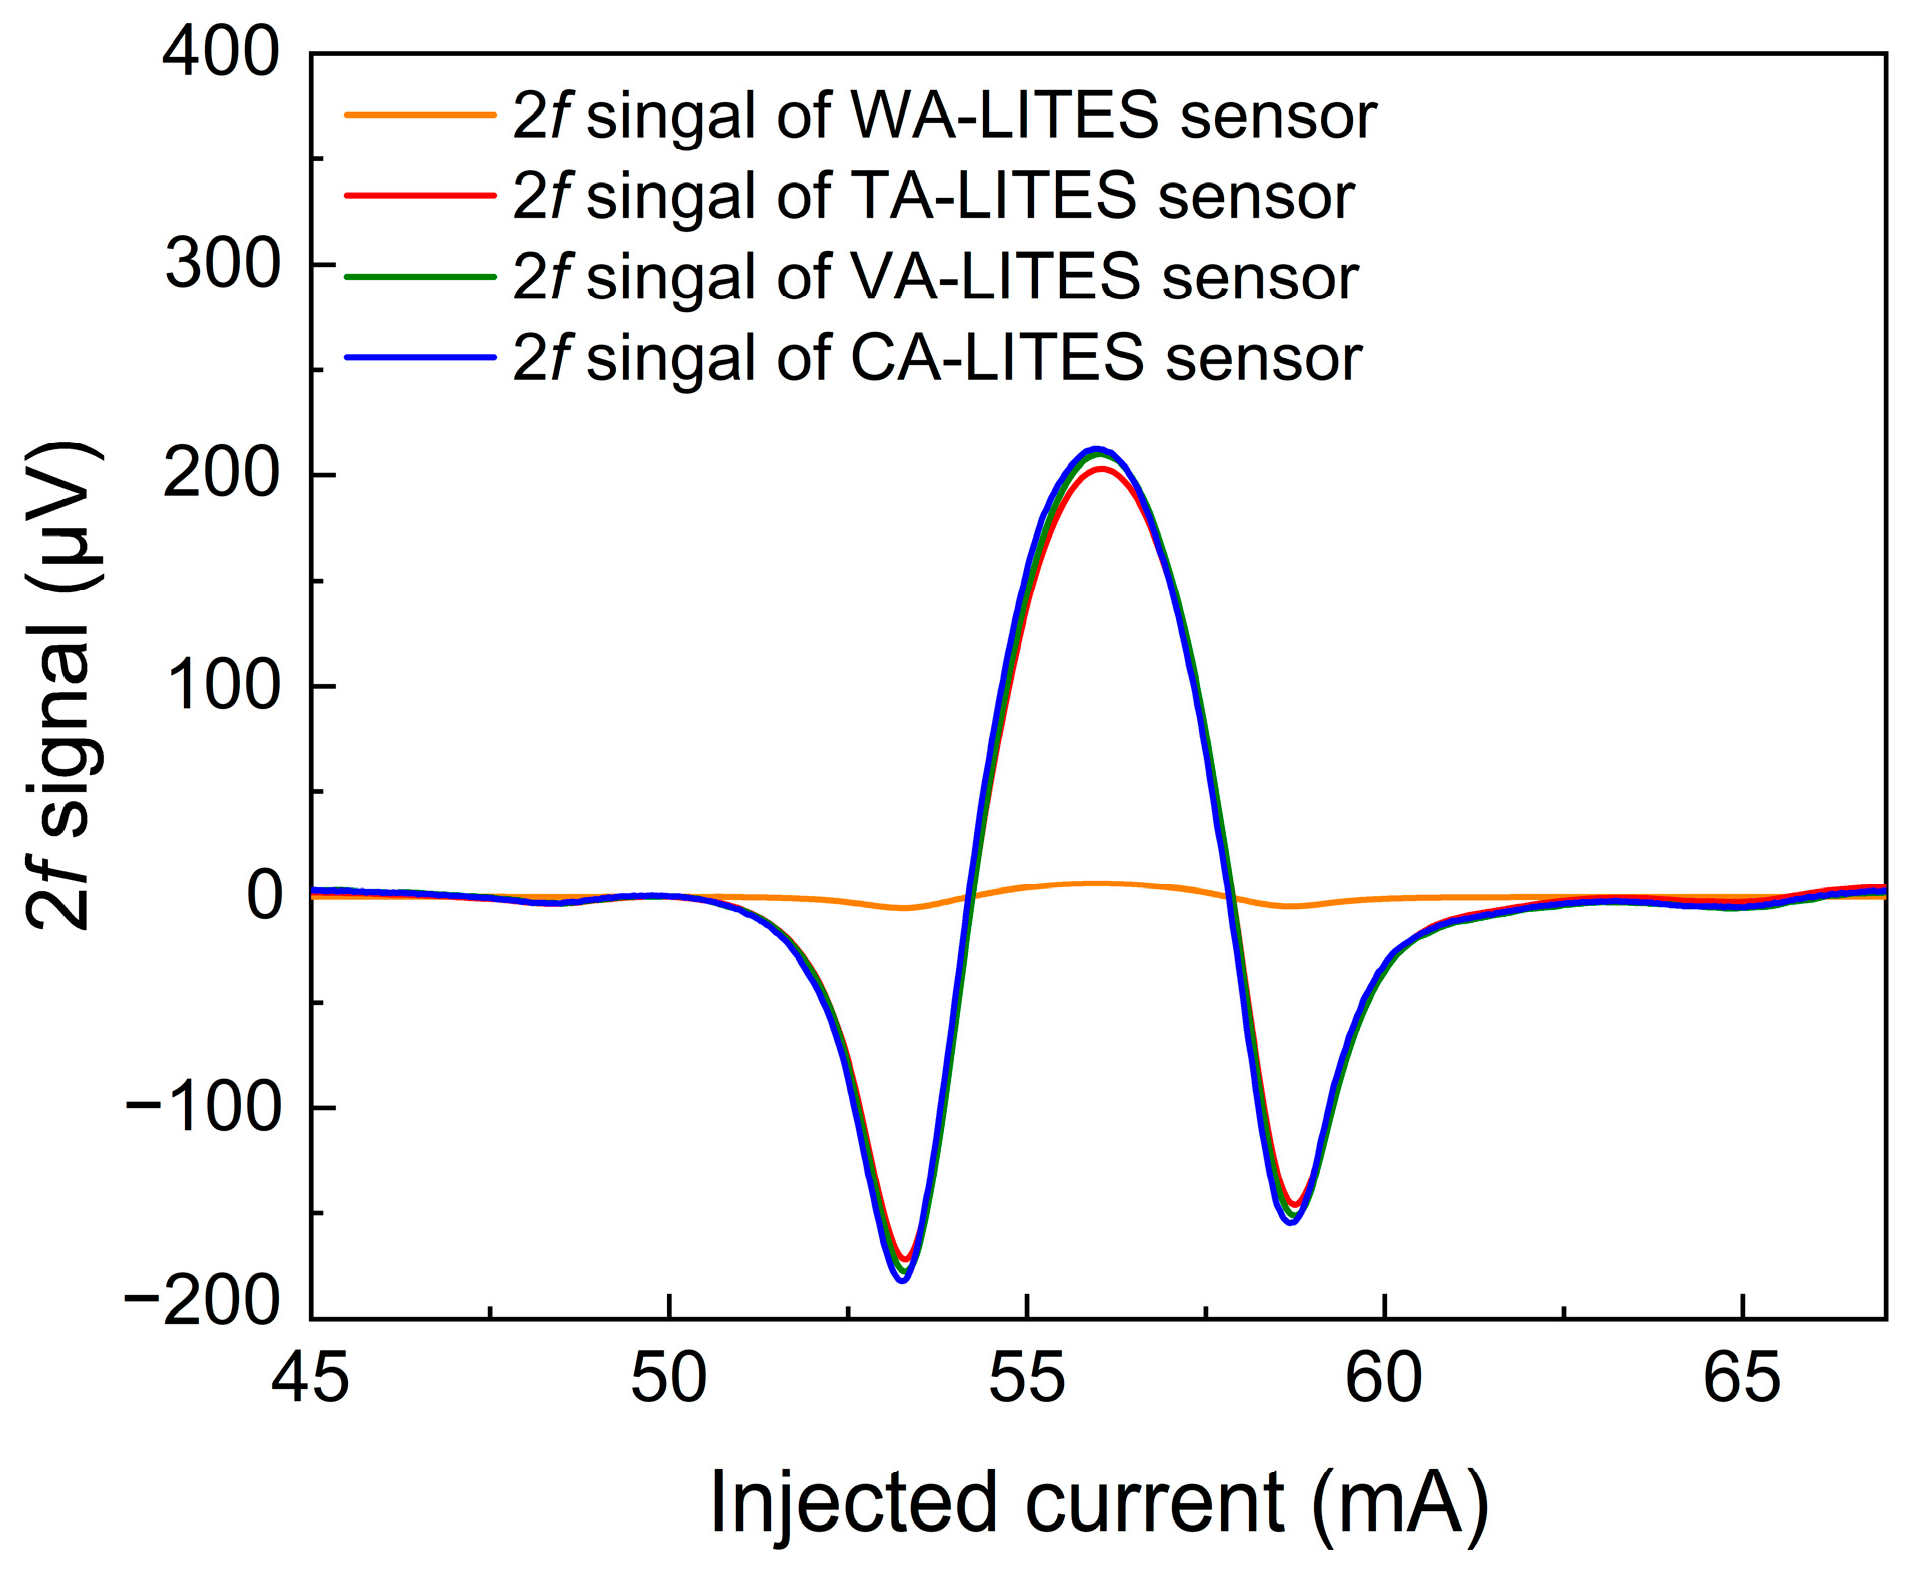
| Characteristic | 2f Peak (μV) | SNR | MDL (ppm) |
|---|---|---|---|
| WA-LITES | 6.28 | 272.33 | 73.44 |
| TA-LITES | 203.12 | 2959.04 | 6.75 |
| VA-LITES | 209.89 | 1028.35 | 19.44 |
| CA-LITES | 212.24 | 5427.22 | 3.68 |
Disclaimer/Publisher’s Note: The statements, opinions and data contained in all publications are solely those of the individual author(s) and contributor(s) and not of MDPI and/or the editor(s). MDPI and/or the editor(s) disclaim responsibility for any injury to people or property resulting from any ideas, methods, instructions or products referred to in the content. |
© 2025 by the authors. Licensee MDPI, Basel, Switzerland. This article is an open access article distributed under the terms and conditions of the Creative Commons Attribution (CC BY) license (https://creativecommons.org/licenses/by/4.0/).
Share and Cite
Ma, H.; Qiao, S.; He, Y.; Ma, Y. A Highly Sensitive Light-Induced Thermoelastic Spectroscopy Sensor Using a Charge Amplifier to Improve the Signal-to-Noise Ratio. Sensors 2025, 25, 946. https://doi.org/10.3390/s25030946
Ma H, Qiao S, He Y, Ma Y. A Highly Sensitive Light-Induced Thermoelastic Spectroscopy Sensor Using a Charge Amplifier to Improve the Signal-to-Noise Ratio. Sensors. 2025; 25(3):946. https://doi.org/10.3390/s25030946
Chicago/Turabian StyleMa, Hanxu, Shunda Qiao, Ying He, and Yufei Ma. 2025. "A Highly Sensitive Light-Induced Thermoelastic Spectroscopy Sensor Using a Charge Amplifier to Improve the Signal-to-Noise Ratio" Sensors 25, no. 3: 946. https://doi.org/10.3390/s25030946
APA StyleMa, H., Qiao, S., He, Y., & Ma, Y. (2025). A Highly Sensitive Light-Induced Thermoelastic Spectroscopy Sensor Using a Charge Amplifier to Improve the Signal-to-Noise Ratio. Sensors, 25(3), 946. https://doi.org/10.3390/s25030946