
Reliability and Validity Examination of a New Gait Motion Analysis System

 , , ,
, , ,
Abstract
1. Introduction
2. Materials and Methods
2.1. Participants
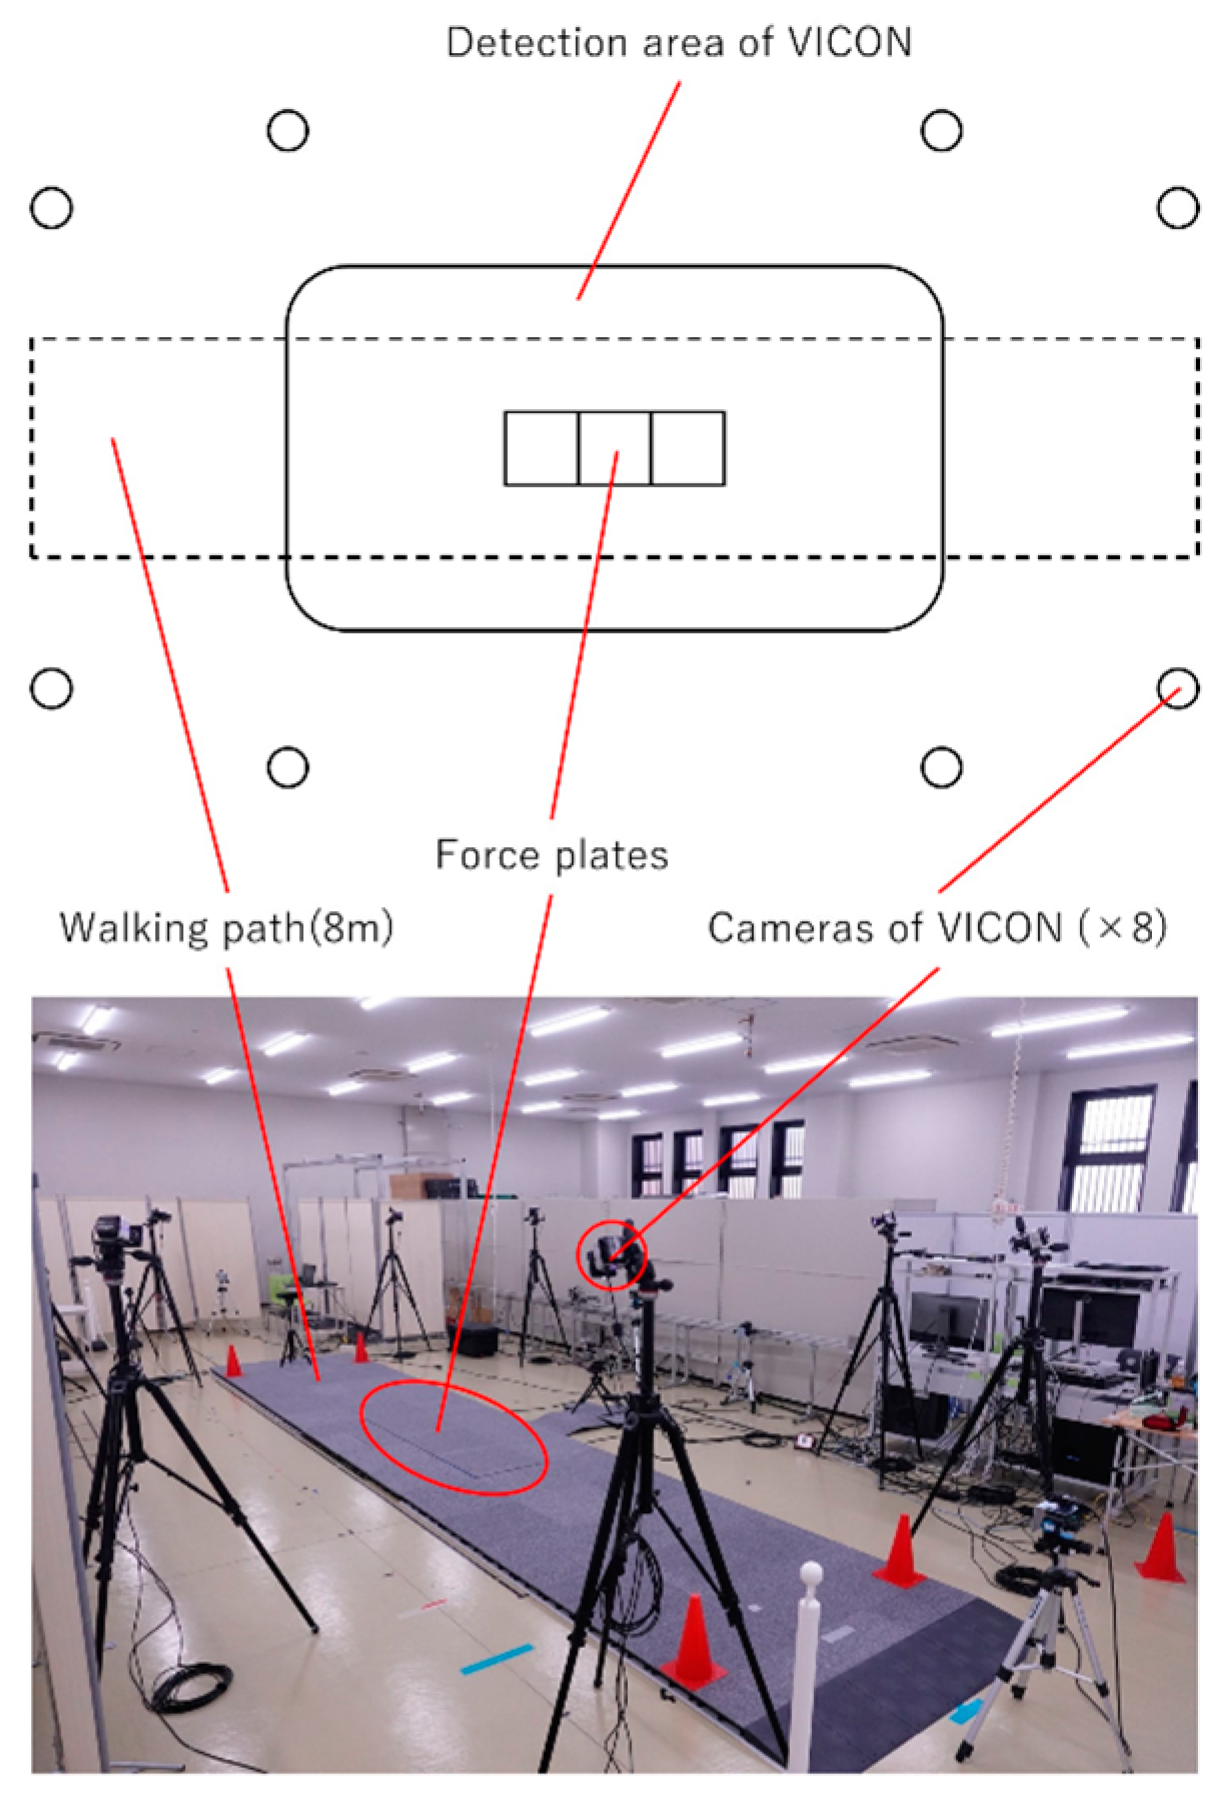
2.2. Motion Task
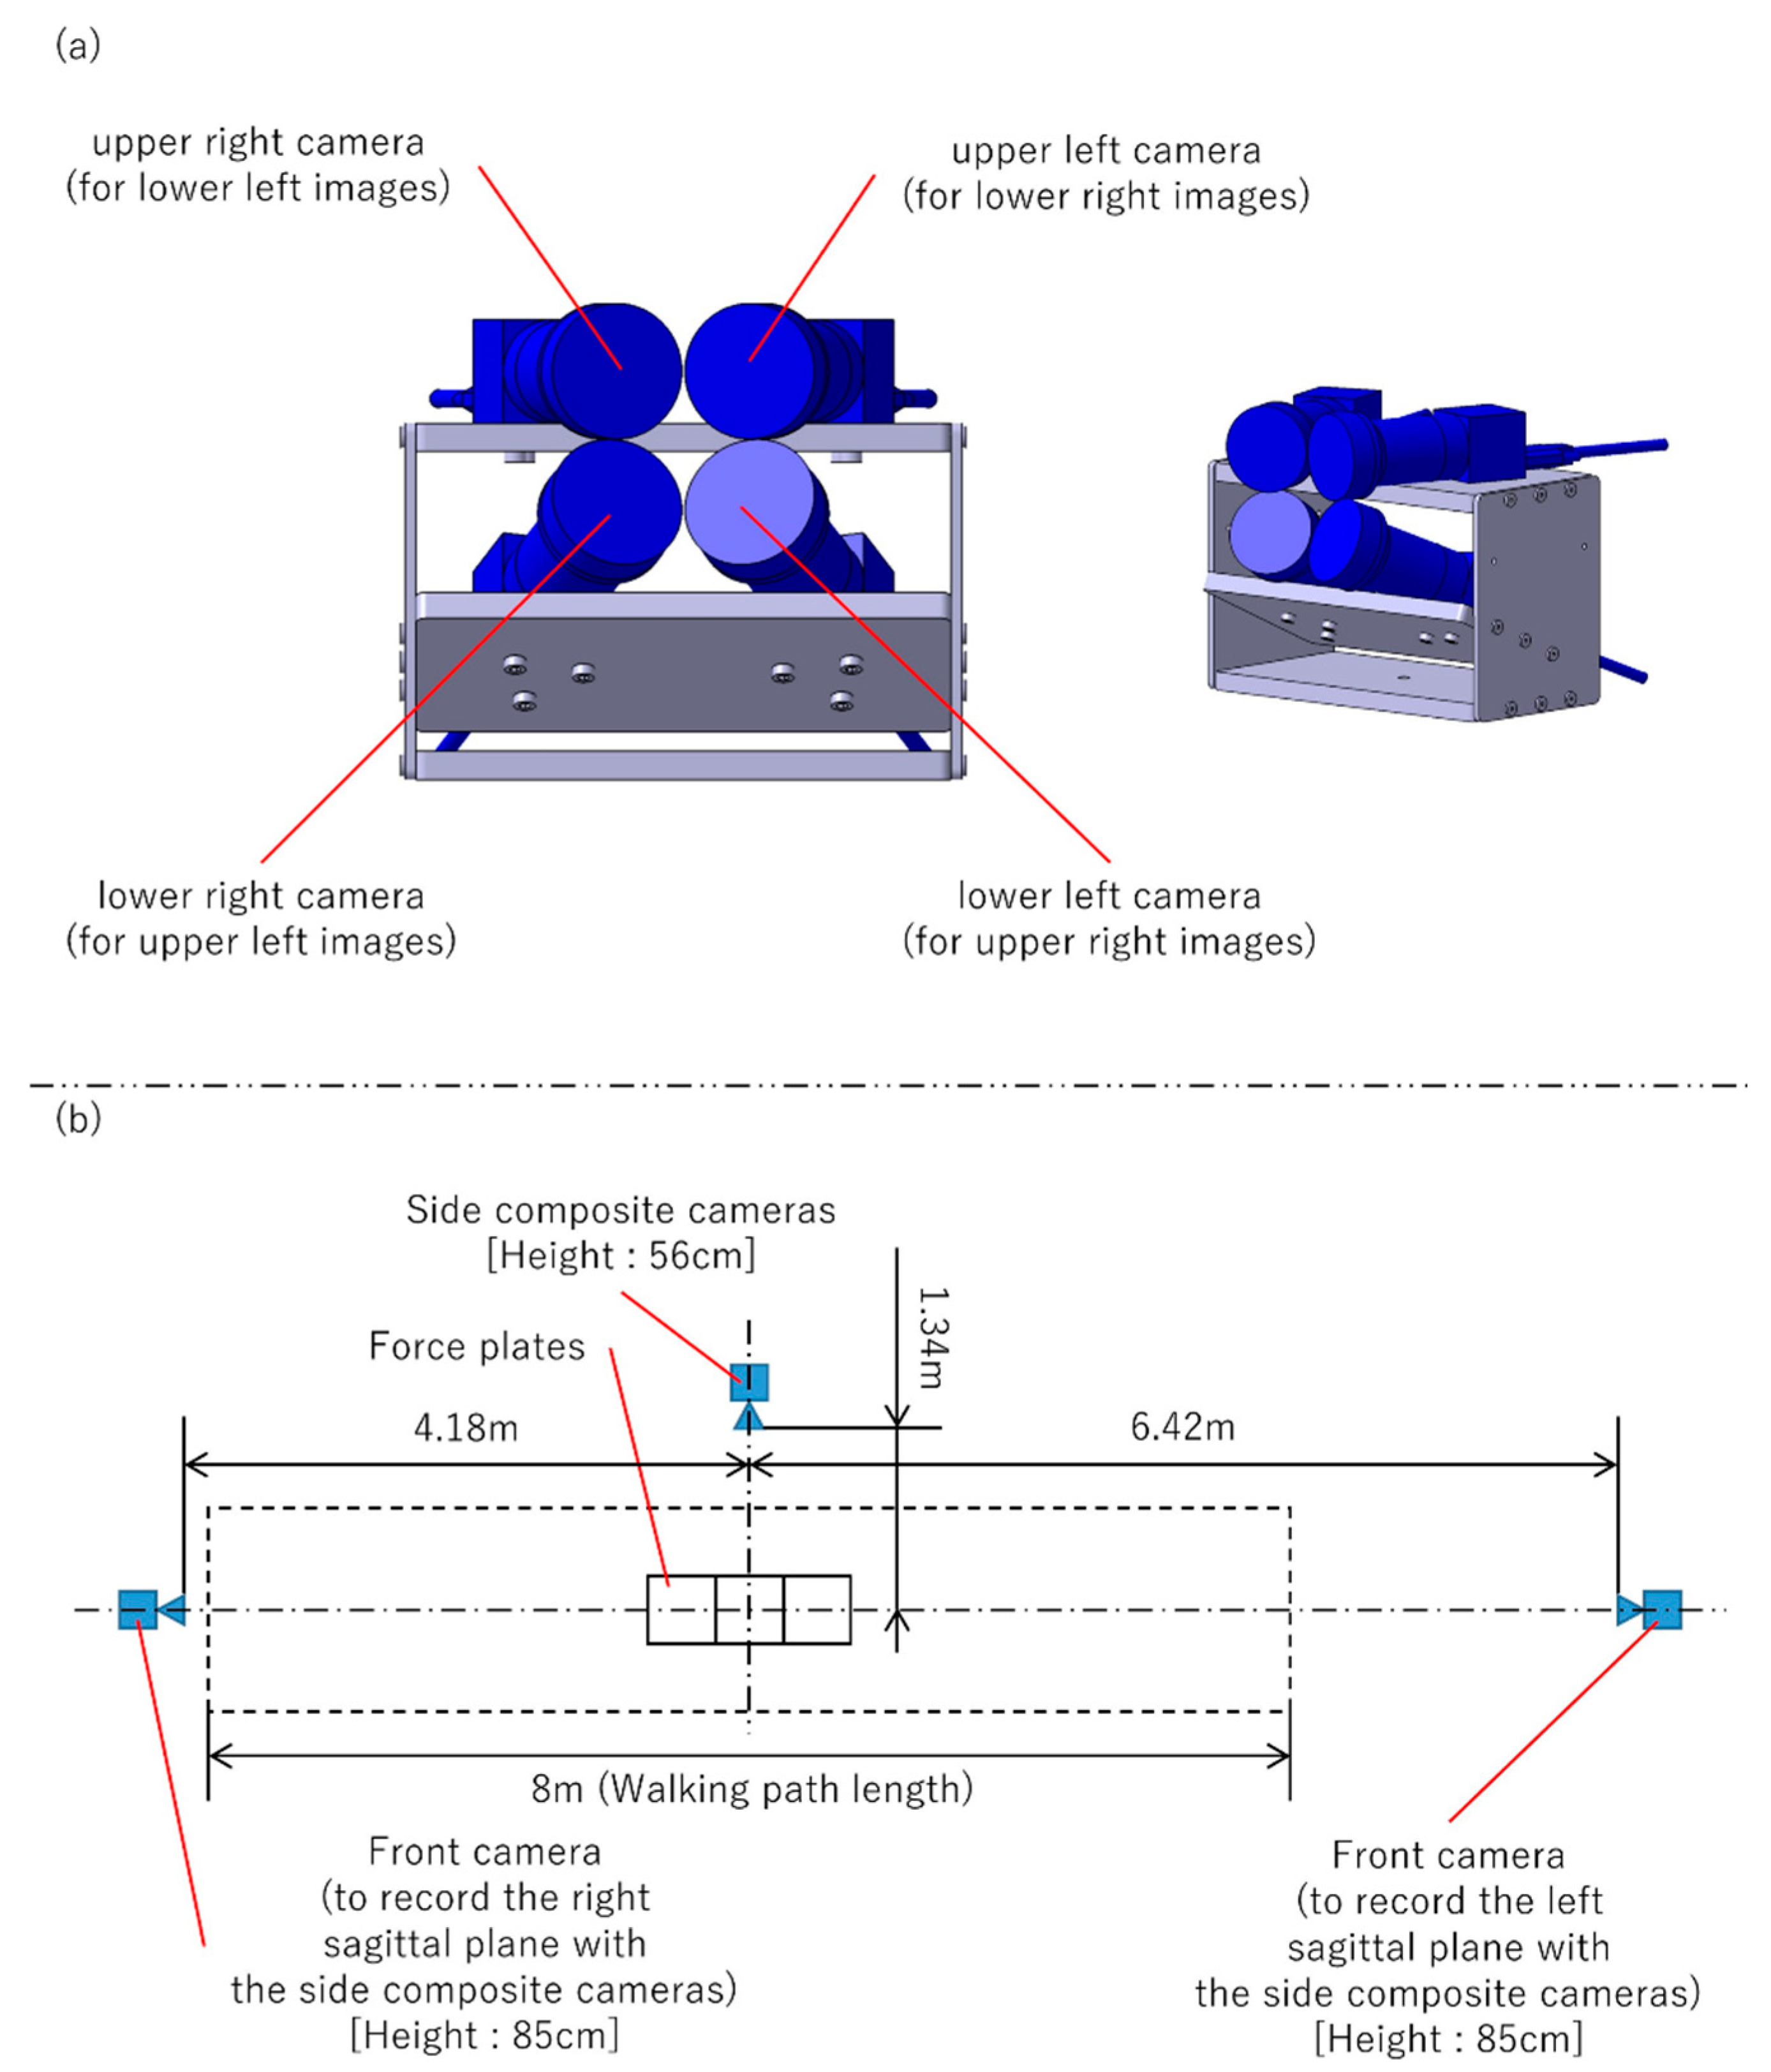
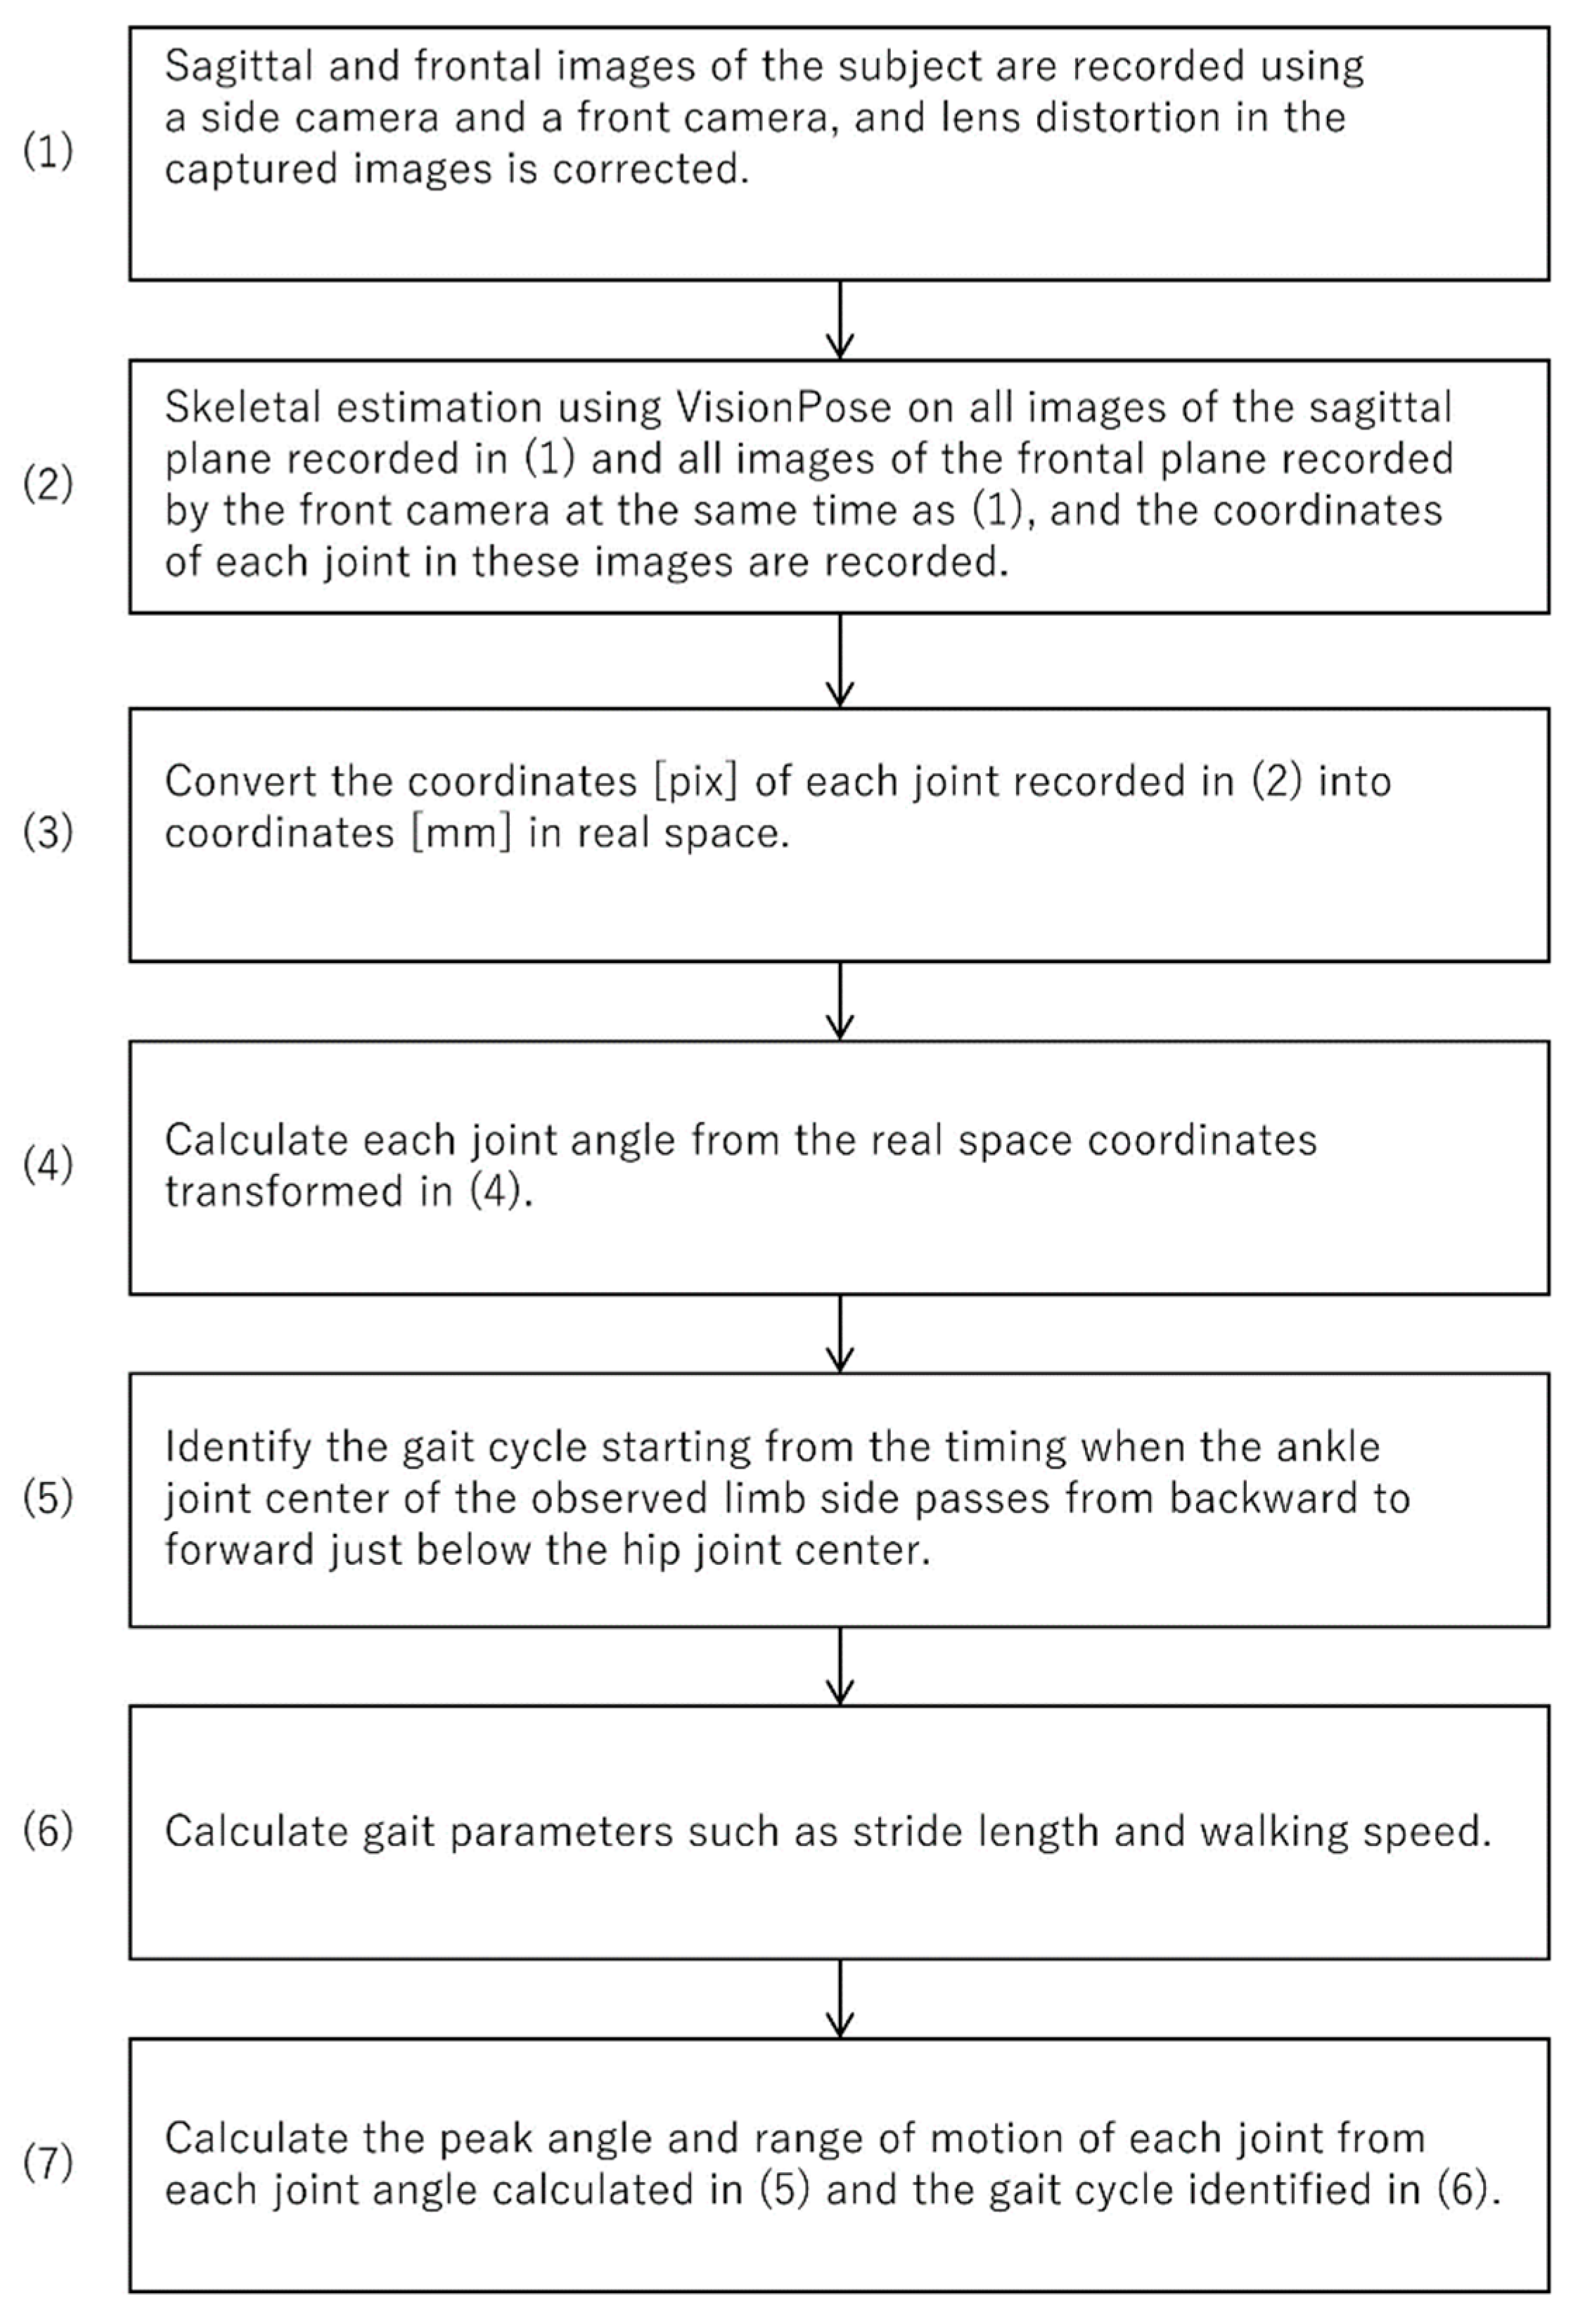
2.3. Data Collection and Processing
2.4. Data Analysis
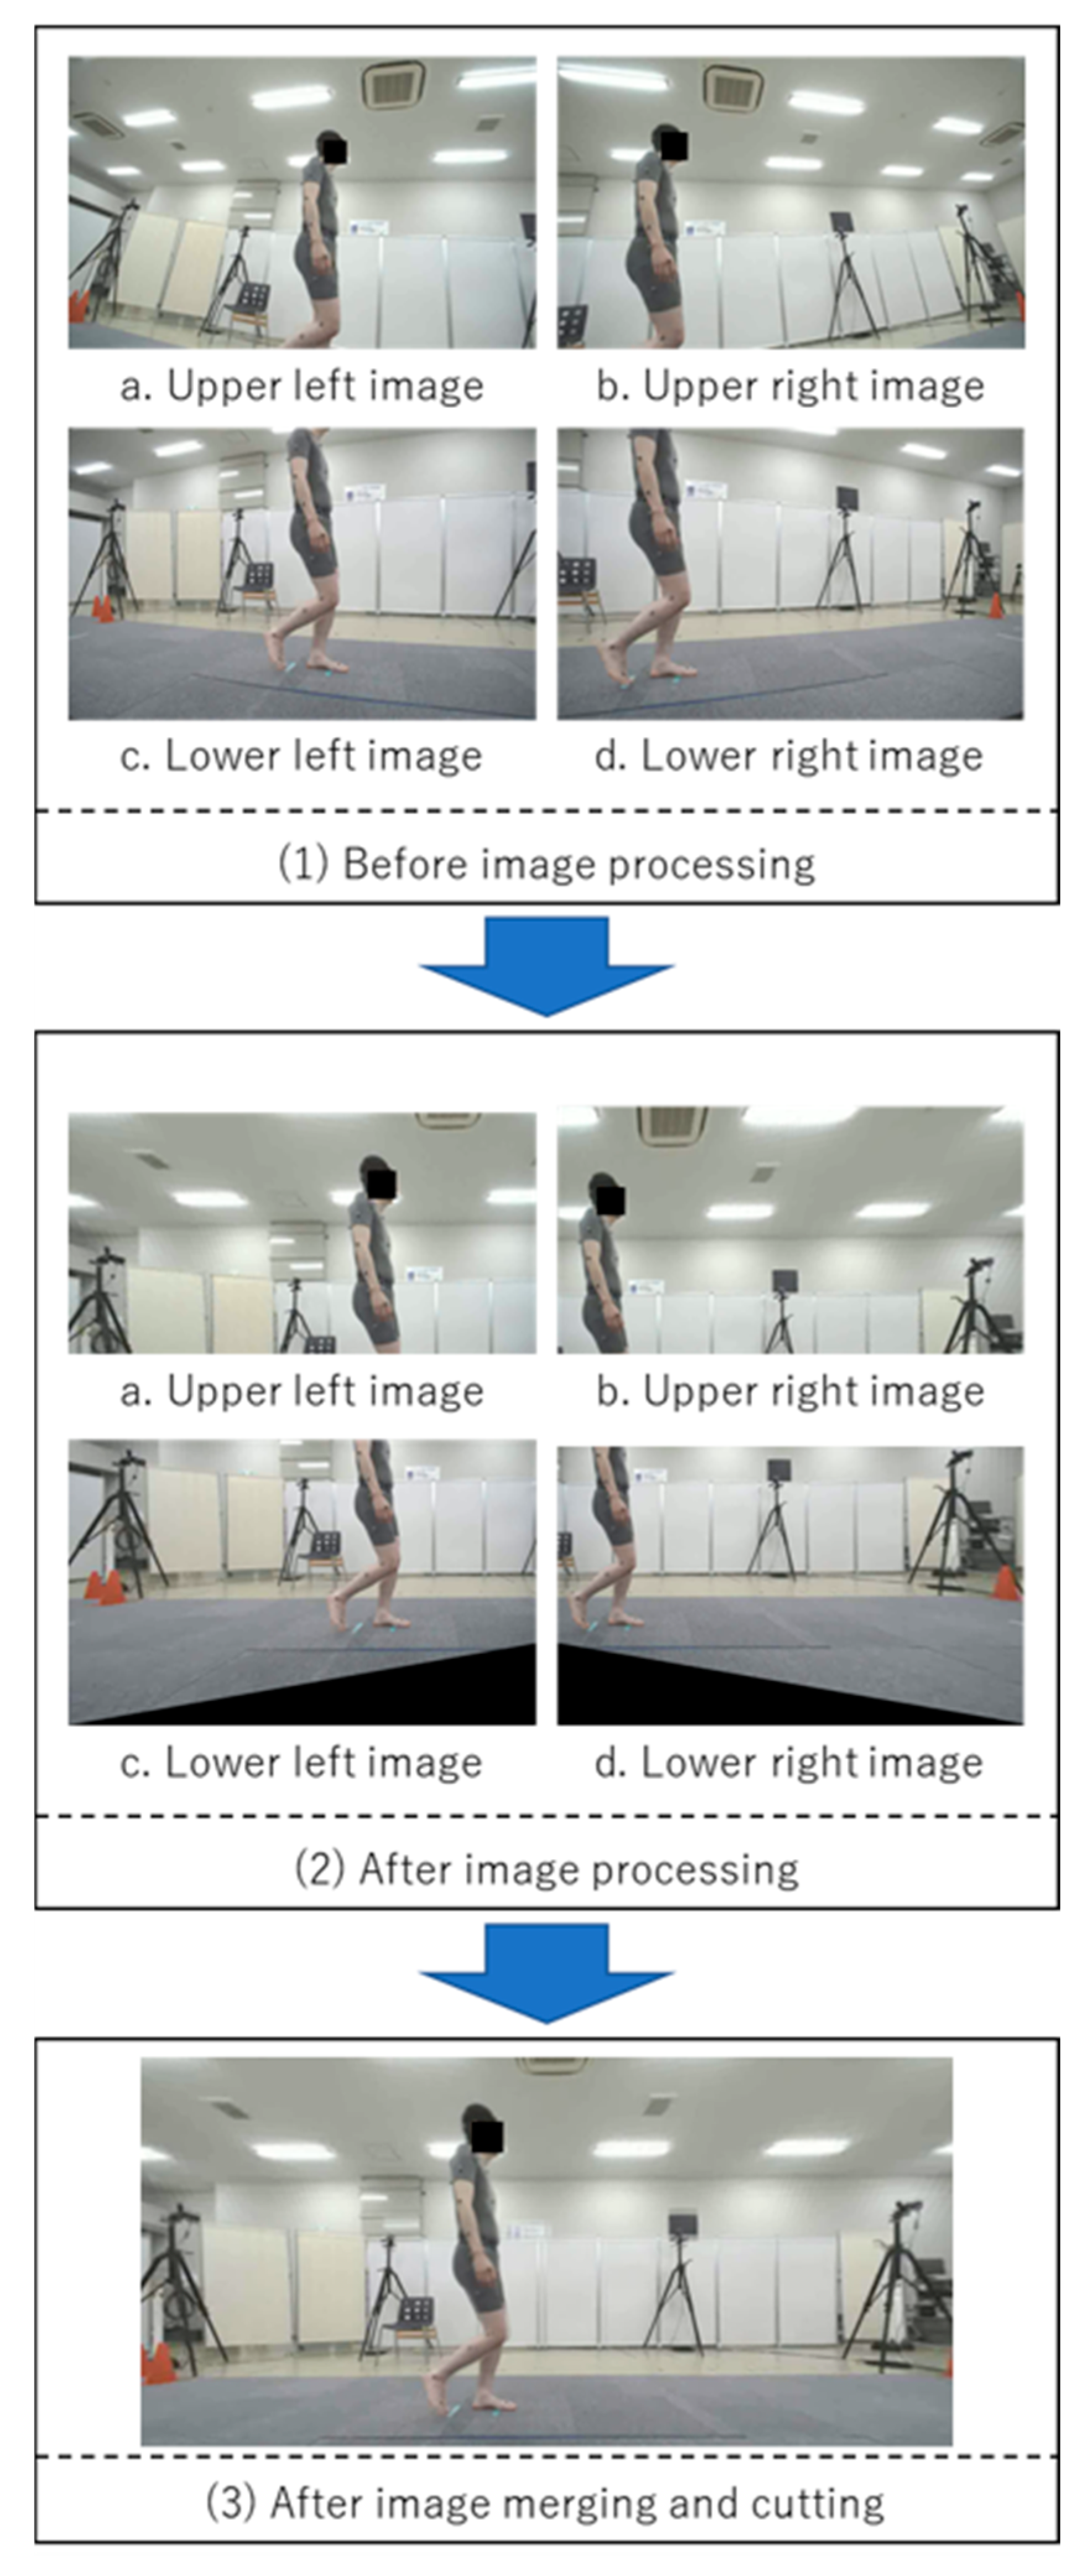
- Record sagittal plane images with a side camera (lens distortion in images captured by the side camera with low angle of view was corrected. Lens distortion in images captured by the side composite cameras with high angle of view was corrected, and images from the four cameras were combined).
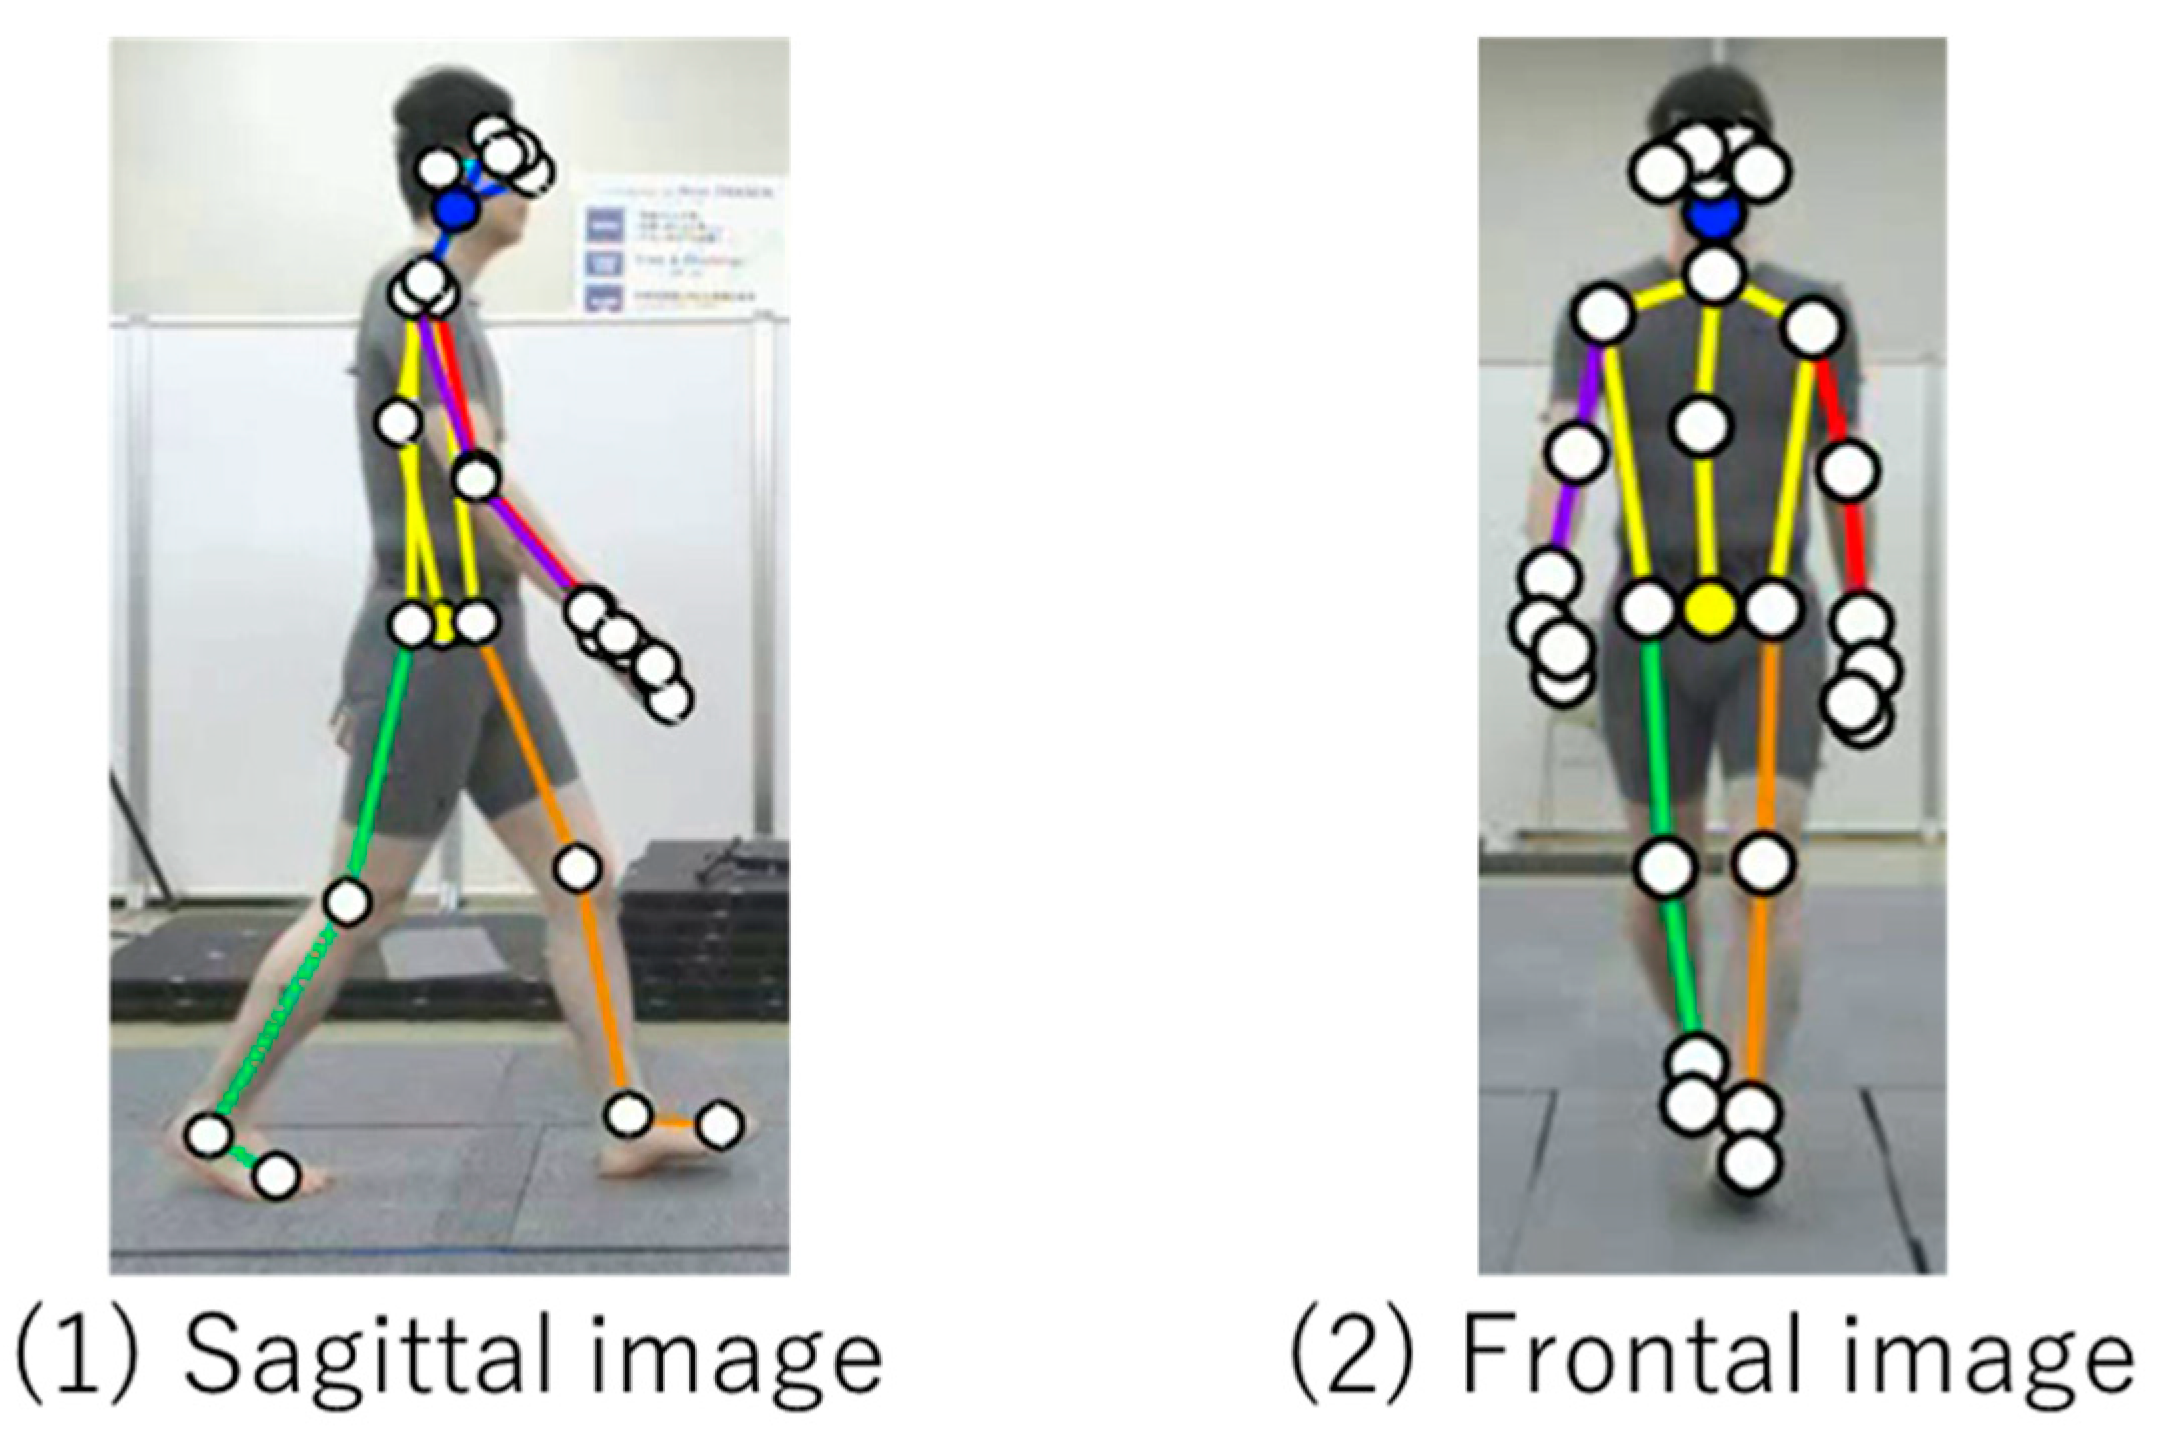
- Skeletal estimation using VisionPose was performed on images from both the side and front cameras, recording the coordinates of each joint node.
- Joint node coordinate information in each frame of the front camera was converted to real space coordinates, considering height information and joint node coordinates.
- Joint node coordinate information in each frame of the side camera was converted to real space coordinates, accounting for the distance between the side camera and walking path center plane.
- Each joint angle for each frame were calculated considering the angles between specific joint nodes in the sagittal plane.
- The gait cycle was identified based on the timing of the ankle joint center passing directly under the hip joint center.
- Each gait parameter, including stride time, stride length, and gait speed, was calculated.
- Peak angles and ROMs for each joint during the identified gait cycle were calculated.
2.5. Statistical Analysis
3. Results
3.1. Data Acquisition Rate
3.2. Test–Retest and Intra-Rater Reliability Analysis
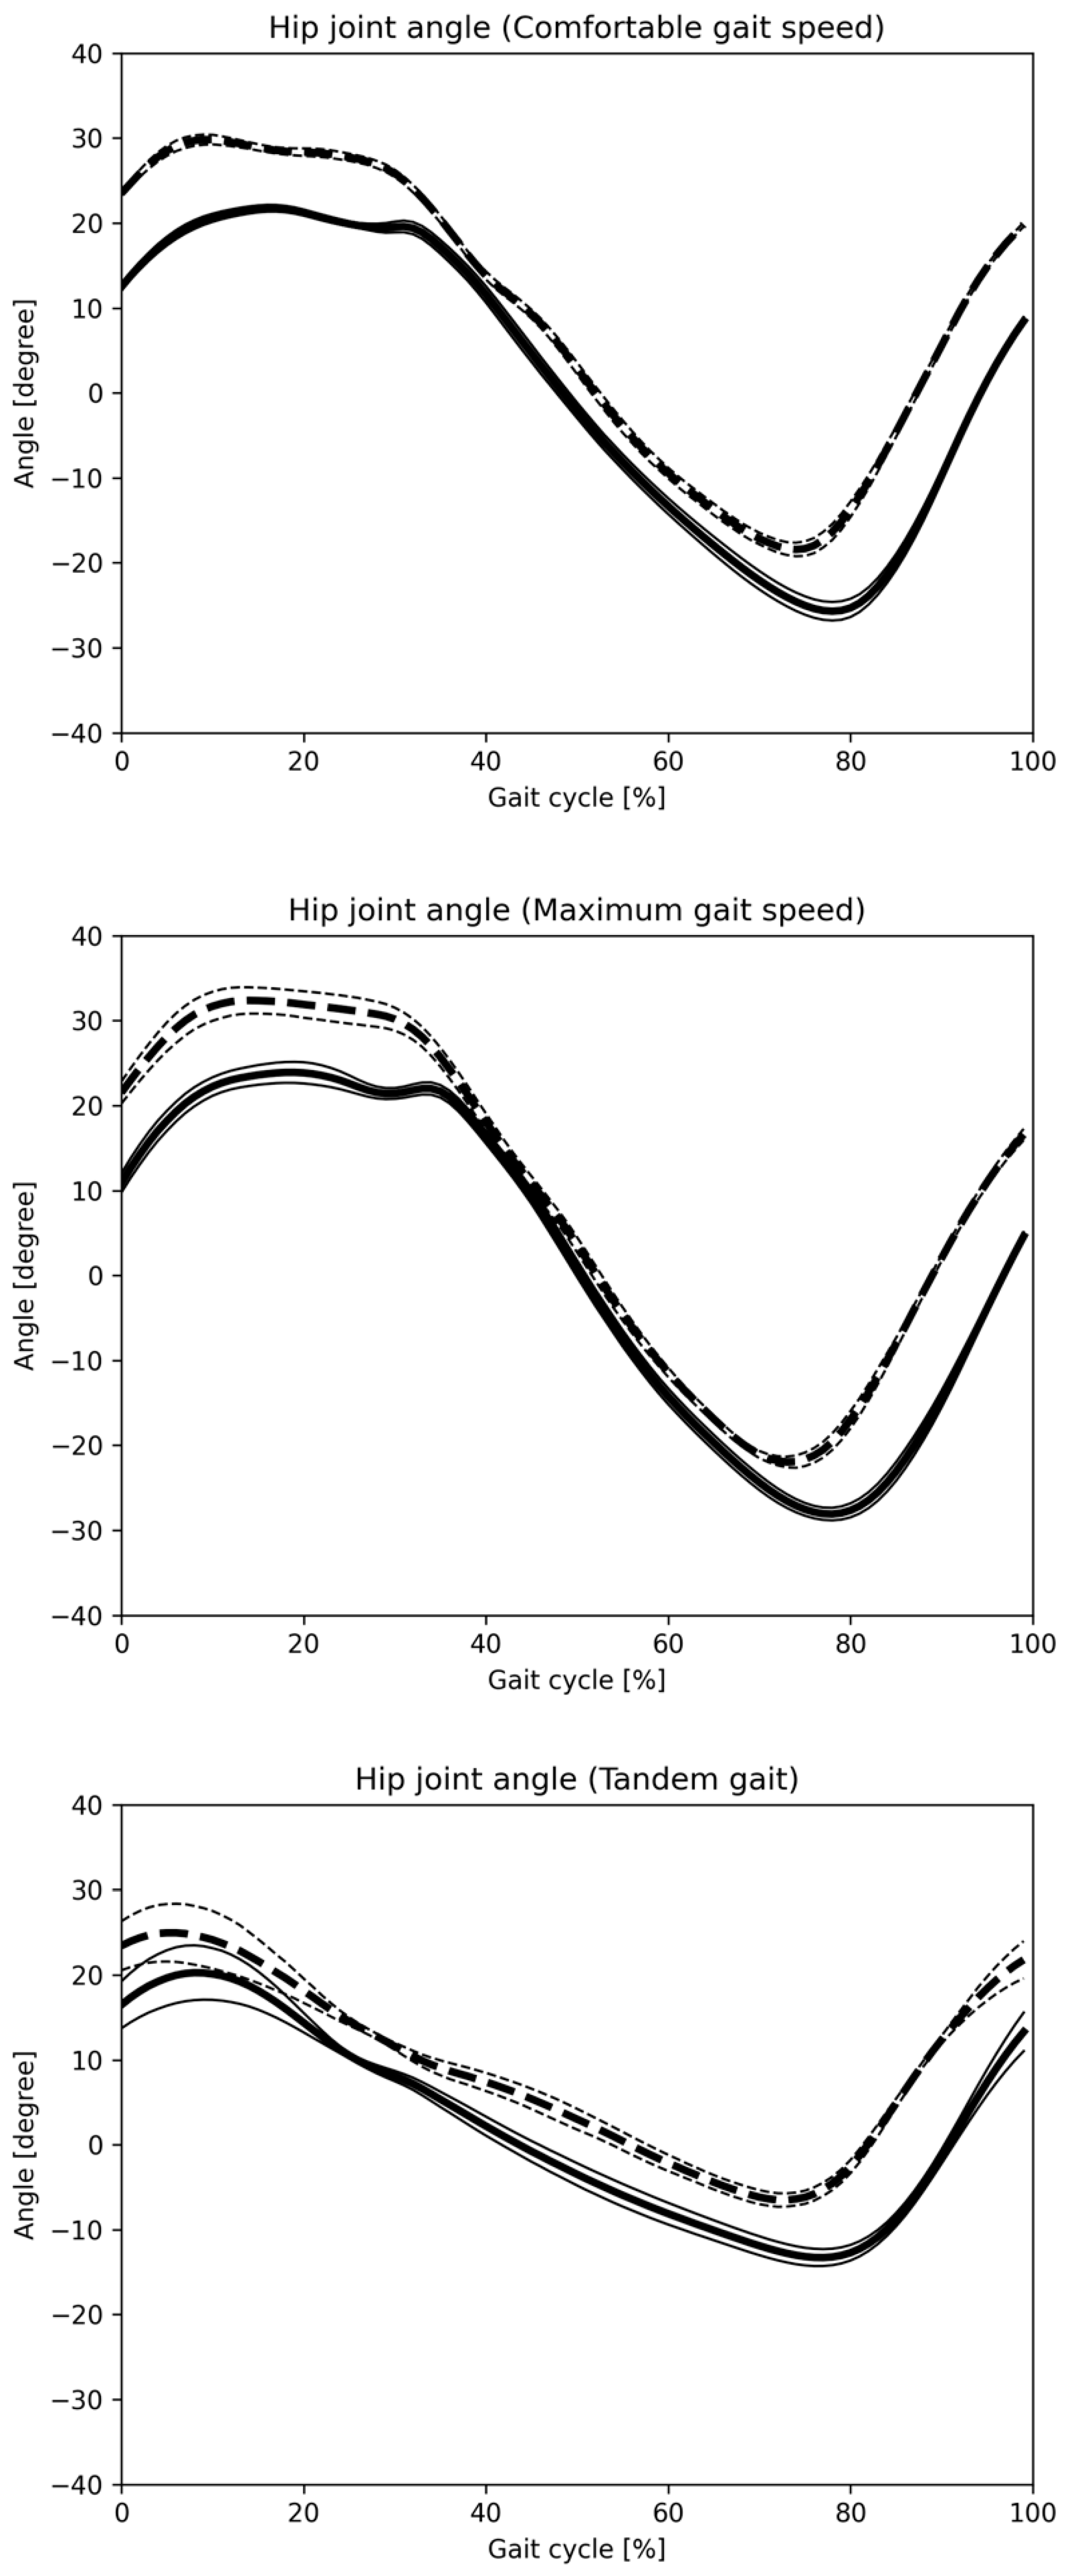
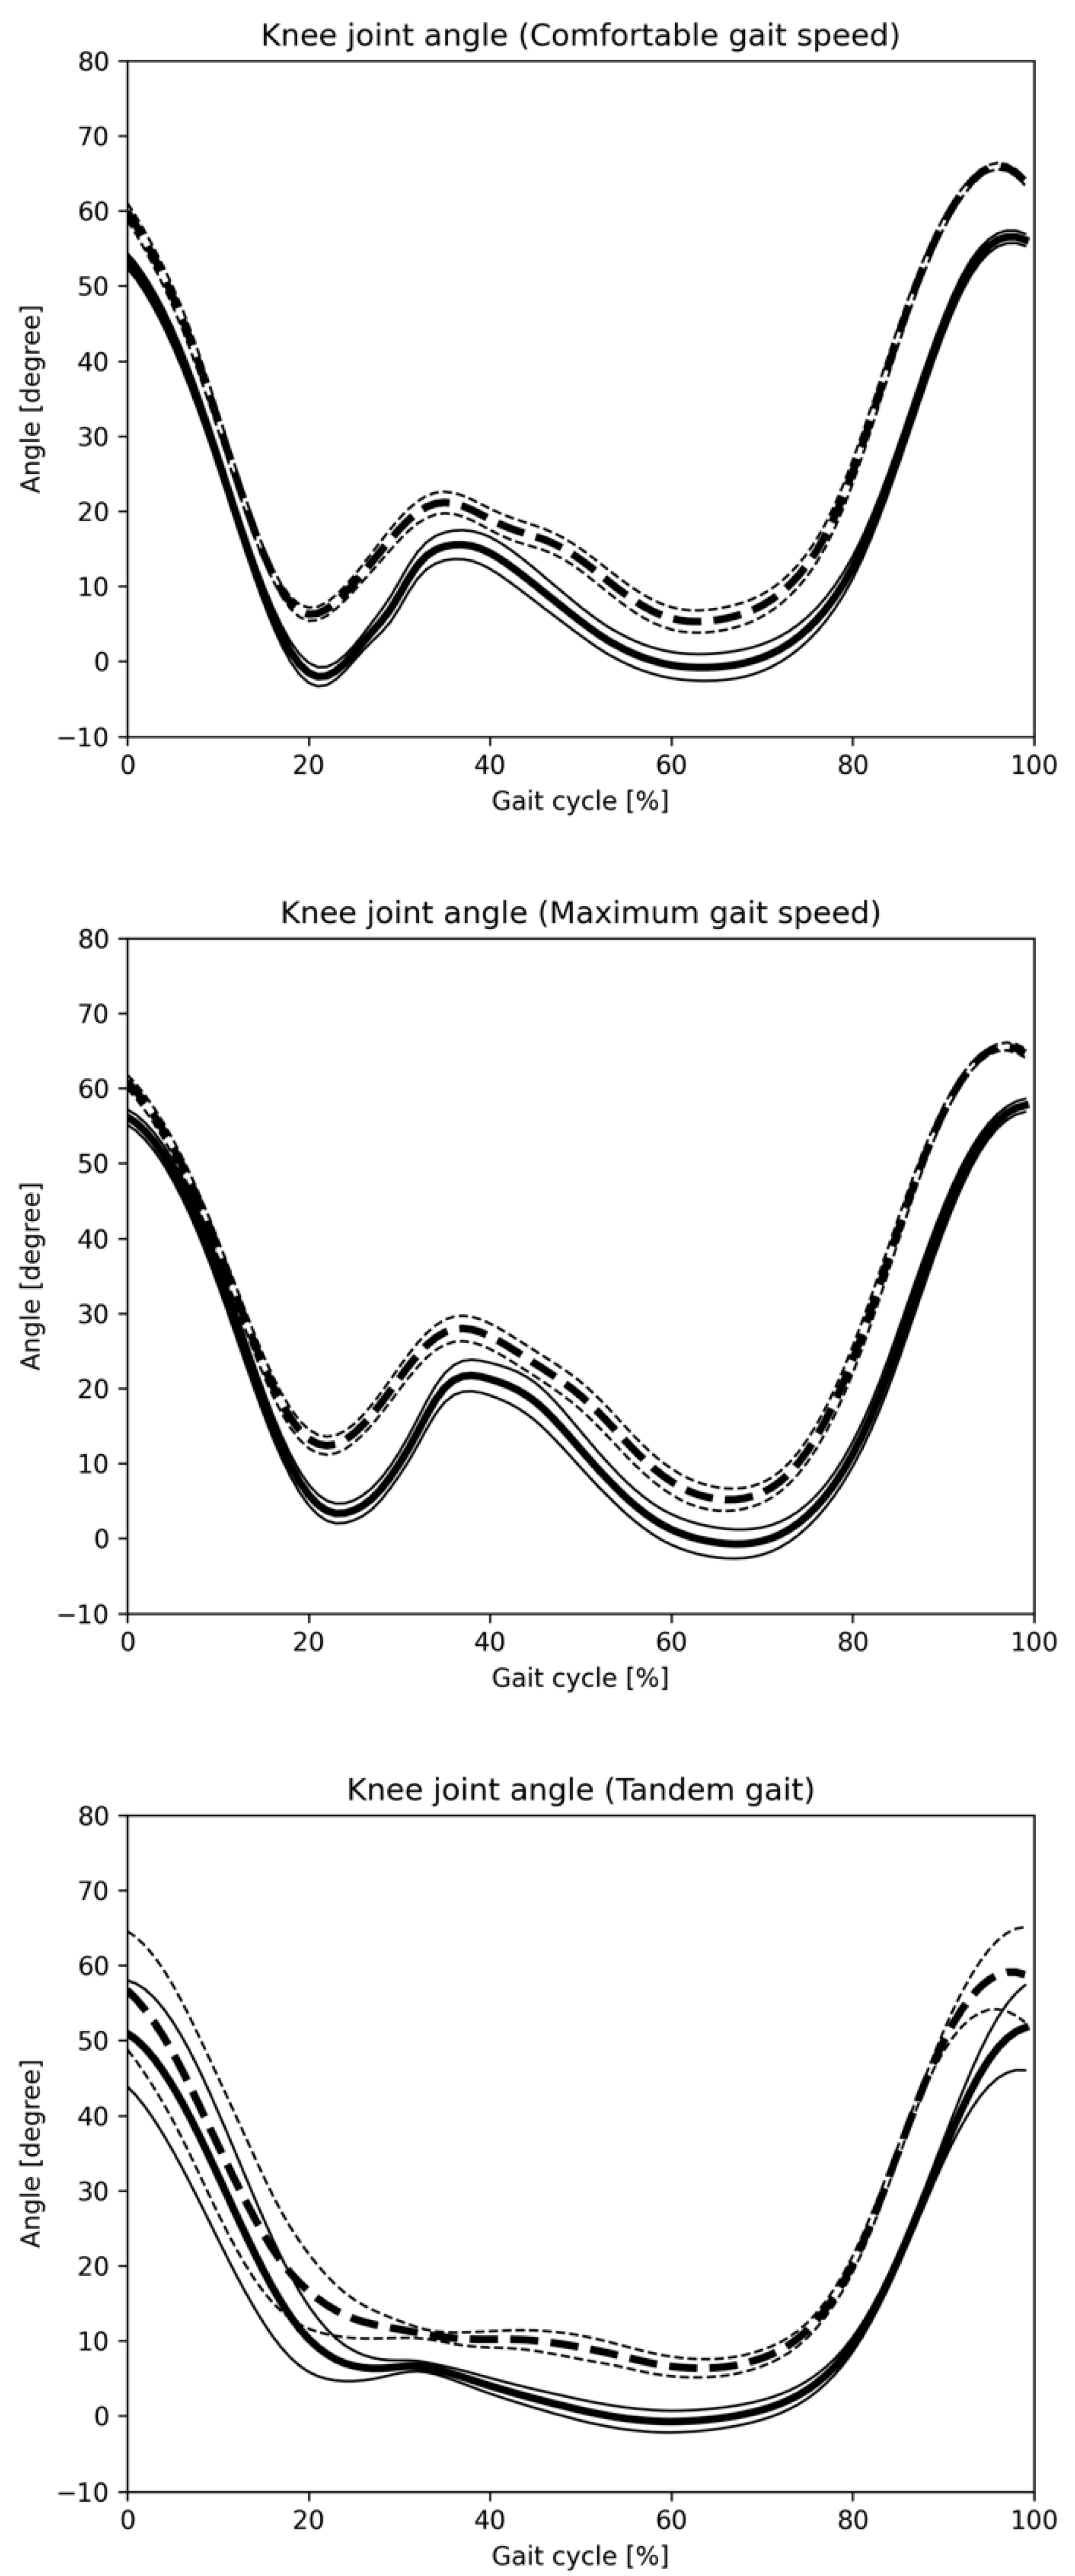
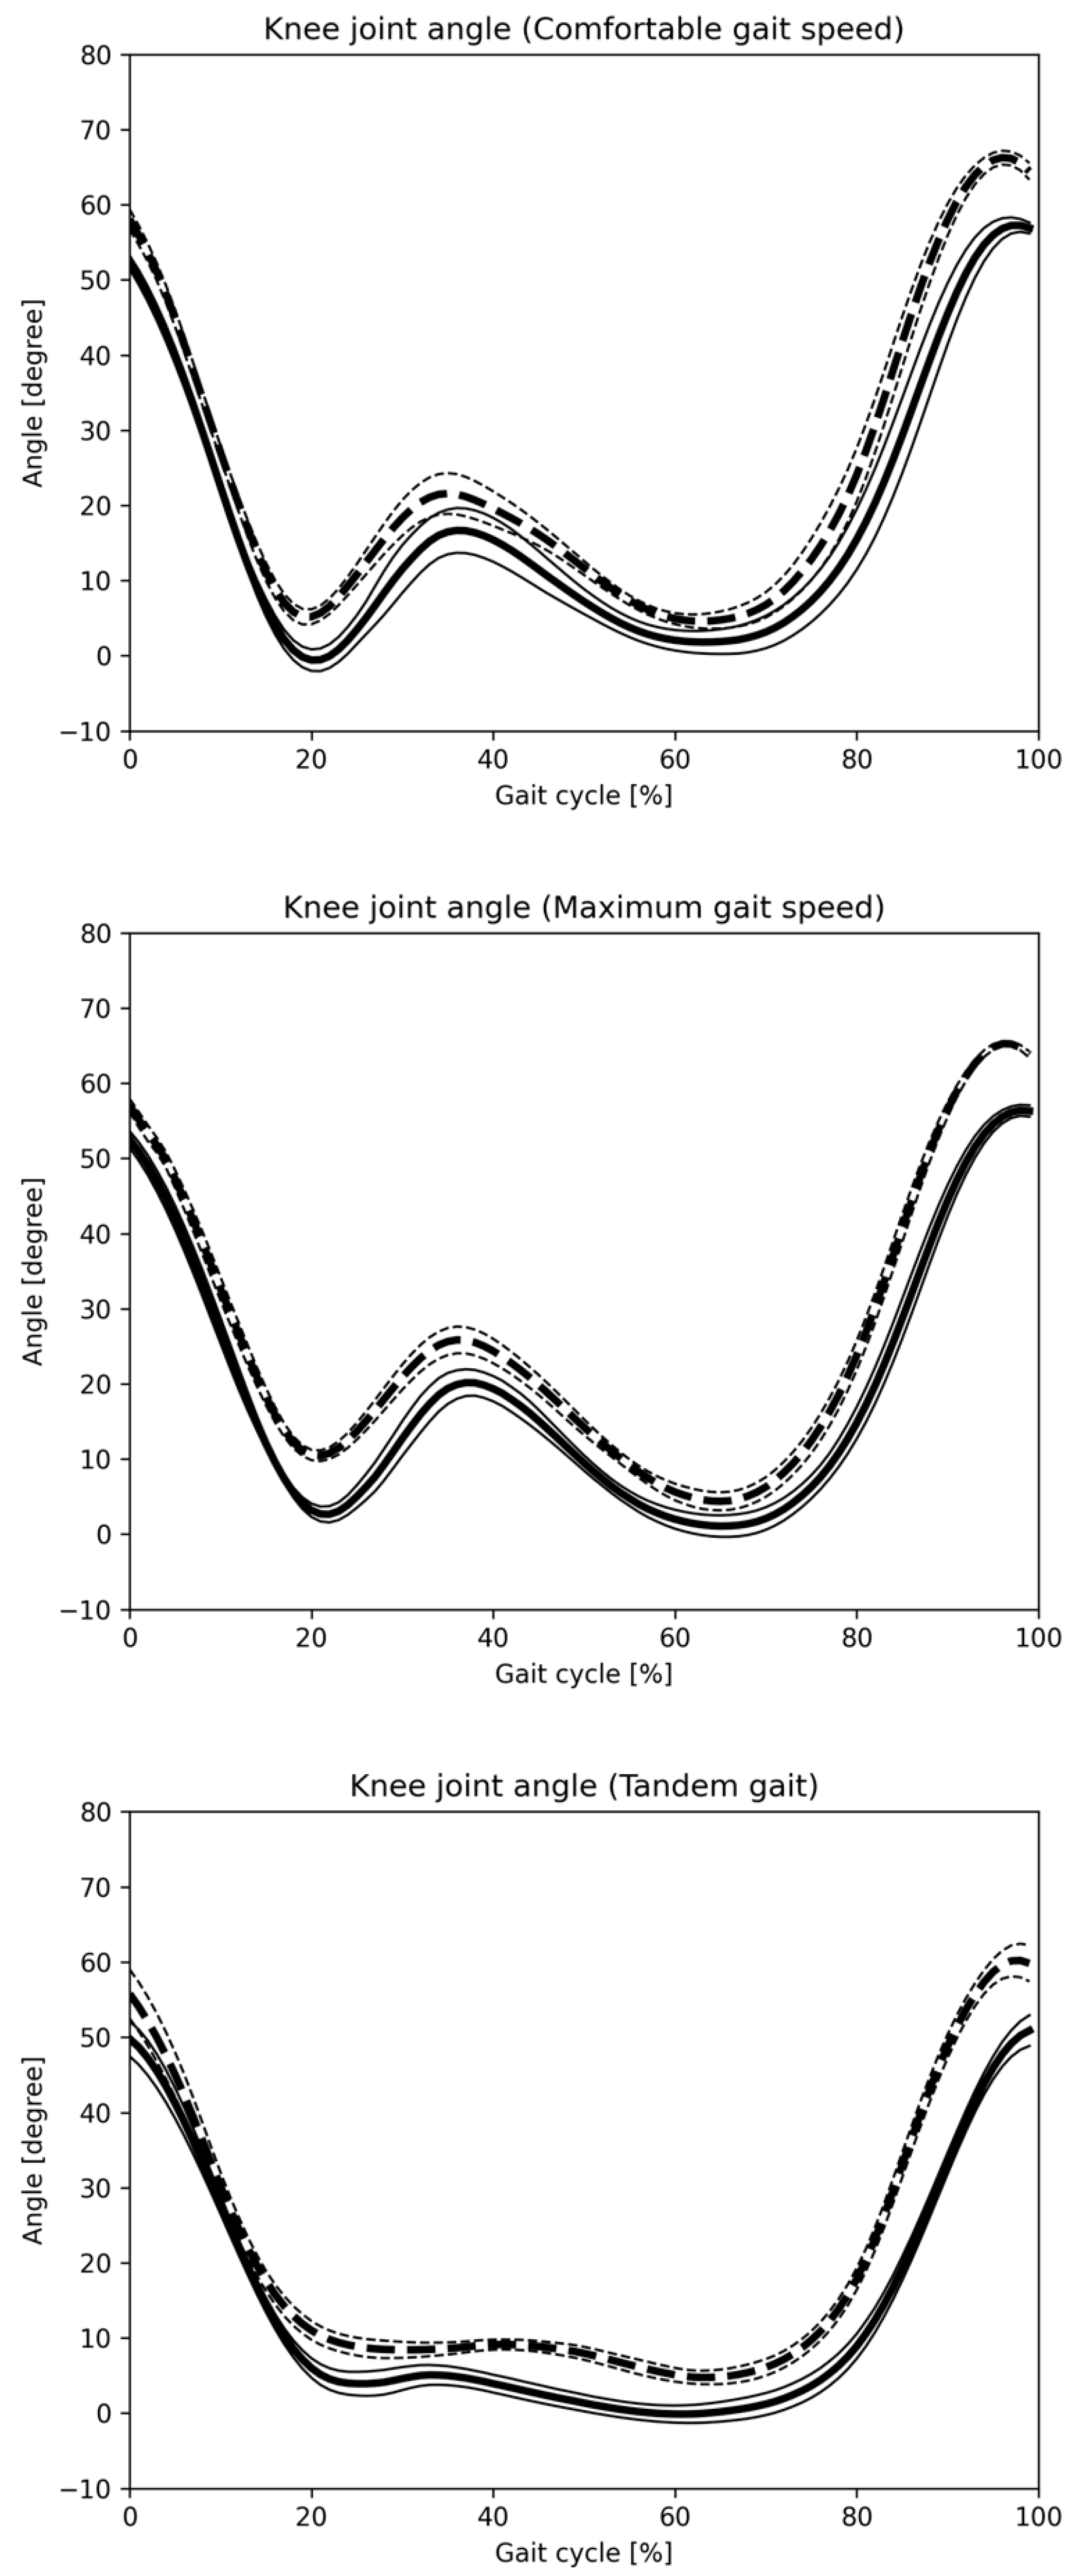
- Summary of joint angle changes across three gait patterns.
- Gait cycle normalization, where 0% represents the point at which the hip joint’s central axis crosses over the ankle joint’s central axis, with 100% representing one complete gait cycle.
- Solid lines represent the mean values for monocular and composite camera systems, while dashed lines denote Vicon system values, with standard deviation (SD) values also provided.
3.3. Criterion Validity
4. Discussion
5. Conclusions
Author Contributions
Funding
Institutional Review Board Statement
Informed Consent Statement
Data Availability Statement
Acknowledgments
Conflicts of Interest
References
- Ota, M.; Tateuchi, H.; Hashiguchi, T.; Kato, T.; Ogino, Y.; Yamagata, M.; Ichihashi, N. Verification of reliability and validity of motion analysis systems during bilateral squat using human pose tracking algorithm. Gait Posture 2020, 80, 62–67. [Google Scholar] [CrossRef]
- Brodie, M.A.; Coppens, M.J.; Ejupi, A.; Gschwind, Y.J.; Annegarn, J.; Schoene, D.; Wieching, R.; Lord, S.R.; Delbaere, K. Comparison between clinical gait and daily-life gait assessments of fall risk in older people. Geriatr. Gerontol. Int. 2017, 17, 2274–2282. [Google Scholar] [CrossRef] [PubMed]
- Winter, D.A. Biomechanics and Motor Control of Human Movement, 2nd ed.; John Wiley & Sons, Inc.: New York, NY, USA, 1990; ISBN 978-0-4703-9818-0. [Google Scholar]
- Cappozzo, A.; Della Croce, U.; Leardini, A.; Chiari, L. Human movement analysis using stereophotogrammetry. Part 1: Theoretical background. Gait Posture 2005, 21, 186–196. [Google Scholar] [CrossRef]
- Ota, M.; Tateuchi, H.; Hashiguchi, T.; Ichihashi, N. Verification of validity of gait analysis systems during treadmill walking and running using human pose tracking algorithm. Gait Posture 2021, 85, 290–297. [Google Scholar] [CrossRef] [PubMed]
- Pfister, A.; West, A.M.; Bronner, S.; Noah, J.A. Comparative abilities of Microsoft Kinect and Vicon 3D motion capture for gait analysis. J. Med. Eng. Technol. 2014, 38, 274–280. [Google Scholar] [CrossRef] [PubMed]
- Asogwa, C.O.; Nagano, H.; Wang, K.; Begg, R. Using deep learning to predict minimum foot-ground clearance event from toe-off kinematics. Sensors 2022, 22, 6960. [Google Scholar] [CrossRef]
- Vishnoi, N.; Duric, Z.; Gerber, N.L. Markerless identification of key events in gait cycle using image flow. In Proceedings of the 2012 Annual International Conference of the IEEE Engineering in Medicine and Biology Society, San Diego, CA, USA, 28 August–1 September 2012; pp. 4839–4842. [Google Scholar] [CrossRef]
- Liang, S.; Zhang, Y.; Diao, Y.; Li, G.; Zhao, G. The reliability and validity of gait analysis system using 3D markerless pose estimation algorithms. Bioeng. Biotechnol. 2022, 8, 10. [Google Scholar] [CrossRef] [PubMed]
- Fan, J.; Gu, F.; Lv, L.; Zhang, Z.; Zhu, C.; Qi, J.; Wang, H.; Liu, X.; Yang, J.; Zhu, Q. Reliability of a human pose tracking algorithm for measuring upper limb joints: Comparison with photography-based goniometry. BMC Musculoskelet Disord. 2022, 23, 877. [Google Scholar] [CrossRef]
- Baker, R.; Esquenazi, A.; Benedetti, M.G.; Desloovere, K. Gait analysis: Clinical facts. Eur. J. Phys. Rehabil. Med. 2016, 52, 560–574. [Google Scholar]
- Colyer, S.L.; Evans, M.; Cosker, D.P.; Salo, A.I.T. A Review of the Evolution of Vision-Based Motion Analysis and the Integration of Advanced Computer Vision Methods Towards Developing a Markerless System. Sports Med. Open 2018, 4, 24. [Google Scholar] [CrossRef] [PubMed]
- De Rosario, H.; Scataglini, S.; Basso, F.; Alemany, S.; Saeys, W.; Truijen, S. Applications of Using 4D Scanning Technologies in Biomechanics; Springer Nature: Cham, Switzerland, 2023; pp. 98–105. [Google Scholar] [CrossRef]
- Desmarais, Y.; Mottet, D.; Slangen, P.; Montesinos, P. A review of 3D human pose estimation algorithms for markerless motion capture. Comput. Vis. Image Underst. 2021, 212, 103275. [Google Scholar] [CrossRef]
- Scataglini, S.; Abts, E.; Van Bocxlaer, C.; Van den Bussche, M.; Meletani, S.; Truijen, S. Accuracy, Validity, and Reliability of Markerless Camera-Based 3D Motion Capture Systems versus Marker-Based 3D Motion Capture Systems in Gait Analysis: A Systematic Review and Meta-Analysis. Sensors 2024, 24, 3686. [Google Scholar] [CrossRef] [PubMed]
- Mentiplay, B.F.; Perraton, L.G.; Bower, K.J.; Pua, Y.H.; McGaw, R.; Heywood, S.; Clark, R.A. Gait assessment using the Microsoft Xbox One Kinect: Concurrent validity and inter-day reliability of spatiotemporal and kinematic variables. J. Biomech. 2015, 48, 2166–2170. [Google Scholar] [CrossRef] [PubMed]
- Xu, X.; McGorry, R.W.; Chou, L.S.; Lin, J.H.; Chang, C.C. Accuracy of the Microsoft Kinect for measuring gait parameters during treadmill walking. Gait Posture 2015, 42, 145–151. [Google Scholar] [CrossRef] [PubMed]
- Geerse, D.J.; Coolen, B.H.; Roerdink, M. Kinematic Validation of a Multi-Kinect v2 Instrumented 10-m Walkway for Quantitative Gait Assessments. PLoS ONE 2015, 10, e0139913. [Google Scholar] [CrossRef]
- Springer, S.; Yogev Seligmann, G. Validity of the Kinect for Gait Assessment: A Focused Review. Sensors 2016, 4, 194. [Google Scholar] [CrossRef]
- Next-System: VisionPose. Available online: https://www.next-system.com/visionpose (accessed on 15 November 2024).
- Todoriki, K.; Kai, Y.; Terao, Z.; Nishio, T.; Mochiduki, H.; Murata, S. Reproducibility and validity of knee joint position estimation using markerless motion capture. Jpn. J. Health Promot. Phys. Therapy. 2023, 13, 7–11. [Google Scholar] [CrossRef]
- Zago, M.; Luzzago, M.; Marangoni, T.; De Cecco, M.; Tarabini, M.; Galli, M. 3D tracking of human motion using visual skeletonization and stereoscopic vision. Front. Bioeng. Biotechnol. 2020, 8, 181. [Google Scholar] [CrossRef]
- Nakano, N.; Sakura, T.; Ueda, K.; Omura, L.; Kimura, A.; Iino, Y.; Fukashiro, S.; Yoshioka, S. Evaluation of 3D markerless motion capture accuracy using OpenPose with multiple video cameras. Front. Sports Act. Living 2020, 2, 50. [Google Scholar] [CrossRef] [PubMed]
- Matsuda, T.; Fujino, Y.; Makabe, H.; Morisawa, T.; Takahashi, T.; Kakegawa, K.; Matsumoto, T.; Kiyohara, T.; Torimoto, Y.; Miwa, M.; et al. Validity verification of human pose-tracking algorithms for their gait analysis capability. Sensors 2024, 24, 2516. [Google Scholar] [CrossRef]
- Clark, R.A.; Bower, K.J.; Mentiplay, B.F.; Paterson, K.; Pua, Y.H. Concurrent validity of the Microsoft Kinect for assessment of spatiotemporal gait variables. J. Biomech. 2013, 46, 2722–2725. [Google Scholar] [CrossRef] [PubMed]
- Koo, T.K.; Li, M.Y. A guideline of selecting and reporting intraclass correlation coefficients for reliability research. J. Chiropr. Med. 2016, 15, 155–163. [Google Scholar] [CrossRef]
- Cohen, J. Statistical Power Analysis for the Behavioral Science, 2nd ed.; Phycology Press: New York, NY, USA, 1988. [Google Scholar]
- Meldrum, D.; Shouldice, C.; Conroy, R.; Jones, K.; Forward, M. Test–retest reliability of three dimensional gait analysis: Including a novel approach to visualising agreement of gait cycle waveforms with Bland and Altman plots. Gait Posture 2014, 39, 265–271. [Google Scholar] [CrossRef] [PubMed]
- Fernandes, R.; Armada-da-Silva, P.; Pool-Goudzwaard, A.L.; Moniz-Pereira, V.; Veloso, A.P. Three dimensional multi-segmental trunk kinematics and kinetics during gait: Test–retest reliability and minimal detectable change. Gait Posture 2016, 46, 18–25. [Google Scholar] [CrossRef]
- Ino, T.; Samukawa, M.; Ishida, T.; Wada, N.; Koshino, Y.; Kasahara, S.; Tohyama, H. Validity of AI-based gait analysis for simultaneous measurement of bilateral lower limb kinematics using a single video camera. Sensors 2023, 23, 9799. [Google Scholar] [CrossRef] [PubMed]
- Ramesh, S.H.; Lemaire, E.D.; Tu, A.; Cheung, K.; Baddour, N. Automated implementation of the Edinburgh Visual Gait Score (EVGS) using OpenPose and handheld smartphone video. Sensors 2023, 23, 4839. [Google Scholar] [CrossRef]
- He, Q.; Chen, H.; Mo, X. Practical application of interactive AI technology based on visual analysis in professional system of physical education in universities. Heliyon 2024, 10, e24627. [Google Scholar] [CrossRef] [PubMed]


| (a) 1 | |||||||
|---|---|---|---|---|---|---|---|
| Item | Gait Pattern | Unstandardized Coefficients B | Constant | 95% CI for B (p Value) | R2 | ICC(2,k) | Cronbach’s Alpha |
| Step length | Com | 0.960 | 50.510 | 0.918 to 1.002 (p < 0.001) | 0.996 | 0.983 | 0.999 |
| Max | 0.999 | 54.037 | 0.958 to 1.041 (p < 0.001) | 0.996 | 0.991 | 0.999 | |
| Tandem | 1.031 | 17.321 | 0.898 to 1.163 (p < 0.001) | 0.965 | 0.990 | 0.991 | |
| Gait speed | Com | 0.933 | 36.376 | 0.876 to 0.990 (p < 0.001) | 0.992 | 0.981 | 0.997 |
| Max | 0.971 | 12.855 | 0.802 to 1.139 (p < 0.001) | 0.937 | 0.989 | 0.998 | |
| Tandem | 1.052 | 39.057 | 0.992 to 1.112 (p < 0.001) | 0.993 | 0.997 | 0.998 | |
| Stride time | Com | 1.039 | 5.964 | 0.651 to 1.427 (p < 0.001) | 0.759 | 0.933 | 0.932 |
| Max | 0.971 | 12.855 | 0.802 to 1.139 (p < 0.001) | 0.937 | 0.986 | 0.985 | |
| Tandem | 1.042 | 37.162 | 0.979 to 1.104 (p < 0.001) | 0.992 | 0.998 | 0.998 | |
| Stride length | Com | 0.969 | 40.839 | 0.916 to 1.021 (p < 0.001) | 0.993 | 0.986 | 0.998 |
| Max | 1.008 | 49.703 | 0.963 to 1.054 (p < 0.001) | 0.996 | 0.994 | 0.999 | |
| Tandem | 1.017 | 25.353 | 0.927 to 1.106 (p < 0.001) | 0.983 | 0.988 | 0.995 | |
| (b) 2 | |||||||
| Item | Gait Pattern | Unstandardized Coefficients B | Constant | 95% CI for B (p Value) | R2 | ICC(2,k) | Cronbach’s Alpha |
| Step length | Com | 0.939 | 28.184 | 0.864 to 1.015 (p < 0.001) | 0.988 | 0.984 | 0.996 |
| Max | 0.95 | 19.974 | 0.842 to 1.057 (p < 0.001) | 0.975 | 0.981 | 0.994 | |
| Tandem | 0.837 | 3.018 | 0.210 to 1.454 (p = 0.015) | 0.448 | 0.837 | 0.823 | |
| Gait speed | Com | 0.989 | 38.114 | 0.934 to 1.048 (p < 0.001) | 0.993 | 0.994 | 0.998 |
| Max | 0.974 | 31.132 | 0.903 to 1.045 (p < 0.001) | 0.990 | 0.994 | 0.998 | |
| Tandem | 0.905 | 17.715 | 0.790 to 1.021 (p < 0.001) | 0.969 | 0.991 | 0.991 | |
| Stride time | Com | 1.128 | 11.166 | 0.899 to 1.356 (p < 0.001) | 0.925 | 0.899 | 0.977 |
| Max | 0.936 | 18.261 | 0.820 to 1.052 (p < 0.001) | 0.971 | 0.949 | 0.993 | |
| Tandem | 0.996 | 55.667 | 0.955 to 1.036 (p < 0.001) | 0.997 | 0.995 | 0.999 | |
| Stride length | Com | 0.985 | 30.044 | 0.910 to 1.059 (p < 0.001) | 0.989 | 0.991 | 0.997 |
| Max | 0.99 | 25.562 | 0.902 to 1.077 (p < 0.001) | 0.985 | 0.991 | 0.997 | |
| Tandem | 0.917 | 4.921 | 0.495 to 1.339 (p < 0.001) | 0.699 | 0.927 | 0.920 | |
| (a) 1 | ||||||||
|---|---|---|---|---|---|---|---|---|
| Measurement | Mean Data | Test-Retest ICC(1,k) | ||||||
| Vicon | Monocular Camera | Diff | Vicon | Monocular Camera | ||||
| Mean | SD | Mean | SD | |||||
| Step length (mm) | Com | 694.8 | 74.0 | 714.4 | 76.9 | 19.6 | 0.997 | 0.997 |
| Max | 799.7 | 102.6 | 818.9 | 102.5 | 19.2 | 0.997 | 0.997 | |
| Tandem | 328.8 | 32.0 | 332.0 | 30.5 | 3.2 | 0.986 | 0.985 | |
| Gait speed (m/s) | Com | 1.33 | 0.16 | 1.37 | 0.17 | 0.04 | 0.996 | 0.996 |
| Max | 1.87 | 0.30 | 1.93 | 0.31 | 0.06 | 0.997 | 0.997 | |
| Tandem | 0.58 | 0.14 | 0.59 | 0.13 | 0.01 | 0.997 | 0.996 | |
| Stride time (s) | Com | 1.04 | 0.04 | 1.05 | 0.04 | 0.00 | 0.960 | 0.982 |
| Max | 0.86 | 0.05 | 0.86 | 0.05 | 0.00 | 0.984 | 0.990 | |
| Tandem | 1.18 | 0.21 | 1.17 | 0.20 | −0.01 | 0.994 | 0.997 | |
| Stride length (mm) | Com | 1382.9 | 142.4 | 1416.2 | 146.6 | 33.3 | 0.998 | 0.998 |
| Max | 1587.2 | 198.0 | 1617.6 | 195.9 | 30.5 | 0.998 | 0.999 | |
| Tandem | 658.0 | 63.2 | 670.2 | 61.7 | 12.2 | 0.990 | 0.990 | |
| (b) 2 | ||||||||
| Measurement | Mean Data | Test-Retest ICC(1,k) | ||||||
| Vicon | Composite Camera | Diff | Vicon | Composite Camera | ||||
| Mean | SD | Mean | SD | |||||
| Step length (mm) | Com | 724.8 | 104.2 | 750.3 | 110.3 | 25.5 | 0.994 | 0.995 |
| Max | 833.4 | 116.3 | 862.7 | 121.1 | 29.3 | 0.997 | 0.997 | |
| Tandem | 371.5 | 54.0 | 379.5 | 54.8 | 8.0 | 0.984 | 0.978 | |
| Gait speed (m/s) | Com | 1.37 | 0.23 | 1.40 | 0.23 | 0.03 | 0.996 | 0.996 |
| Max | 1.88 | 0.32 | 1.92 | 0.33 | 0.04 | 0.998 | 0.998 | |
| Tandem | 0.62 | 0.16 | 0.64 | 0.17 | 0.02 | 0.995 | 0.995 | |
| Stride time (s) | Com | 1.09 | 0.05 | 1.06 | 0.04 | −0.03 | 0.953 | 0.982 |
| Max | 0.91 | 0.05 | 0.89 | 0.06 | −0.02 | 0.978 | 0.990 | |
| Tandem | 1.21 | 0.23 | 1.18 | 0.23 | −0.03 | 0.991 | 0.996 | |
| Stride length (mm) | Com | 1446.9 | 206.6 | 1481.9 | 208.8 | 35.0 | 0.998 | 0.997 |
| Max | 1662.5 | 229.2 | 1699.9 | 230.0 | 37.4 | 0.999 | 0.998 | |
| Tandem | 737.3 | 102.8 | 749.2 | 105.6 | 11.9 | 0.989 | 0.987 | |
| (a) 1 | |||||||||
|---|---|---|---|---|---|---|---|---|---|
| Item | Mean Data | Test-Retest ICC(1,k) | |||||||
| Vicon | Monocular Camera | Diff | Vicon | Monocular Camera | |||||
| Mean | SD | Mean | SD | ||||||
| Hip joint | Flexion angle (°) | Com | 22.5 | 1.9 | 30.3 | 2.3 | 7.9 | 0.976 | 0.983 |
| Max | 26.3 | 3.8 | 35.4 | 5.5 | 9.1 | 0.991 | 0.995 | ||
| Tandem | 20.3 | 4.8 | 25.2 | 4.7 | 4.8 | 0.990 | 0.994 | ||
| Extension angle (°) | Com | 25.9 | 2.3 | 18.8 | 2.1 | −7.12 | 0.985 | 0.980 | |
| Max | 28.8 | 2.2 | 22.6 | 2.7 | −6.23 | 0.981 | 0.985 | ||
| Tandem | 13.4 | 2.1 | 6.1 | 1.8 | −7.24 | 0.936 | 0.969 | ||
| Knee joint | Flexion angle (°) | Com | 56.2 | 4.1 | 65.7 | 2.5 | 9.53 | 0.974 | 0.976 |
| Max | 58.2 | 5.0 | 65.9 | 2.9 | 7.68 | 0.979 | 0.976 | ||
| Tandem | 54.3 | 10.2 | 60.8 | 9.3 | 6.43 | 0.994 | 0.995 | ||
| Extension angle (°) | Com | −4.8 | 3.2 | 2.5 | 3.2 | 7.3 | 0.987 | 0.991 | |
| Max | −3.1 | 3.7 | 3.3 | 3.9 | 6.4 | 0.987 | 0.988 | ||
| Tandem | −1.2 | 3.4 | 4.9 | 2.6 | 6.0 | 0.953 | 0.969 | ||
| (b) 2 | |||||||||
| Item | Mean Data | Test-Retest ICC(1,k) | |||||||
| VICON | Composite Camera | Diff | Vicon | Composite Camera | |||||
| Mean | SD | Mean | SD | ||||||
| Hip joint | Flexion angle (°) | Com | 24.0 | 2.6 | 31.5 | 3.7 | 7.5 | 0.981 | 0.983 |
| Max | 28.3 | 3.6 | 36.3 | 4.8 | 8.0 | 0.979 | 0.988 | ||
| Tandem | 20.0 | 1.7 | 25.5 | 2.4 | 5.4 | 0.948 | 0.966 | ||
| Extension angle (°) | Com | 25.4 | 3.0 | 20.1 | 2.7 | −5.3 | 0.980 | 0.971 | |
| Max | 28.8 | 3.4 | 24.2 | 3.4 | −4.5 | 0.978 | 0.984 | ||
| Tandem | 15.5 | 2.5 | 8.9 | 1.8 | −6.6 | 0.941 | 0.963 | ||
| Knee joint | Flexion angle (°) | Com | 56.7 | 3.7 | 65.5 | 3.4 | 8.8 | 0.975 | 0.968 |
| Max | 58.7 | 3.6 | 66.5 | 2.7 | 7.8 | 0.967 | 0.988 | ||
| Tandem | 52.8 | 5.8 | 60.0 | 6.2 | 7.2 | 0.986 | 0.978 | ||
| Extension angle (°) | Com | −5.6 | 3.1 | −0.5 | 3.7 | 5.0 | 0.986 | 0.973 | |
| Max | −3.7 | 3.2 | −1.1 | 4.0 | 2.6 | 0.982 | 0.984 | ||
| Tandem | −4.4 | 4.5 | −0.2 | 3.7 | 4.2 | 0.968 | 0.974 | ||
| (a) 1 | |||||||
|---|---|---|---|---|---|---|---|
| Item | Gait Pattern | Unstandardized Coefficients B | Constant | 95% CI for B (p Value) | R2 | ICC(3,k) | Cronbach’s Alpha |
| Hip | |||||||
| Com | Flexion | 0.695 | 4.363 | 0.340 to 1.050 (p = 0.001) | 0.621 | 0.889 | 0.889 |
| Extension | 1.045 | 8.126 | 0.759 to 1.333 (p < 0.001) | 0.855 | 0.961 | 0.961 | |
| Max | Flexion | 0.652 | 8.634 | 0.484 to 0.820 (p < 0.001) | 0.870 | 0.936 | 0.936 |
| Extension | 0.734 | 5.913 | 0.457 to 1.010 (p < 0.001) | 0.755 | 0.929 | 0.929 | |
| Tandem | Flexion | 0.979 | 10.558 | 0.772 to 1.185 (p < 0.001) | 0.909 | 0.978 | 0.978 |
| Extension | 0.800 | 3.175 | 0.238 to 1.361 (p = 0.010) | 0.452 | 0.826 | 0.826 | |
| Knee | |||||||
| Com | Flexion | 1.405 | 5.776 | 0.863 to 1.947 (p < 0.001) | 0.746 | 0.881 | 0.881 |
| Extension | 0.806 | 4.110 | 0.369 to 1.242 (p = 0.002) | 0.806 | 0.884 | 0.884 | |
| Max | Flexion | 1.499 | 5.933 | 0.936 to 2.062 (p < 0.001) | 0.757 | 0.871 | 0.871 |
| Extension | 0.814 | 5.393 | 0.478 to 1.151 (p < 0.001) | 0.719 | 0.925 | 0.925 | |
| Tandem | Flexion | 1.063 | 13.724 | 0.890 to 1.235 (p < 0.001) | 0.945 | 0.985 | 0.985 |
| Extension | 1.184 | 8.003 | 0.854 to 1.514 (p < 0.001) | 0.851 | 0.949 | 0.949 | |
| (b) 2 | |||||||
| Item | Gait Pattern | Unstandardized Coefficients B | Constant | 95% CI for B (p Value) | R2 | ICC(3,k) | Cronbach’s Alpha |
| Hip | |||||||
| Com | Flexion | 0.628 | 6.567 | 0.412 to 0.845 (p < 0.001) | 0.808 | 0.919 | 0.919 |
| Extension | 0.943 | 4.772 | 0.496 to 1.390 (p = 0.001) | 0.685 | 0.914 | 0.914 | |
| Max | Flexion | 0.688 | 7.631 | 0.484 to 0.892 (p < 0.001) | 0.851 | 0.942 | 0.942 |
| Extension | 0.856 | 4.850 | 0.457 to 1.256 (p < 0.001) | 0.692 | 0.919 | 0.919 | |
| Tandem | Flexion | 0.625 | 4.687 | 0.323 to 0.926 (p = 0.001) | 0.677 | 0.893 | 0.893 |
| Extension | 0.250 | 0.589 | −0.710 to 1.210 (p = 0.571) | −0.070 | 0.314 | 0.314 | |
| Knee | |||||||
| Com | Flexion | 1.040 | 9.369 | 0.789 to 1.292 (p < 0.001) | 0.897 | 0.974 | 0.974 |
| Extension | 0.611 | 3.316 | 0.194 to 1.028 (p = 0.009) | 0.500 | 0.925 | 0.925 | |
| Max | Flexion | 1.070 | 4.275 | 0.504 to 1.636 (p < 0.002) | 0.633 | 0.883 | 0.883 |
| Extension | 0.623 | 3.637 | 0.235 to 1.010 (p = 0.005) | 0.550 | 0.86 | 0.86 | |
| Tandem | Flexion | 0.880 | 8.033 | 0.632 to 1.128 (p < 0.001) | 0.864 | 0.966 | 0.966 |
| Extension | 0.757 | 2.589 | 0.096 to 1.418 (p = 0.029) | 0.363 | 0.785 | 0.785 | |
Disclaimer/Publisher’s Note: The statements, opinions and data contained in all publications are solely those of the individual author(s) and contributor(s) and not of MDPI and/or the editor(s). MDPI and/or the editor(s) disclaim responsibility for any injury to people or property resulting from any ideas, methods, instructions or products referred to in the content. |
© 2025 by the authors. Licensee MDPI, Basel, Switzerland. This article is an open access article distributed under the terms and conditions of the Creative Commons Attribution (CC BY) license (https://creativecommons.org/licenses/by/4.0/).
Share and Cite
Matsuda, T.; Fujino, Y.; Morisawa, T.; Takahashi, T.; Kakegawa, K.; Matsumoto, T.; Kiyohara, T.; Fukushima, H.; Higuchi, M.; Torimoto, Y.; et al. Reliability and Validity Examination of a New Gait Motion Analysis System. Sensors 2025, 25, 1076. https://doi.org/10.3390/s25041076
Matsuda T, Fujino Y, Morisawa T, Takahashi T, Kakegawa K, Matsumoto T, Kiyohara T, Fukushima H, Higuchi M, Torimoto Y, et al. Reliability and Validity Examination of a New Gait Motion Analysis System. Sensors. 2025; 25(4):1076. https://doi.org/10.3390/s25041076
Chicago/Turabian StyleMatsuda, Tadamitsu, Yuji Fujino, Tomoyuki Morisawa, Tetsuya Takahashi, Kei Kakegawa, Takanari Matsumoto, Takehiko Kiyohara, Hiroshi Fukushima, Makoto Higuchi, Yasuo Torimoto, and et al. 2025. "Reliability and Validity Examination of a New Gait Motion Analysis System" Sensors 25, no. 4: 1076. https://doi.org/10.3390/s25041076
APA StyleMatsuda, T., Fujino, Y., Morisawa, T., Takahashi, T., Kakegawa, K., Matsumoto, T., Kiyohara, T., Fukushima, H., Higuchi, M., Torimoto, Y., Miwa, M., Fujiwara, T., & Daida, H. (2025). Reliability and Validity Examination of a New Gait Motion Analysis System. Sensors, 25(4), 1076. https://doi.org/10.3390/s25041076