


Long-Term Wavelength Stability of Large Type II FBG Arrays in Different Silica-Based Fibers at High Temperature †

 , ,
, , 
Abstract
1. Introduction
2. Materials and Methods

| Fiber | Cladding Diameter | MFD 1 @ 1550 nm | Core Ge Doping | Coating |
|---|---|---|---|---|
| Corning 2 SMF-28 | 125 [26] | 10.4 [26] | ~4% | Acrylate |
| OFS 3 SMT-A1310H BF04446 | 125 [27] | 10.5 [27] | ~4% | Polyimide |
| Fibercore 4 SM1500(4.2/125)P | 125 [28] | 4.2 [28] | ~20% [29] | Polyimide |
| Fibercore 4 SM1500(4.2/125) | 125 [28] | 4.2 [28] | ~20% [29] | Acrylate |
| Fibercore 4 SM1500(4.2/80) | 80 | 4.2 [28] | ~20% [29] | Acrylate |
| Fibercore 4 SM1500(4.2/50) | 50 | 4.2 [28] | ~20% [29] | Acrylate |
| Sumitomo Electric 5 Z Fiber | 125 [30] | 10.4 [30] | None | Acrylate |
| OFS 3 SMP-E1550H2 | 125 | 10.5 | None | Polyimide |
| OFS 3 A1310 400 μm Clad | 400 | 10.5 [27] | ~4% | Acrylate |
3. Results
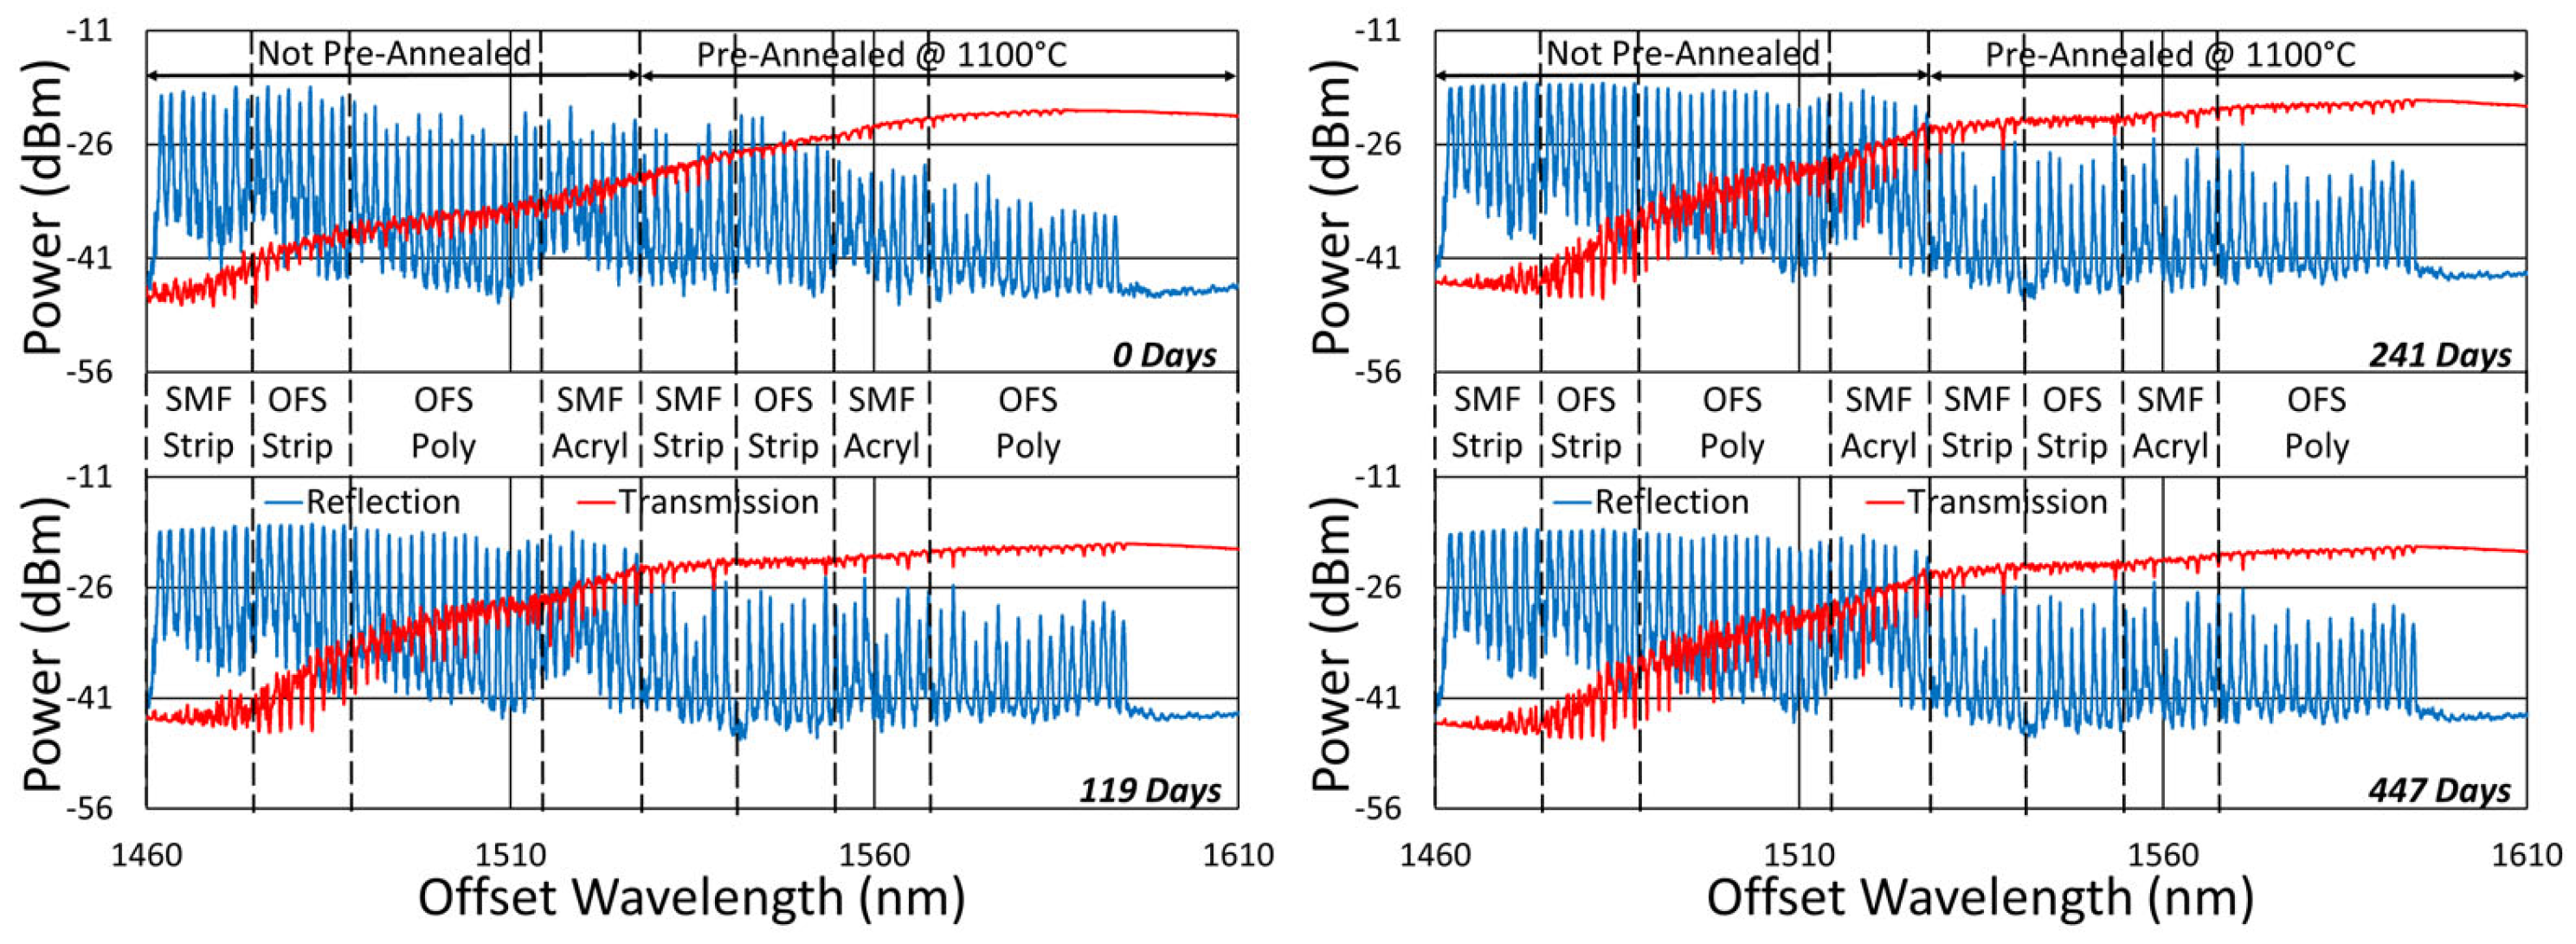
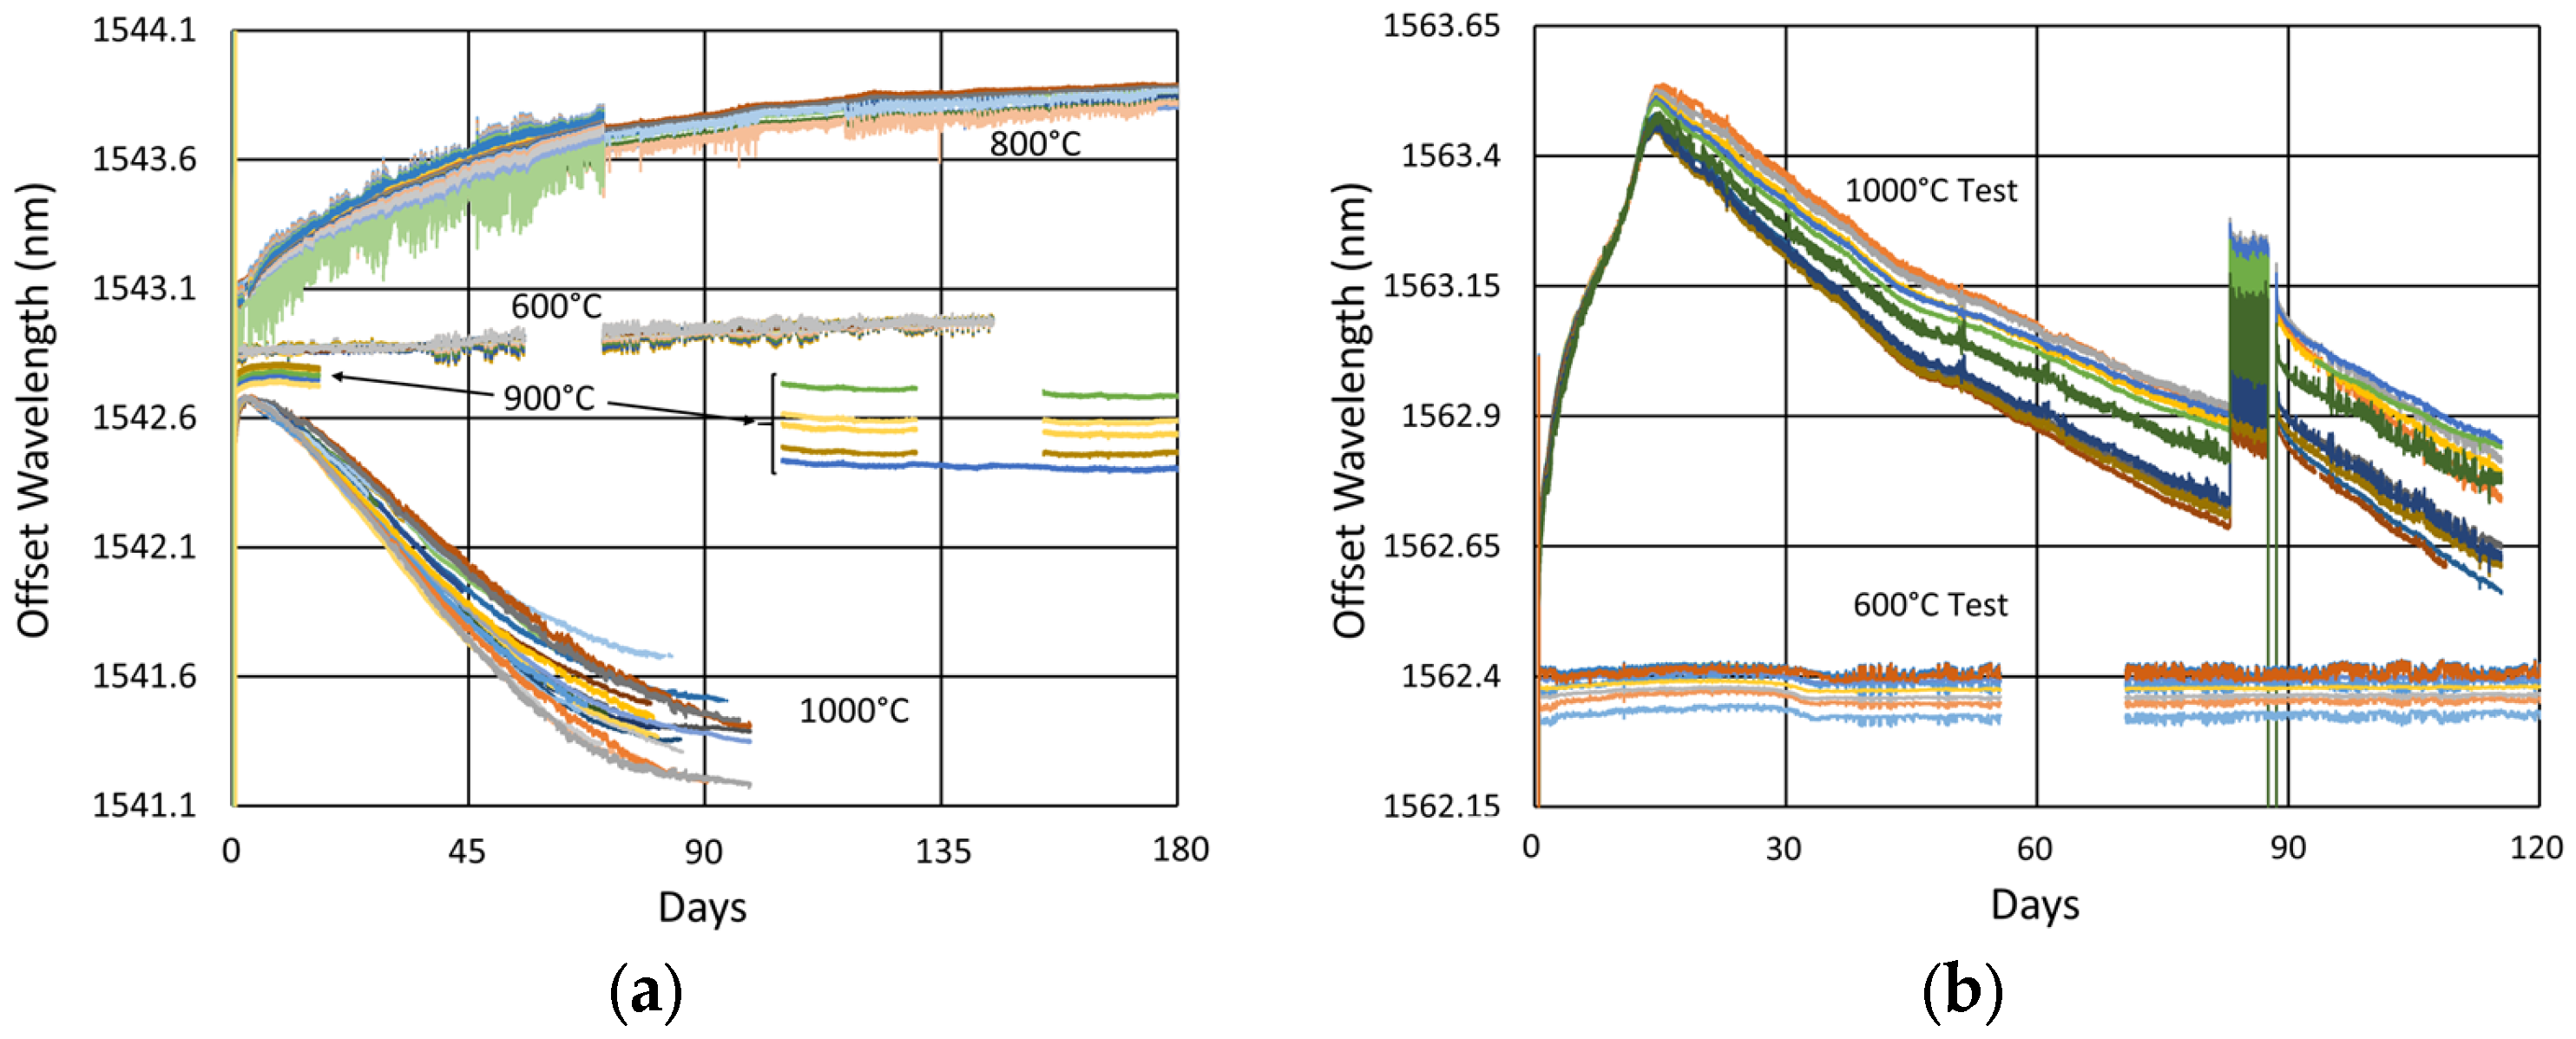
3.1. 1000 °C Test
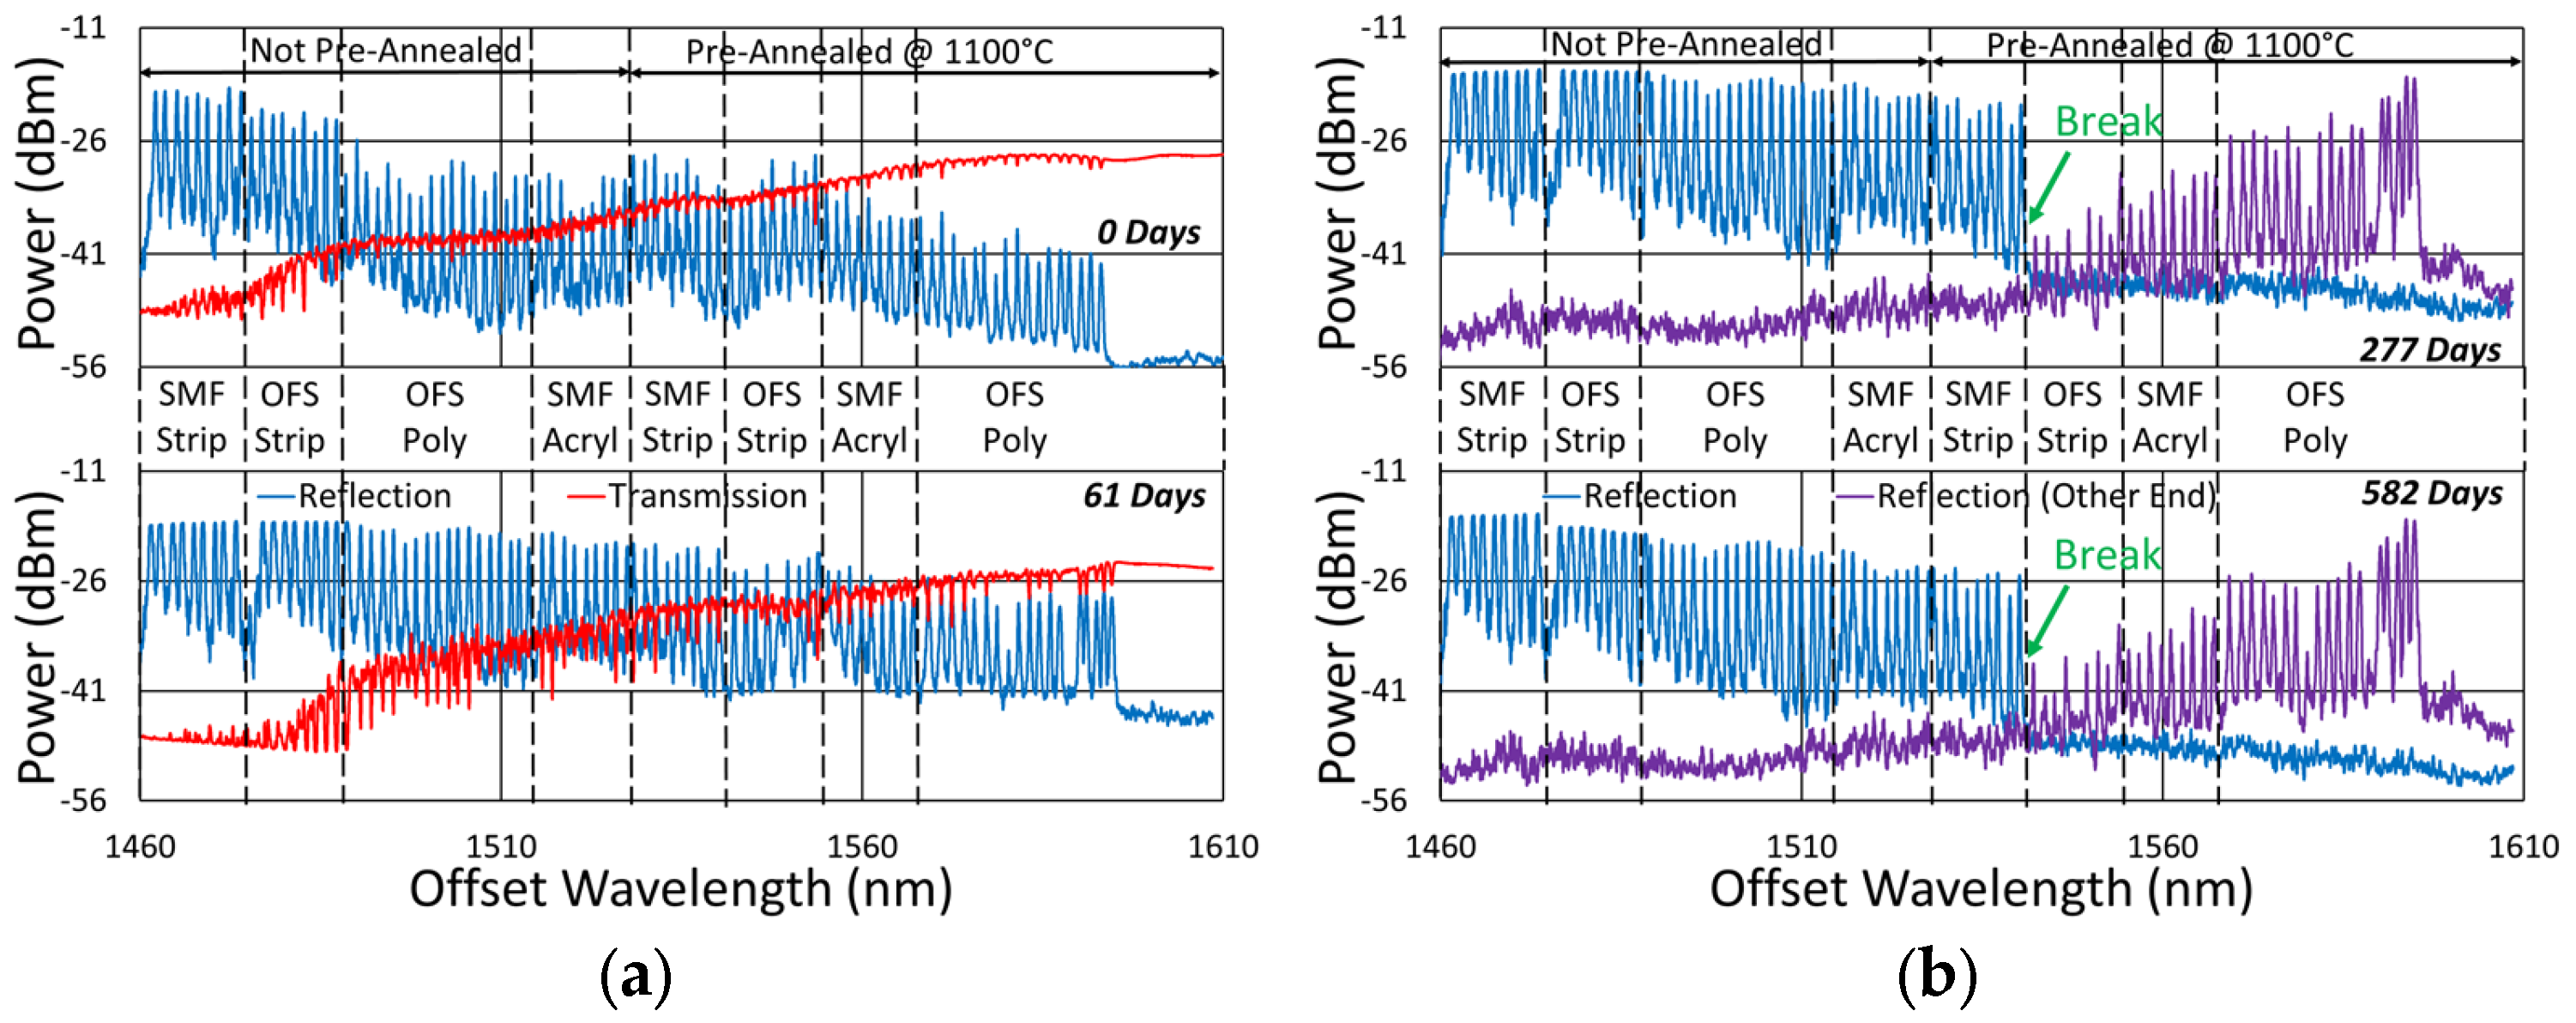
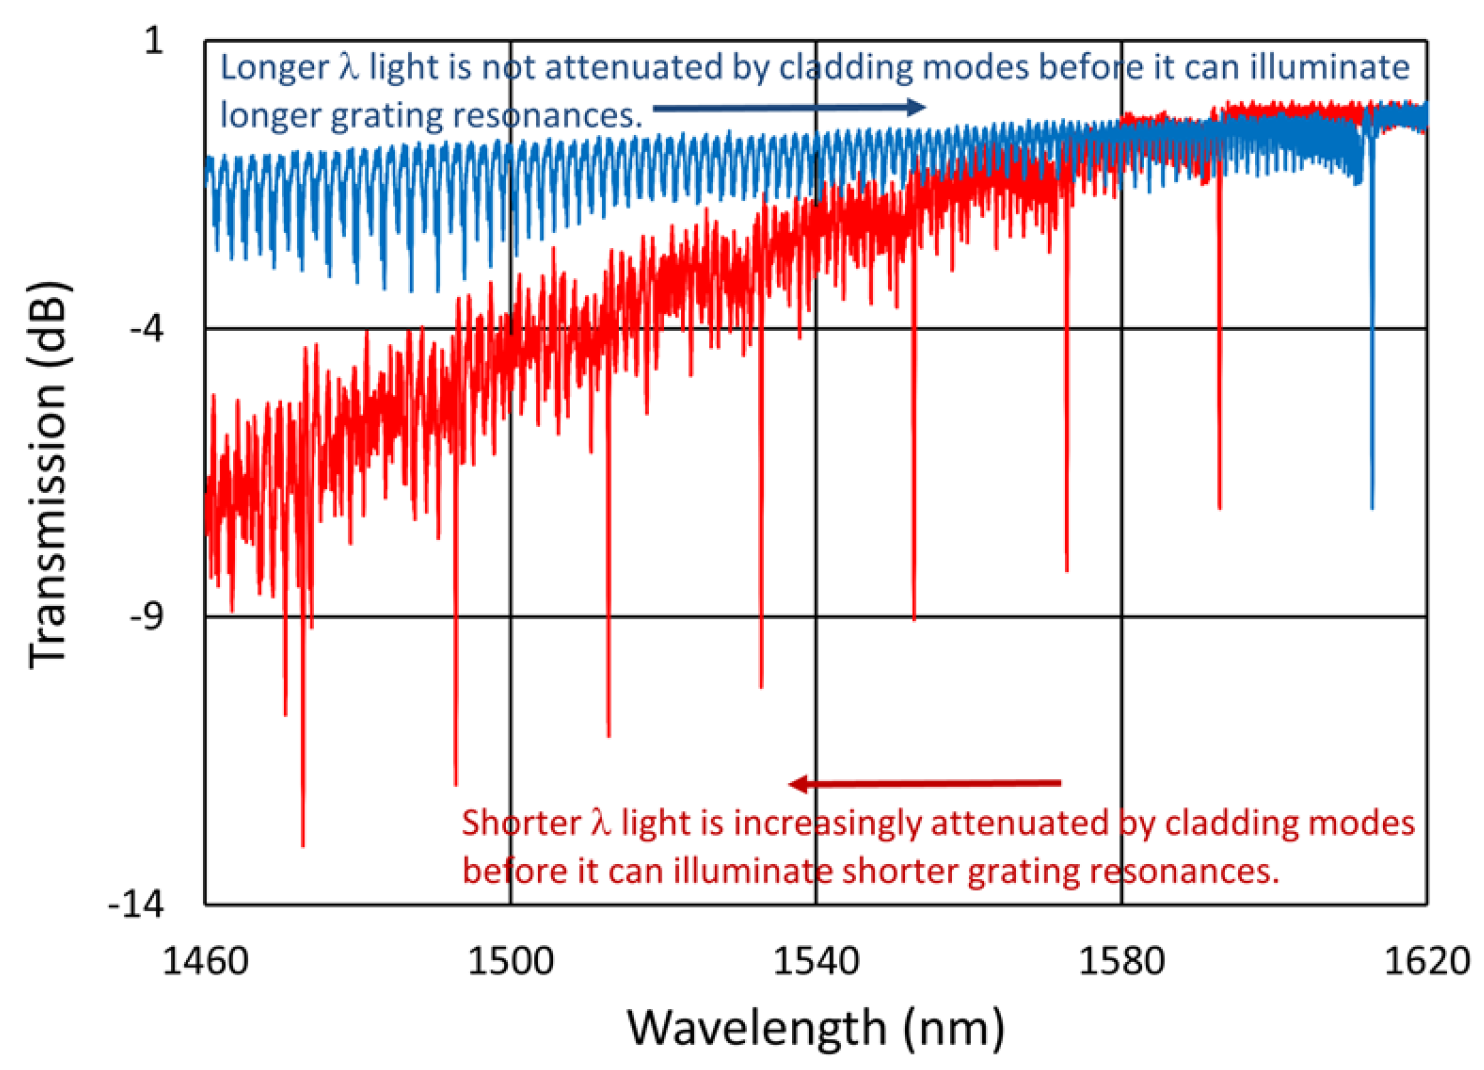
3.1.1. Spectral Data
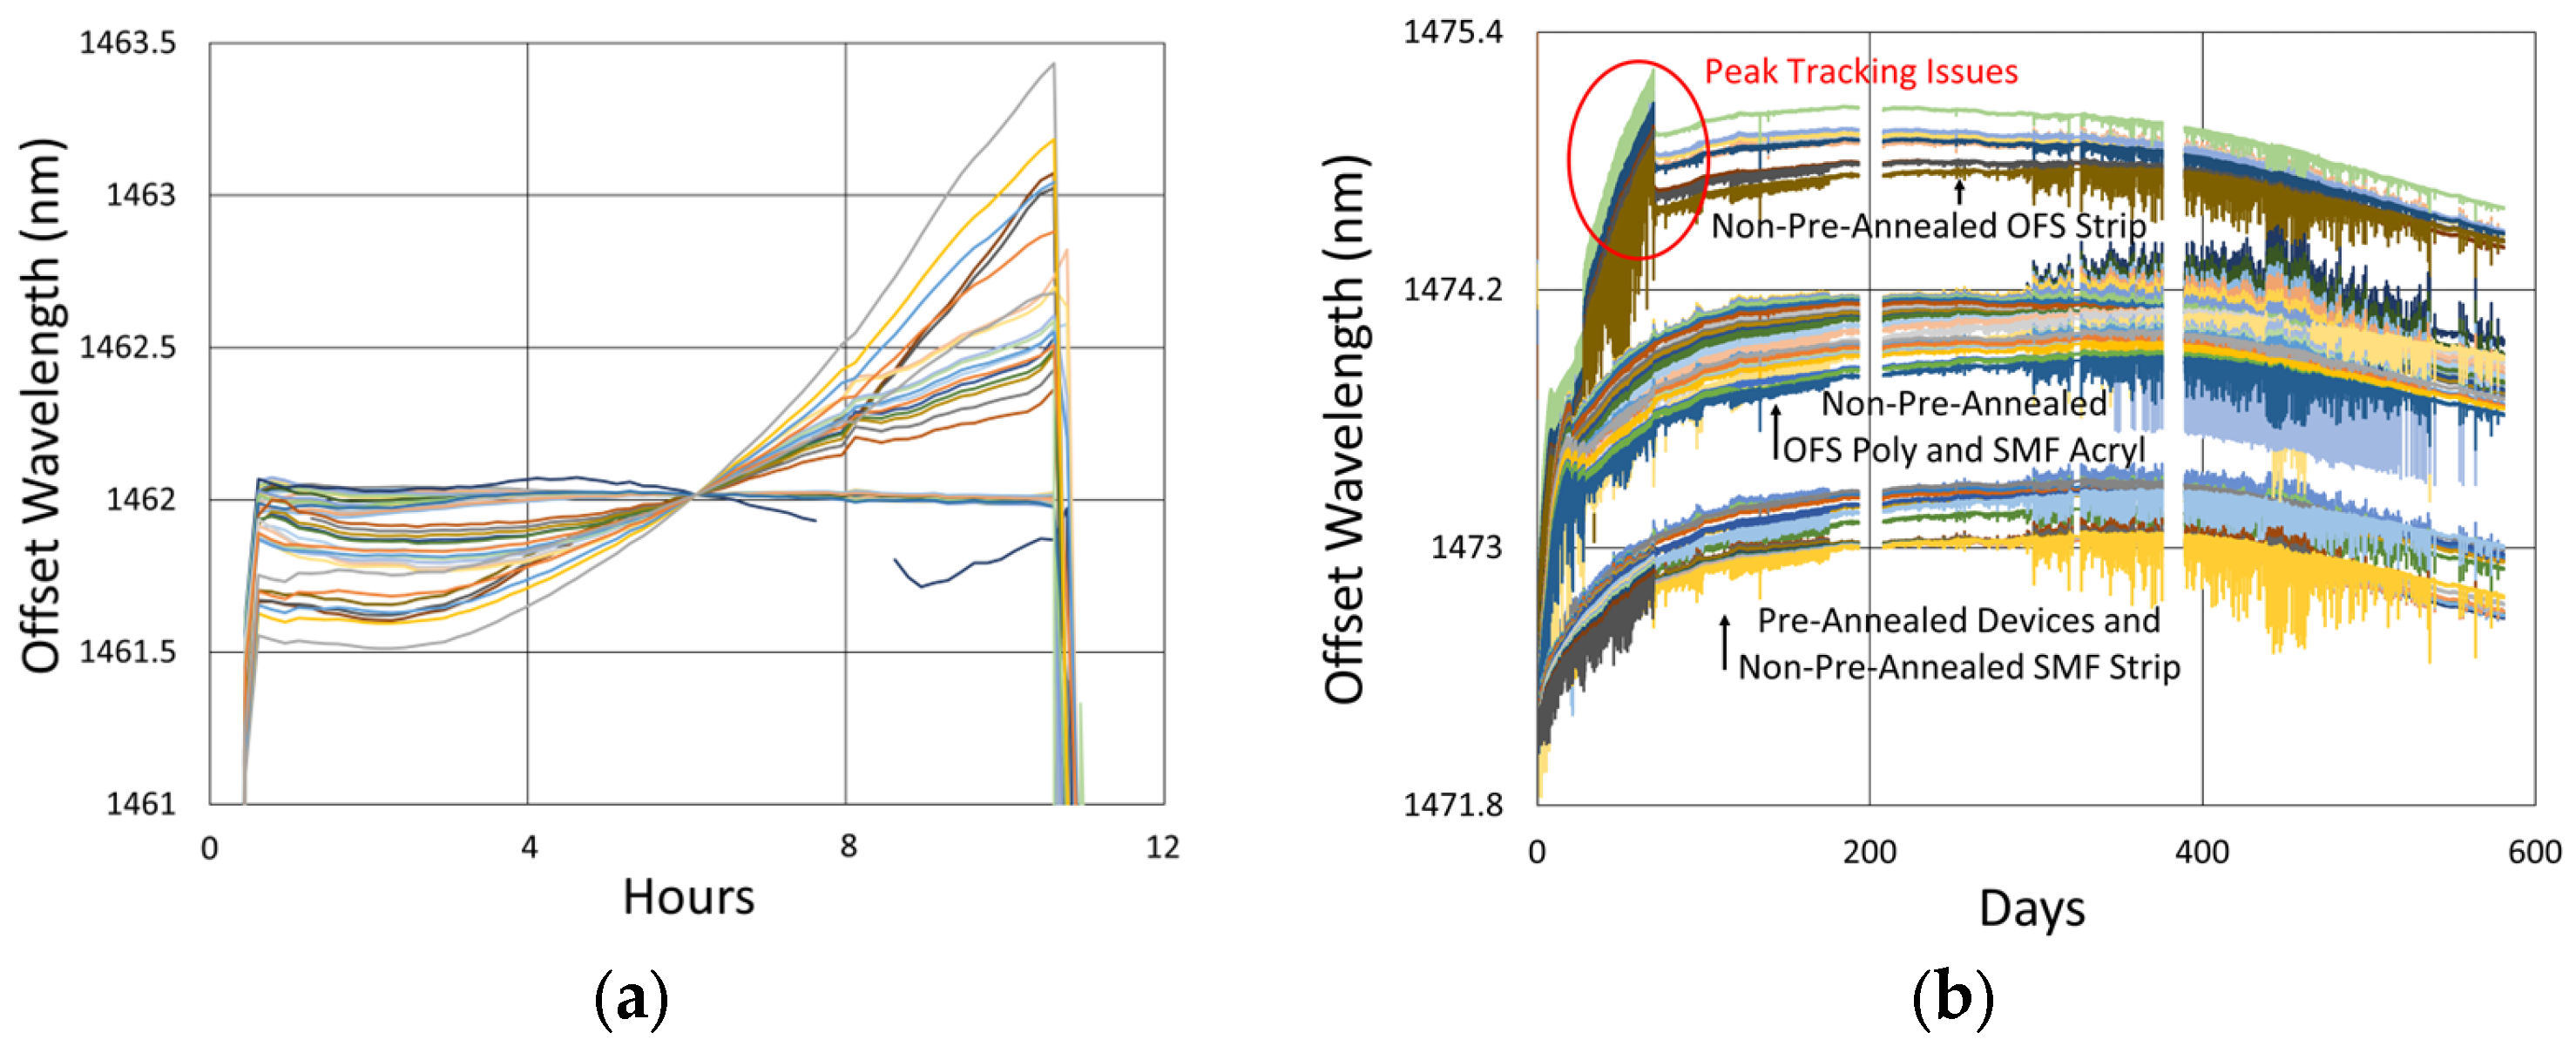
3.1.2. Temperature and Peak Data
3.1.3. Details and Trends
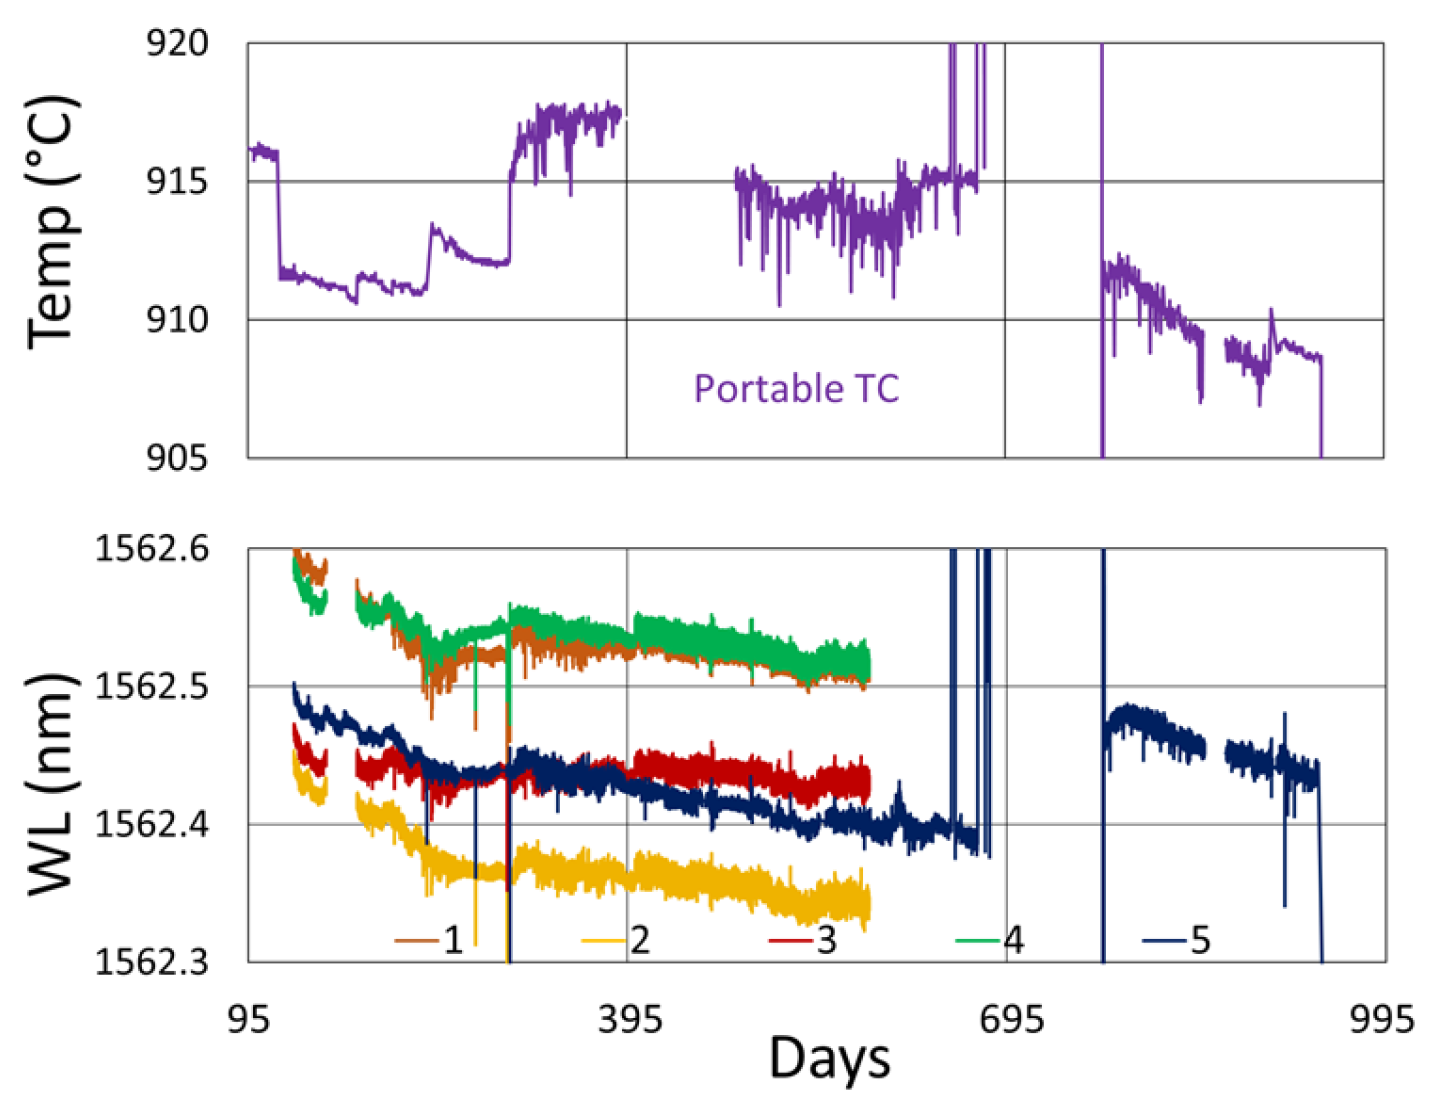
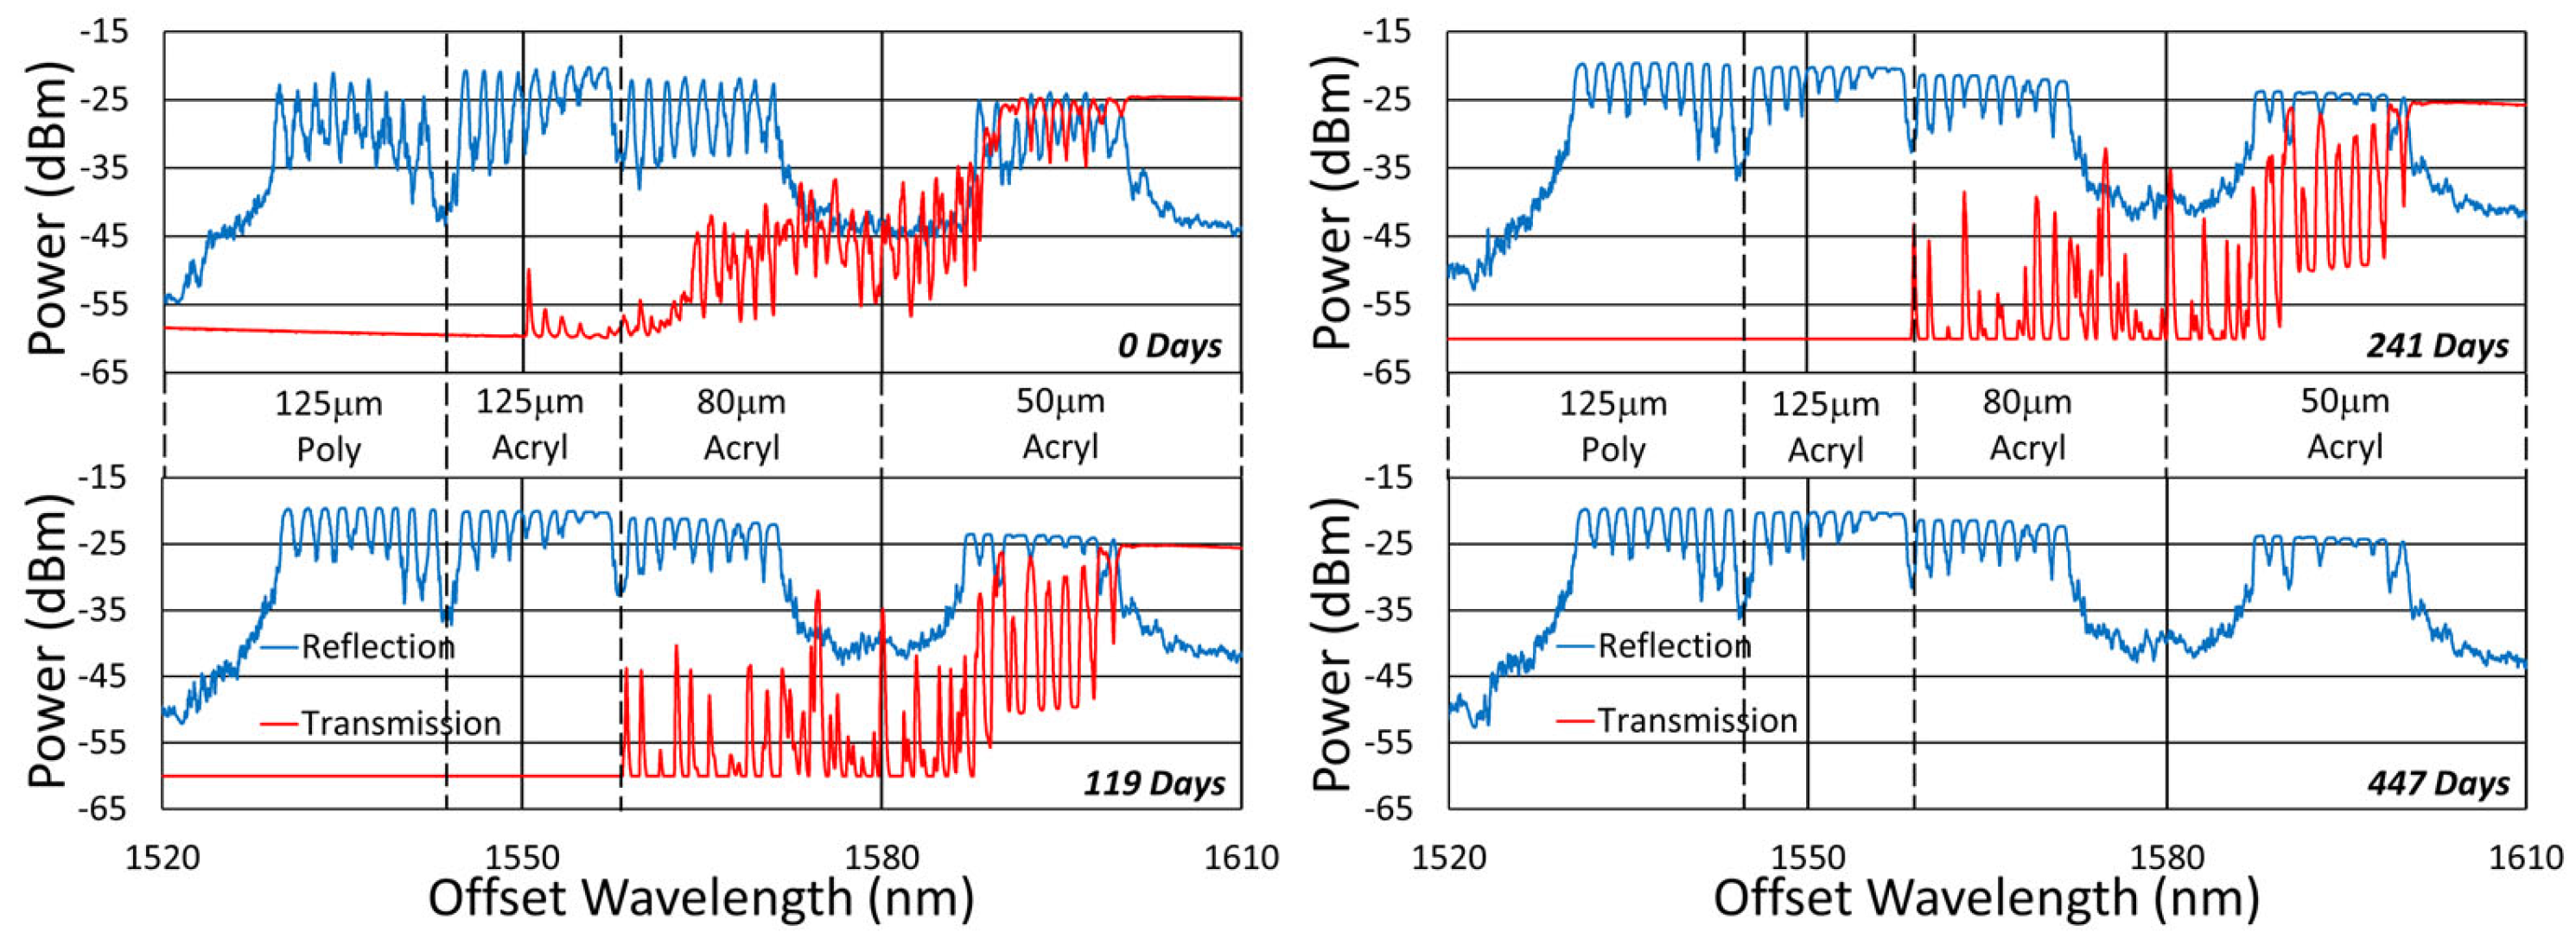
3.2. 900 °C Test
3.2.1. Spectral Data
3.2.2. Temperature and Peak Data
3.2.3. Details and Trends
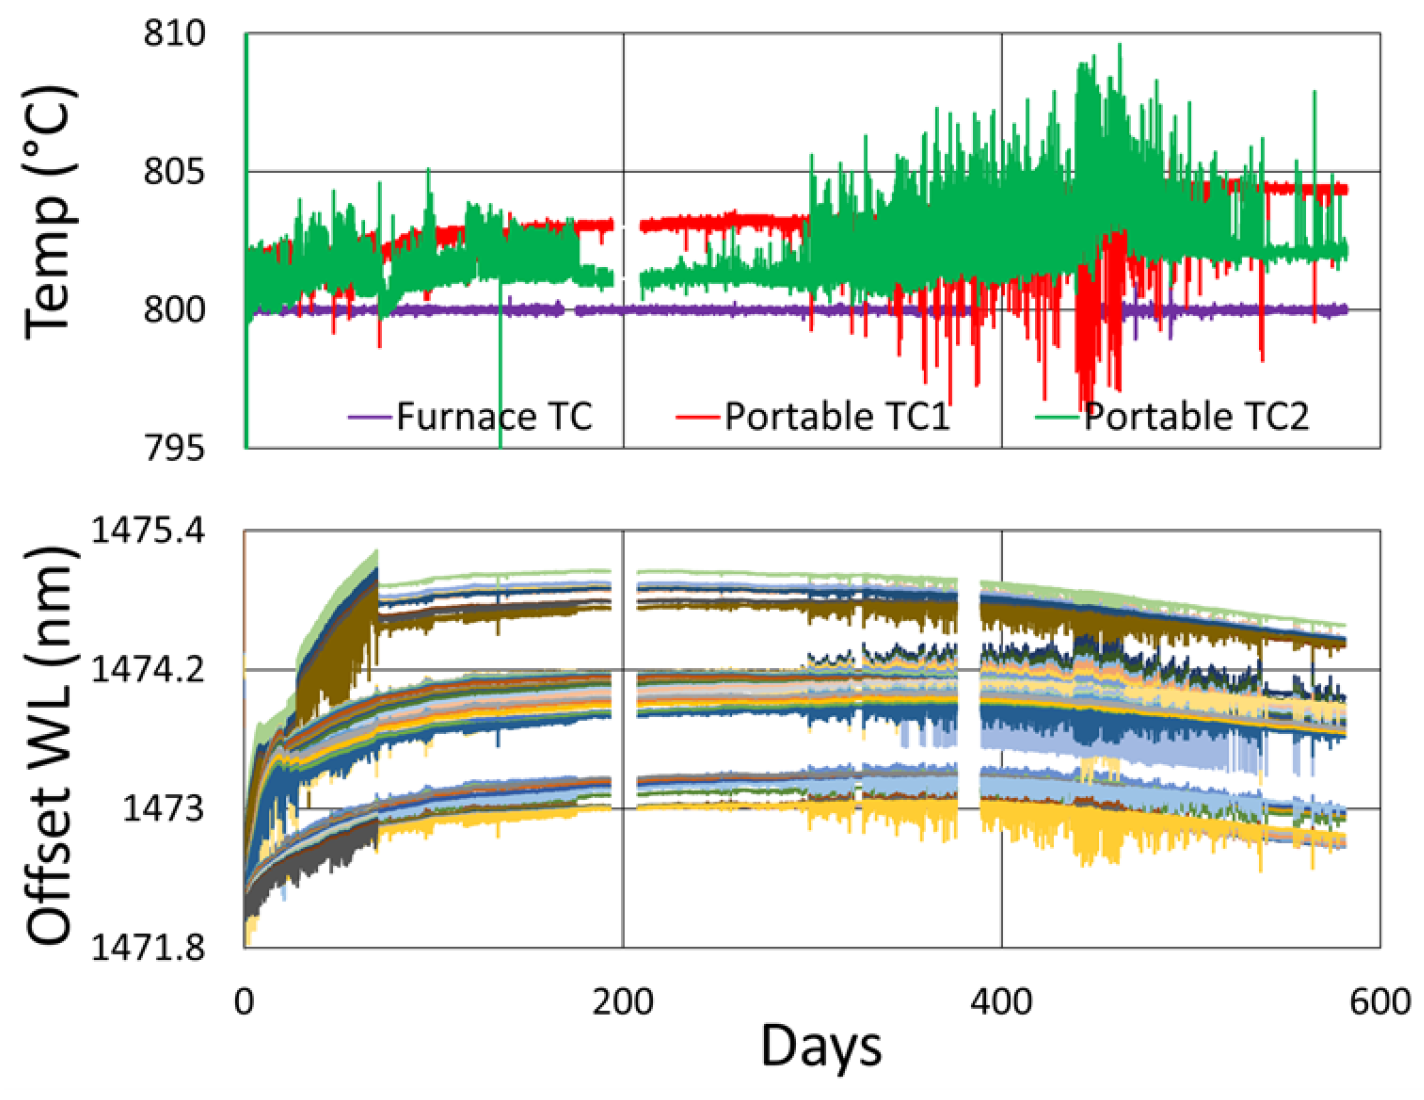
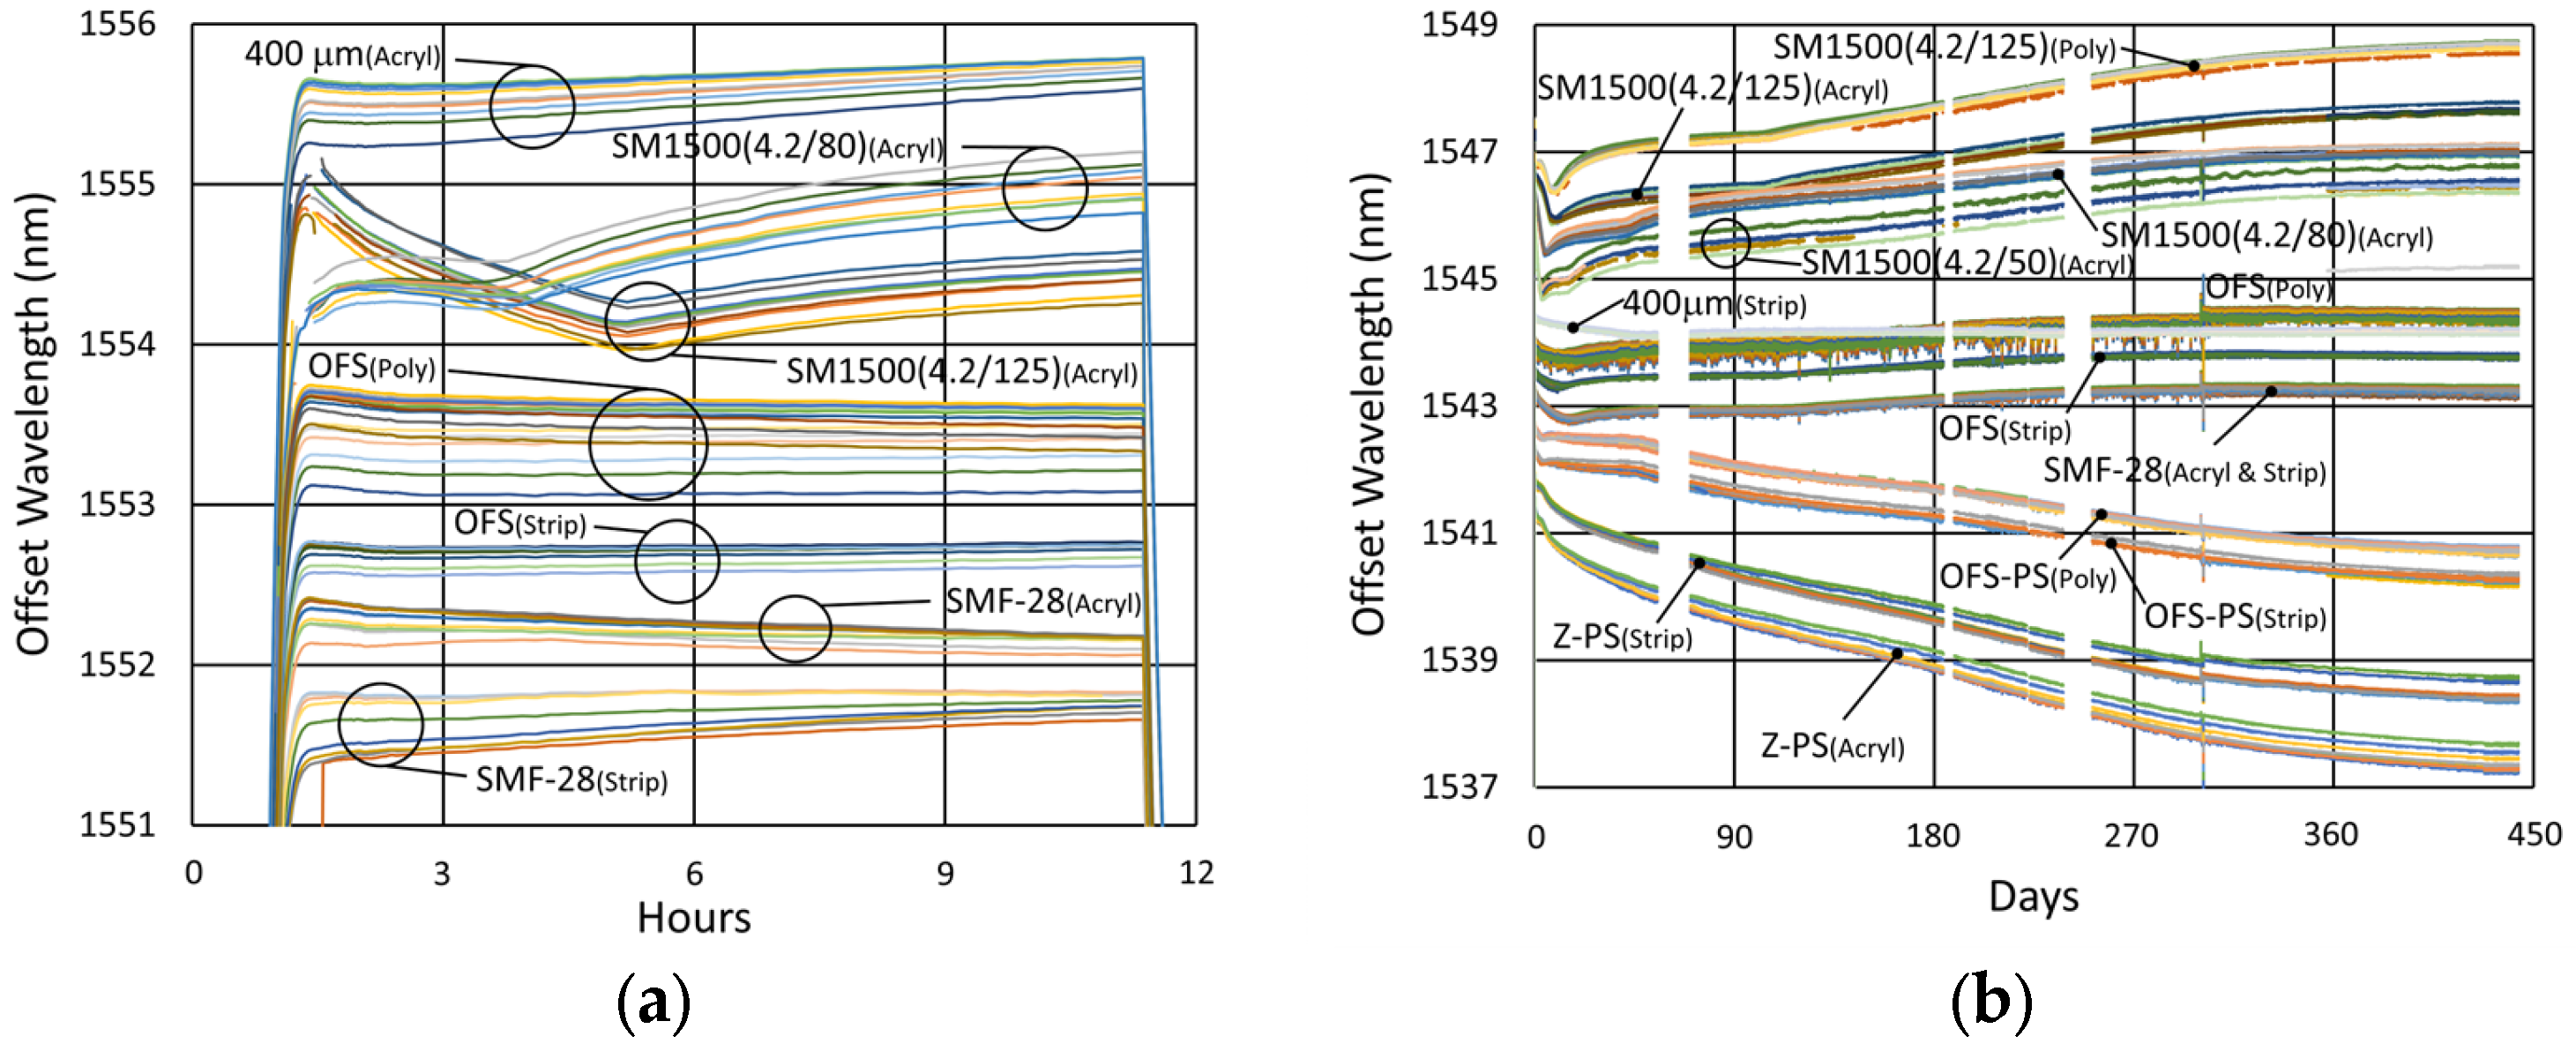
3.3. The 800 °C Test
3.3.1. Spectral Data
3.3.2. Temperature and Peak Data
3.3.3. Details and Trends
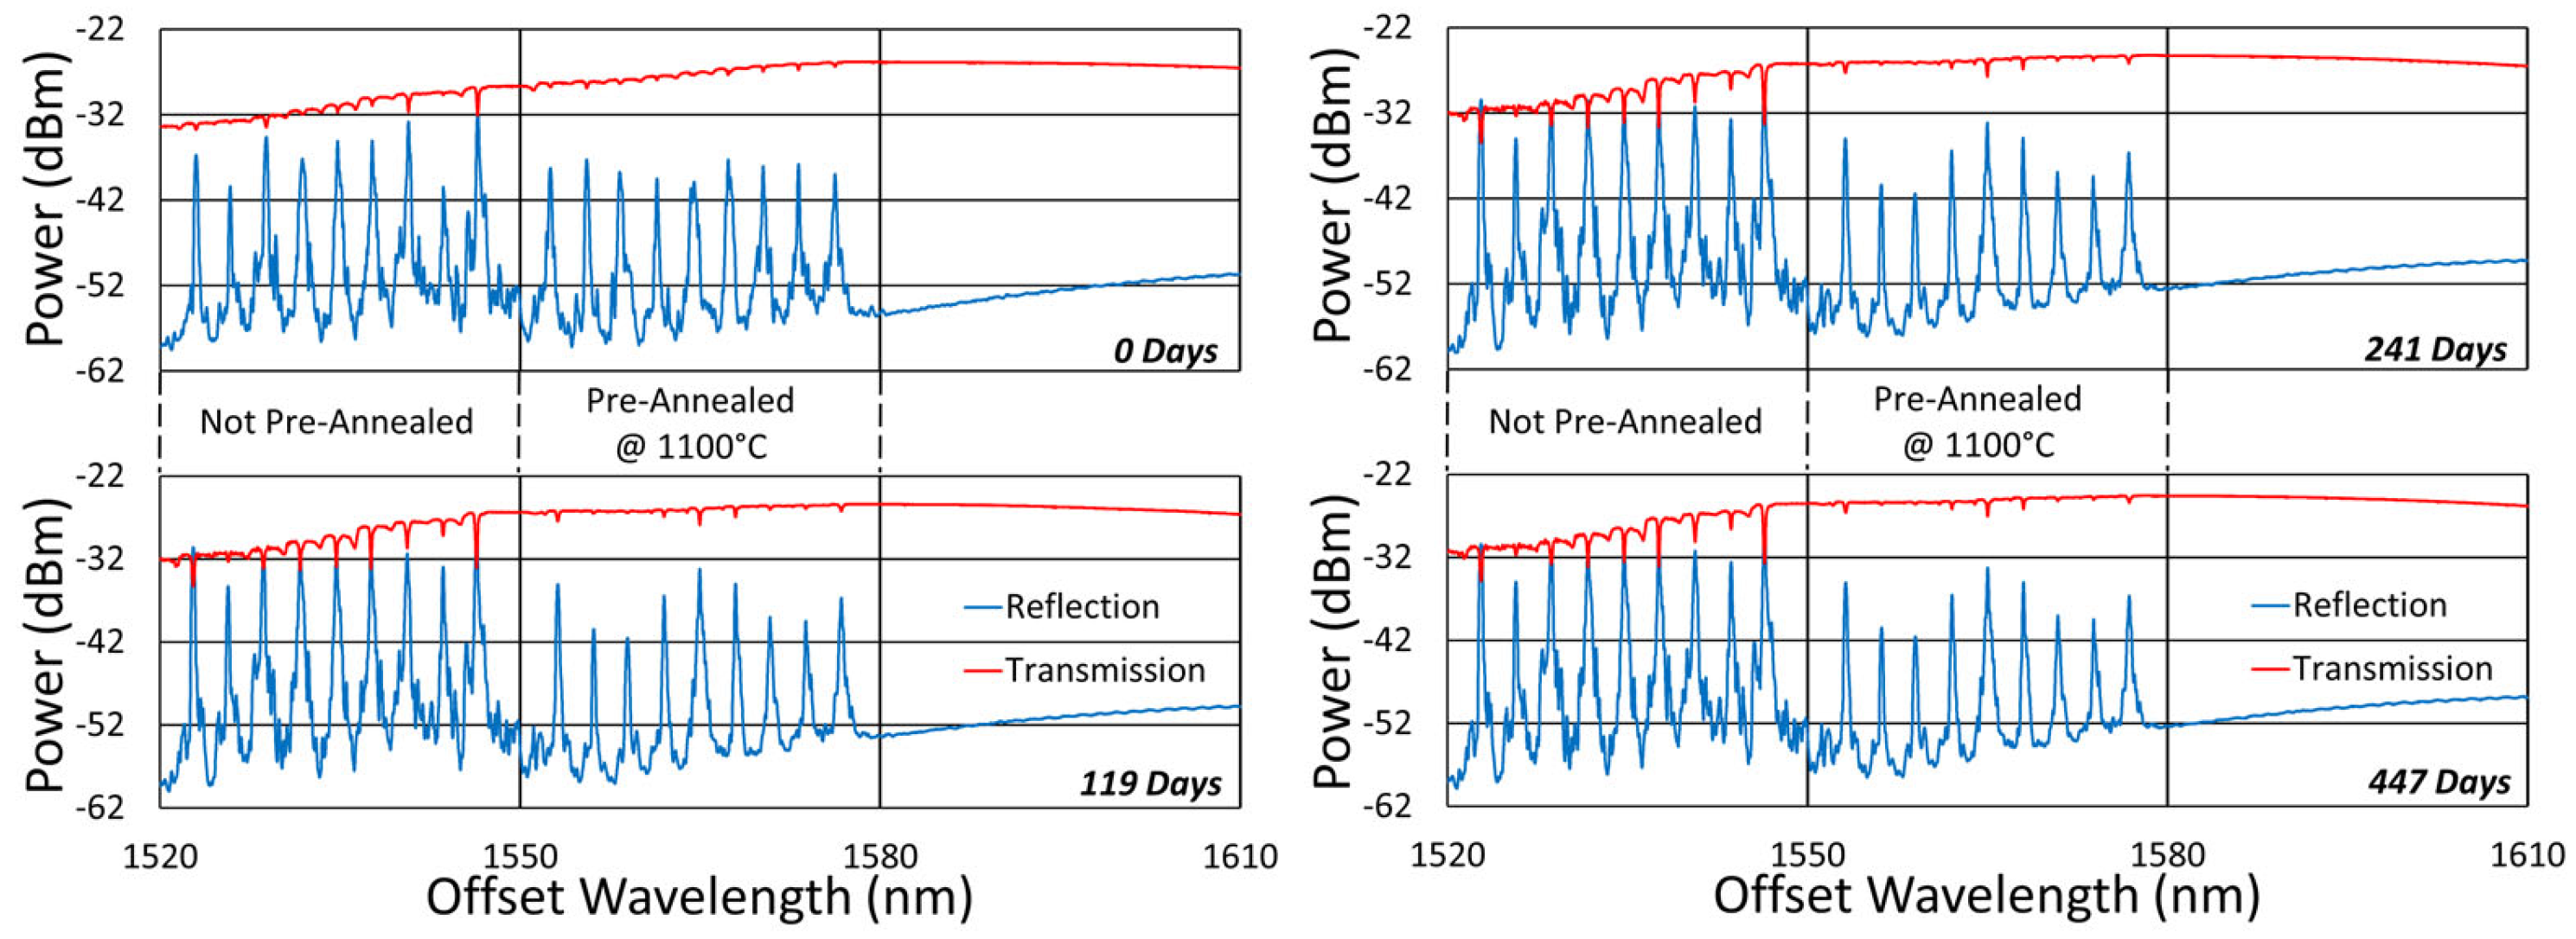
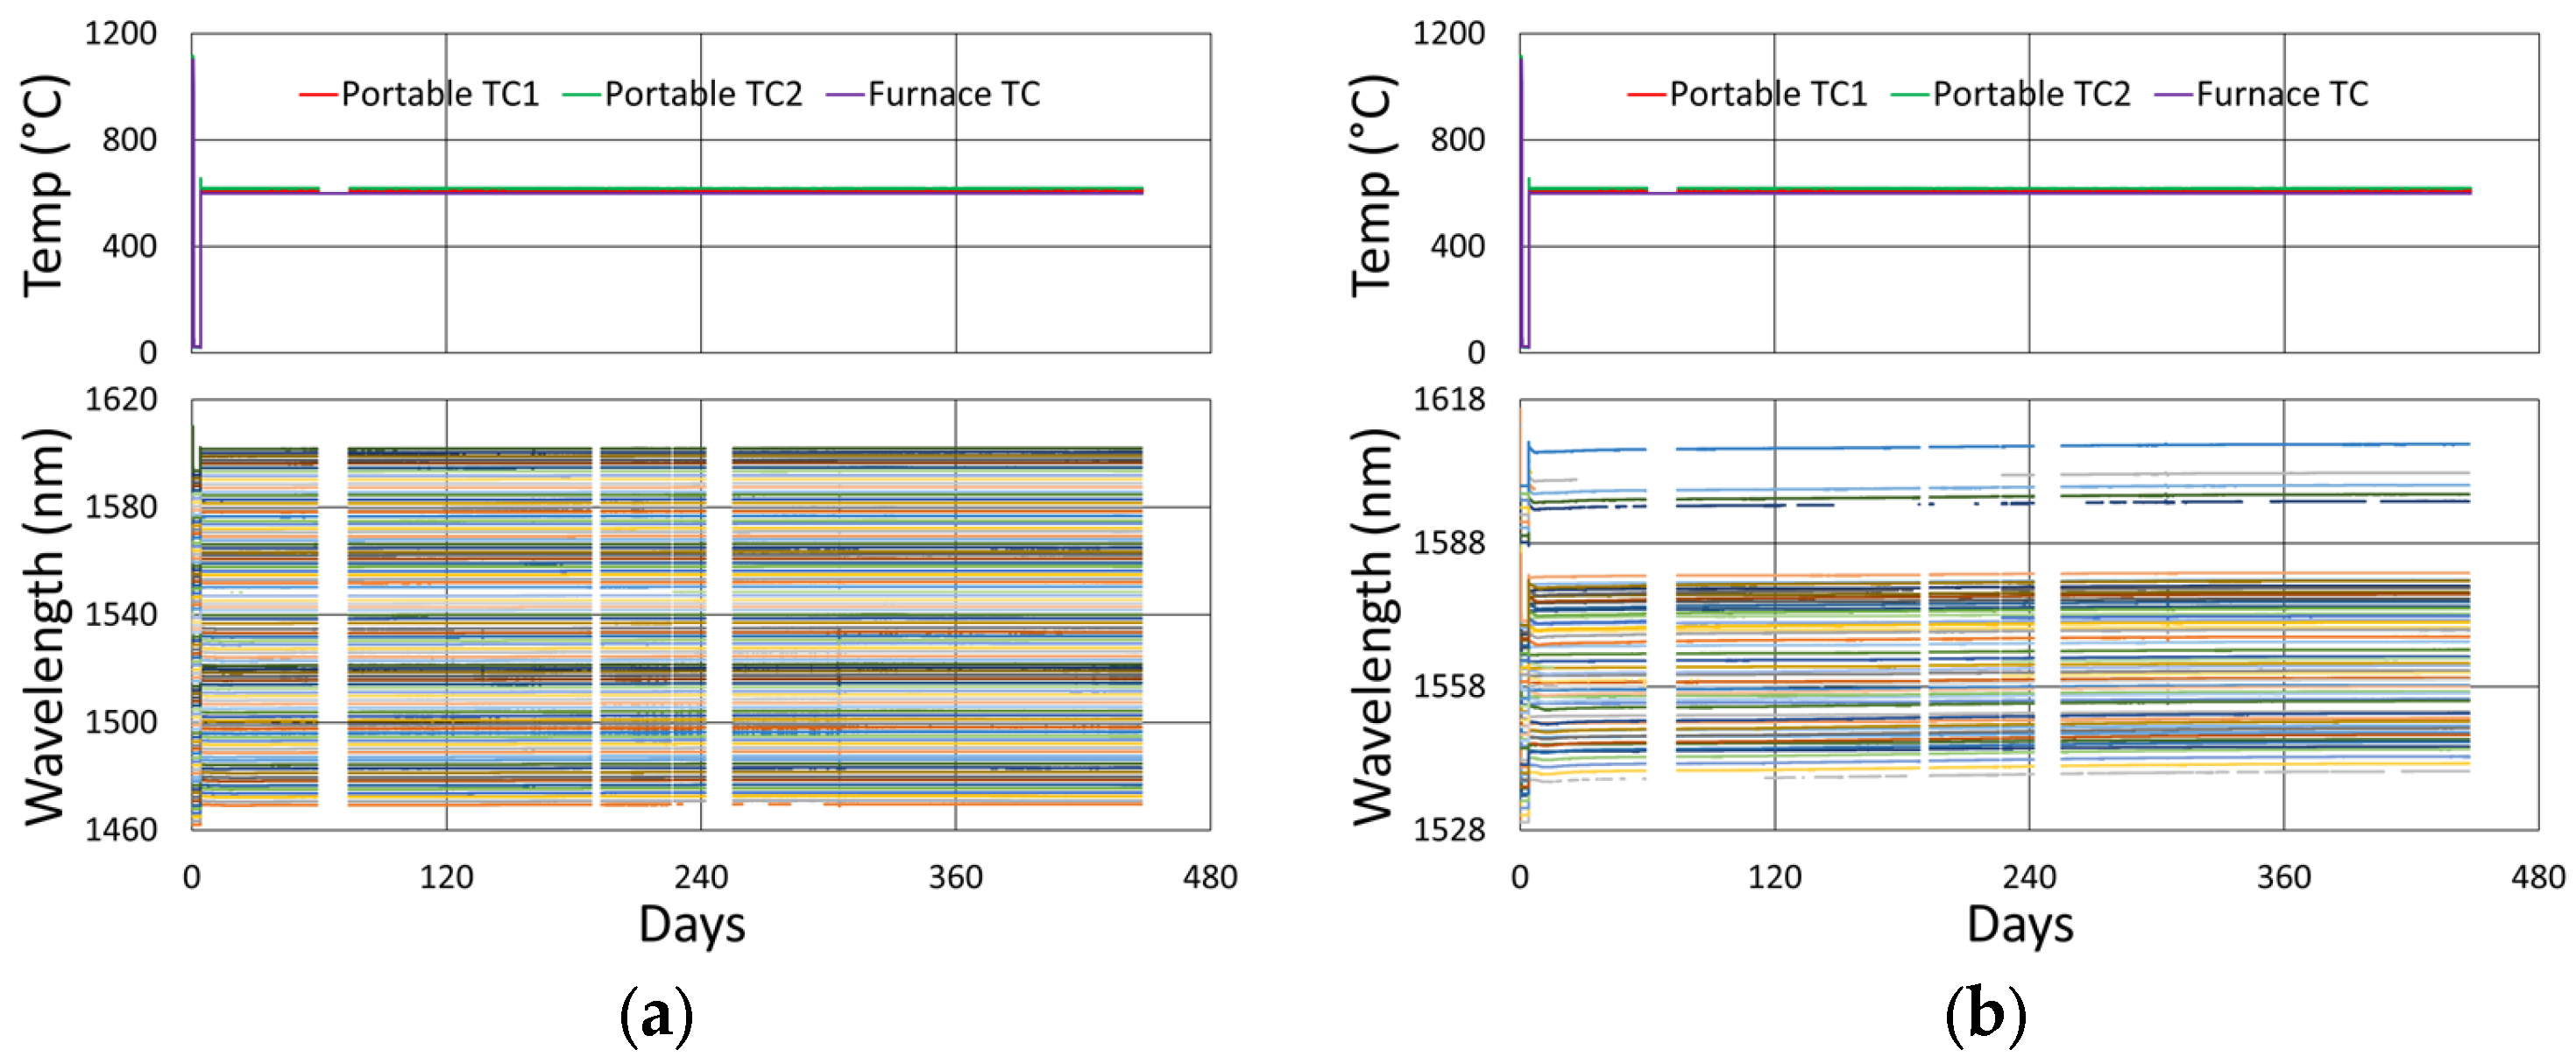
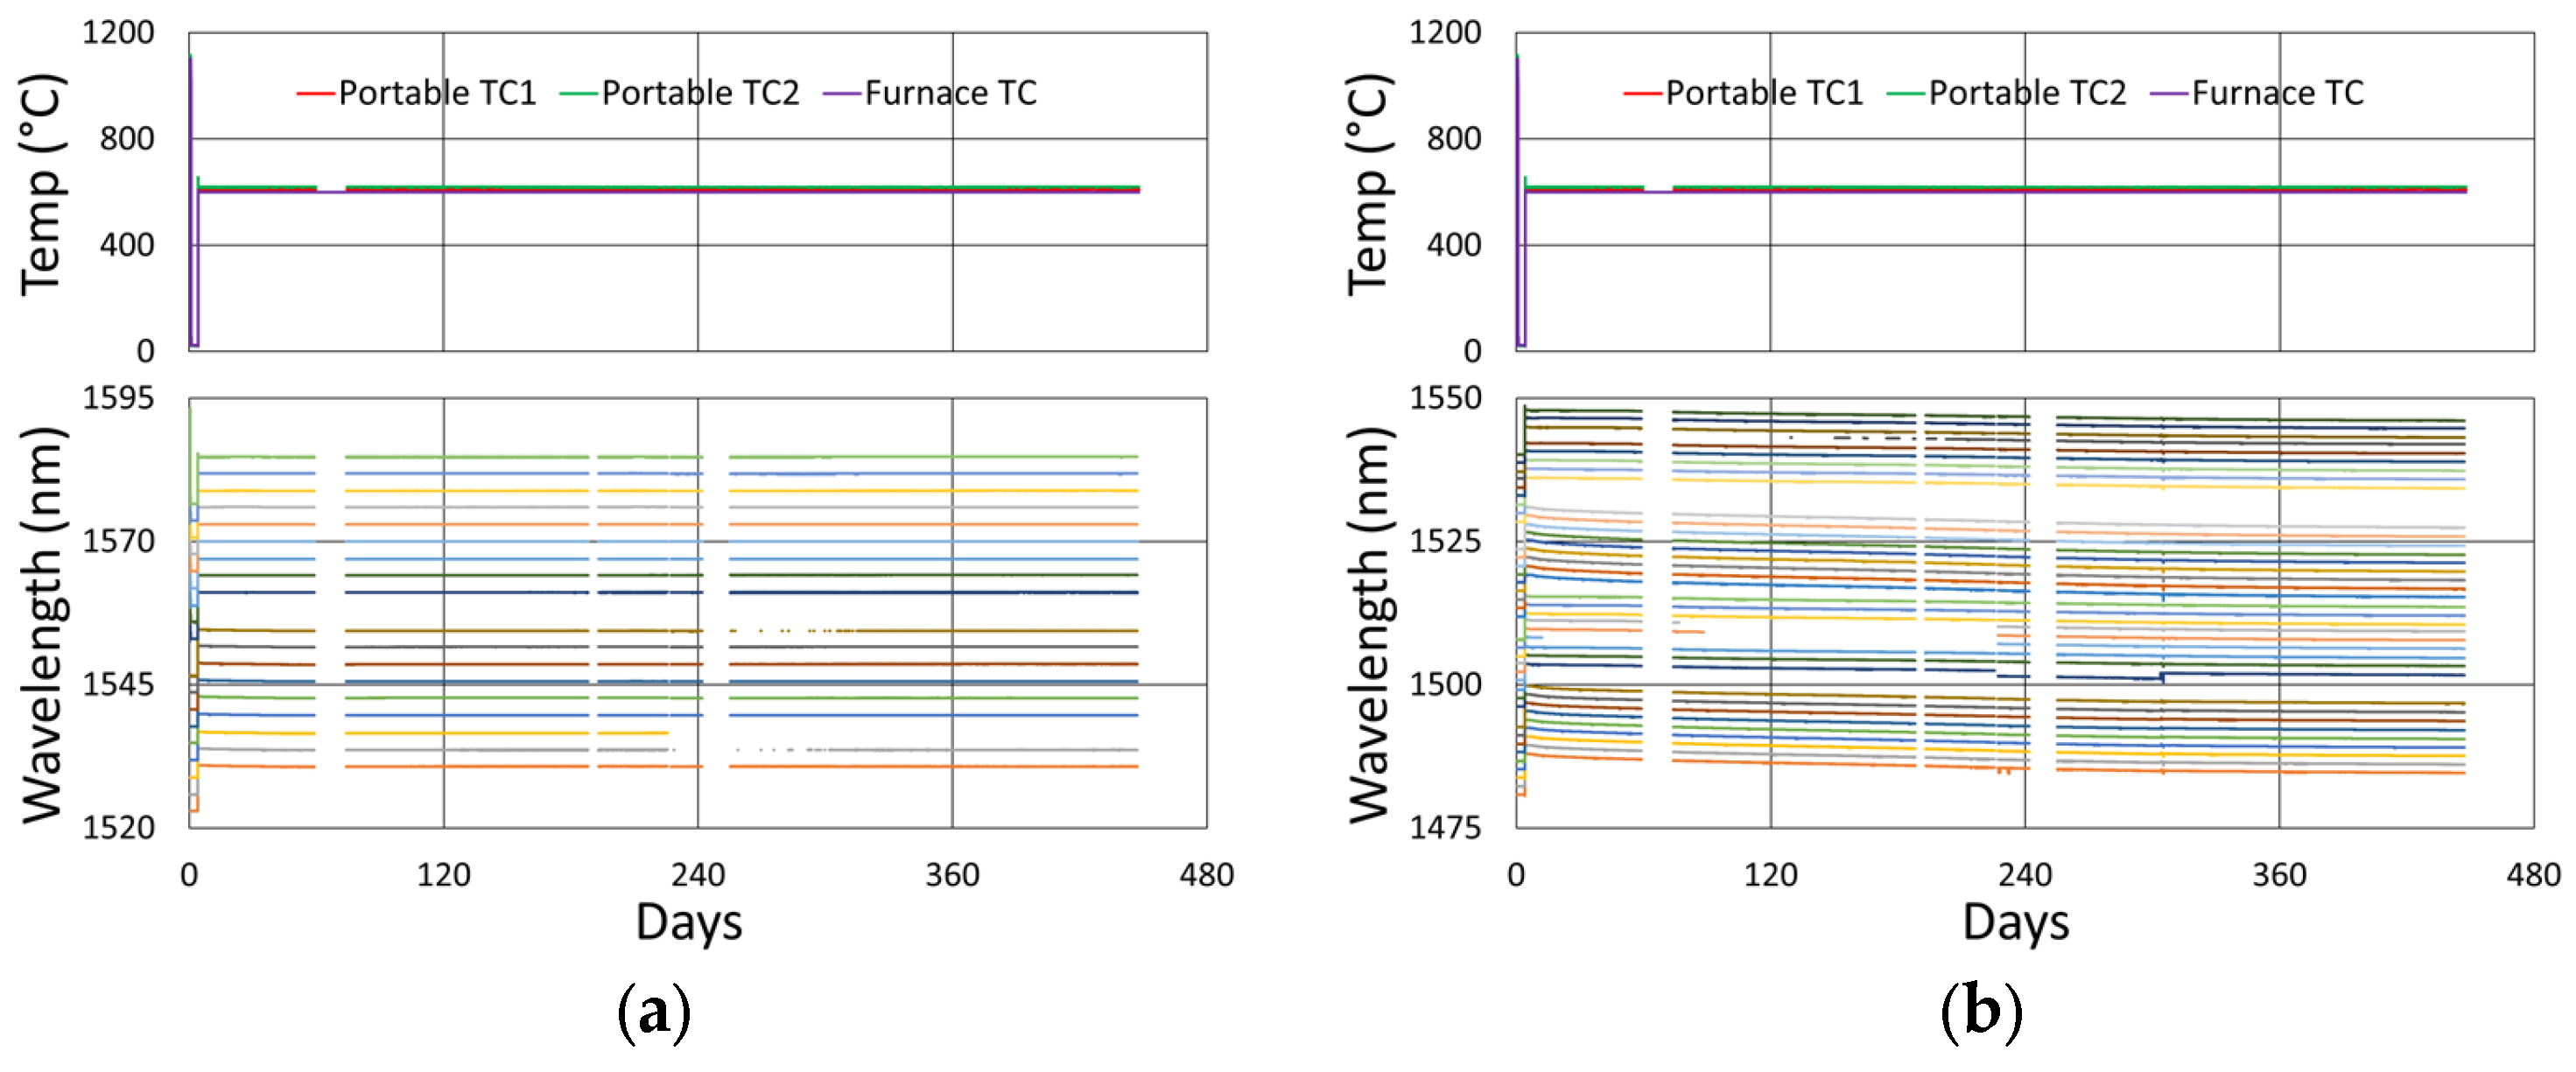
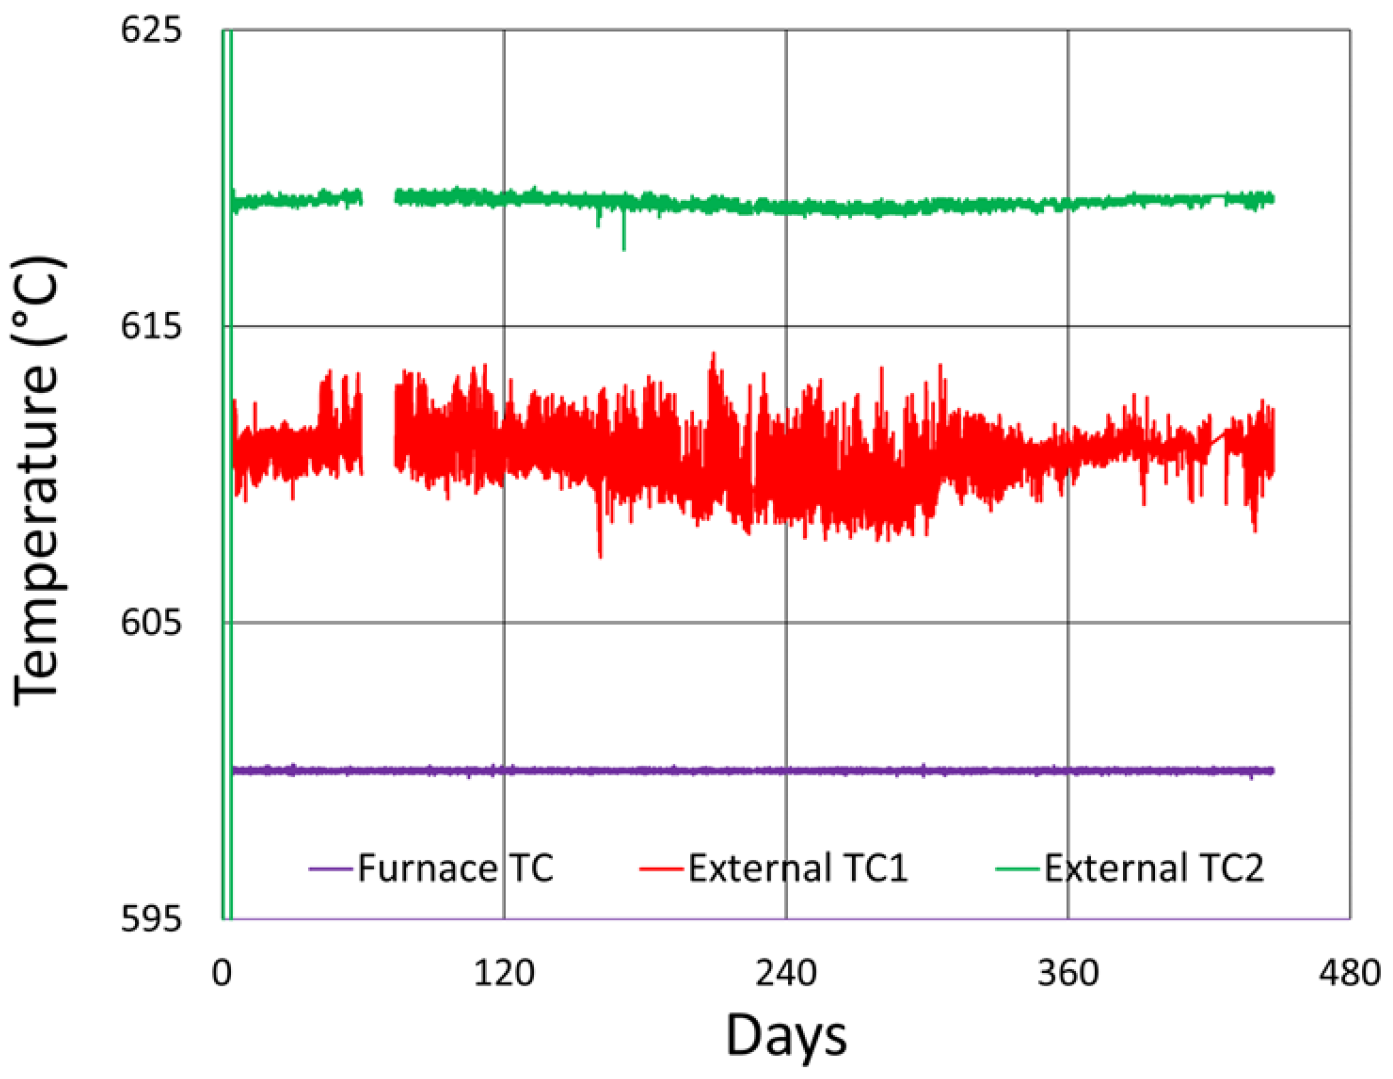
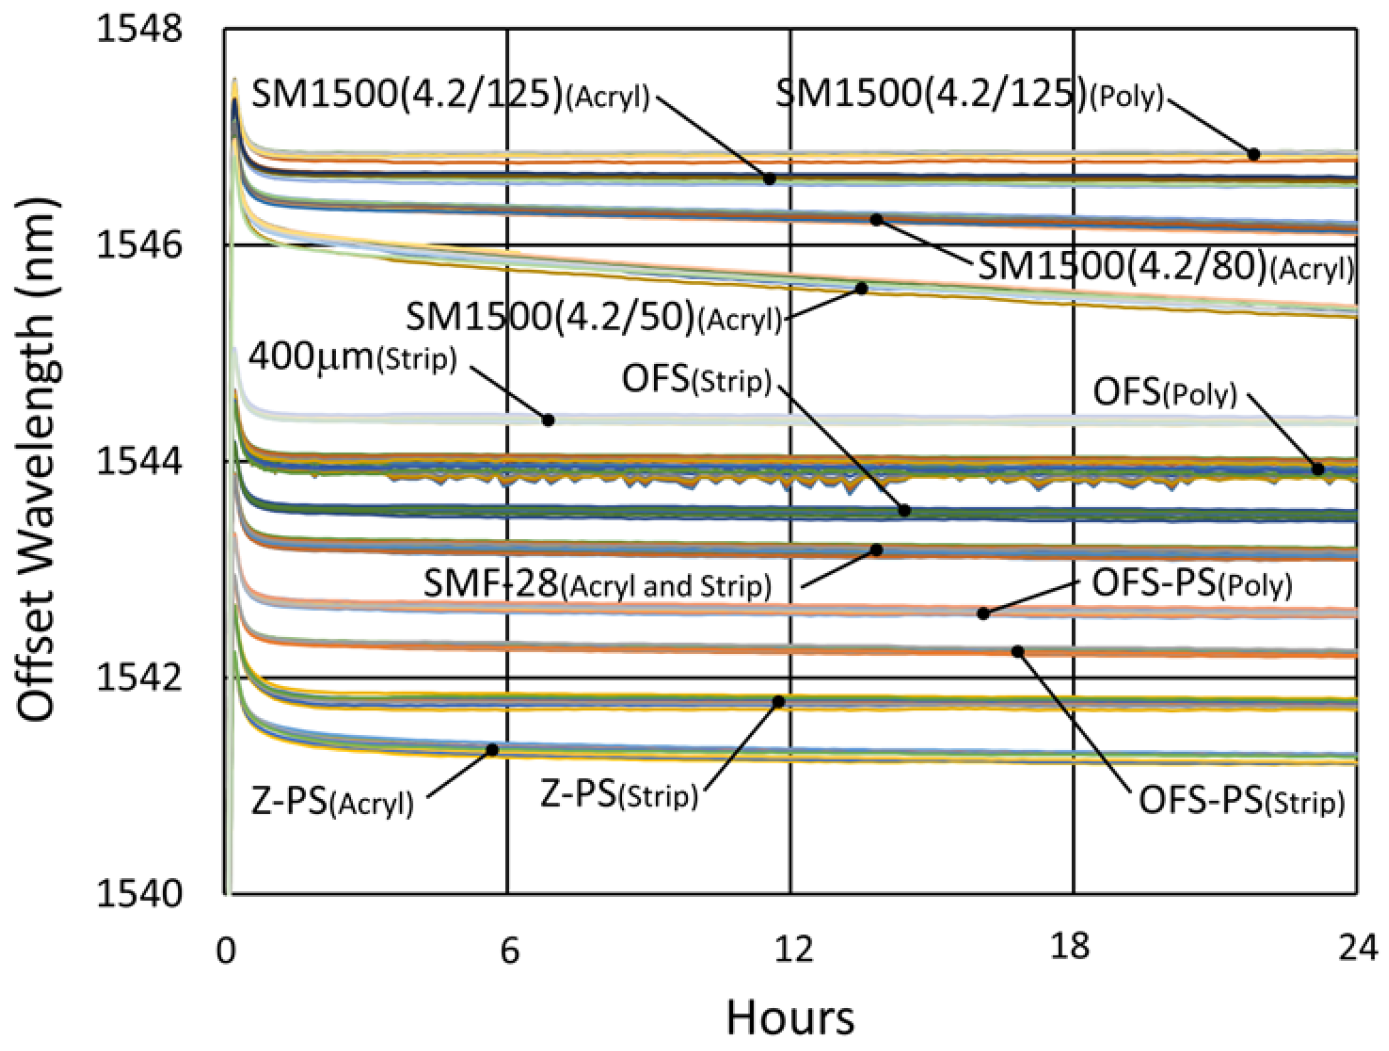
3.4. 600 °C Test
3.4.1. Spectral Data
3.4.2. Temperature and Peak Data
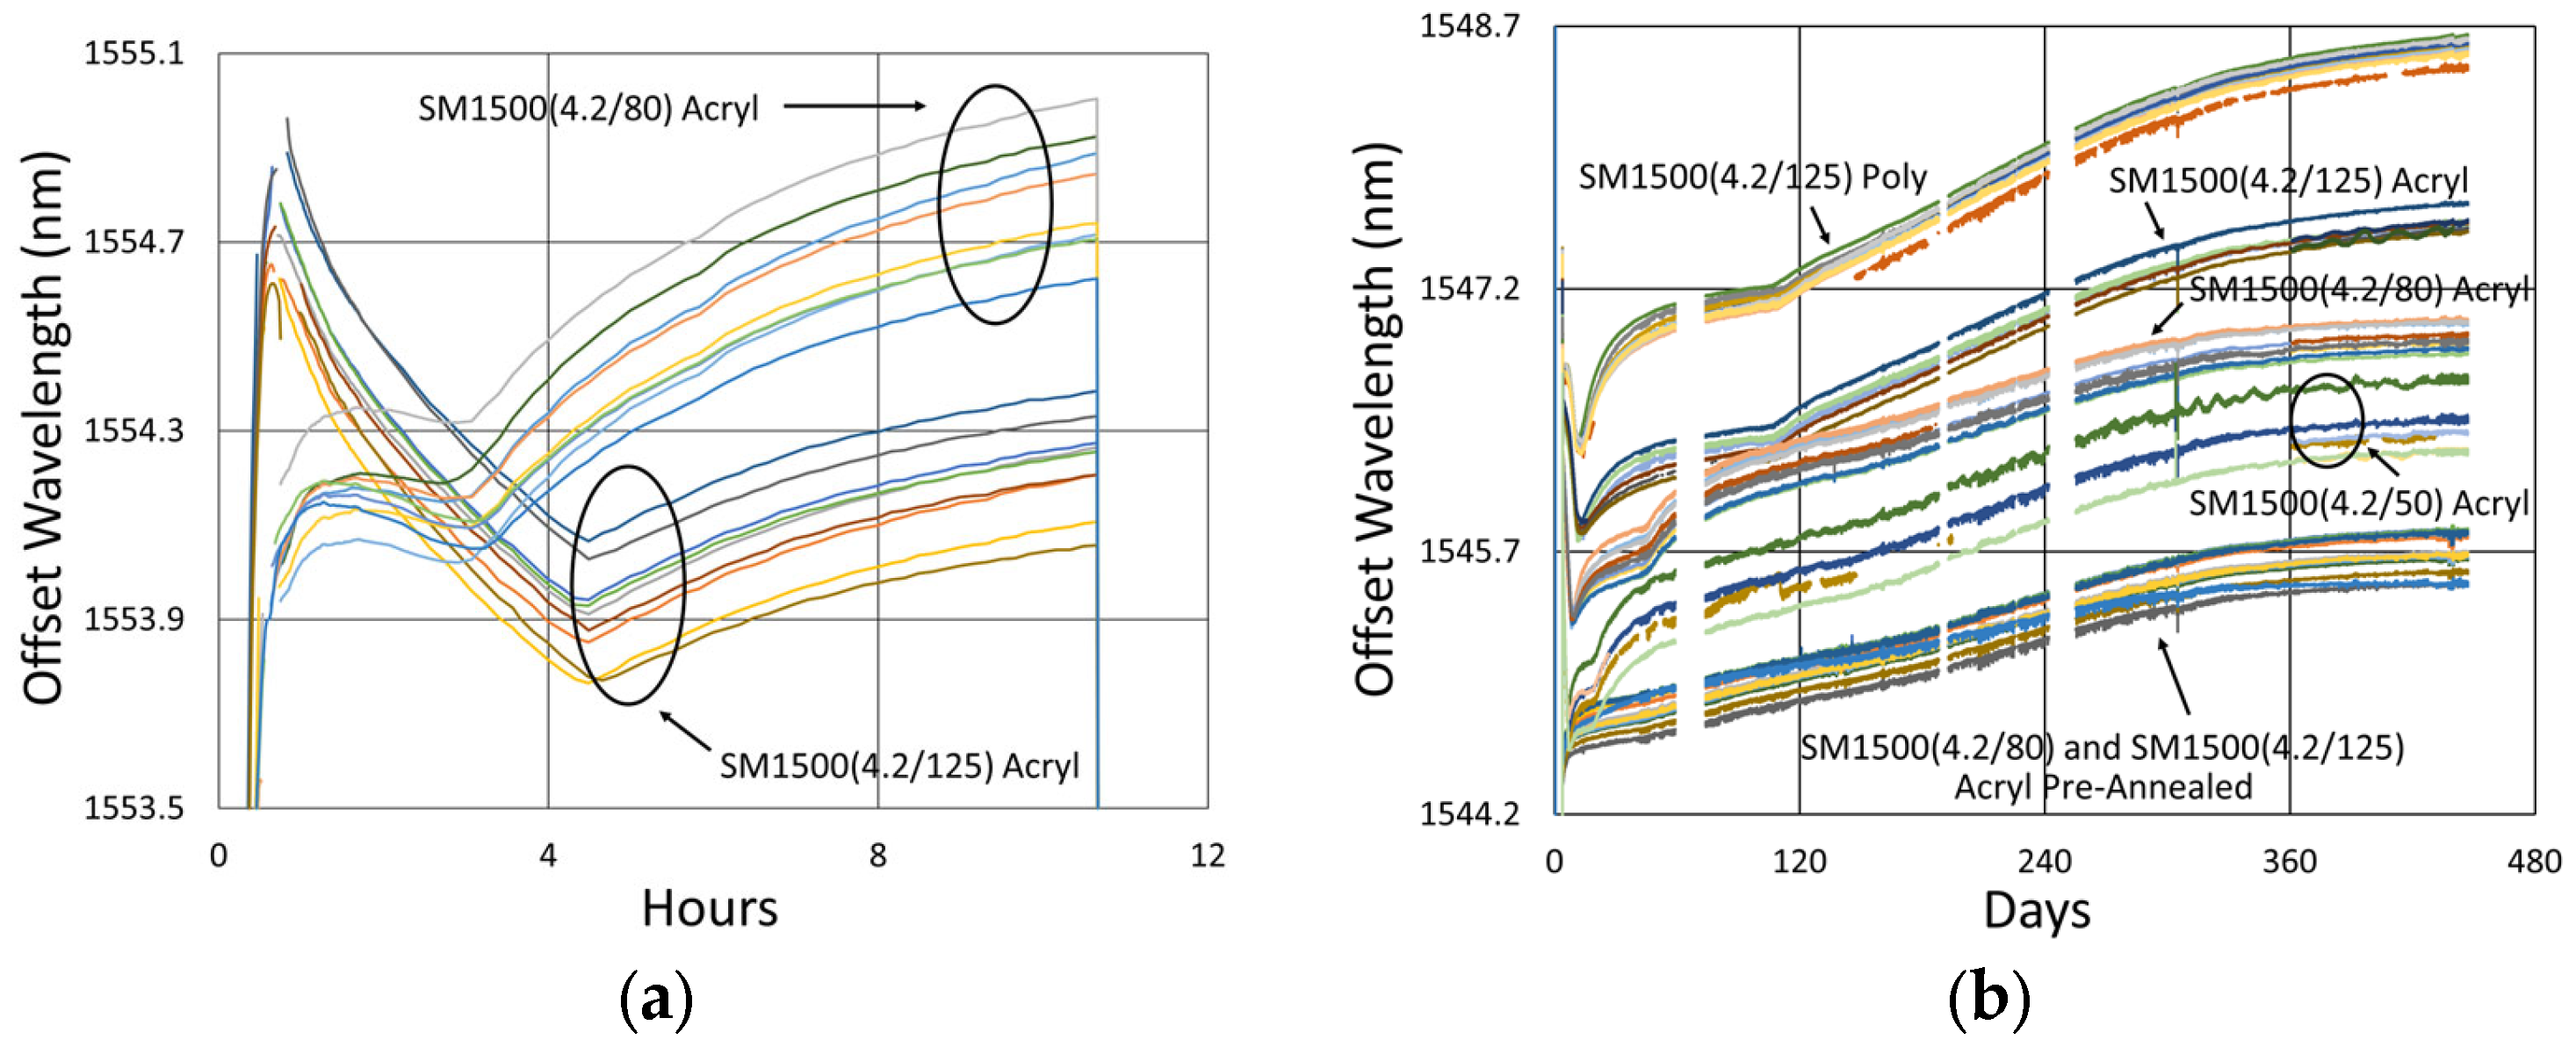
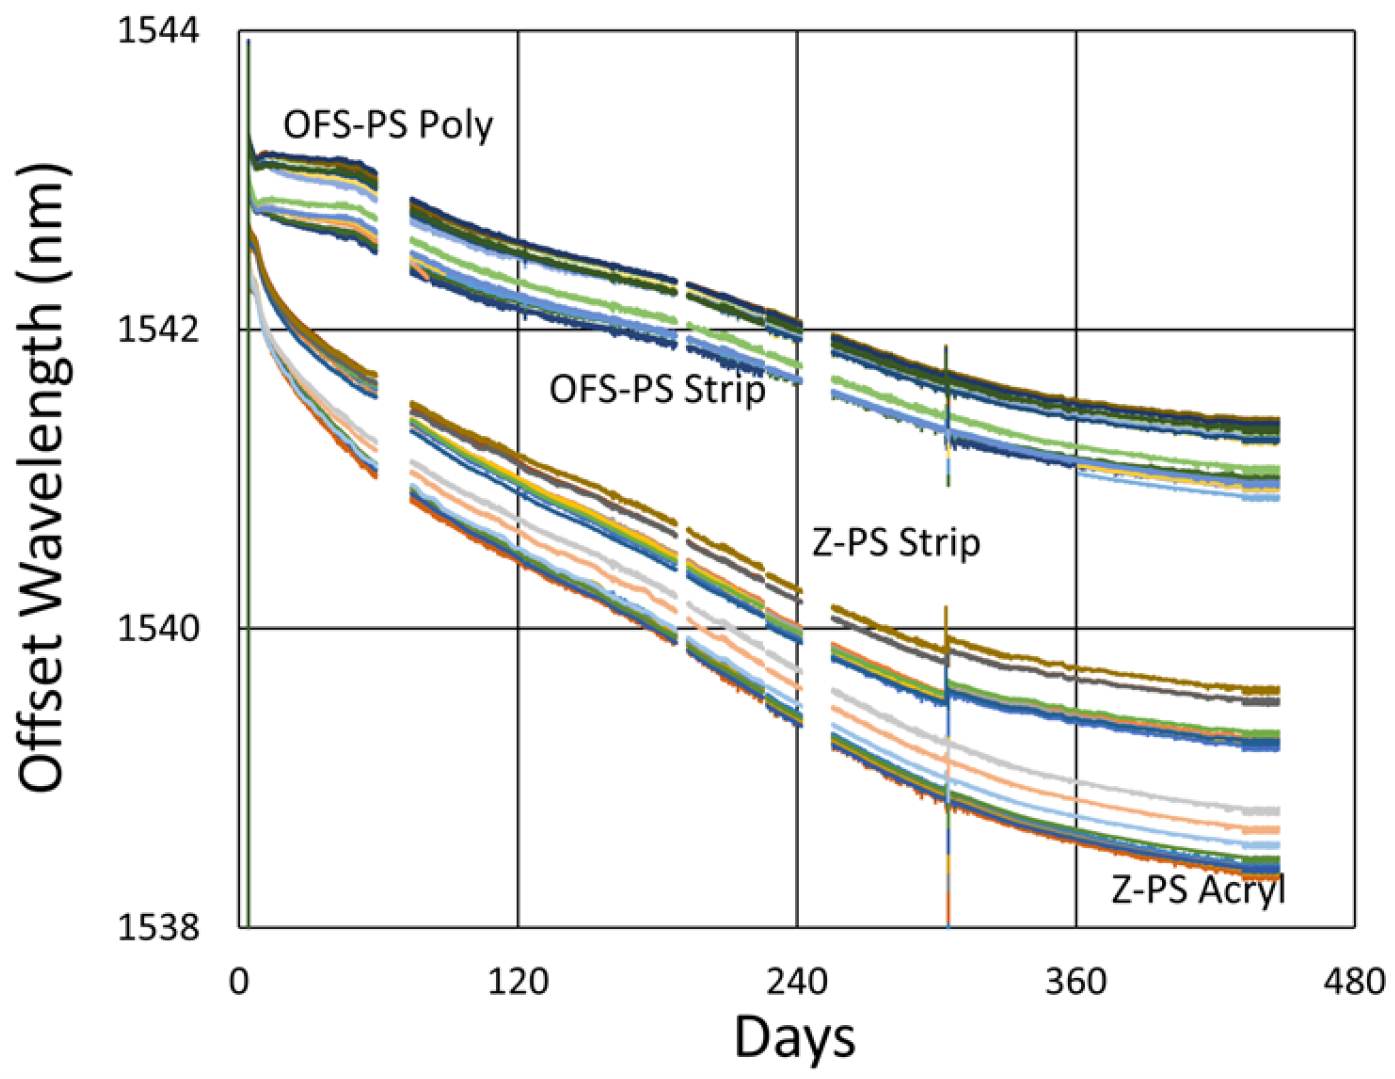
3.4.3. Details and Trends
4. Discussion
5. Conclusions
Author Contributions
Funding
Institutional Review Board Statement
Informed Consent Statement
Data Availability Statement
Conflicts of Interest
References
- Kersey, A.D.; Davis, M.A.; Patrick, H.; LeBlanc, M.; Koo, K.P.; Askins, C.G.; Putnam, M.A.; Friebele, E.J. Fiber grating sensors. J. Light. Technol. 1997, 15, 1442–1463. [Google Scholar] [CrossRef]
- Zhang, N.; Davis, C.; Chiu, W.K.; Boilard, T.; Bernier, M. Fatigue performance of type I fibre Bragg grating strain sensors. Sensors 2019, 19, 3524. [Google Scholar] [CrossRef] [PubMed]
- Leong, A.; Rountree, S.D.; Zhang, J. Corrosion of silica-based optical fibers in various environments. Corros. Mater. Degrad. 2023, 4, 445–465. [Google Scholar] [CrossRef]
- Grobnic, D.; Hnatovsky, C.; Dedyulin, S.; Walker, R.B.; Ding, H.; Mihailov, S.J. Fiber Bragg grating wavelength drift in long-term high temperature annealing. Sensors 2021, 21, 1454. [Google Scholar] [CrossRef] [PubMed]
- Mihailov, S.J.; Smelser, C.W.; Lu, P.; Walker, R.B.; Grobnic, D.; Ding, H.; Unruh, J. Fiber Bragg gratings (FBG) made with a phase mask and 800 nm femtosecond radiation. In Proceedings of the OFC 2003 Optical Fiber Communications Conference, Atlanta, GA, USA, 23–28 March 2003. paper PD30. [Google Scholar] [CrossRef]
- Mihailov, S.J.; Grobnic, D.; Smelser, C.W.; Lu, P.; Walker, R.B.; Ding, H. Bragg grating inscription in various optical fibers with femtosecond infrared lasers and a phase mask. Opt. Mater. Express 2011, 1, 754–765. [Google Scholar] [CrossRef]
- Walker, R.B.; Mihailov, S.J.; Grobnic, D.; Hnatovsky, C.; Lu, P.; Ding, H.; Coulas, D.; De Silva, M. Femtosecond laser written fiber Bragg grating sensors for combustion environments. In Advanced Photonics 2018 (BGPP, IPR, NP, NOMA, Sensors, Networks, SPPCom, SOF), OSA Technical Digest; Optica Publishing Group: Washington, DC, USA, 2018; paper BM4A.1. [Google Scholar] [CrossRef]
- Laffont, G.; Cotillard, R.; Roussel, N.; Desmarchelier, R.; Rougeault, S. Temperature resistant fiber Bragg gratings for on-line and structural health monitoring of the next-generation of nuclear reactors. Sensors 2018, 18, 1791. [Google Scholar] [CrossRef] [PubMed]
- Rodríguez-Garrido, R.; Carballar, A.; Vera, J.; González-Aguilar, J.; Altamirano, A.; Loureiro, A.; Pereira, D. High-temperature monitoring in central receiver concentrating solar power plants with femtosecond-laser inscribed FBG. Sensors 2021, 21, 3762. [Google Scholar] [CrossRef] [PubMed]
- Walker, R.B.; Hnatovsky, C.; Mihailov, S.J.; Lu, P.; De Silva, M.; Ding, H. Large arrays of low loss type II FBGs written with a phase mask through a polyimide coating. In Advanced Photonics Congress 2024, Technical Digest Series; Optica Publishing Group: Washington, DC, USA, 2024; paper JTu1A.15. [Google Scholar]
- Bao, X.; Wang, Y. Chapter 13: New technologies in distributed fiber sensors and their applications. In Fiber Optic Sensors: An Introduction for Engineers and Scientists, 3rd ed.; Udd, E., Spillman, W.B., Eds.; John Wiley & Sons, Inc.: Hoboken, NJ, USA, 2024; pp. 333–334. [Google Scholar]
- Walker, R.B.; Ding, H.; Coulas, D.; Grobnic, D.; Mihailov, S.J.; Duchesne, M.A.; Hughes, R.W.; McCalden, D.; Burchat, R. Entrained-flow gasifier and fluidized-bed combustor temperature monitoring using arrays of fs-IR written fiber Bragg gratings. In Proceedings of the SPIE 9634, 24th International Conference on Optical Fibre Sensors, Curitiba, Brazil, 28 September–2 October 2015. paper 96343X. [Google Scholar] [CrossRef]
- Walker, R.B.; Ding, H.; Coulas, D.; Grobnic, D.; Lu, P.; Mihailov, S.J.; Duschesne, M.A.; Hughes, R.W.; McCalden, D.J.; Burchat, R.; et al. Hight temperature monitoring of an oxy-fuel fluidized bed combustor using femtosecond infrared laser written fiber Bragg gratings. In Proceedings of the SPIE 9754, Photonic Instrumentation Engineering III, San Francisco, CA, USA, 14–19 February 2016. paper 975413. [Google Scholar] [CrossRef]
- Walker, R.B.; Yun, S.; Ding, H.; Charbonneau, M.; Coulas, D.; Ramachandran, N.; Mihailov, S.J. High resolution, fast temperature mapping of a gas turbine combustor simulator with femtosecond infrared laser written fiber Bragg gratings. In Proceedings of the SPIE 10110, Photonic Instrumentation Engineering IV, San Francisco, CA, USA, 31 January–2 February 2017. paper 101101H. [Google Scholar] [CrossRef]
- Walker, R.B.; Yun, S.; De Silva, M.; Charest, N.; Hnatovsky, C.; Lu, P.; Robertson, D.; Mihailov, S.J.; Vena, P. High temperature measurement of a low emission, high pressure combustor using femtosecond laser written fiber Bragg gratings. In Proceedings of the SPIE 10654, Fiber Optic Sensors and Applications XV, Orlando, FL, USA, 17–18 April 2018. paper 1065408. [Google Scholar] [CrossRef]
- Busboom, A.; Xia, H.; Lee, B.K.; Koste, G.P. Drift in high-temperature FBG sensors. In Proceedings of the Fourth SPIE 7653, European Workshop on Optical Fibre Sensors, Porto, Portugal, 8–10 September 2010. paper 76530C. [Google Scholar] [CrossRef]
- Dedyulin, S.; Timakova, E.; Grobnic, D.; Hnatovsky, C.; Todd, A.D.W.; Mihailov, S.J. Accurate measurements of a wavelength drift in high-temperature silica-fiber Bragg gratings. Metrology 2021, 1, 1–16. [Google Scholar] [CrossRef]
- Dutz, F.J.; Heinrich, A.; Bank, R.; Koch, A.W.; Roths, J. Fiber-optic multipoint sensor system with low drift for the long-term monitoring of high-temperature distributions in chemical reactors. Sensors 2019, 19, 5476. [Google Scholar] [CrossRef] [PubMed]
- Laffont, G.; Cotillard, R.; Ferdinand, P. 9000 hours-long high temperature annealing of regenerated fiber Bragg gratings. In Proceedings of the SPIE 8794, Fifth European Workshop on Optical Fibre Sensors, Krakow, Poland, 19–22 May 2013. paper 87941X. [Google Scholar] [CrossRef]
- Dutz, F.J.; Lindner, M.; Heinrich, A.; Seydel, C.G.; Bosselmann, T.; Koch, A.W.; Roths, J. Multipoint high temperature sensing with regenerated fiber Bragg gratings. In Proceedings of the of SPIE 10654, Fiber Optic Sensors and Applications XV, Orlando, FL, USA, 17–18 April 2018. paper 1065407. [Google Scholar] [CrossRef]
- Yablon, A.D. Optical and mechanical effects of frozen-in stresses and strains in optical fibers. IEEE J. Sel. Top. Quantum Electron. 2004, 10, 300–311. [Google Scholar] [CrossRef]
- Hnatovsky, C.; De Silva, K.; Abdukerim, N.; Walker, R.B.; Ding, H.; Mihailov, S.J. Nanoscale morphology and thermal properties of low insertion loss fiber Bragg gratings produced using the phase mask technique and a single femtosecond laser pulse. Opt. Express 2022, 30, 47361–47374. [Google Scholar] [CrossRef] [PubMed]
- Walker, R.B.; Hnatovsky, C.; Mihailov, S.J.; De Silva, M.; Lu, P.; Ding, H. Long-term high-temperature wavelength drift trends of type II FBGs written in standard single mode fibers. In Advanced Photonics Congress 2024, Technical Digest Series; Optica Publishing Group: Washington, DC, USA, 2024; paper BM4A.6. [Google Scholar]
- Hnatovsky, C.; Grobnic, D.; Mihailov, S.J. Nonlinear photoluminescence imaging applied to femtosecond laser manufacturing of fiber Bragg gratings. Opt. Express 2017, 25, 14247–14259. [Google Scholar] [CrossRef] [PubMed]
- Zhang, Q.; Brown, D.A.; Reinhart, L.; Morse, T.F.; Wang, J.Q.; Xiao, G. Tuning Bragg wavelength by writing gratings on prestrained fibers. IEEE Photonics Technol. Lett. 1994, 6, 839–841. [Google Scholar] [CrossRef]
- Corning Website. Available online: https://www.corning.com/media/worldwide/coc/documents/Fiber/product-information-sheets/PI-1424-AEN.pdf (accessed on 20 January 2025).
- OFS Website. Available online: https://fiber-optic-catalog.ofsoptics.com/documents/pdf/BF04446-ClearLite-POLY-1310-11-NA-Optical-Fiber-web.pdf (accessed on 20 January 2025).
- Fibercore Website. Available online: https://fibercore.humaneticsgroup.com/products/single-mode-sm-fiber/polyimide-coated-sm-fiber/sm1250104125p (accessed on 20 January 2025).
- Fibercore Website. Available online: https://fibercore.humaneticsgroup.com/perspectives/fibers-fbg-inscription (accessed on 20 January 2025).
- Sumitomo Electric Website. Available online: https://global-sei.com/fttx/optical-fibers/z-fiber/pdf/TR-23160A_Z%20Fiber_LL.pdf (accessed on 20 January 2025).
- Walker, R.B.; Hnatovsky, C.; Mihailov, S.J.; De Silva, M.; Lu, P.; Ding, H. High-temperature wavelength drift comparison of type II FBGs written in different types of single mode fiber. In Advanced Photonics Congress 2024, Technical Digest Series; Optica Publishing Group: Washington, DC, USA, 2024; paper JTu1A.14. [Google Scholar]
- Wagstaff, F.E. Crystallization kinetics of internally nucleated vitreous silica. J. Am. Ceram. Soc. 1968, 51, 449–453. [Google Scholar] [CrossRef]
- Wang, Y.; Cavillon, M.; Ollier, N.; Poumellec, B.; Lancry, M. An overview of the thermal erasure mechanisms of femtosecond laser-induced nanogratings in silica glass. Phys. Status Solidi. 2021, 218, 2100023. [Google Scholar] [CrossRef]
- Wang, Y.; Wei, S.; Cavillon, M.; Sapaly, B.; Poumellec, B.; Peng, G.-D.; Canning, J.; Lancry, M. Thermal stability of type II modifications inscribed by femtosecond laser in a fiber drawn from a 3D printed preform. Appl. Sci. 2021, 11, 600. [Google Scholar] [CrossRef]
- Wei, S.-E.; Wang, Y.; Yao, H.; Cavillon, M.; Poumellec, B.; Peng, G.-D.; Lancry, M. Thermal stability of type II modifications by IR femtosecond laser in silica-based glasses. Sensors 2020, 20, 762. [Google Scholar] [CrossRef] [PubMed]


| Temperature °C | SM1500 | SMF/OFS 1 | 400 μm 2 | OFS-PS 3 | Z-PS 4 |
|---|---|---|---|---|---|
| 1000 5 | ~ | −16 | −7 | ~ | ~ |
| 1000 | ~ | −12 [4] | ~ | ~ | ~ |
| 900 6 | ~ | −0.77 | ~ | ~ | ~ |
| 800 5 | ~ | 1.5 | ~ | ~ | ~ |
| 800 | ~ | 2.1 | ~ | ~ | ~ |
| 600 5 | 2.7 | 0.84 | 0.027 | ~ | ~ |
| 600 | 5.0 | 1.6 | −0.29 | −5.1 | −10 |
Disclaimer/Publisher’s Note: The statements, opinions and data contained in all publications are solely those of the individual author(s) and contributor(s) and not of MDPI and/or the editor(s). MDPI and/or the editor(s) disclaim responsibility for any injury to people or property resulting from any ideas, methods, instructions or products referred to in the content. |
© 2025 by the authors. Licensee MDPI, Basel, Switzerland. This article is an open access article distributed under the terms and conditions of the Creative Commons Attribution (CC BY) license (https://creativecommons.org/licenses/by/4.0/).
Share and Cite
Walker, R.B.; Mihailov, S.J.; Hnatovsky, C.; De Silva, M.; Lu, P.; Ding, H.; Rahnama, A. Long-Term Wavelength Stability of Large Type II FBG Arrays in Different Silica-Based Fibers at High Temperature. Sensors 2025, 25, 1937. https://doi.org/10.3390/s25061937
Walker RB, Mihailov SJ, Hnatovsky C, De Silva M, Lu P, Ding H, Rahnama A. Long-Term Wavelength Stability of Large Type II FBG Arrays in Different Silica-Based Fibers at High Temperature. Sensors. 2025; 25(6):1937. https://doi.org/10.3390/s25061937
Chicago/Turabian StyleWalker, Robert B., Stephen J. Mihailov, Cyril Hnatovsky, Manny De Silva, Ping Lu, Huimin Ding, and Abdullah Rahnama. 2025. "Long-Term Wavelength Stability of Large Type II FBG Arrays in Different Silica-Based Fibers at High Temperature" Sensors 25, no. 6: 1937. https://doi.org/10.3390/s25061937
APA StyleWalker, R. B., Mihailov, S. J., Hnatovsky, C., De Silva, M., Lu, P., Ding, H., & Rahnama, A. (2025). Long-Term Wavelength Stability of Large Type II FBG Arrays in Different Silica-Based Fibers at High Temperature. Sensors, 25(6), 1937. https://doi.org/10.3390/s25061937