
Monitoring of Peripheral Blood Leukocytes and Plasma Samples: A Pilot Study to Examine Treatment Response to Leflunomide in Rheumatoid Arthritis

 , ,
, ,  , ,
, ,  and
and
Abstract
:1. Introduction
2. Results
2.1. Subject Characteristics
2.2. Circulating Polymorphonuclear and Mononuclear Cells
2.3. Spectral Analysis of Plasma by ATR-FTIR
3. Discussion
4. Materials and Methods
4.1. Patients
4.2. Serum Rheumatoid Factor and C-Reactive Protein Levels
4.3. Flow Cytometry Analysis
4.4. Attenuated Total Reflection-Fourier Transform Infrared Spectroscopy (ATR-FTIR)
4.5. Spectral Data Pre-Processing
4.6. Data Analysis
5. Conclusions
Author Contributions
Funding
Institutional Review Board Statement
Informed Consent Statement
Data Availability Statement
Conflicts of Interest
References
- Smolen, J.S.; Landewe, R.B.M.; Bijlsma, J.W.J.; Burmester, G.R.; Dougados, M.; Kerschbaumer, A.; McInnes, I.B.; Sepriano, A.; van Vollenhoven, R.F.; de Wit, M.; et al. EULAR recommendations for the management of rheumatoid arthritis with synthetic and biological disease-modifying antirheumatic drugs: 2019 update. Ann. Rheum. Dis. 2020, 79, 685–699. [Google Scholar] [CrossRef] [PubMed] [Green Version]
- Fragoso, Y.D.; Brooks, J.B. Leflunomide and teriflunomide: Altering the metabolism of pyrimidines for the treatment of autoimmune diseases. Expert Rev. Clin. Pharmacol. 2015, 8, 315–320. [Google Scholar] [CrossRef] [PubMed]
- Grisar, J.; Aringer, M.; Koller, M.D.; Stummvoll, G.H.; Eselbock, D.; Zwolfer, B.; Steiner, C.W.; Zierhut, B.; Wagner, L.; Pietschmann, P.; et al. Leflunomide inhibits transendothelial migration of peripheral blood mononuclear cells. Ann. Rheum. Dis. 2004, 63, 1632–1637. [Google Scholar] [CrossRef] [PubMed]
- Morgan, C.; Lunt, M.; Brightwell, H.; Bradburn, P.; Fallow, W.; Lay, M.; Silman, A.; Bruce, I.N. Contribution of patient related differences to multidrug resistance in rheumatoid arthritis. Ann. Rheum. Dis. 2003, 62, 15–19. [Google Scholar] [CrossRef] [Green Version]
- Alfaro-Lara, R.; Espinosa-Ortega, H.F.; Arce-Salinas, C.A.; Precis Study Group. Systematic review and meta-analysis of the efficacy and safety of leflunomide and methotrexate in the treatment of rheumatoid arthritis. Reumatol. Clin. 2019, 15, 133–139. [Google Scholar] [CrossRef]
- Dai, Q.; Xu, L.; Yu, X. Efficacy and safety of leflunomide in psoriatic arthritis treatment: A single-arm meta-analysis. Int. J. Rheum. Dis 2019, 22, 1498–1505. [Google Scholar] [CrossRef]
- Poor, G.; Strand, V.; Leflunomide Multinational Study Group. Efficacy and safety of leflunomide 10 mg versus 20 mg once daily in patients with active rheumatoid arthritis: Multinational double-blind, randomized trial. Rheumatology (Oxford) 2004, 43, 744–749. [Google Scholar] [CrossRef] [Green Version]
- England, B.R.; Tiong, B.K.; Bergman, M.J.; Curtis, J.R.; Kazi, S.; Mikuls, T.R.; O’Dell, J.R.; Ranganath, V.K.; Limanni, A.; Suter, L.G.; et al. 2019 Update of the American College of Rheumatology Recommended Rheumatoid Arthritis Disease Activity Measures. Arthritis Care Res. (Hoboken) 2019, 71, 1540–1555. [Google Scholar] [CrossRef]
- Loffler, M.; Klein, A.; Hayek-Ouassini, M.; Knecht, W.; Konrad, L. Dihydroorotate dehydrogenase mRNA and protein expression analysis in normal and drug-resistant cells. Nucleosides Nucleotides Nucleic Acids 2004, 23, 1281–1285. [Google Scholar] [CrossRef]
- Manda, G.; Neagu, M.; Constantin, C.; Neagoe, I.; Codreanu, C. Preliminary study on the immunologic background of good clinical outcome in rheumatoid arthritis patients after one month therapy with leflunomide. Rheumatol. Int. 2009, 29, 937–946. [Google Scholar] [CrossRef]
- O’Doherty, C.; Schnabl, M.; Spargo, L.; Cleland, L.G.; James, M.; Proudman, S.M.; Wiese, M.D. Association of DHODH haplotype variants and response to leflunomide treatment in rheumatoid arthritis. Pharmacogenomics 2012, 13, 1427–1434. [Google Scholar] [CrossRef] [PubMed]
- Van der Heijden, J.W.; Oerlemans, R.; Tak, P.P.; Assaraf, Y.G.; Kraan, M.C.; Scheffer, G.L.; van der Laken, C.J.; Lems, W.F.; Scheper, R.J.; Dijkmans, B.A.; et al. Involvement of breast cancer resistance protein expression on rheumatoid arthritis synovial tissue macrophages in resistance to methotrexate and leflunomide. Arthritis Rheum. 2009, 60, 669–677. [Google Scholar] [CrossRef] [PubMed]
- Butler, H.J.; Brennan, P.M.; Cameron, J.M.; Finlayson, D.; Hegarty, M.G.; Jenkinson, M.D.; Palmer, D.S.; Smith, B.R.; Baker, M.J. Development of high-throughput ATR-FTIR technology for rapid triage of brain cancer. Nat. Commun. 2019, 10, 4501. [Google Scholar] [CrossRef] [PubMed] [Green Version]
- Caixeta, D.C.; Aguiar, E.M.G.; Cardoso-Sousa, L.; Coelho, L.M.D.; Oliveira, S.W.; Espindola, F.S.; Raniero, L.; Crosara, K.T.B.; Baker, M.J.; Siqueira, W.L.; et al. Salivary molecular spectroscopy: A sustainable, rapid and non-invasive monitoring tool for diabetes mellitus during insulin treatment. PLoS ONE 2020, 15, e0223461. [Google Scholar]
- Gajjar, K.; Trevisan, J.; Owens, G.; Keating, P.J.; Wood, N.J.; Stringfellow, H.F.; Martin-Hirsch, P.L.; Martin, F.L. Fourier-transform infrared spectroscopy coupled with a classification machine for the analysis of blood plasma or serum: A novel diagnostic approach for ovarian cancer. Analyst 2013, 138, 3917–3926. [Google Scholar] [PubMed]
- Lechowicz, L.; Chrapek, M.; Gaweda, J.; Urbaniak, M.; Konieczna, I. Use of Fourier-transform infrared spectroscopy in the diagnosis of rheumatoid arthritis: A pilot study. Mol. Biol. Rep. 2016, 43, 1321–1326. [Google Scholar] [CrossRef] [Green Version]
- Oinas, J.; Rieppo, L.; Finnila, M.A.; Valkealahti, M.; Lehenkari, P.; Saarakkala, S. Imaging of Osteoarthritic Human Articular Cartilage using Fourier Transform Infrared Microspectroscopy Combined with Multivariate and Univariate Analysis. Sci. Rep. 2016, 6, 30008. [Google Scholar] [CrossRef]
- Parachalil, D.R.; Bruno, C.; Bonnier, F.; Blasco, H.; Chourpa, I.; Baker, M.J.; McIntyre, J.; Byrne, H.J. Analysis of bodily fluids using vibrational spectroscopy: A direct comparison of Raman scattering and infrared absorption techniques for the case of glucose in blood serum. Analyst 2019, 144, 3334–3346. [Google Scholar]
- Paraskevaidi, M.; Morais, C.L.M.; Lima, K.M.G.; Snowden, J.S.; Saxon, J.A.; Richardson, A.M.T.; Jones, M.; Mann, D.M.A.; Allsop, D.; Martin-Hirsch, P.L.; et al. Differential diagnosis of Alzheimer’s disease using spectrochemical analysis of blood. Proc. Natl. Acad. Sci. USA 2017, 114, E7929–E7938. [Google Scholar] [CrossRef] [Green Version]
- McWilliams, D.F.; Kiely, P.D.W.; Young, A.; Joharatnam, N.; Wilson, D.; Walsh, D.A. Interpretation of DAS28 and its components in the assessment of inflammatory and non-inflammatory aspects of rheumatoid arthritis. BMC Rheumatol. 2018, 2, 8. [Google Scholar] [CrossRef] [Green Version]
- Smolen, J.S.; Aletaha, D. Scores for all seasons: SDAI and CDAI. Clin. Exp. Rheumatol. 2014, 32 (Suppl. S85), S75–S79. [Google Scholar]
- Petibois, C.; Cazorla, G.; Gin, H.; Deleris, G. Differentiation of populations with different physiologic profiles by plasma Fourier-transform infrared spectra classification. J. Lab. Clin. Med. 2001, 137, 184–190. [Google Scholar] [CrossRef] [PubMed]
- Svatos, A.; Attygalle, A.B. Characterization of vinyl-substituted, carbon-carbon double bonds by GC/FT-IR analysis. Anal. Chem. 1997, 69, 1827–1836. [Google Scholar] [CrossRef] [PubMed]
- Ivetic, A.; Hoskins Green, H.L.; Hart, S.J. L-selectin: A Major Regulator of Leukocyte Adhesion, Migration and Signaling. Front. Immunol. 2019, 10, 1068. [Google Scholar] [CrossRef] [Green Version]
- Kuhns, D.B.; Long Priel, D.A.; Gallin, J.I. Loss of L-selectin (CD62L) on human neutrophils following exudation in vivo. Cell Immunol. 1995, 164, 306–310. [Google Scholar] [CrossRef]
- Aletaha, D.; Alasti, F.; Smolen, J.S. Optimisation of a treat-to-target approach in rheumatoid arthritis: Strategies for the 3-month time point. Ann. Rheum. Dis. 2016, 75, 1479–1485. [Google Scholar] [CrossRef]
- Van der Heijde, D.; Keystone, E.C.; Curtis, J.R.; Landewe, R.B.; Schiff, M.H.; Khanna, D.; Kvien, T.K.; Ionescu, L.; Gervitz, L.M.; Davies, O.R.; et al. Timing and magnitude of initial change in disease activity score 28 predicts the likelihood of achieving low disease activity at 1 year in rheumatoid arthritis patients treated with certolizumab pegol: A post-hoc analysis of the RAPID 1 trial. J. Rheumatol. 2012, 39, 1326–1333. [Google Scholar] [CrossRef]
- Kraan, M.C.; de Koster, B.M.; Elferink, J.G.; Post, W.J.; Breedveld, F.C.; Tak, P.P. Inhibition of neutrophil migration soon after initiation of treatment with leflunomide or methotrexate in patients with rheumatoid arthritis: Findings in a prospective, randomized, double-blind clinical trial in fifteen patients. Arthritis Rheum. 2000, 43, 1488–1495. [Google Scholar] [CrossRef]
- Finlayson, D.; Rinaldi, C.; Baker, M.J. Is Infrared Spectroscopy Ready for the Clinic? Anal. Chem. 2019, 91, 12117–12128. [Google Scholar]
- Erukhimovitch, V.; Talyshinsky, M.; Souprun, Y.; Huleihel, M. Use of Fourier transform infrared microscopy for the evaluation of drug efficiency. J. Biomed. Opt. 2006, 11, 064009. [Google Scholar] [CrossRef] [Green Version]
- Bi, X.; Li, G.; Doty, S.B.; Camacho, N.P. A novel method for determination of collagen orientation in cartilage by Fourier transform infrared imaging spectroscopy (FT-IRIS). Osteoarthr. Cartil. 2005, 13, 1050–1058. [Google Scholar] [CrossRef] [PubMed] [Green Version]
- Koletsi, D.; Eliades, T.; Zinelis, S.; Makou, M.; Bourauel, C.; Eliades, G. The effect of rheumatoid arthritis and functional loading on the structure of the mandibular condyle in a transgenic mouse model: An FTIR study. Arch. Oral Biol. 2016, 61, 44–52. [Google Scholar]
- Ormseth, M.J.; Stein, C.M. High-density lipoprotein function in rheumatoid arthritis. Curr. Opin. Lipidol. 2016, 27, 67–75. [Google Scholar] [CrossRef] [Green Version]
- Shah, S.A.R.; Baba, M.S.; Khaliq, A.; Jeelani, I.; Shah, S.J.; Nadeem, S.G. Lipid profile in rheumatoid arthritis and its relation with inflammatory markers. Insights Biomed. 2017, 2, 1–6. [Google Scholar]
- Aletaha, D.; Neogi, T.; Silman, A.J.; Funovits, J.; Felson, D.T.; Bingham, C.O., 3rd; Birnbaum, N.S.; Burmester, G.R.; Bykerk, V.P.; Cohen, M.D.; et al. 2010 Rheumatoid arthritis classification criteria: An American College of Rheumatology/European League Against Rheumatism collaborative initiative. Arthritis Rheum. 2010, 62, 2569–2581. [Google Scholar] [CrossRef] [PubMed]
- Bruce, B.; Fries, J.F. The Stanford Health Assessment Questionnaire: Dimensions and practical applications. Health Qual. Life Outcomes 2003, 1, 20. [Google Scholar] [CrossRef] [Green Version]
- Pereira, I.; Mendes, S.J.; Pereira, D.M.; Muniz, T.F.; Colares, V.L.; Monteiro, C.R.; Martins, M.M.; Grisotto, M.A.; Monteiro-Neto, V.; Monteiro, S.G.; et al. Transient Receptor Potential Ankyrin 1 Channel Expression on Peripheral Blood Leukocytes from Rheumatoid Arthritic Patients and Correlation with Pain and Disability. Front. Pharmacol. 2017, 8, 53. [Google Scholar] [PubMed] [Green Version]
- Ferreira, I.C.C.; Aguiar, E.M.G.; Silva, A.T.F.; Santos, L.L.D.; Cardoso-Sousa, L.; Araujo, T.G.; Santos, D.W.; Goulart, L.R.; Sabino-Silva, R.; Maia, Y.C.P. Attenuated Total Reflection-Fourier Transform Infrared (ATR-FTIR) Spectroscopy Analysis of Saliva for Breast Cancer Diagnosis. J. Oncol. 2020, 2020, 4343590. [Google Scholar] [CrossRef] [PubMed] [Green Version]
- Ghimire, H.; Venkataramani, M.; Bian, Z.; Liu, Y.; Perera, A.G.U. ATR-FTIR spectral discrimination between normal and tumorous mouse models of lymphoma and melanoma from serum samples. Sci. Rep. 2017, 7, 16993. [Google Scholar] [CrossRef] [Green Version]
- Rodrigues, R.P.; Aguiar, E.M.; Cardoso-Sousa, L.; Caixeta, D.C.; Guedes, C.C.; Siqueira, W.L.; Maia, Y.C.P.; Cardoso, S.V.; Sabino-Silva, R. Differential Molecular Signature of Human Saliva Using ATR-FTIR Spectroscopy for Chronic Kidney Disease Diagnosis. Braz. Dent. J. 2019, 30, 437–445. [Google Scholar] [CrossRef] [Green Version]


| Variable | Arthritis Patients | ||
|---|---|---|---|
| NST | LFN-R | LFN-NR | |
| Age (Mean (SD)) | 57.5 (2.8) | 57.0 (4.7) | 51.8 (3.7) |
| Gender (number (no) of patients (%)) | No (%) | No (%) | No (%) |
| Male | 1 (7%) | 01 (7%) | 0 (0%) |
| Female | 13 (93%) | 07 (50.0%) | 06 (43%) |
| Duration of disease (in years) | No (%) | No (%) | No (%) |
| <10 | 12 (86%) | 08 (57%) | 05 (36%) |
| 10–19 | 01 (7%) | 0 (0%) | 01 (7%) |
| 20–30 | 01 (7%) | 0 (0%) | 0 (0%) |
| Presence of swollen joints (nº of patients (%)) | No (%) | No (%) | No (%) |
| Yes | 12 (86%) | 02 (14%) | 06 (43%) |
| No | 02 (14%) | 06 (43%) | 0 (0%) |
| Presence of lumps or deformities (nº of patients (%)) | No (%) | No (%) | No (%) |
| Yes | 03 (21%) | 01 (7%) | 01 (7%) |
| No | 11 (79%) | 07 (50%) | 05 (36%) |
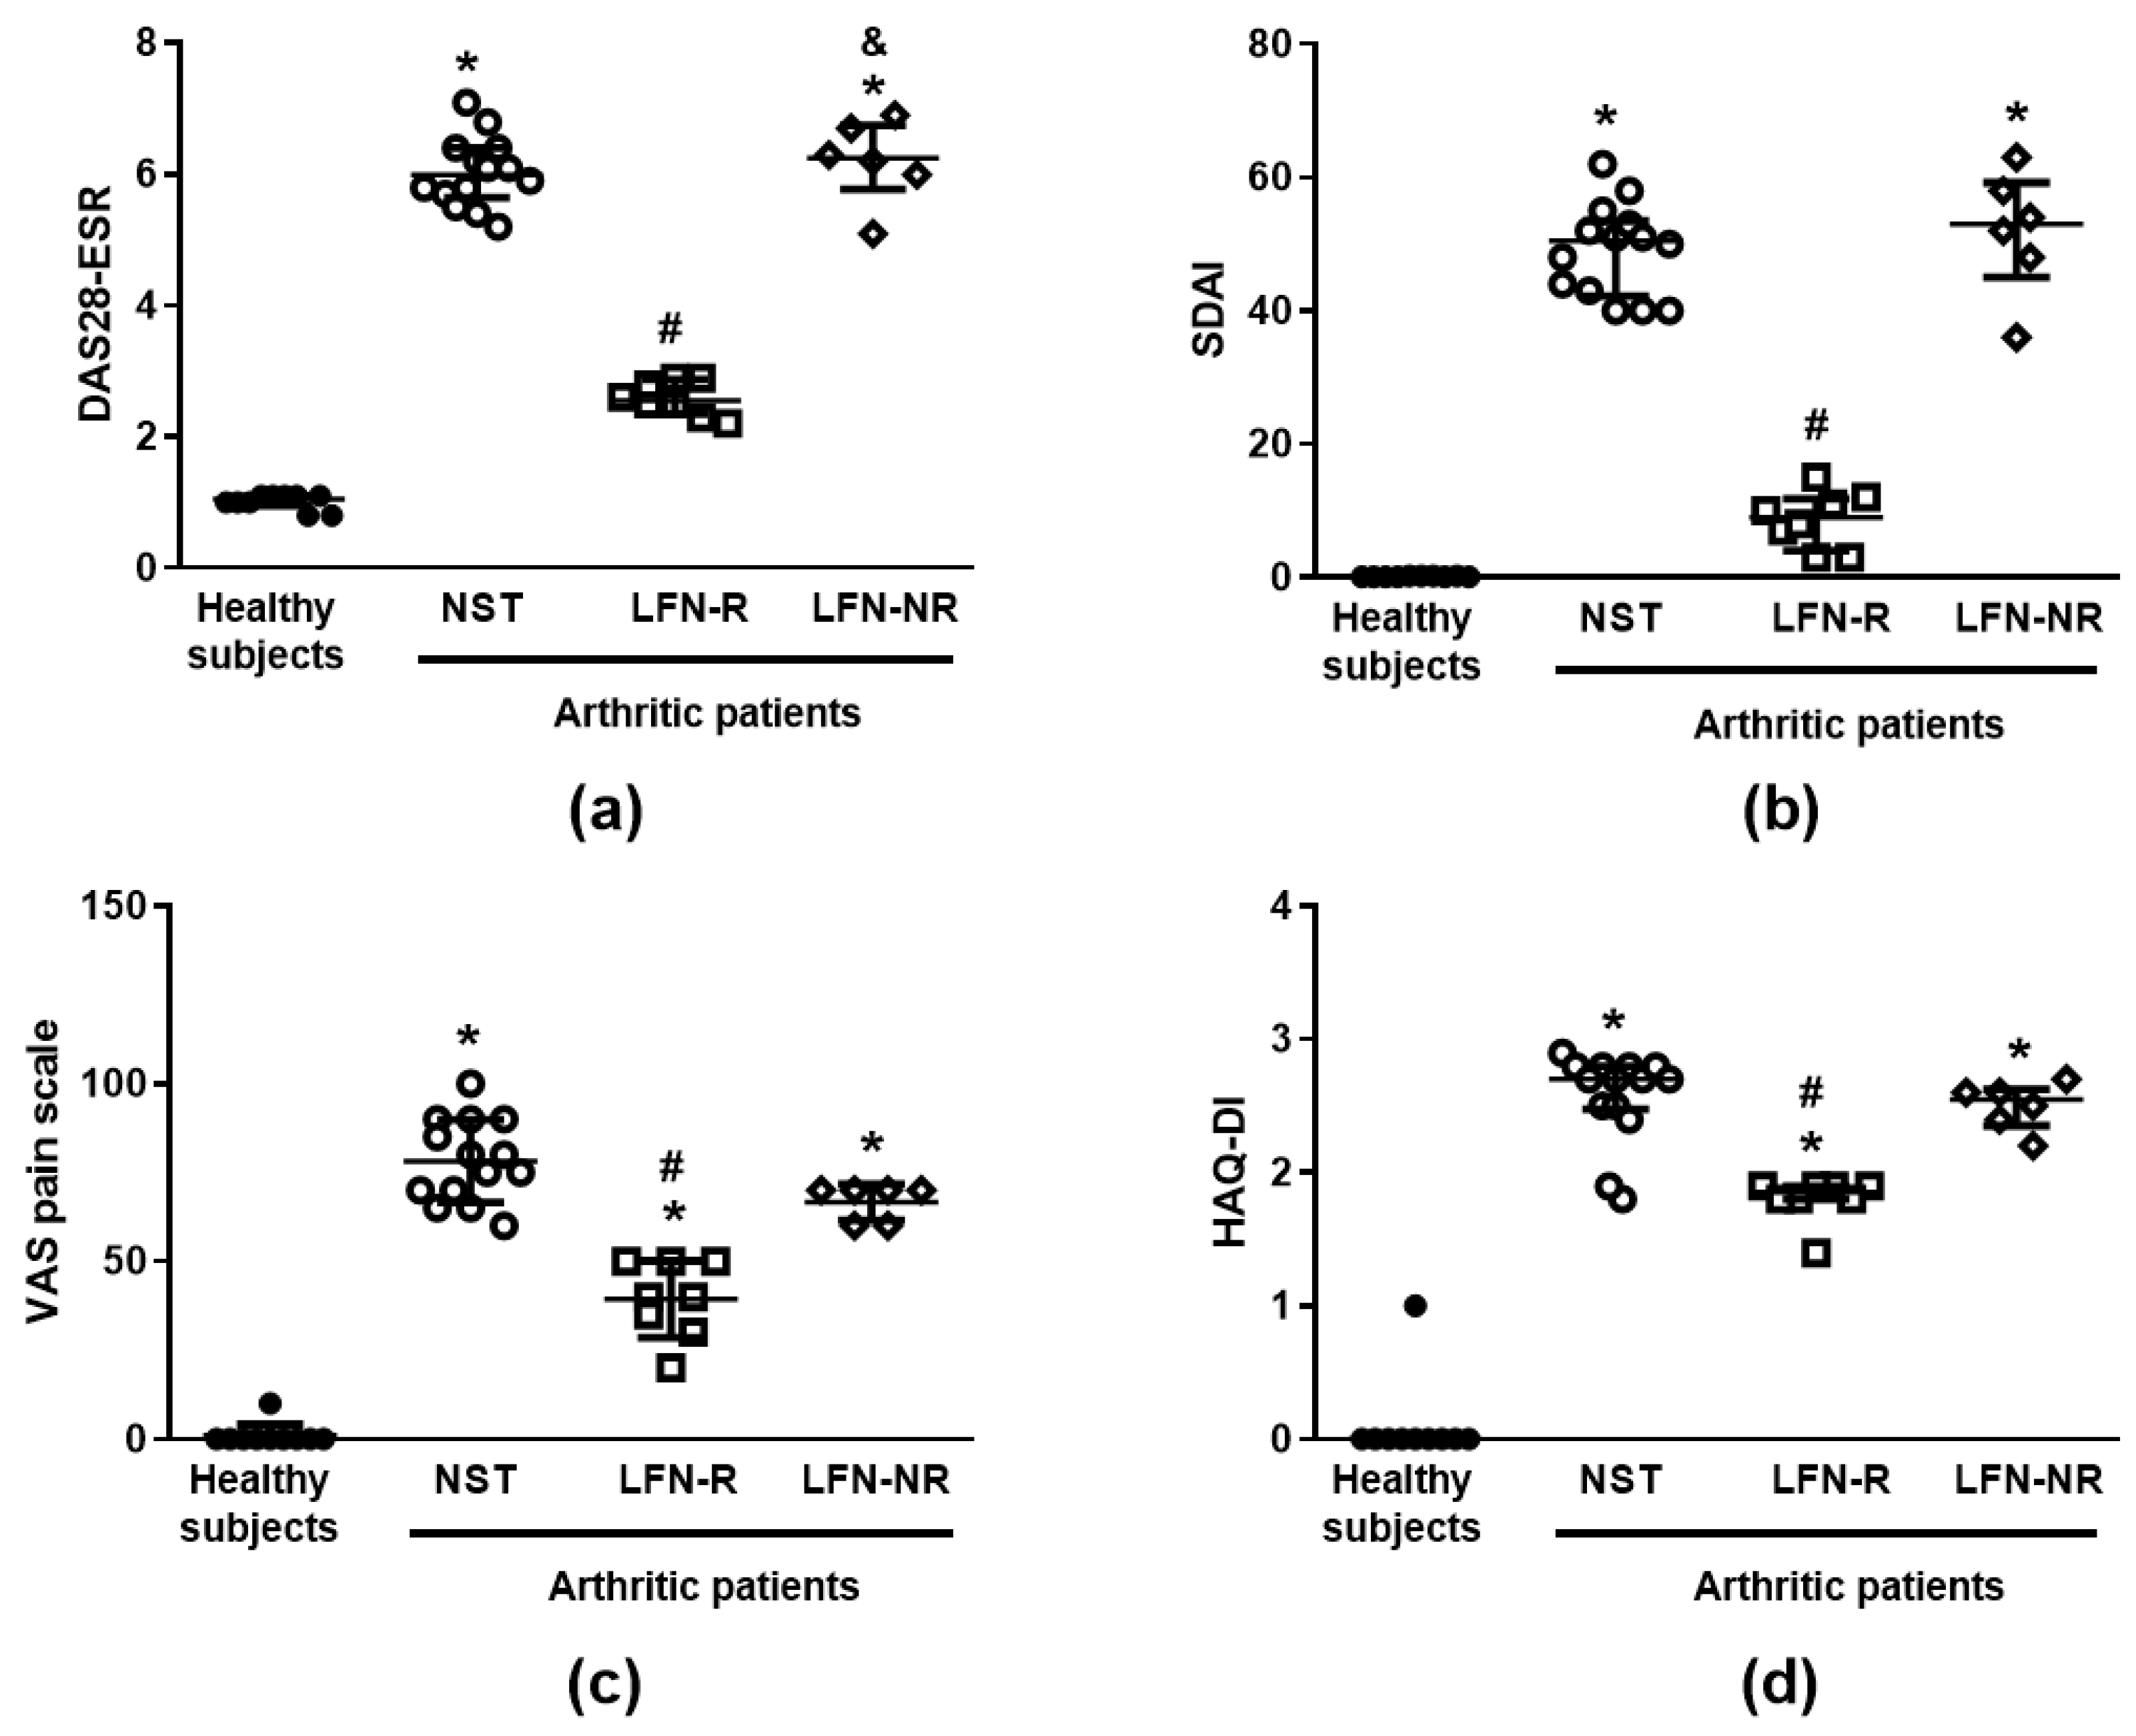
| DAS28-ESR (Median (IQR)) | (6.0 (5.7–6.4)) | (2.6 (2.4–2.9)) # | (6.3 (5.8–6.8)) |
| SDAI (Median (IQR)) | (50.5 (42.3–53.5)) | (9.0 (4.0–11.2)) # | (53.0 (45.0–59.3)) |
| VAS pain scale (Mean (SD)) | (78.2 (11.7)) | (39.4 (10.8)) # | (66.7 (5.2)) |
| HAQ-DI (Median (IQR)) | (2.7 (2.5–2.8)) | (1.9 (1.8–1.9)) # | (2.5 (2.4–2.6)) |
| C-reactive protein, mg/l (Median (IQR)) | (23.1 (17.3–37.3)) | (9.4 (7.2–13.5)) # | (29.4 (23.3–38.8)) |
| Rheumatoid factor, IU/mL (Median (IQR)) | (135.1 (110.2–169.8)) | (89.2 (68.0–107.5)) # | (127.4 (96.8–156.5)) |
Publisher’s Note: MDPI stays neutral with regard to jurisdictional claims in published maps and institutional affiliations. |
© 2021 by the authors. Licensee MDPI, Basel, Switzerland. This article is an open access article distributed under the terms and conditions of the Creative Commons Attribution (CC BY) license (http://creativecommons.org/licenses/by/4.0/).
Share and Cite
Rodrigues, J.F.S.; da Silva, L.C.M.; Cardoso-Sousa, L.; Caixeta, D.C.; Lückemeyer, D.D.; Henrique, A.S.; Pontes, J.P.; da Silva, L.M.G.; Macedo, J.S.S.; Carvalho Júnior, P.S.; et al. Monitoring of Peripheral Blood Leukocytes and Plasma Samples: A Pilot Study to Examine Treatment Response to Leflunomide in Rheumatoid Arthritis. Pharmaceuticals 2021, 14, 106. https://doi.org/10.3390/ph14020106
Rodrigues JFS, da Silva LCM, Cardoso-Sousa L, Caixeta DC, Lückemeyer DD, Henrique AS, Pontes JP, da Silva LMG, Macedo JSS, Carvalho Júnior PS, et al. Monitoring of Peripheral Blood Leukocytes and Plasma Samples: A Pilot Study to Examine Treatment Response to Leflunomide in Rheumatoid Arthritis. Pharmaceuticals. 2021; 14(2):106. https://doi.org/10.3390/ph14020106
Chicago/Turabian StyleRodrigues, João F. S., Liziane C. M. da Silva, Leia Cardoso-Sousa, Douglas Carvalho Caixeta, Debora D. Lückemeyer, Alisson S. Henrique, Jaqueline P. Pontes, Lycia M. G. da Silva, Juliana S. S. Macedo, Pedro S. Carvalho Júnior, and et al. 2021. "Monitoring of Peripheral Blood Leukocytes and Plasma Samples: A Pilot Study to Examine Treatment Response to Leflunomide in Rheumatoid Arthritis" Pharmaceuticals 14, no. 2: 106. https://doi.org/10.3390/ph14020106