Figure 1.
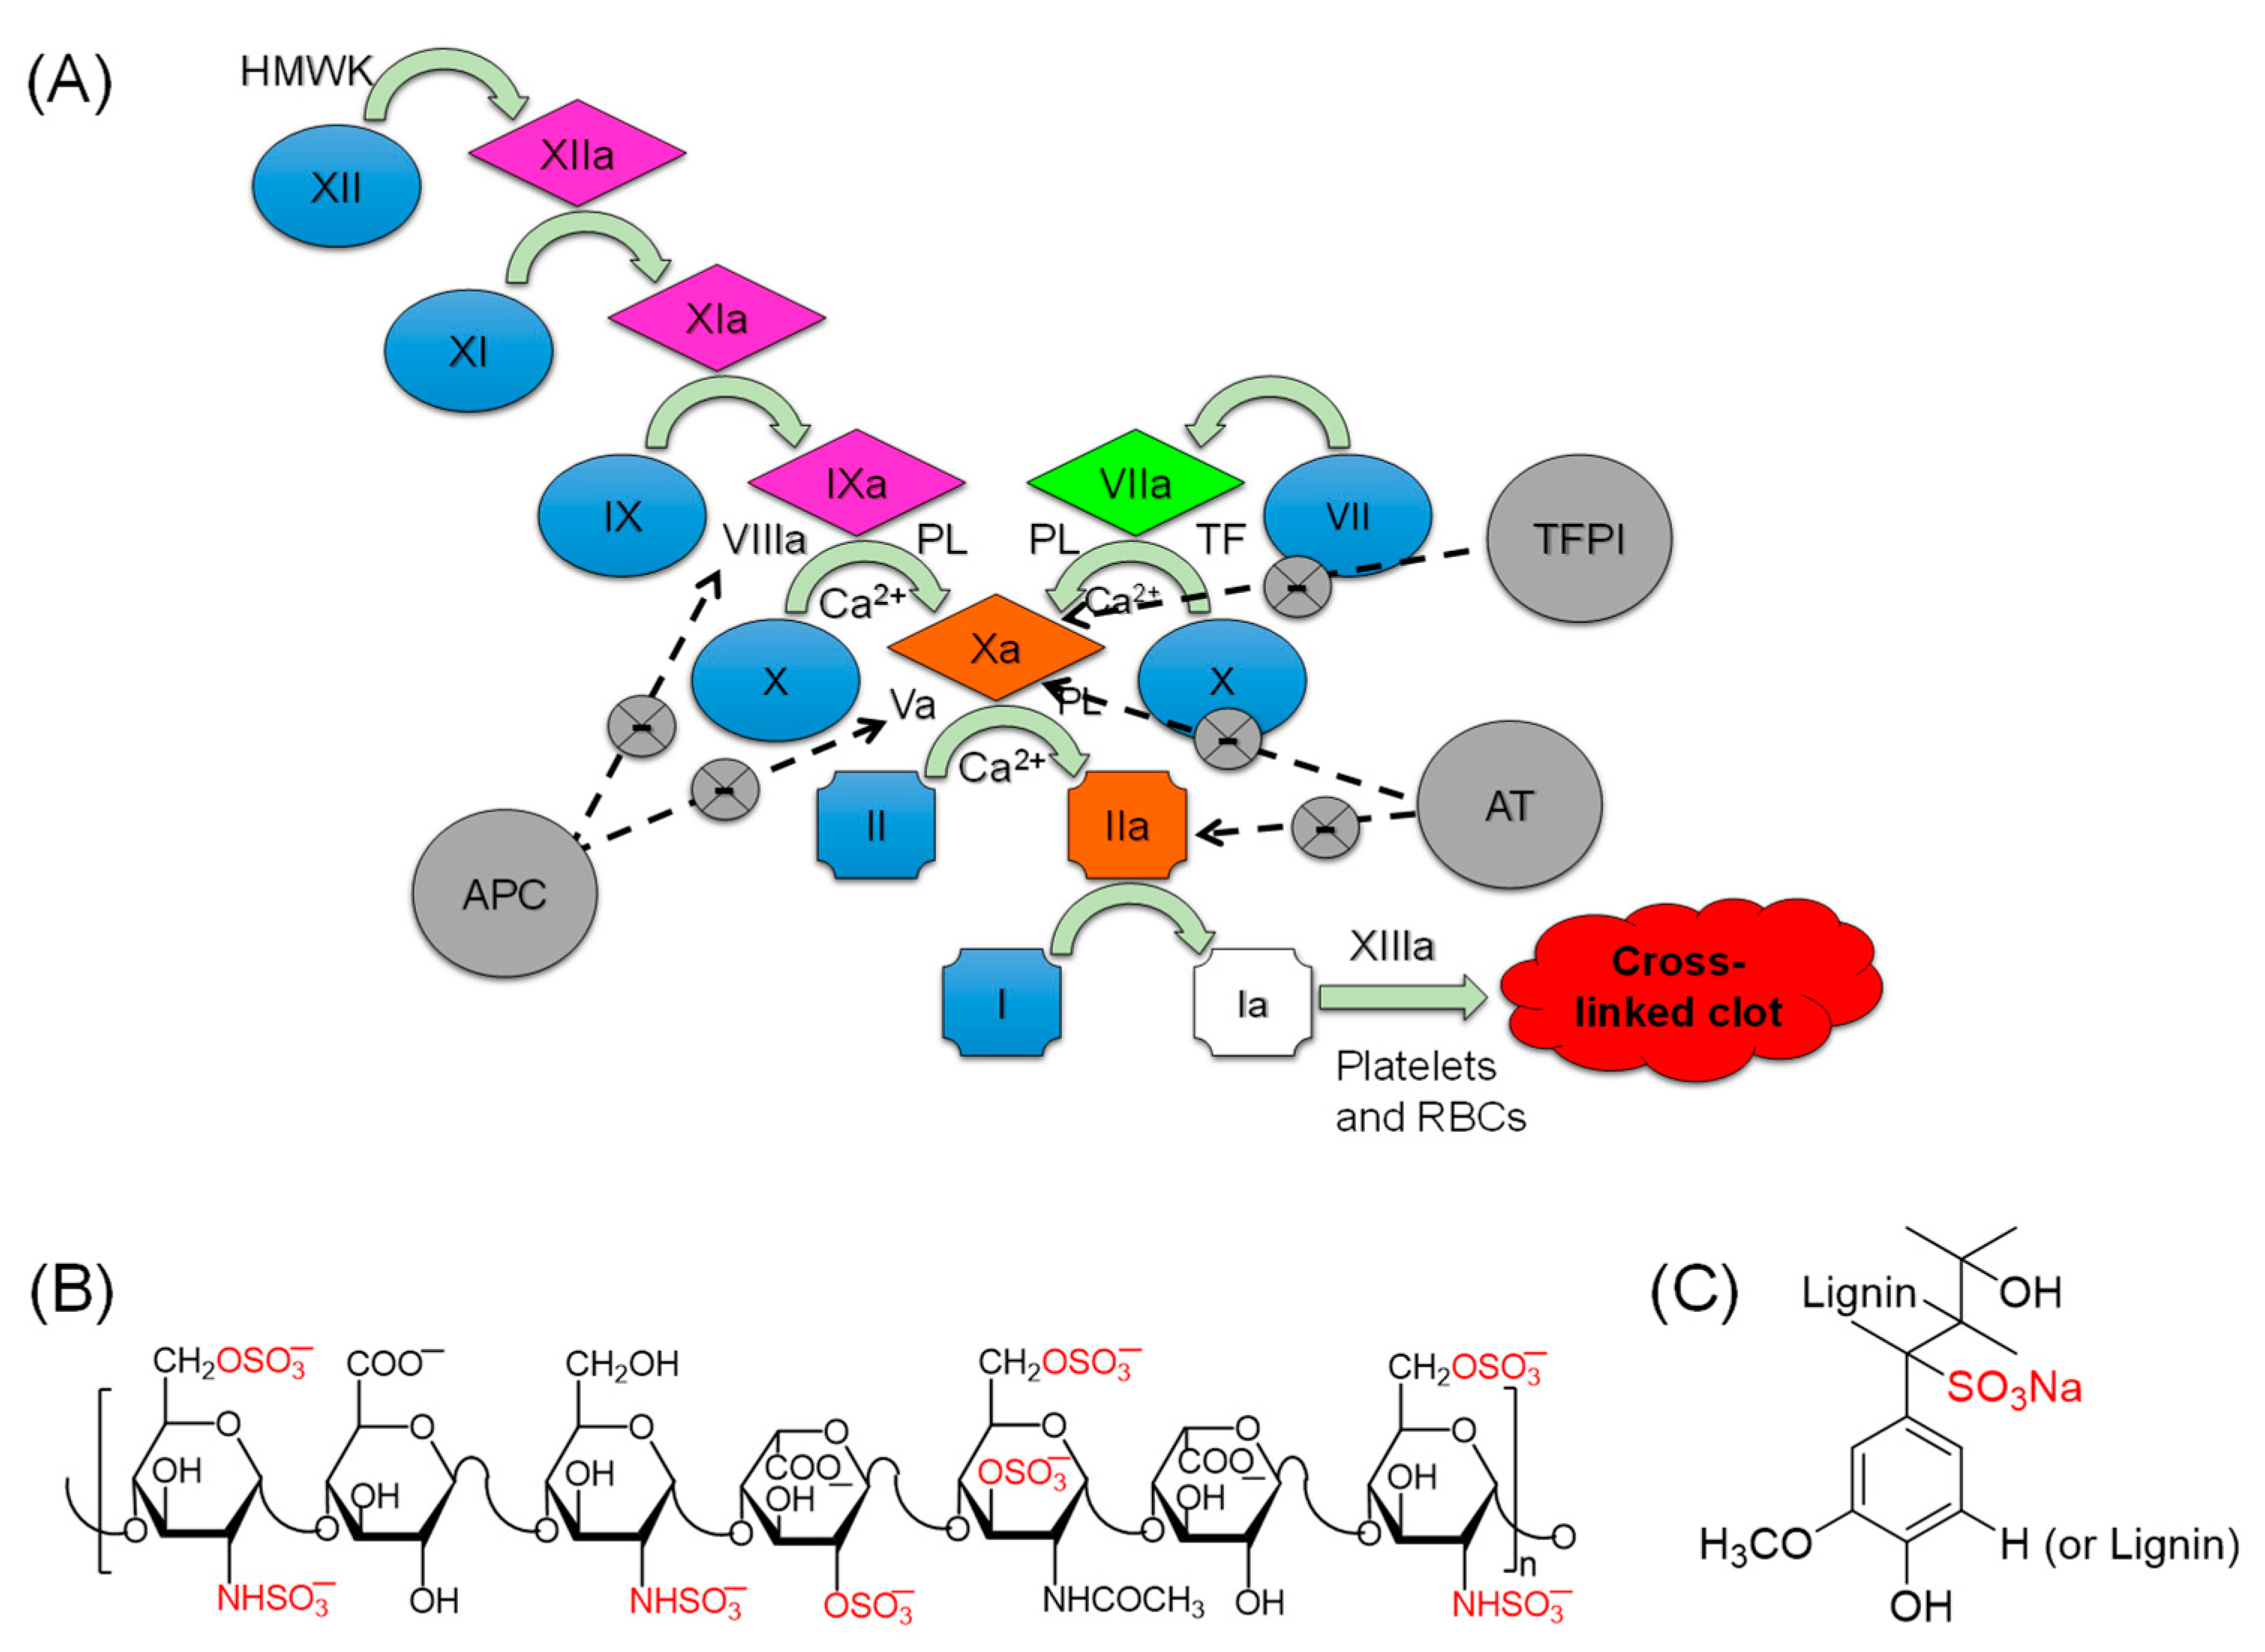
(A) A waterfall representation of the coagulation cascade in which the serine proteases of the intrinsic pathway (FXIIa, FXIa, and FIXa), the extrinsic pathway (FVIIa), and the common pathway (thrombin and FXa) work in a cascade fashion to form a clot that subsequently gets rigidified by FXIIIa-mediated fibrin cross linking. (B) A representative chemical structure of heparins, a mixture of linear polysaccharides that are largely decorated with negative charge (sulfate and carboxylate). The sulfate groups represent the fundamental structural requirements needed for heparins to act as anticoagulants via activating endogenous AT. (C) A representative structure of lignosulfonic acid sodium (LSAS) polymer that is proposed in this study as a platform to develop alternatives to heparins for use as clinically relevant and safe anticoagulants by targeting proteins in the intrinsic pathway of coagulation. High molecular weight kininogen (HMWK), phospholipid (PL), tissue factor pathway inhibitor (TFPT), antithrombin (AT), activated protein C (APC), red blood cells (RBCs).
Figure 1.
(A) A waterfall representation of the coagulation cascade in which the serine proteases of the intrinsic pathway (FXIIa, FXIa, and FIXa), the extrinsic pathway (FVIIa), and the common pathway (thrombin and FXa) work in a cascade fashion to form a clot that subsequently gets rigidified by FXIIIa-mediated fibrin cross linking. (B) A representative chemical structure of heparins, a mixture of linear polysaccharides that are largely decorated with negative charge (sulfate and carboxylate). The sulfate groups represent the fundamental structural requirements needed for heparins to act as anticoagulants via activating endogenous AT. (C) A representative structure of lignosulfonic acid sodium (LSAS) polymer that is proposed in this study as a platform to develop alternatives to heparins for use as clinically relevant and safe anticoagulants by targeting proteins in the intrinsic pathway of coagulation. High molecular weight kininogen (HMWK), phospholipid (PL), tissue factor pathway inhibitor (TFPT), antithrombin (AT), activated protein C (APC), red blood cells (RBCs).
![Pharmaceuticals 14 00886 g001]()
Figure 2.
(A) The effect of LSAS on the APTT of normal human plasma and human plasmas deficient of antithrombin (AT), FVII, FIX, FXI, or FXII. (B) The effects of LSAS on the APTT (intrinsic pathway), PT (extrinsic pathway), and TT (thrombin-induced clotting) of normal human plasma. (C) The APTT profile of FXI-deficient human plasma following the addition of 2.6 nM or 5.2 nM, in the presence (○) or absence (●) of LSAS. (D) The inhibition profile of human FXIa by LSAS, as spectrophotometrically measured in the chromogenic tripeptide substrate hydrolysis assay.
Figure 3.
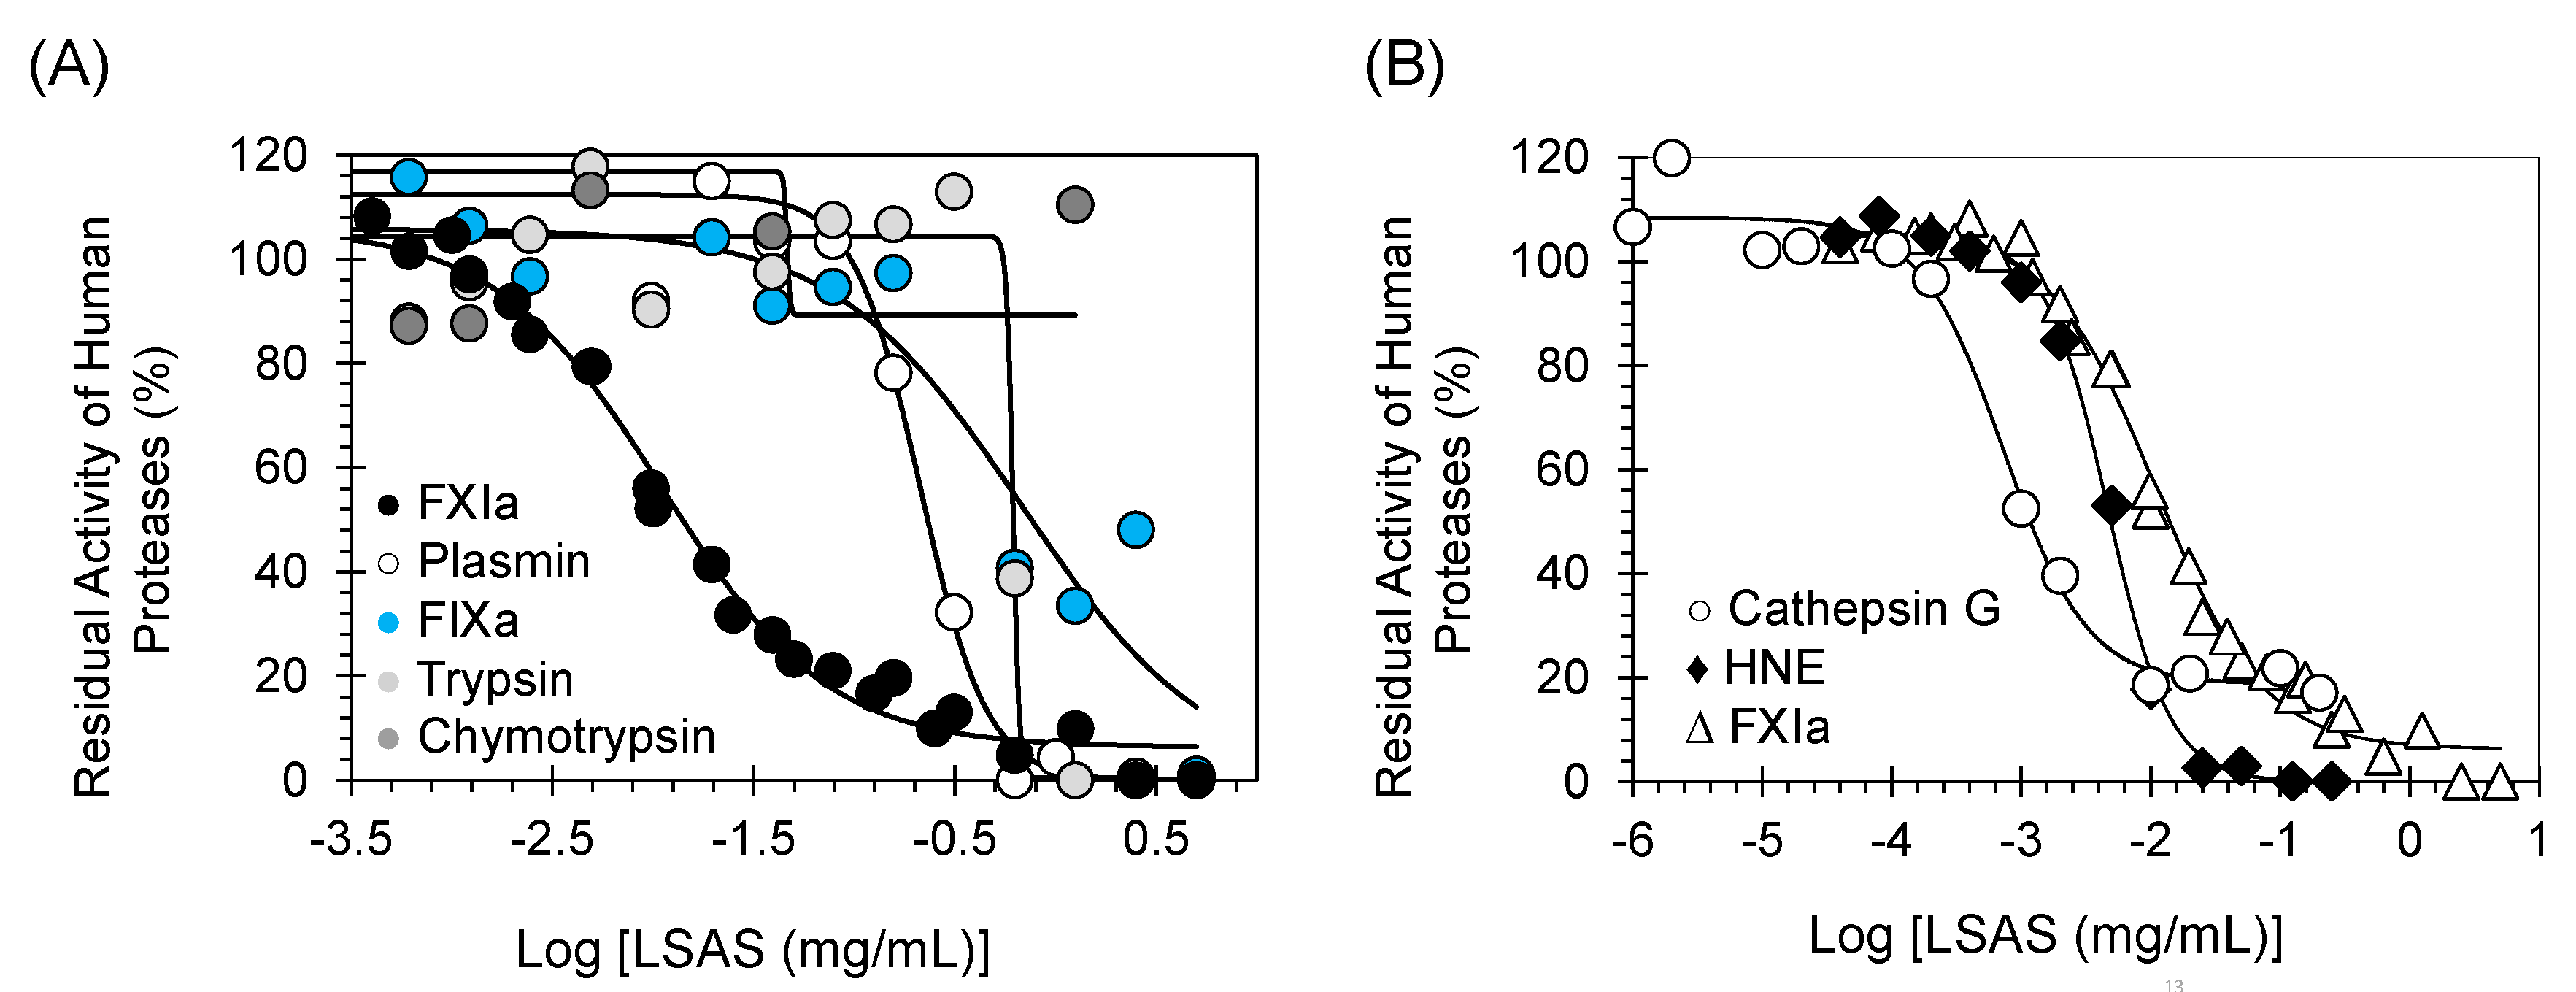
(A) Direct inhibition of serine proteases (including human FXIa) by LSAS. (B) Direct inhibitions of FXIa and the inflammatory serine proteases cathepsin G and HNE by LSAS. The inhibition of FXIa, plasmin, FIXa, trypsin, chymotrypsin, HNE, and cathepsin G by LSAS was studied as described in Methods and Materials. Solid lines are the sigmoidal dose–response fits (Equation (1)) to the data to obtain the inhibition parameters.
Figure 3.
(A) Direct inhibition of serine proteases (including human FXIa) by LSAS. (B) Direct inhibitions of FXIa and the inflammatory serine proteases cathepsin G and HNE by LSAS. The inhibition of FXIa, plasmin, FIXa, trypsin, chymotrypsin, HNE, and cathepsin G by LSAS was studied as described in Methods and Materials. Solid lines are the sigmoidal dose–response fits (Equation (1)) to the data to obtain the inhibition parameters.
Figure 4.
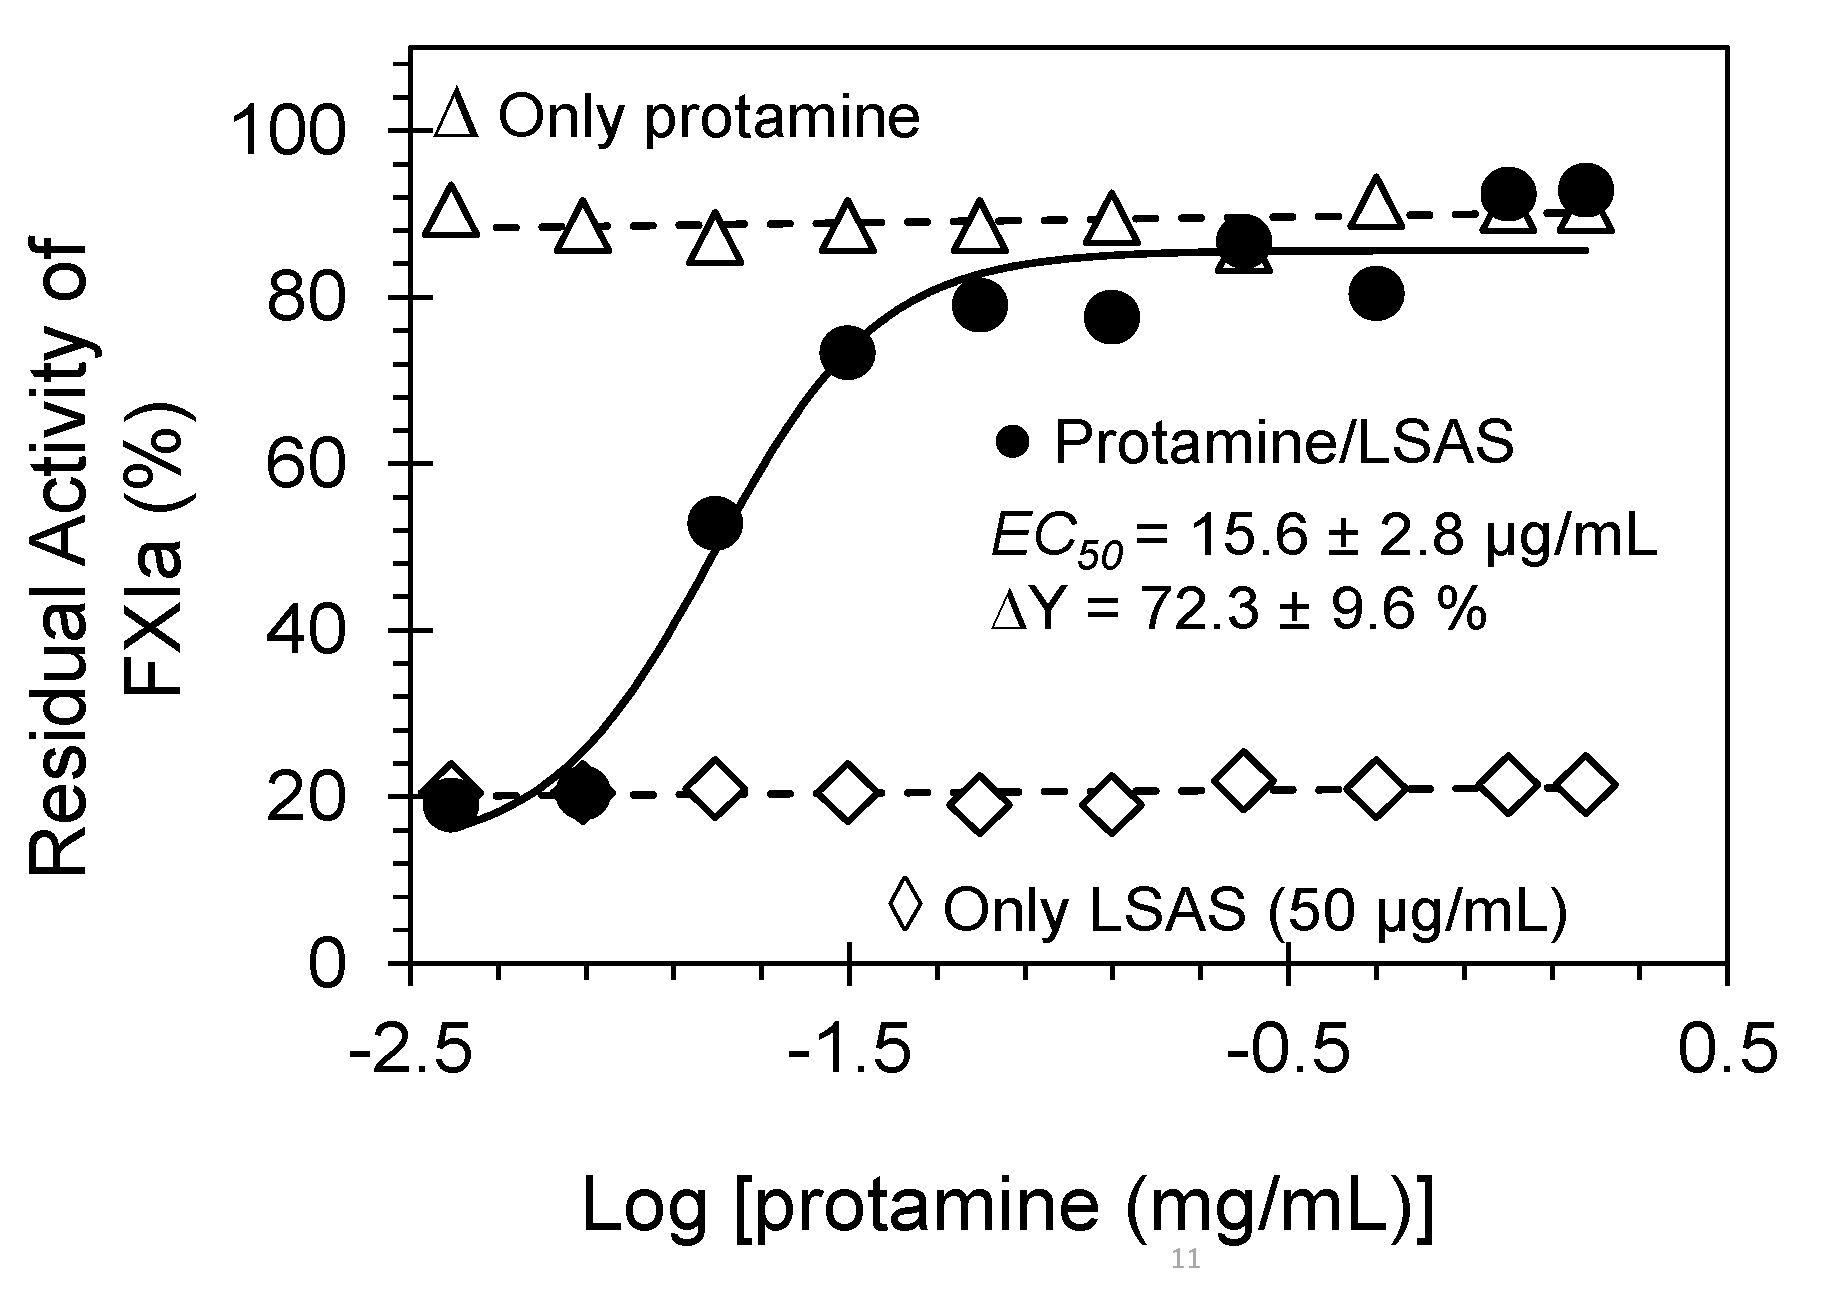
Reversibility of LSAS inhibition of FXIa by protamine sulfate. Shown is the restored FXIa activity (%), which was inhibited by 50 μg/mL of LSAS, in the presence of ascending concentration of protamine (●). Shown also are the effects of only protamine sulfate (0.0039 mg/mL–1.5 mg/mL) on the activity of FXIa (Δ) and the effect of only LSAS (50 μg/mL) on FXIa. The restored FXIa activity profiles were spectrophotometrically established at and 37 °C and pH 7.4. Solid lines represent fits by the dose–response Equation (2) to get the EC50.
Figure 4.
Reversibility of LSAS inhibition of FXIa by protamine sulfate. Shown is the restored FXIa activity (%), which was inhibited by 50 μg/mL of LSAS, in the presence of ascending concentration of protamine (●). Shown also are the effects of only protamine sulfate (0.0039 mg/mL–1.5 mg/mL) on the activity of FXIa (Δ) and the effect of only LSAS (50 μg/mL) on FXIa. The restored FXIa activity profiles were spectrophotometrically established at and 37 °C and pH 7.4. Solid lines represent fits by the dose–response Equation (2) to get the EC50.
Figure 5.
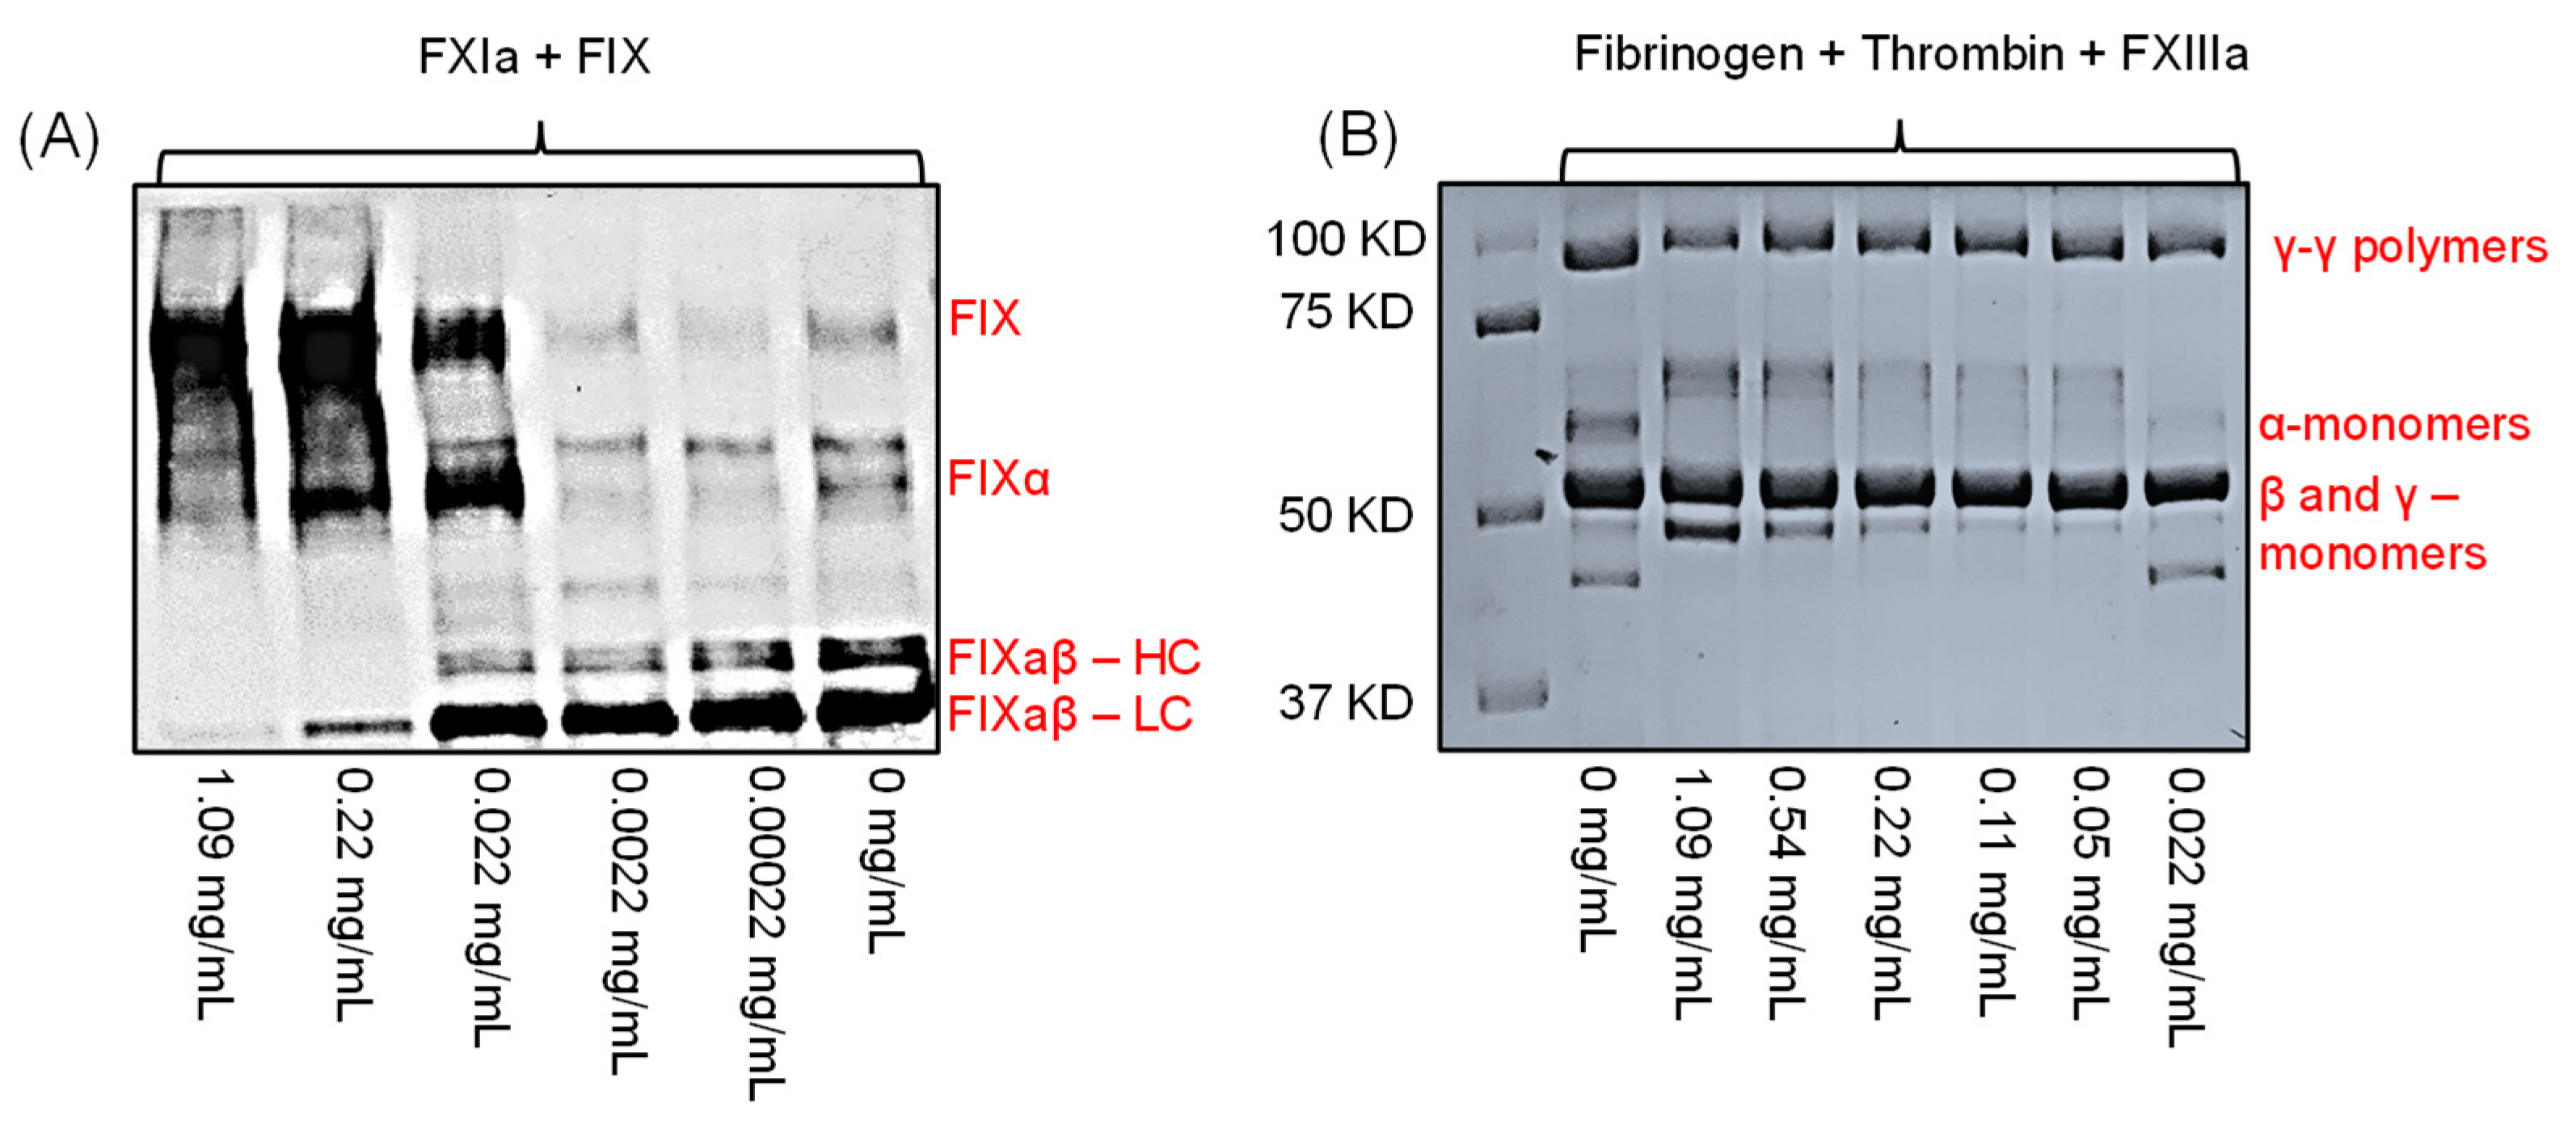
(A) Effect of LSAS on FXIa-mediated activation of FIX using Western blotting under reducing conditions. LSAS concentrations used were 0, 0.00022, 0.0022, 0.022, 0.22, and 1.09 mg/mL. Shown is activation of FIX to FIXα then to FIXaβ by cleaving the peptide bonds, Arg145–Ala146 and Arg180–Val181, respectively. FIXaβ appears as two bands: one band for the heavy chain (FIXaβ–HC) and the other band for the light chain (FIXaβ–LC), under reducing conditions. (B) Effect of LSAS on FXIIIa-mediated fibrin crosslinking as evaluated by SDS-PAGE under reducing conditions. Results indicate that the above concentrations did not affect the γ–γ polymer formation, and thus, the lack of effect on FXIIIa or even thrombin.
Figure 5.
(A) Effect of LSAS on FXIa-mediated activation of FIX using Western blotting under reducing conditions. LSAS concentrations used were 0, 0.00022, 0.0022, 0.022, 0.22, and 1.09 mg/mL. Shown is activation of FIX to FIXα then to FIXaβ by cleaving the peptide bonds, Arg145–Ala146 and Arg180–Val181, respectively. FIXaβ appears as two bands: one band for the heavy chain (FIXaβ–HC) and the other band for the light chain (FIXaβ–LC), under reducing conditions. (B) Effect of LSAS on FXIIIa-mediated fibrin crosslinking as evaluated by SDS-PAGE under reducing conditions. Results indicate that the above concentrations did not affect the γ–γ polymer formation, and thus, the lack of effect on FXIIIa or even thrombin.
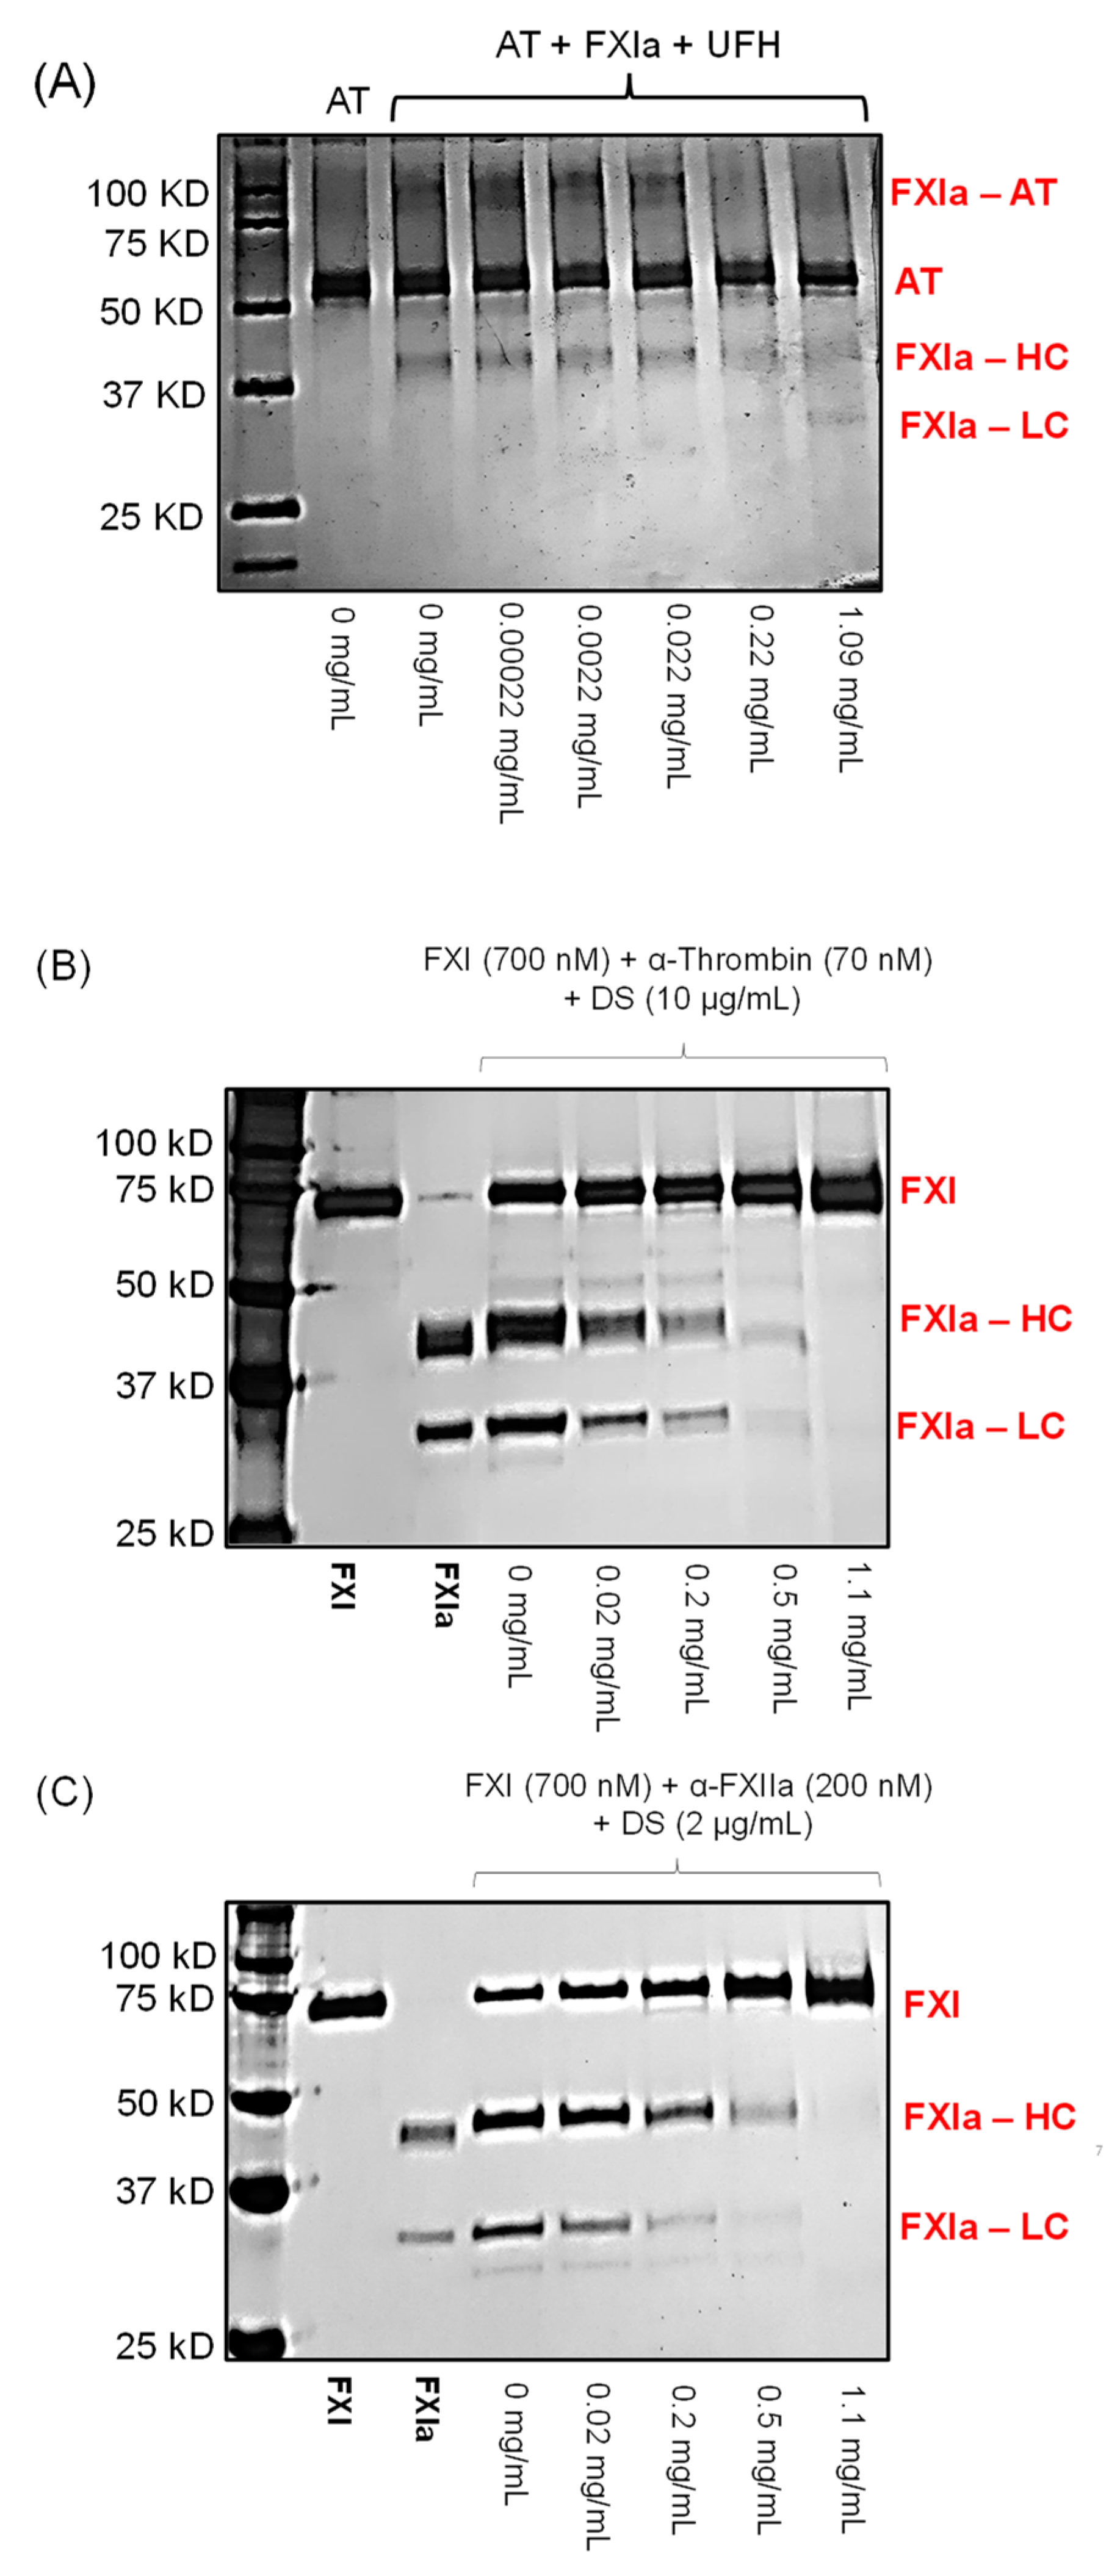
Figure 6.
Effect of different concentrations of LSAS (0–1.1 mg/mL) on FXI(a) interactions with macromolecules including the formation of FXIa–AT complex in the presence of UFH (A), activation of FXI to FXIa by thrombin (B), and activation of FXI to FXIa by FXIIa (C). Concentrations of LSAS used were 0, 0.00022, 0.0022, 0.022, 0.22, and 1.1 mg/mL. LSAS disrupted all interactions suggesting that it recognizes both the zymogen FXI and its enzyme FXIa, possibly by binding to an anion-binding site on FXI and similar site on the catalytic domain of FXIa.
Figure 7.
Competitive inhibition of human FXIa by LSAS in the presence of UFH. The FXIa inhibition was measured spectrophotometrically at 37 °C and pH 7.4. Solid lines represent fits by the dose–response Equation (1) to calculate the inhibition parameters. The concentrations of UFH elected for the experiment were 0 (●), 0.5 (○), 5 (▲), 50 (♦), and 250 (■) μM.
Figure 8.
Michaelis–Menten kinetics of the S-2366 chromogenic tripeptide hydrolysis by human FXIa in the presence of different concentrations of LSAS. The initial rate of hydrolysis at different substrate concentrations was measured in pH 7.4 buffer using the wild type of full length FXIa. The concentrations of LSAS selected in this experiment were 0 (●), 1 (□), 10 (▲), 25 (◊), 50 (■), and 250 μg/mL (○). Lines represent nonlinear regressional fits to the data by the Michaelis–Menten Equation (3).
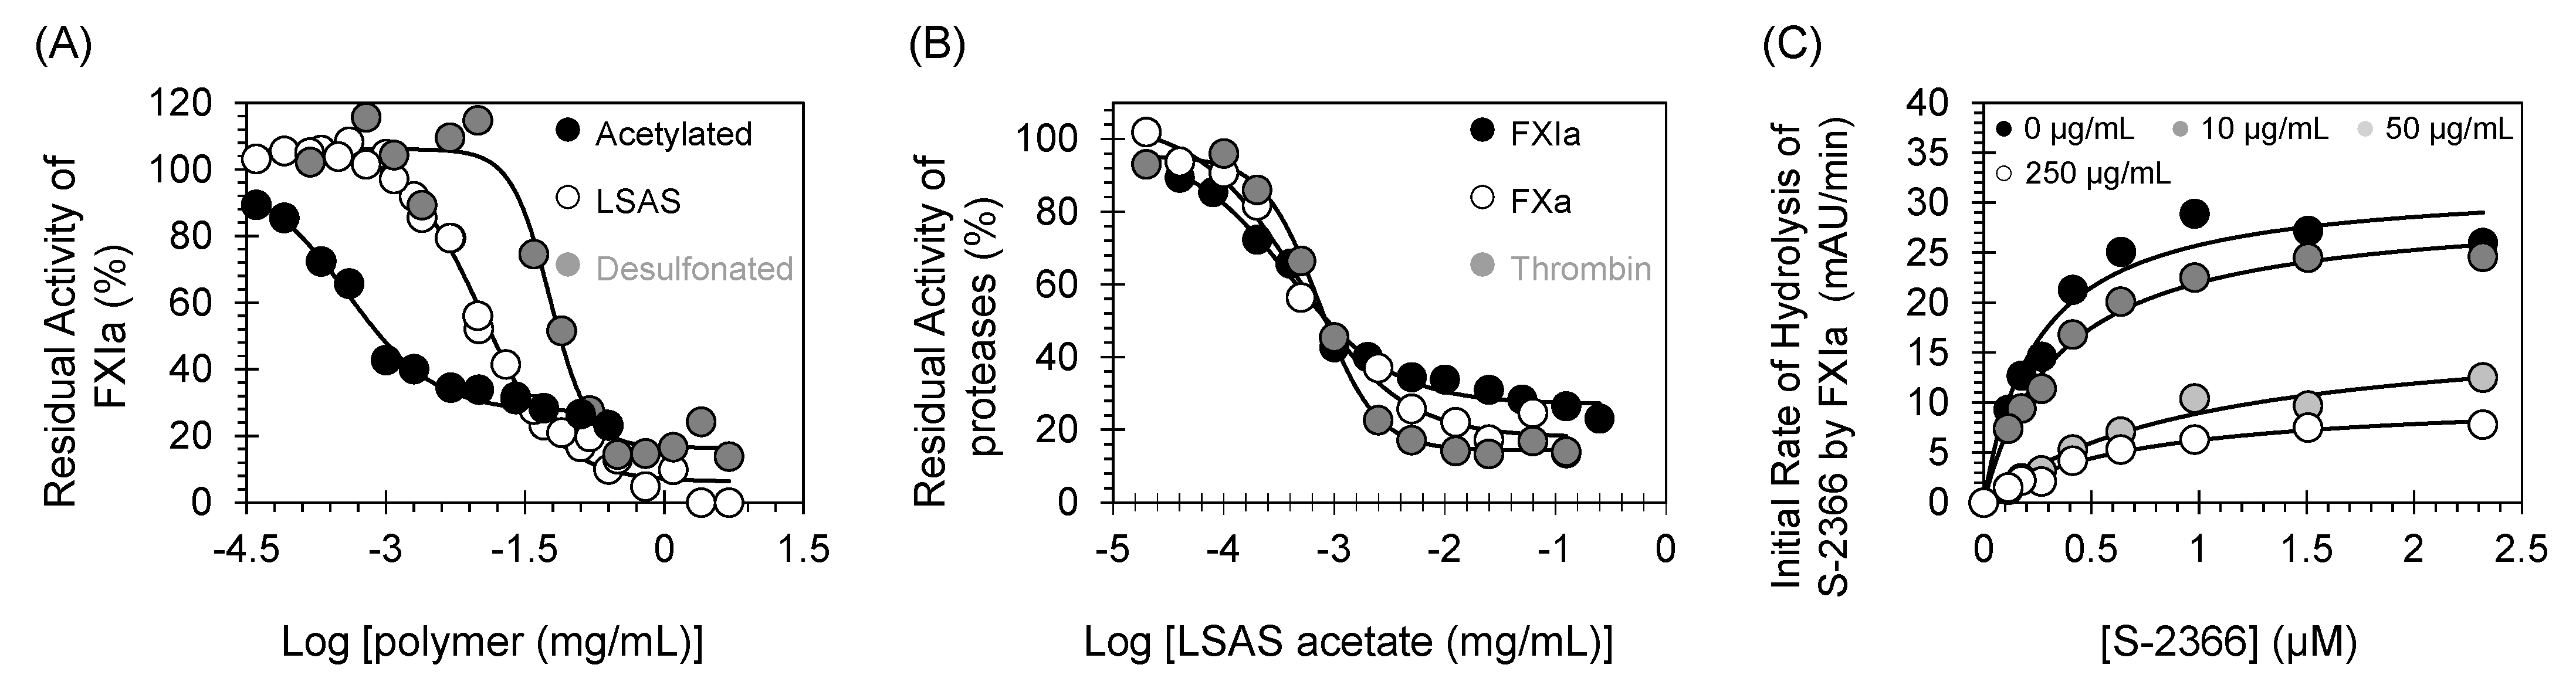
Figure 9.
(A) Direct inhibition of FXIa by LSAS and its acetylated and desulfonated derivatives. The inhibition of FXIa by acetylated LSAS (●), LSAS (○), and desulfonated LSAS (●) was studied at 37 °C and pH 7.4. Solid lines represent sigmoidal dose–response fits using Equation (1) to the data to calculate the inhibition parameters. (B) Direct inhibition of coagulation serine proteases (thrombin (●), FXa (○), and FXIa (●)) by acetylated LSAS. (C) Michaelis–Menten kinetics of S-2366 chromogenic tripeptide hydrolysis by FXIa in the presence of desulfonated LSAS. The initial rate of hydrolysis at different substrate concentrations was determined using wild-type full-length FXIa, in pH 7.4 buffer. The concentrations of desulfonated LSAS chosen in the study were 0 (●), 10 (●), 50 (●), and 250 μg/mL (○). Solid lines represent nonlinear regression fits to the data by the Michaelis–Menten Equation (3).
Table 1.
The effect of LSAS on the clotting times (APTT, PT, and TT) of different human plasmas a.
Table 1.
The effect of LSAS on the clotting times (APTT, PT, and TT) of different human plasmas a.
| Type of Human Plasma | (LSAS) (µg/mL) to Double Clotting Time |
|---|
| APTT assay | APTTEC×2 |
| Normal | 308.8 b ± 23.9 c |
| Deficient of AT | 275.0 ± 62.0 |
| Deficient of FVII | 329.1 ± 58.7 |
| Deficient of FIX | 254.4 ± 27.5 |
| Deficient of FXI | 428.9 ± 45.6 |
| Deficient of FXII | 282.2 ± 119.8 |
| PT assay | PTEC×2 |
| Normal | 980.1 ± 145.0 |
| TT assay | TTEC×2 |
| Normal | >>500 |
Table 2.
Inhibition of clotting factors by LSAS a.
Table 2.
Inhibition of clotting factors by LSAS a.
| Enzyme | IC50 (µg/mL) | HS | ∆Y (%) |
|---|
| Thrombin | >125 | ND c | ND |
| FXa | >125 | ND | ND |
| FIXa | > 673 | ND | ND |
| FXIa | 7.9 ± 0.9 b | 0.9 ± 0.2 | 98.1 ± 4.7 |
| FXIIa | 714.0 ± 107.5 | 2.4 ± 0.5 | 92.6 ± 4.5 |
| FXIIIa | >12.5 | ND | ND |
| Plasmin | 212.5 ± 25.8 | 2.6 ± 0.8 | 112.4 ± 6.1 |
| Trypsin | >600 | ND | ND |
| Chymotrypsin | >2000 | ND | ND |
| HNE | 4.7 ± 0.2 | 1.8 ± 0.2 | 104.9 ± 2.1 |
| Cathepsin G | 0.73 ± 0.11 | 1.3 ± 0.3 | 89.7 ± 4.0 |
Table 3.
Inhibition of human FXIa by LSAS in the presence of UFH under physiologically relevant conditions a.
Table 3.
Inhibition of human FXIa by LSAS in the presence of UFH under physiologically relevant conditions a.
| UFH (µM) | IC50 (µg/mL) | HS | ∆Y (%) |
|---|
| 0 | 11.0 ± 1.8 b | 1.1 ± 0.2 | 99.8 ± 5.4 |
| 0.5 | 24.6 ± 3.7 | 0.9 ± 0.1 | 95.6 ± 4.5 |
| 5 | 28.9 ± 5.6 | 0.8 ± 0.1 | 102.1 ± 5.2 |
| 50 | 70.6 ± 11.6 | 1.1 ± 0.2 | 82.0 ± 4.5 |
| 150 | 91.8 ± 21.3 | 0.7 ± 0.1 | 90.6 ± 5.3 |
| 250 | 131.6 ± 22.7 | 0.8 ± 0.1 | 89.3 ± 2.9 |
Table 4.
Hydrolysis of the chromogenic substrate S-2366 by FXIa in the presence of LSAS a.
Table 4.
Hydrolysis of the chromogenic substrate S-2366 by FXIa in the presence of LSAS a.
| [1] (µg/mL) | S-2366 KM (mM) | VMAX (mAU/min) |
|---|
| 0 | 0.36 ± 0.03 b | 37.7 ± 1.0 |
| 1 | 0.29 ± 0.03 | 26.9 ± 0.7 |
| 10 | 0.31 ± 0.05 | 24.6 ± 1.2 |
| 25 | 0.31 ± 0.07 | 13.3 ± 0.9 |
| 50 | 0.43 ± 0.04 | 9.0 ± 0.3 |
| 150 | 0.30 ± 0.14 | 4.9 ± 0.7 |
Table 5.
Inhibition profile of different polymers a.
Table 5.
Inhibition profile of different polymers a.
| Polymer | FXIa IC50 (µg/mL) | Thrombin IC50 (µg/mL) | FXa IC50 (µg/mL) |
|---|
| LSAS | 7.9 ± 0.9 b | >125 | >125 |
| LSAS acetate | 0.39 ± 0.1 | 0.73 ± 0.04 | 0.48 ± 0.09 |
| Desulfonated | 53.9 ± 16.3 | ND c | ND |
Table 6.
Hydrolysis of the chromogenic substrate S-2366 by FXIa in the presence of desulfonated polymer a.
Table 6.
Hydrolysis of the chromogenic substrate S-2366 by FXIa in the presence of desulfonated polymer a.
| Desulfonated Polymer (µg/mL) | S-2366 KM (mM) | VMAX (mAU/min) |
|---|
| 0 | 0.25 ± 0.05 b | 32.1 ± 2.1 |
| 10 | 0.35 ± 0.04 | 29.7 ± 1.1 |
| 50 | 0.99 ± 0.24 | 17.8 ± 2.0 |
| 250 | 0.70 ± 0.12 | 10.6 ± 0.8 |


