
Selective Spectrofluorimetric Approach for the Assessment of Two Antipsychotic Drugs through Derivatization with O-Phthalaldehyde

 ,
,  ,
,  and
and
Abstract
:1. Introduction
2. Results and Discussions
2.1. Optimization of Experimental Conditions
2.1.1. Impact of pH
2.1.2. Influence of O-Phthalaldehyde Volume
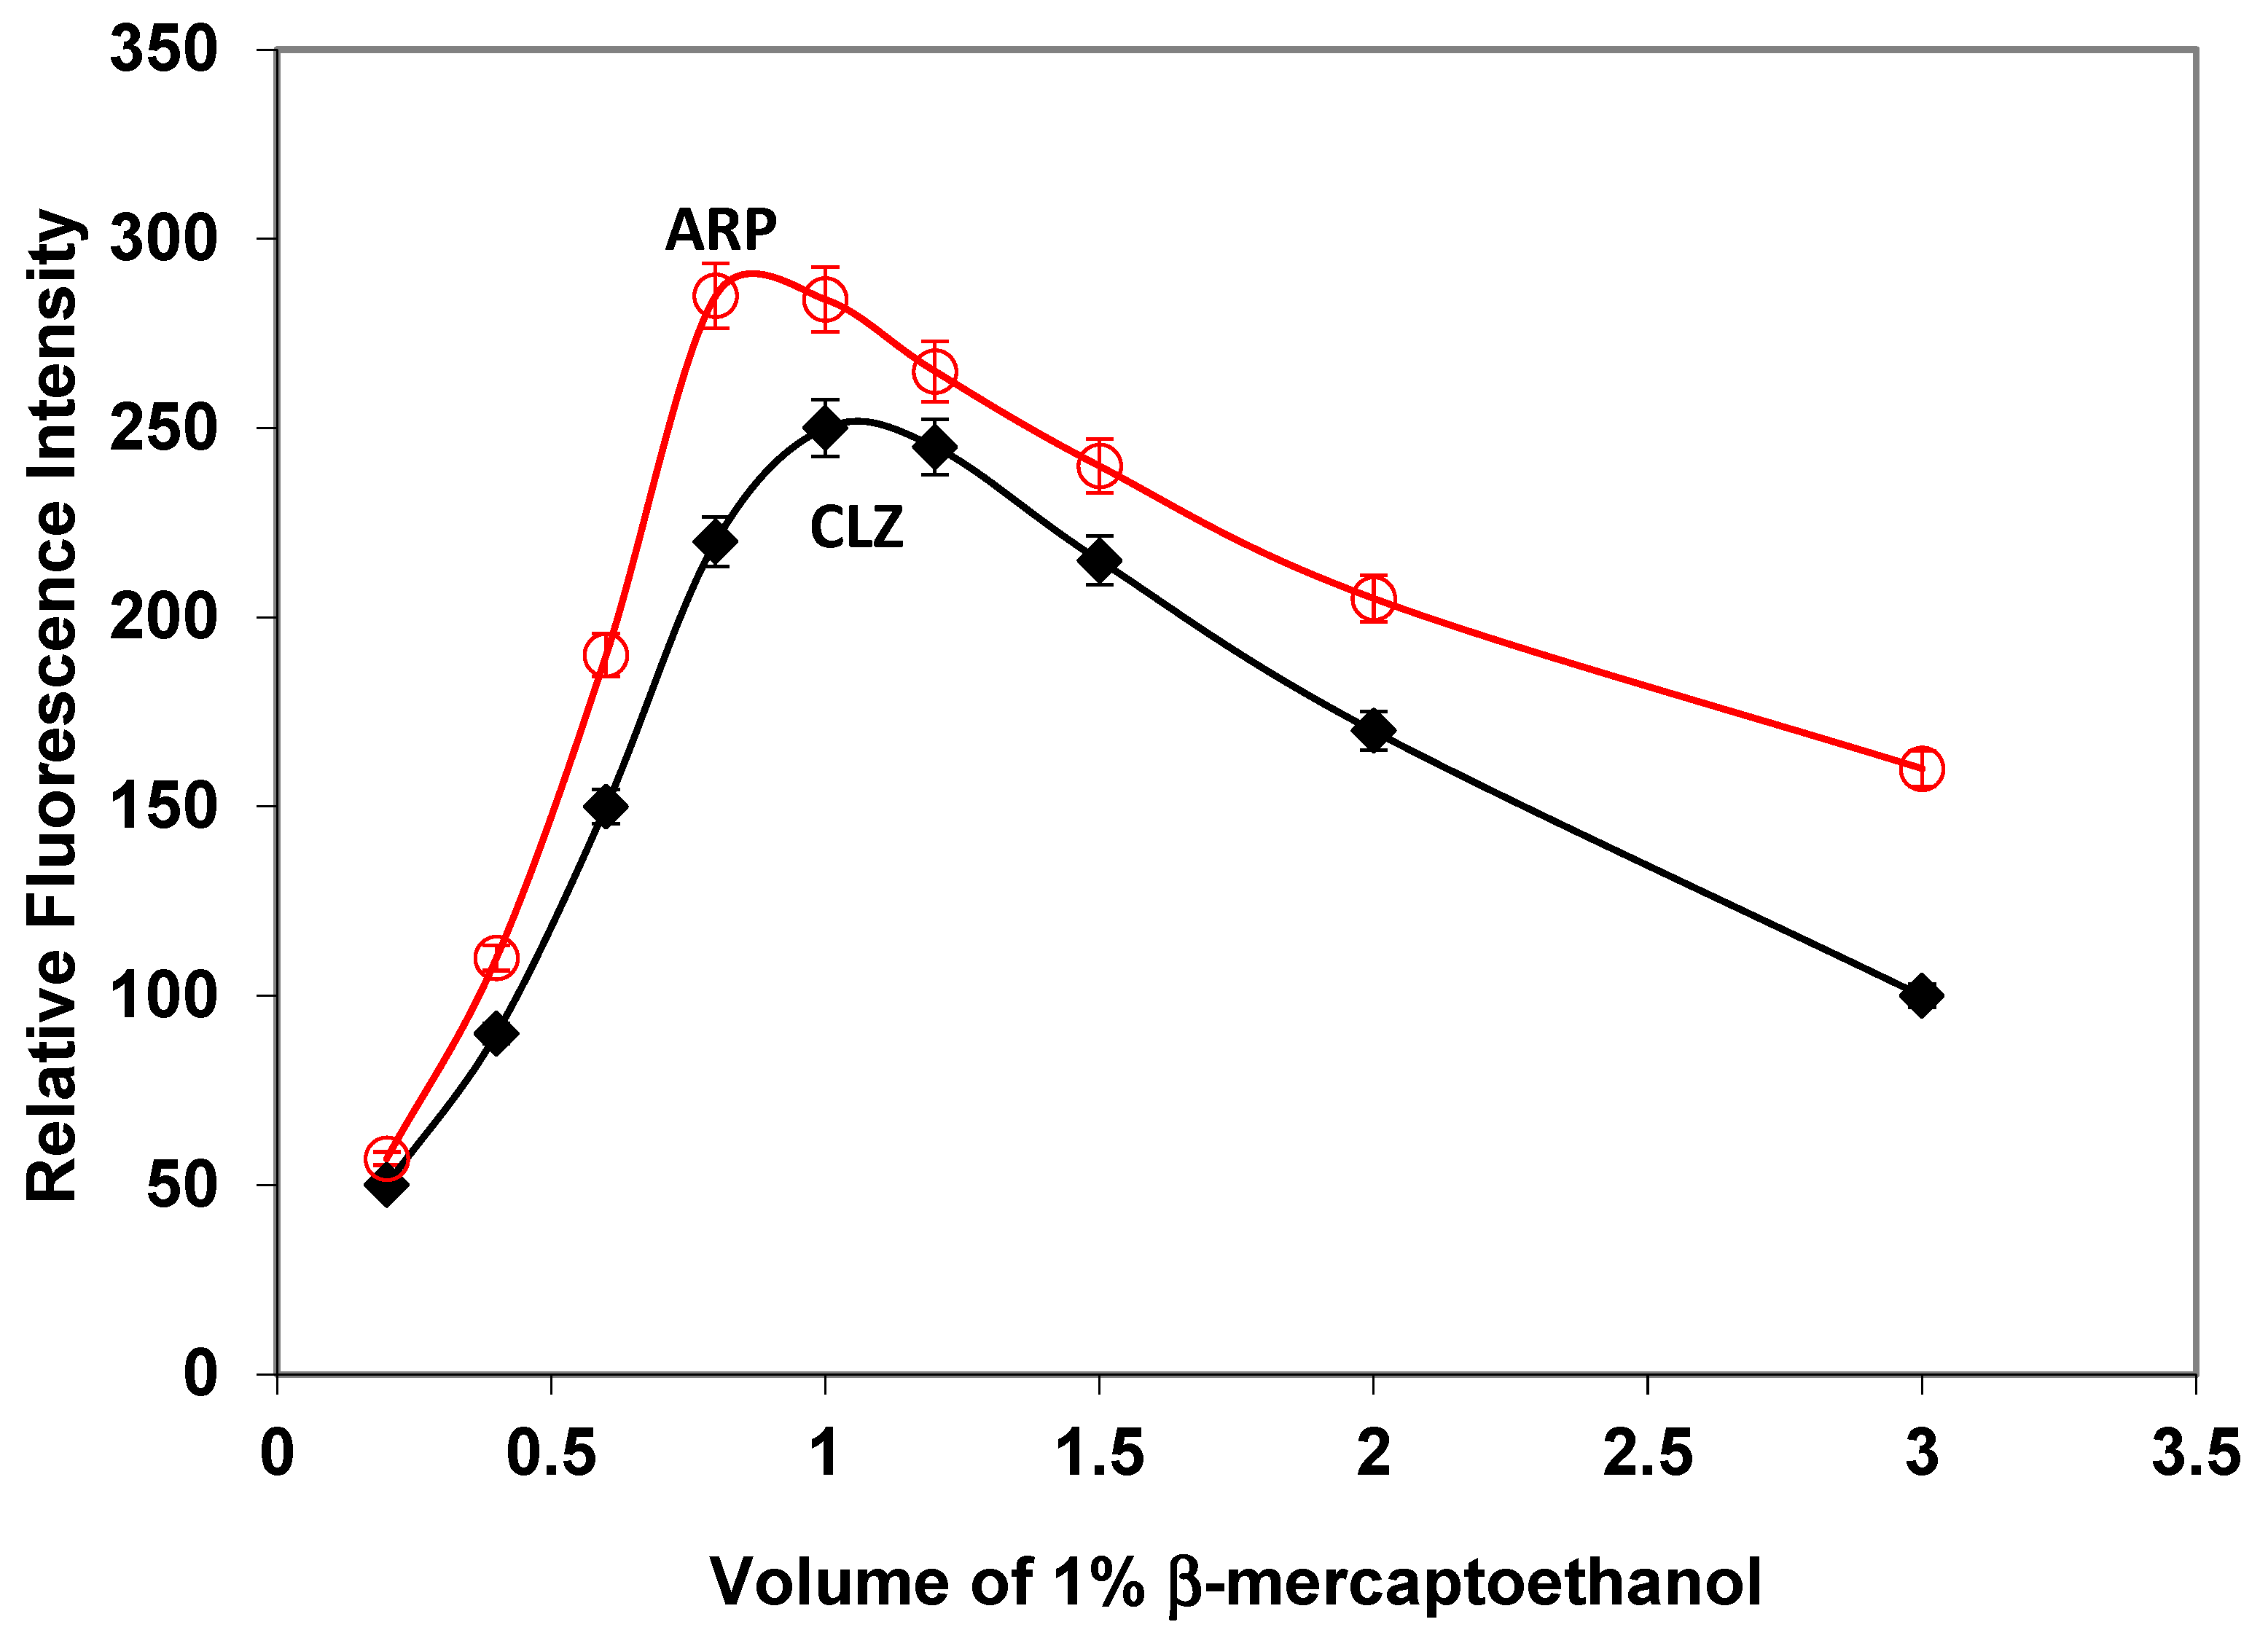
2.1.3. Influence of β-Mercaptoethanol Volume
2.1.4. Influence of Reaction Time
2.1.5. Impact of Temperature
2.2. Linearity and Range
2.3. Detection Limit
2.4. Accuracy and Precision
2.5. Tablets Analysis
3. Materials and Methods
3.1. Instrumentation
3.2. Reagents Preparation
- Stock solutions preparation: Pharmaceutical grade ARP and CLZ confirmed to be 99.85% pure was obtained as a gift, kindly supplied from the Egyptian International Pharmaceutical Industries Company (EIPICo), Egypt. Separate pure ARP and CLZ stock solutions were developed by dissolution 10 mg of each medication in concentrated H2SO4 (1.0 mL) followed by completion to 100 mL of purified water.
- o-phthalaldehyde was obtained from Sigma (St. Louis, MO, USA). A 0.1% (w/v) methanol stock solution was freshly prepared.
- Sigma also supplied β-mercaptoethanol (St. Louis, MO, USA). A 0.1% (v/v) ethanol stock solution was also prepared.
- Calculated amounts of 0.2 M boric acid and 0.2 M NaOH were used to prepare a borate buffer solution to adjust the pH to 9.0, 10 with a pH meter.
3.3. Recommendations for General Processes
3.4. Tablet Procedure
4. Conclusions
Author Contributions
Funding
Institutional Review Board Statement
Informed Consent Statement
Data Availability Statement
Conflicts of Interest
References
- Rao, L.V.; Snyder, M.L.; Vallaro, G.M. Rapid liquid chromatography/tandem mass spectrometer (LCMS) method for clozapine and its metabolite N-desmethyl clozapine (Norclozapine) in human serum. J. Clin. Lab. Anal. 2009, 23, 394–398. [Google Scholar] [CrossRef]
- Li, K.Y.; Li, H.D. A typical antipsychotic of pharmacokinetics of quetiapine. Chin. J. Clin. Pharmacol. 2002, 18, 227–231. [Google Scholar]
- Raggi, M.A. Therapeutic drug monitoring: Chemical-clinical correlations of atypical antipsychotic drugs. Curr. Med. Chem. 2002, 14, 1397–1449. [Google Scholar] [CrossRef] [PubMed]
- Gerlach, J. Improving outcome in schizophrenia: The potential importance of EPS and neuroleptic dysphoria. Ann. Clin. Psychiatry 2002, 14, 47–57. [Google Scholar] [CrossRef]
- Yoshimura, R.; Ueda, N.; Nakamura, J. Possible relationship between combined plasma concentrations of risperidone plus 9-hydroxyrisperidone and extra pyramidal symptoms.Preliminary study. Neuropsychobiology 2001, 44, 129–133. [Google Scholar] [CrossRef] [PubMed]
- Davis, P.C.; Wong, J.; Gefvert, O. Analysis and pharmacokinetics of quetiapine and two metabolites in human plasma using reversed-phase HPLC with ultraviolet and electrochemical detection. J. Pharm. Biomed. Anal. 1999, 20, 271–282. [Google Scholar] [CrossRef]
- Ereshefsky, L. Pharmacokinetics and drug interactions: Update for new antipsychotics. J. Clin. Psychiatry 1996, 57, 12–25. [Google Scholar] [PubMed]
- Deshmukh, F.; Firke, S.; Khan, M.G.; Shirkhedkar, A.; Surana, S. Development and validation of new high performance thin layer chromatography method for determination of aripiprazole in bulk and tablet formulation. Anal. Chem. Lett. 2019, 9, 248–257. [Google Scholar] [CrossRef]
- Bhanotu, B.; Srinath, P.; Kedarnath, J. Development, estimation and validation of aripiprazole in bulk and its pharmaceutical formulation by HPLC method. Int. J. Chem. Tech. Res. 2012, 4, 124–128. [Google Scholar]
- Liang, F.; Terry, A.V.; Bartlett, M.G. Determination of aripiprazole in rat plasma and brain using ultra-performance liquid chromatography/electrospray ionization tandem mass spectrometry. Biomed. Chromatogr 2012, 26, 1325–1332. [Google Scholar] [CrossRef]
- Babu, G.R.; Rao, J.S.; Kumar, K.S.; Reddy, P.J. Stability indicating liquid chromatographic method for aripiprazole. Asian J. Pharm. Anal. 2011, 1, 3–7. [Google Scholar]
- Thakkar, R.S.; Saravaia, H.T.; Ambasana, M.A.; Kaila, H.O.; Shaha, A.K. Chromatographic Determination of Aripiprazole using HPLC and UPLC: A Comparative Validation Study. Indian J. Pharm. Sci. 2011, 73, 439–443. [Google Scholar]
- Akamine, Y.; Yasui-Furukori, N.; Kojima, M.; Inoue, Y.; Uno, T. A sensitive column-switching HPLC method for aripiprazole and dehydroaripiprazole and its application to human pharmacokinetic studies. J. Sep. Sci. 2010, 33, 3292–3298. [Google Scholar] [CrossRef]
- Koduri, S.V.; Buchireddy, S.R.; Madhusudhan, G.; Mukkanti, K.; Srinivasulu, P. Stress degradation Studies on aripiprazole and development of a validated stability indicating LC method. Chromatographia 2008, 68, 635–640. [Google Scholar]
- Shimokawa, Y.; Akiyama, H.; Kashiyama, E.; Koga, T.; Miyamoto, G. High performance liquid chromatographic methods for the determination of aripiprazole with ultraviolet detection in rat plasma and brain: Application to the pharmacokinetic study. J. Chromatogr. B Anal. Technol. Biomed. Life Sci. 2005, 821, 8–14. [Google Scholar] [CrossRef]
- Musenga, A.; Saracino, M.A.; Spinelli, D.; Rizzato, E.; Boncompagni, G.; Kenndler, E.; Raggi, M.A. Analysis of the recent antipsychotic aripiprazole in human plasma by capillary electrophoresis and high-performance liquid chromatography with diode array detection. Anal. Chim. Acta 2008, 621, 204–211. [Google Scholar] [CrossRef] [PubMed]
- SriRamya, Y.N.; Vijayalakshmi, R.; Dhanaraju, M.D. Spectrophotometric determination of aripiprazole and tapentadol using chloranilic acid reagent. Int. J. Pharm. Sci. Res. 2015, 6, 2052–2055. [Google Scholar]
- Jain, R.; Kashaw, S.K.; Jain, R.; Mishra, P.; Kohli, D.V. Visible spectrophotometric method for the determination of aripiprazole in tablets. Indian J. Pharm. Sci. 2011, 73, 74–76. [Google Scholar]
- Qi, Y.; Liu, G. Ultra-performance liquid chromatography-tandem mass spectrometry for simultaneous determination of antipsychotic drugs in human plasma and its application in therapeutic drug monitoring. Drug Des. Dev. Ther. 2021, 15, 463–479. [Google Scholar] [CrossRef]
- Couchman, L.; Fisher, D.S.; Subramaniam, K.; Benton, C.M.; Flanagan, R.J. Ultra-fast LC–MS/MS in therapeutic drug monitoring: Quantification of clozapine and norclozapine in human plasma. Drug Testing Anal. 2018, 10, 323–329. [Google Scholar] [CrossRef]
- Haas, S.E.; Brum, L.J.; de Andrade, C.; Azeredo, F.J.; Pigatto, M.; Torres, B.G.S.; Guterres, S.S.; Costa, T.D. Highly sensitive LC-MS/MS method for the determination of clozapine in rat plasma: Application to a preclinical pharmacokinetic study. J. Liq. Chromatogr. Technol. 2012, 35, 2873–2883. [Google Scholar] [CrossRef]
- Song, M.; Yu, X.; Zhao, H.; Hang, T.; Yang, L.; Xu, W. LC-MS-MS Determination and pharmacokinetic study of clozapine in human plasma. Chromatographia 2009, 69, 1049–1054. [Google Scholar] [CrossRef]
- Breivik, H.; Løkken, T.N.; Slørdal, L.; Frost, J. A validated method for the simultaneous determination of quetiapine, clozapine and mirtazapine in postmortem blood and tissue samples. J. Anal. Toxicol. 2020, 44, 440–448. [Google Scholar] [CrossRef] [PubMed]
- Rosland, M.; Szeto, P.; Procyshyn, R.; Barr, A.M.; Wasan, K.M. Determination of clozapine and its metabolite, norclozapine in various biological matrices using high-performance liquid chromatography. Drug Develop. Ind. Pharm. 2007, 33, 1158–1166. [Google Scholar] [CrossRef] [PubMed]
- Mercolini, L.; Bugamelli, F.; Kenndler, E.; Boncompagni, G.; Franchini, L.; Raggi, M.A. Simultaneous determination of the antipsychotic drugs levomepromazine and clozapine and their main metabolites in human plasma by a HPLC-UV method with solid-phase extraction. J. Chromatogr. B 2007, 846, 273–280. [Google Scholar] [CrossRef]
- Zhou, Z.; Xin, L.; Kunyan, L.; Zhihong, X.; Zeneng, C.; Wenxin, P.; Feng, W.; Ronghua, Z.; Huande, L. Simultaneous determination of clozapine, olanzapine, risperidone and quetiapine in plasma by high-performance liquid chromatography-electrospray ionization mass spectrometry. J. Chromatogr. B 2004, 802, 257–262. [Google Scholar] [CrossRef] [PubMed]
- Caramelo, D.; Rosado, T.; Oliveira, V.; Barroso, M.; Gallardo, E. Determination of antipsychotic drugs in oral fluid using dried saliva spots by gas chromatography-tandem mass spectrometry. Anal. Bioanal. Chem. 2019, 411, 6141–6153. [Google Scholar] [CrossRef]
- Zhou, D.W.; Li, F.M. Determination of free clozapine concentration in serum and plasma by capillary electrophoresis-frontal analysis. Acta Chim. Sinica. 2004, 62, 1256–1259. [Google Scholar]
- Jin, W.R.; Xu, Q.; Li, W. Determination of clozapine by capillary zone electrophoresis following end-column amperometric detection with simplified capillary/electrode alignment. Electrophoresis 2000, 21, 1415–1420. [Google Scholar] [CrossRef]
- Saylakc, R.; Incebay, H. An electrochemical platform of tannic acid and carbon nanotubes for the sensitive determination of the antipsychotic medication clozapine in pharmaceutical and biological samples. J. Electroanal. Chem. 2021, 898, 115638. [Google Scholar] [CrossRef]
- Arvand, M.; Pourhabib, A. Adsorptive stripping differential pulse voltammetric determination of clozapine in biological samples using a hydrophobic ionic liquid modified electrode. J. Anal. Chem. 2021, 76, 518–525. [Google Scholar] [CrossRef]
- Ghanbari, M.H.; Shahdost-Fard, F.; Rostami, M.; Rahimi-Nasrabadi, M.; Ahmadi, F. Electrochemical determination of the antipsychotic medication clozapine by a carbon paste electrode modified with a nanostructure prepared from titania nanoparticles and copper oxide. Microchim. Acta 2019, 186, 698. [Google Scholar] [CrossRef] [PubMed]
- El-Didamony, A.M.; Hafeez, S.M.; Hafez, M.M.A. Spectrophotometric determination of aripiprazole, clozapine and sulpiride by ion-pair extraction in tablets and biological fluids. Int. J. Pharm. Pharm. Sci. 2015, 7, 178–184. [Google Scholar]
- El-Didamony, A.M.; Hafeez, S.M.; Ali, I.I. Extractive spectrophotometric method for the determination of some antipsychotic drugs using eriochrome black T. J. Appl. Pharm. Sci. 2015, 5, 26–33. [Google Scholar] [CrossRef]
- El-Didamony, A.M.; Hafeez, S.M.; Ali, I.I. Spectrophotometric determination of four selected antipsychotic drugs in dosage forms and biological fluids. Int. J. Pharm. Sci. Rev. Res. 2014, 28, 52–60. [Google Scholar]
- Sakur, A.H.; Fael, H. Selective Spectrofluorimetric method for the determination of valacyclovir in bulk and tablets through derivatization with o-phthalaldehyde in presence of 3-mercaptopropionic acid. Int. J. Academic Sci. Res. 2015, 3, 1–10. [Google Scholar]
- Walash, M.I.; Belal, F.; El-Enany, N.; El-Maghrabey, M.H. Spectrofluorimetric determination of oseltamivir phosphate through derivatization with o-phthalaldehyde.Application to pharmaceutical preparations with a preliminary study on spiked plasma samples. Luminescence 2012, 27, 511–518. [Google Scholar] [CrossRef]
- El-Enany, N.M.; El-Sherbiny, D.T.; Abdelal, A.A.; Belal, F.F. Validated spectrofluorimetric method for the determination of lamotrigine in tablets and human plasma through derivatization with o-phthalaldehyde. J. Fluoresc. 2010, 20, 463–472. [Google Scholar] [CrossRef]
- Yoshitake, M.; Sejima, N.; Yoshida, H.; Todoroki, K.; Nohta, H.; Yamaguchi, M. Selective determination of tryptophan containing peptides through precolumn derivatization and liquid chromatography using intramolecular fluorescence resonance energy transfer detection. Anal. Sci. 2007, 8, 949–953. [Google Scholar] [CrossRef] [PubMed]
- Tzanavaras, P.D.; Zacharis, C.K.; Rigas, P. Novel automated assay for the quality control of mexiletine hydrochloride formulations using sequential injection and on-line dilution. J. Pharm. Biomed. Anal. 2008, 48, 1254–1260. [Google Scholar] [CrossRef]
- ICH Guideline Q2(R1), Validation of Analytical Procedures: Text and Methodology; European Medicines Agency: London, UK, 2005.


| Parameters | ARP | CLZ |
|---|---|---|
| Linear range, μg/mL | 0.1–0.5 | 0.1–0.5 |
| Correlation coefficient (r) | 0.9989 | 0.9983 |
| Linear regression equation | ||
| Sy/x | 4.049 | 3.877 |
| Intercept (a) | −21 | −15.9 |
| Slope (b) | 664 | 521 |
| S.D. of slope (Sb) | 12.806 | 12.261 |
| S.D. of intercept (Sa) | 7.014 | 6.715 |
| LOD, μg/mL | 0.0391 | 0.0400 |
| LOQ, μg/mL | 0.1035 | 0.1332 |
| Drug | Drug Taken, μg/mL | Recovery a, % | RSD,% | RE b, % | SE |
|---|---|---|---|---|---|
| ARP | 0.2 | 99.994 | 1.75 | −0.004 | 3.71 |
| 0.3 | 99.997 | 1.53 | −0.006 | 4.81 | |
| 0.4 | 99.989 | 1.67 | −0.004 | 3.97 | |
| CLZ | 0.2 | 99.968 | 2.21 | −0.004 | 3.75 |
| 0.3 | 99.989 | 1.49 | −0.007 | 3.04 | |
| 0.4 | 99.992 | 1.49 | −0.004 | 3.29 |
| Drug | Drug Taken, μg/mL | Recovery a, % | RSD, % | RE b, % | SE |
|---|---|---|---|---|---|
| ARP | 0.2 | 99.996 | 2.71 | −0.004 | 4.37 |
| 0.3 | 99.998 | 2.21 | −0.002 | 4.14 | |
| 0.4 | 99.994 | 2.12 | −0.006 | 4.28 | |
| CLZ | 0.2 | 99.998 | 2.28 | −0.002 | 3.39 |
| 0.3 | 99.996 | 2.28 | −0.004 | 3.72 | |
| 0.4 | 99.994 | 2.45 | −0.006 | 4.08 |
| Drug | Drug Formulation | Drug Taken μg/mL | Drug Found, μg/mL | Recovery a % | RSD, % | RE b, % |
|---|---|---|---|---|---|---|
| ARP | Aripiprex c, 10 mg/tab | 0.2 | 0.206 | 103 | 4.45 | 3.03 |
| 0.3 | 0.303 | 101 | 3.79 | 1.31 | ||
| 0.4 | 0.408 | 102 | 3.74 | 2.07 | ||
| CLZ | Clozapex d, 100 mg/tab | 0.2 | 0.199 | 99.9 | 2.44 | −0.05 |
| 0.3 | 0.299 | 99.9 | 2.75 | −0.05 | ||
| 0.4 | 0.395 | 98.9 | 2.37 | −1.06 |
Publisher’s Note: MDPI stays neutral with regard to jurisdictional claims in published maps and institutional affiliations. |
© 2022 by the authors. Licensee MDPI, Basel, Switzerland. This article is an open access article distributed under the terms and conditions of the Creative Commons Attribution (CC BY) license (https://creativecommons.org/licenses/by/4.0/).
Share and Cite
Hassan, H.M.A.; Alsohaimi, I.H.; El-Sayed, M.Y.; Ali, I.I.; El-Didamony, A.M.; Altaleb, H.A.; Alshammari, M.S. Selective Spectrofluorimetric Approach for the Assessment of Two Antipsychotic Drugs through Derivatization with O-Phthalaldehyde. Pharmaceuticals 2022, 15, 1174. https://doi.org/10.3390/ph15101174
Hassan HMA, Alsohaimi IH, El-Sayed MY, Ali II, El-Didamony AM, Altaleb HA, Alshammari MS. Selective Spectrofluorimetric Approach for the Assessment of Two Antipsychotic Drugs through Derivatization with O-Phthalaldehyde. Pharmaceuticals. 2022; 15(10):1174. https://doi.org/10.3390/ph15101174
Chicago/Turabian StyleHassan, Hassan M. A., Ibrahim H. Alsohaimi, Mohamed Y. El-Sayed, Ismail I. Ali, Akram M. El-Didamony, Hamud A. Altaleb, and Mutairah S. Alshammari. 2022. "Selective Spectrofluorimetric Approach for the Assessment of Two Antipsychotic Drugs through Derivatization with O-Phthalaldehyde" Pharmaceuticals 15, no. 10: 1174. https://doi.org/10.3390/ph15101174
APA StyleHassan, H. M. A., Alsohaimi, I. H., El-Sayed, M. Y., Ali, I. I., El-Didamony, A. M., Altaleb, H. A., & Alshammari, M. S. (2022). Selective Spectrofluorimetric Approach for the Assessment of Two Antipsychotic Drugs through Derivatization with O-Phthalaldehyde. Pharmaceuticals, 15(10), 1174. https://doi.org/10.3390/ph15101174