Author Contributions
Conceptualization, M.Z. and M.A. (Mahmood Ahmad); methodology, R.R. and M.Z.; software, R.R. and M.H.B.; validation, M.A.K., A.S. and R.M.S.; formal analysis, R.R.; investigation, R.R. and M.H.B.; resources, M.A.K. and M.A. (Mahmood Ahmad); data curation, R.R. and M.A. (Meshal Alshamrani); writing—original draft preparation, R.R., M.H.B. and M.A. (Meshal Alshamrani); writing—review and editing, M.Z., A.S., Y.A. and R.M.S.; visualization, M.A.K.; supervision, M.Z.; project administration, M.Z.; funding acquisition, A.S. and Y.A. All authors have read and agreed to the published version of the manuscript.
Figure 1.
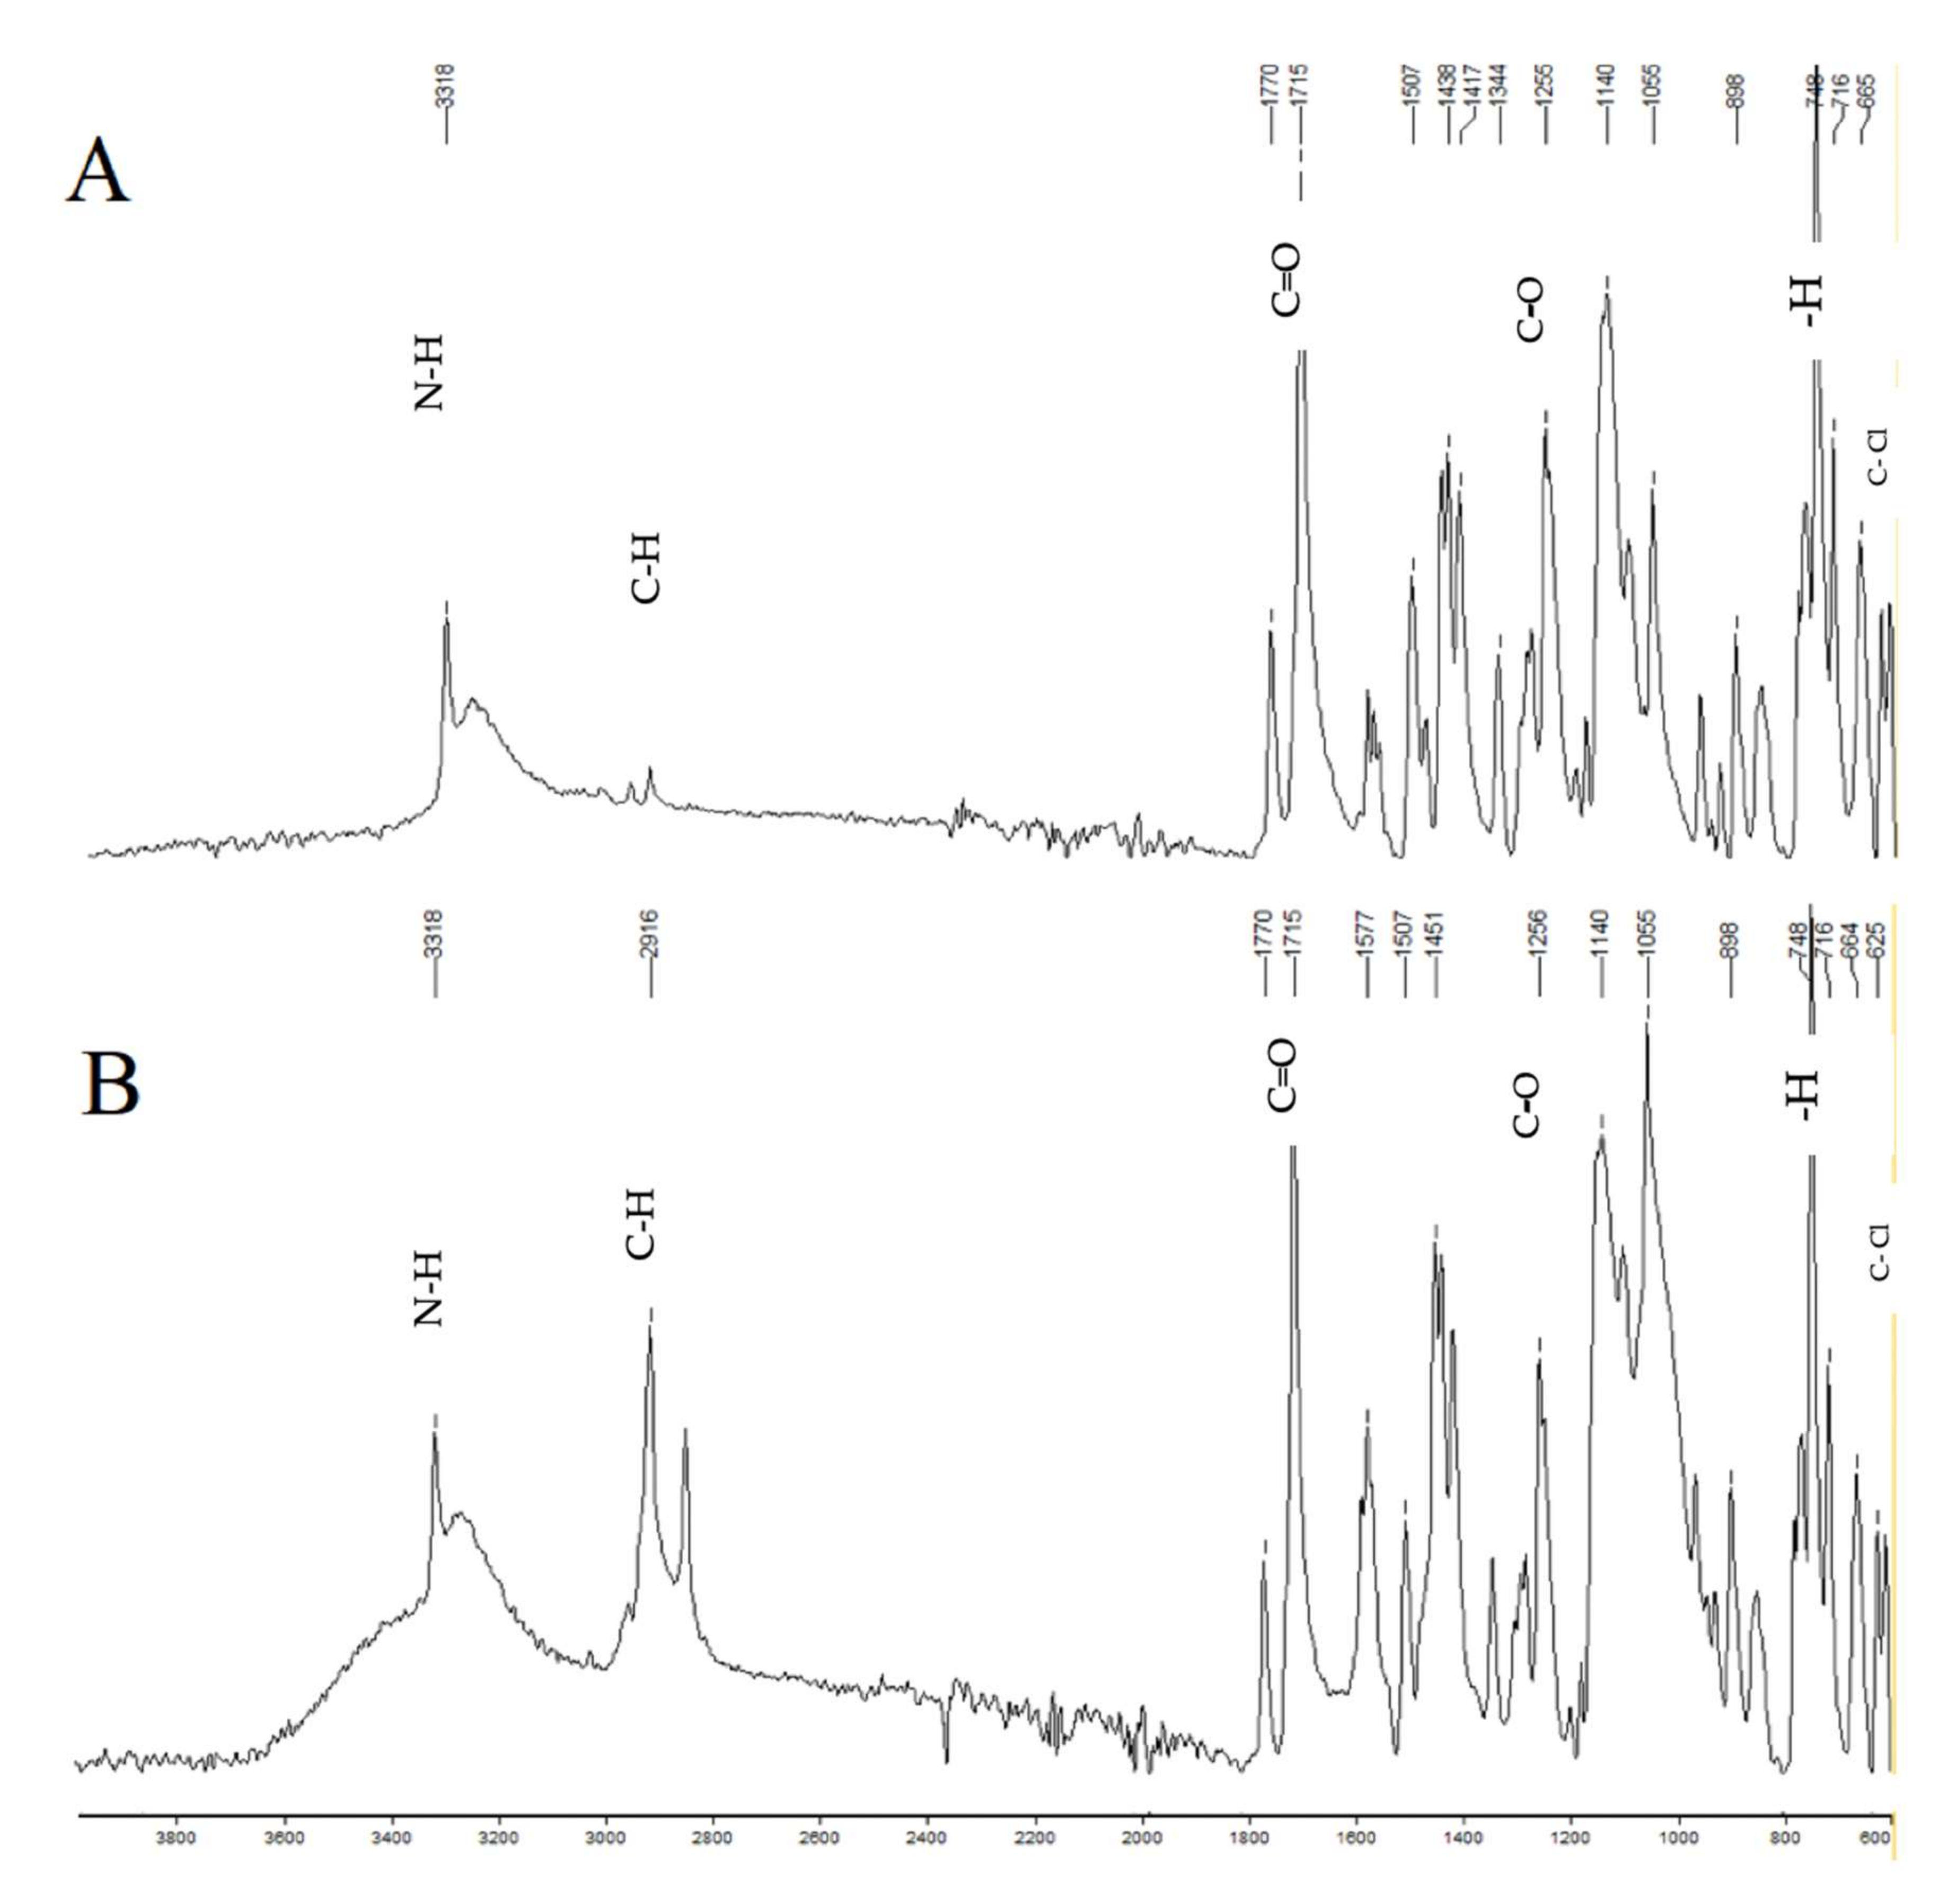
FTIR of aceclofenac (A) and press-coated tablet with HPMC E5 (B). The characteristic peaks of the aceclofenac spectrum are 1715, which shows C=O stretching; 1255, which shows C-O stretching; 3318, which shows N-H stretching; 2937, which shows C-H stretching; 748, which shows aromatic—H stretching; and 610, which shows C-Cl stretching.
Figure 1.
FTIR of aceclofenac (A) and press-coated tablet with HPMC E5 (B). The characteristic peaks of the aceclofenac spectrum are 1715, which shows C=O stretching; 1255, which shows C-O stretching; 3318, which shows N-H stretching; 2937, which shows C-H stretching; 748, which shows aromatic—H stretching; and 610, which shows C-Cl stretching.
Figure 2.
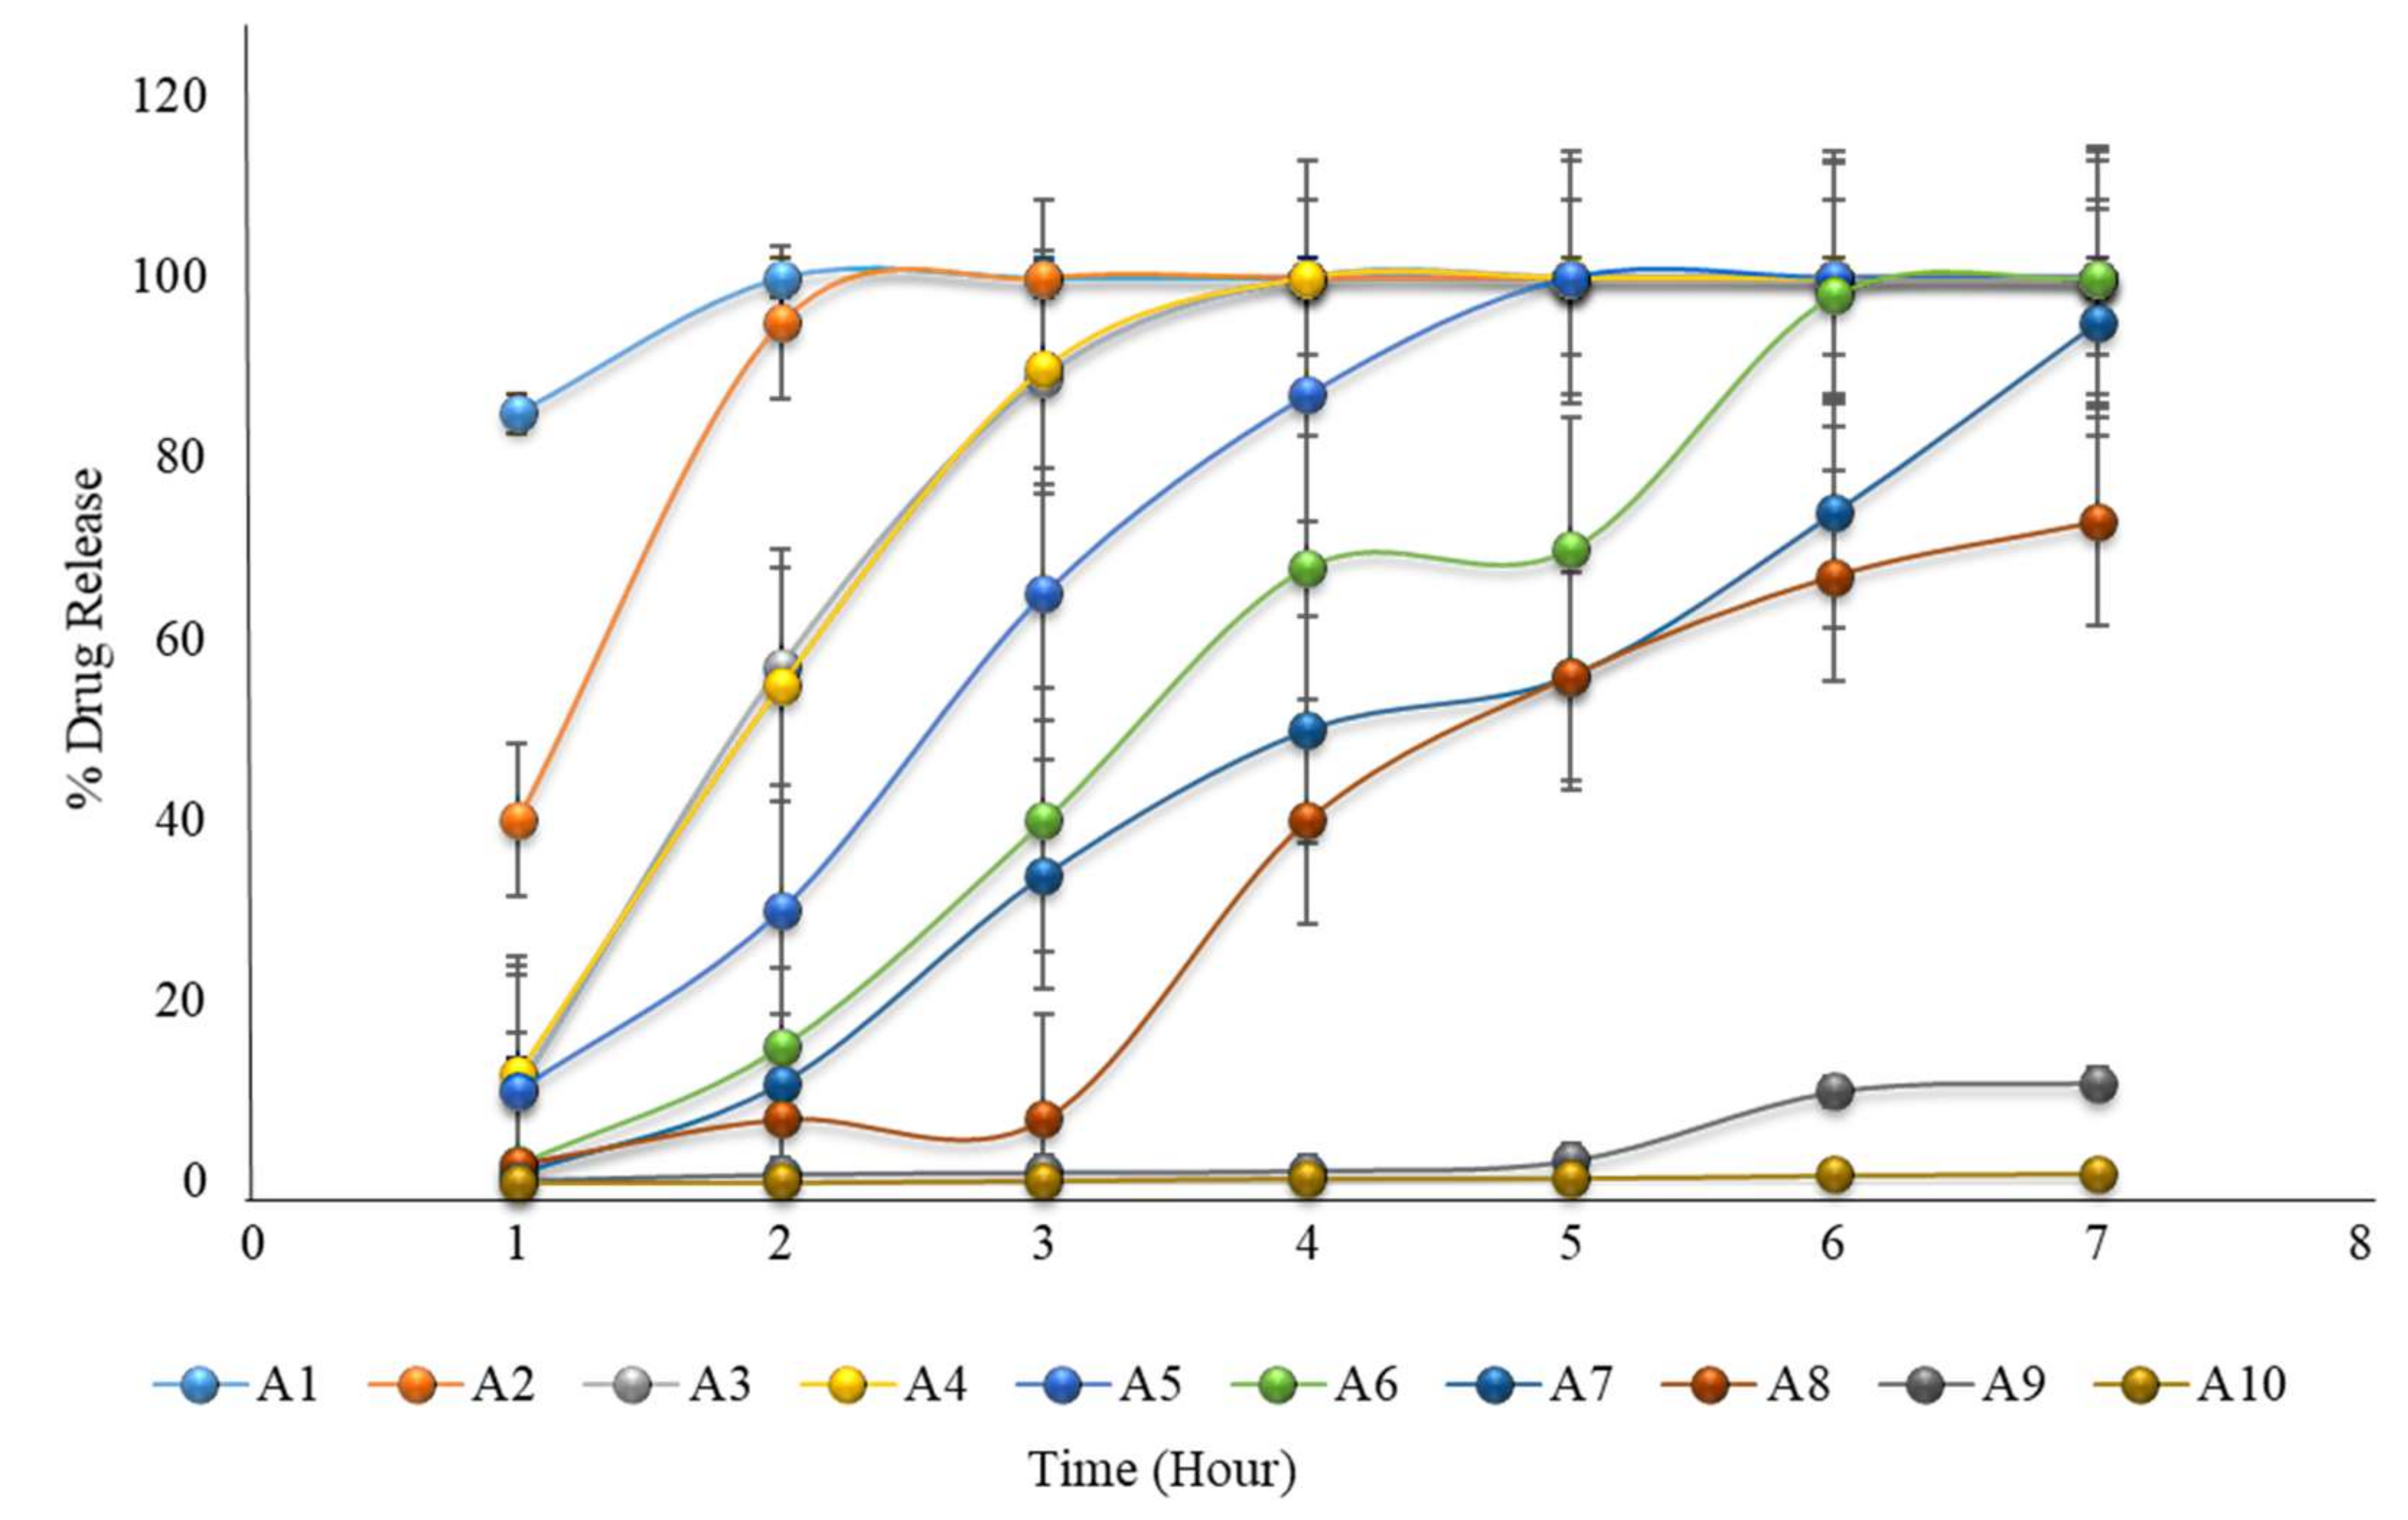
The in vitro dissolution of formulations A1 to A10 (the first 2 h in an acidic medium of pH 1.2, and then in a phosphate buffer medium of pH 6.8) showing that none of the formulations met the expected criteria for pulsatile drug release.
Figure 2.
The in vitro dissolution of formulations A1 to A10 (the first 2 h in an acidic medium of pH 1.2, and then in a phosphate buffer medium of pH 6.8) showing that none of the formulations met the expected criteria for pulsatile drug release.
Figure 3.
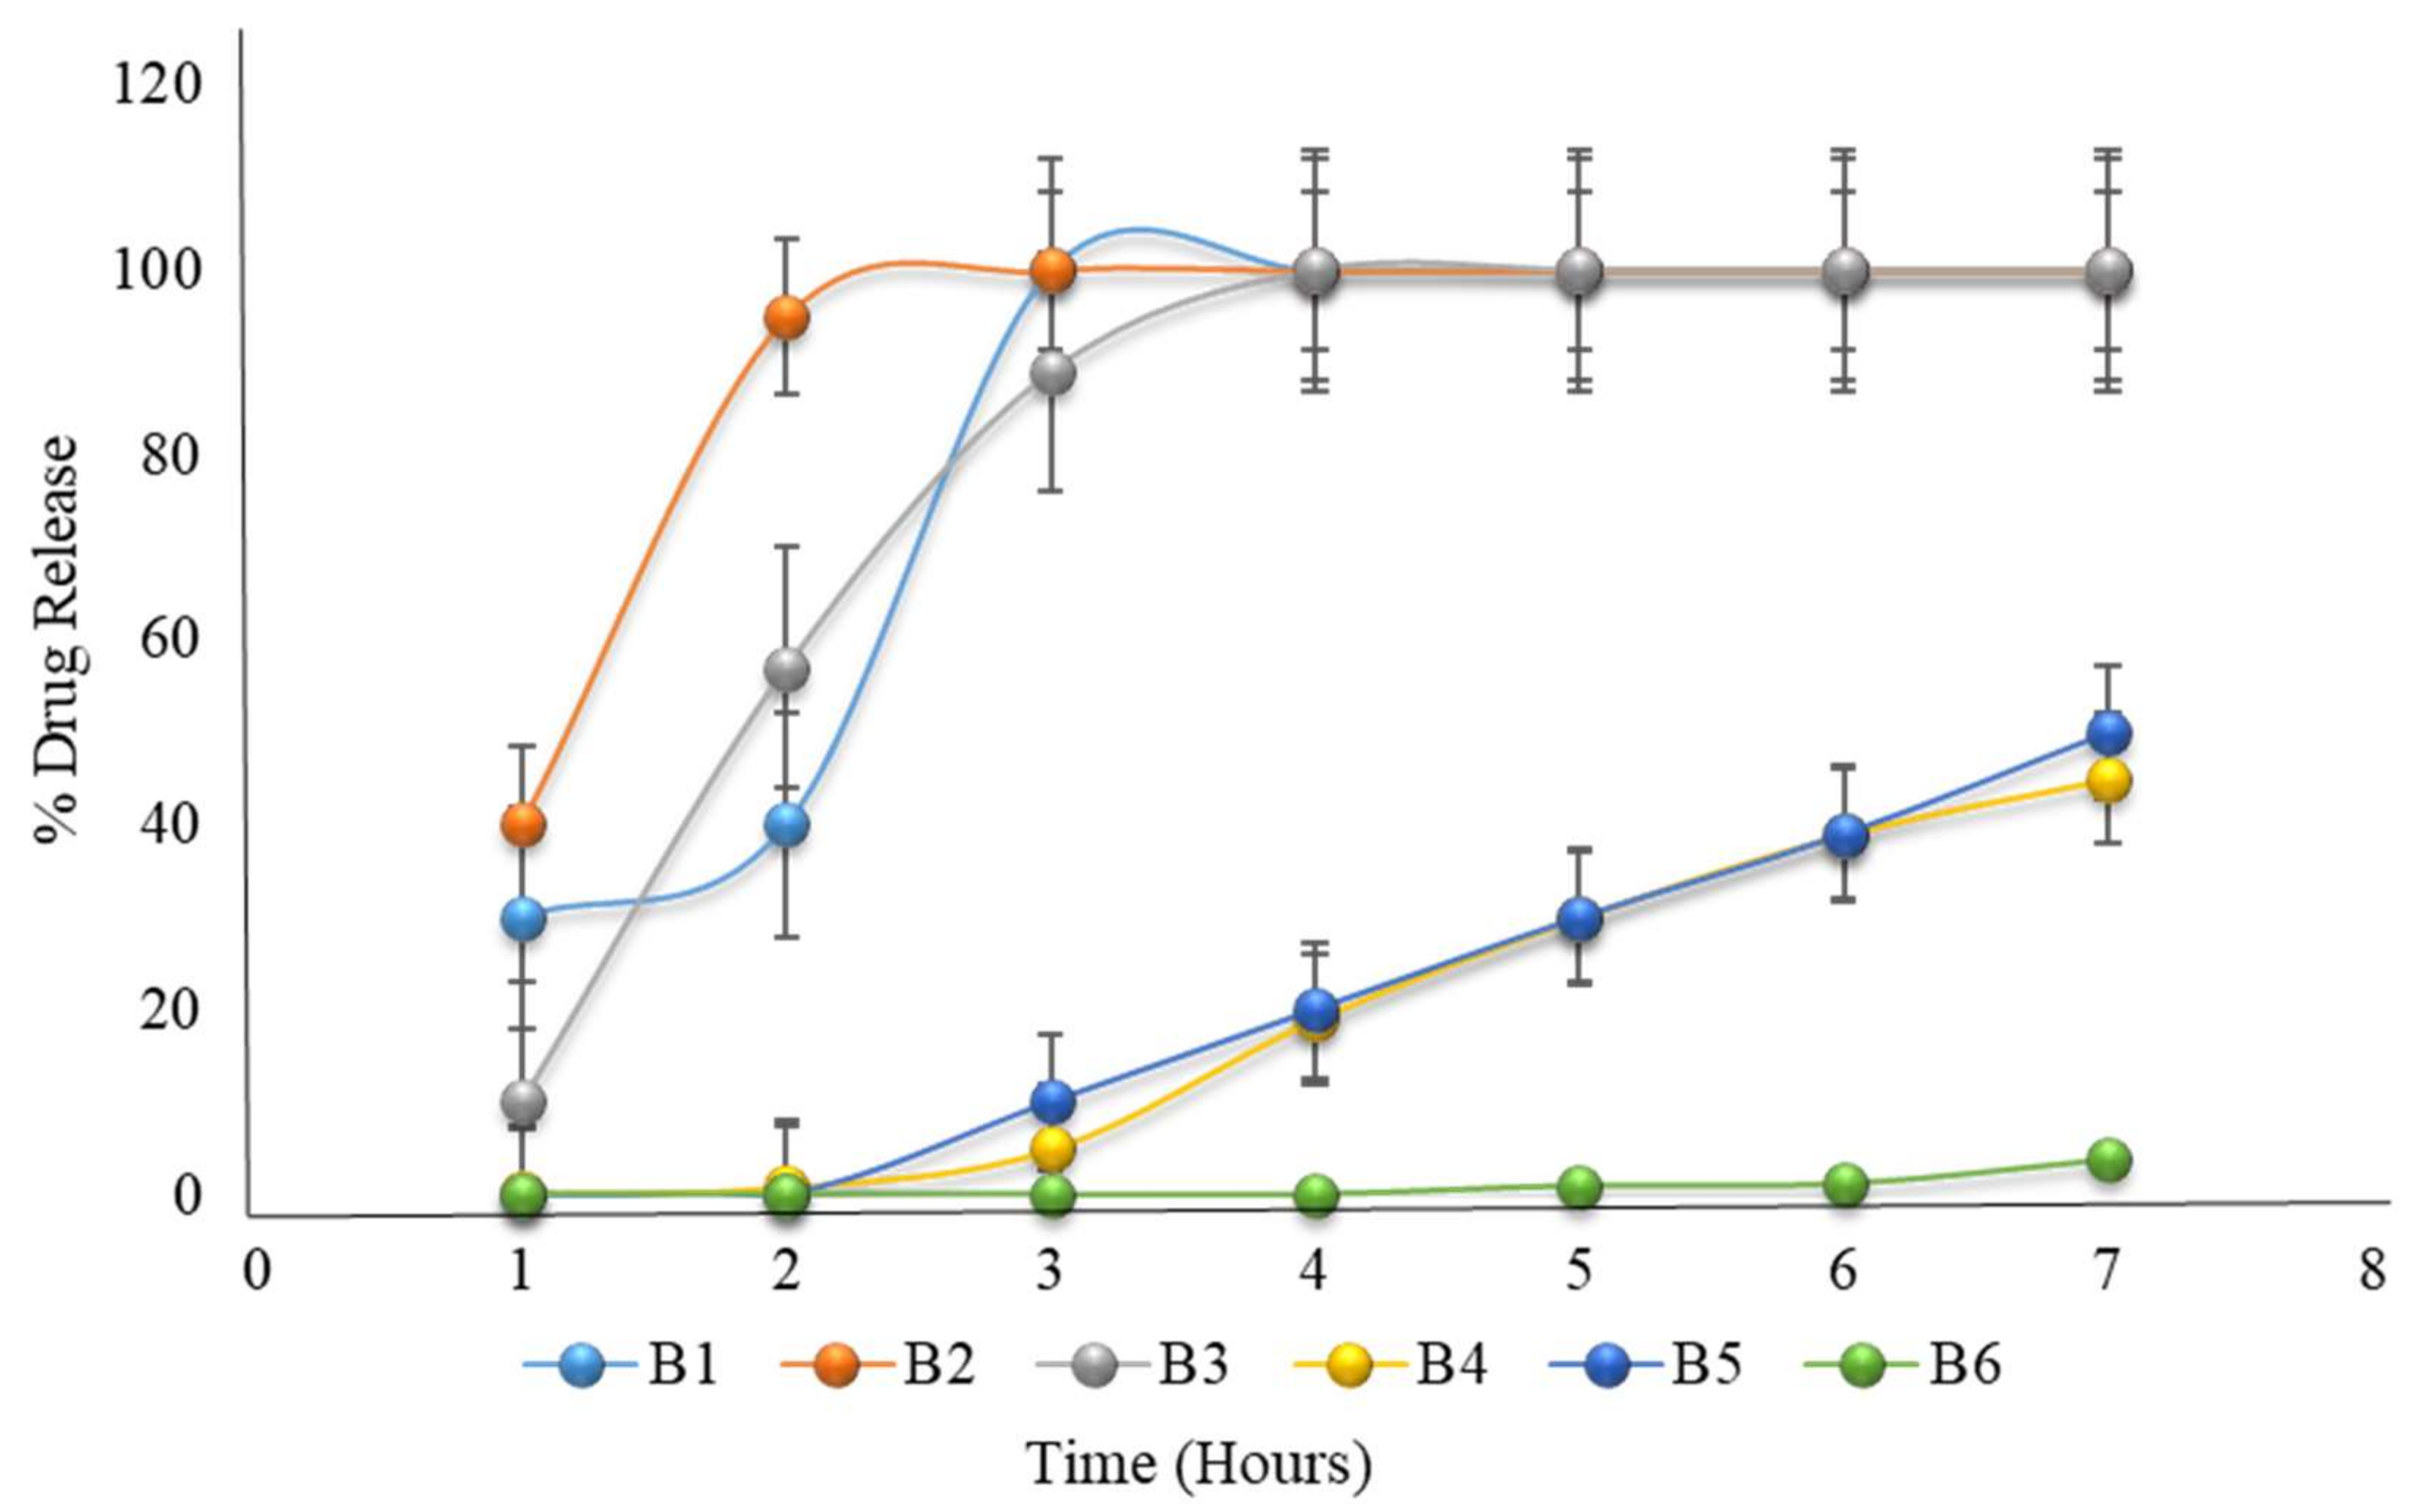
The in vitro dissolution of formulations B1 to B6 (the first 2 h in an acidic medium of pH 1.2, then in a phosphate buffer medium of pH 6.8) mimicked that of the formulations B1 to B3, which had 100% drug release, though formulations B4 to B6 failed to completely release before 6 h.
Figure 3.
The in vitro dissolution of formulations B1 to B6 (the first 2 h in an acidic medium of pH 1.2, then in a phosphate buffer medium of pH 6.8) mimicked that of the formulations B1 to B3, which had 100% drug release, though formulations B4 to B6 failed to completely release before 6 h.
Figure 4.
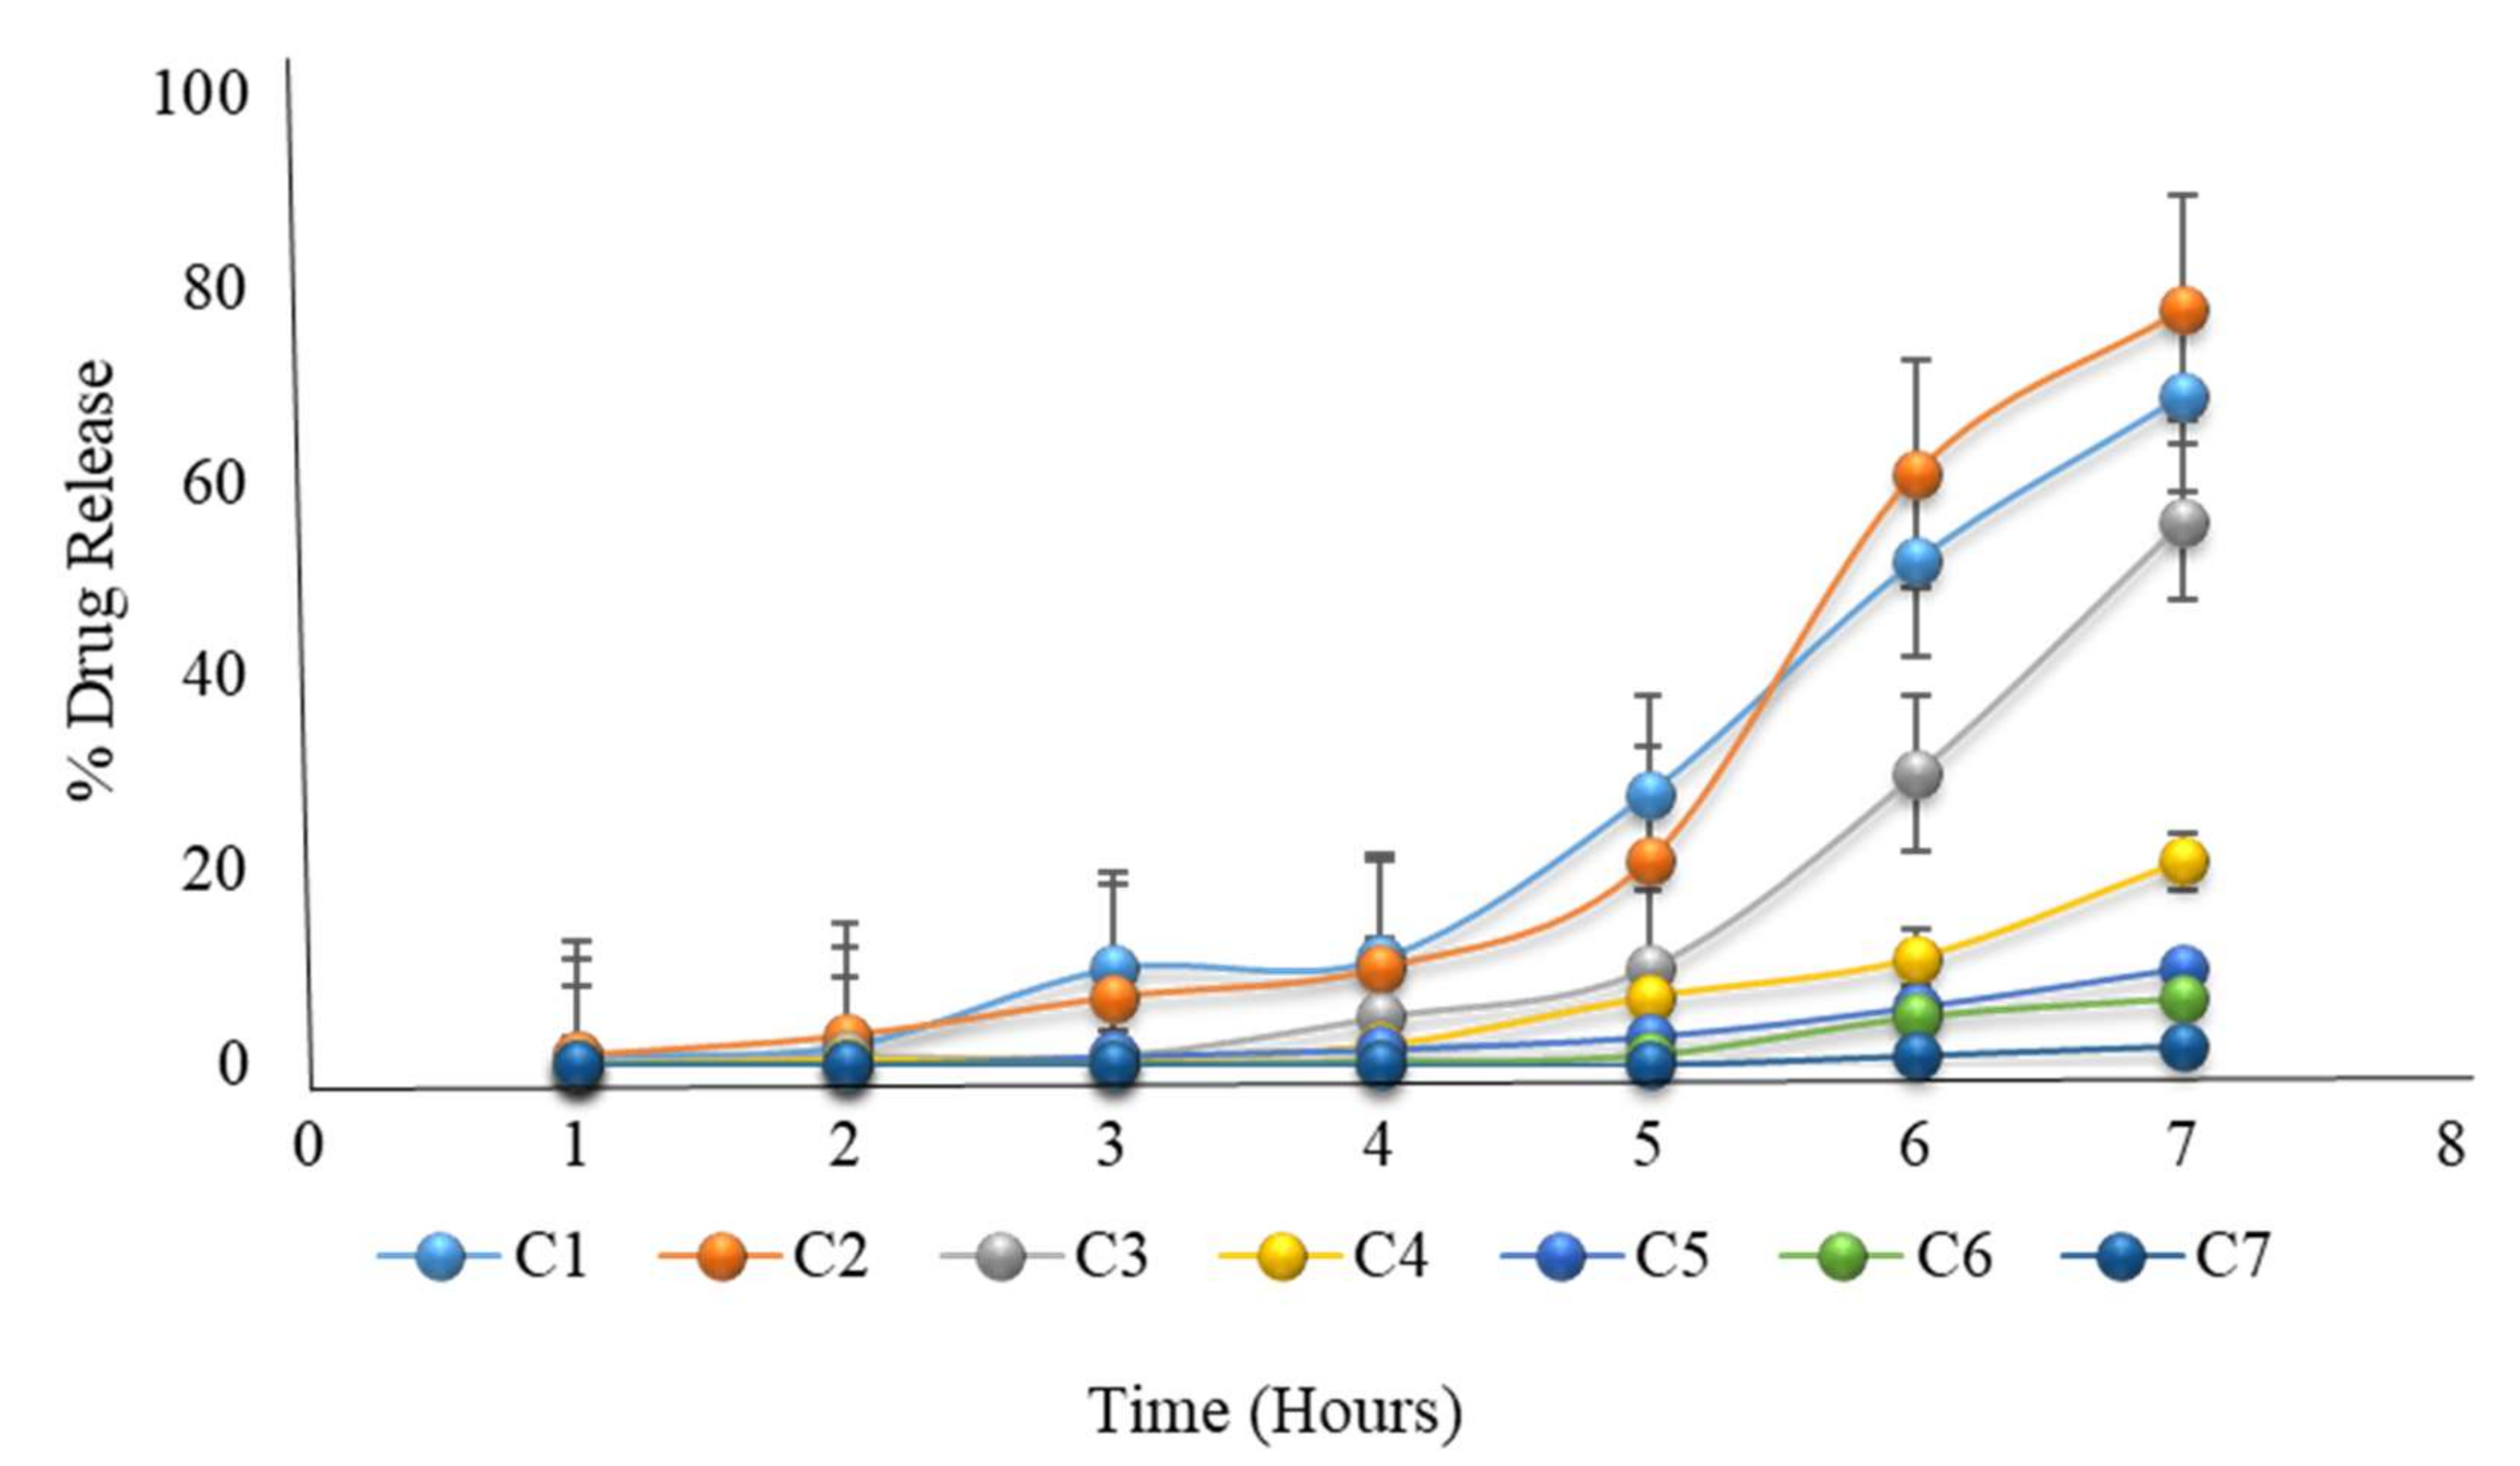
The in vitro dissolution of formulations C1 to C7 (the first 2 h in an acid medium of pH 1.2, and then in a phosphate buffer medium of pH 6.8) showing that all formulations failed to release the drug even after 6 h.
Figure 4.
The in vitro dissolution of formulations C1 to C7 (the first 2 h in an acid medium of pH 1.2, and then in a phosphate buffer medium of pH 6.8) showing that all formulations failed to release the drug even after 6 h.
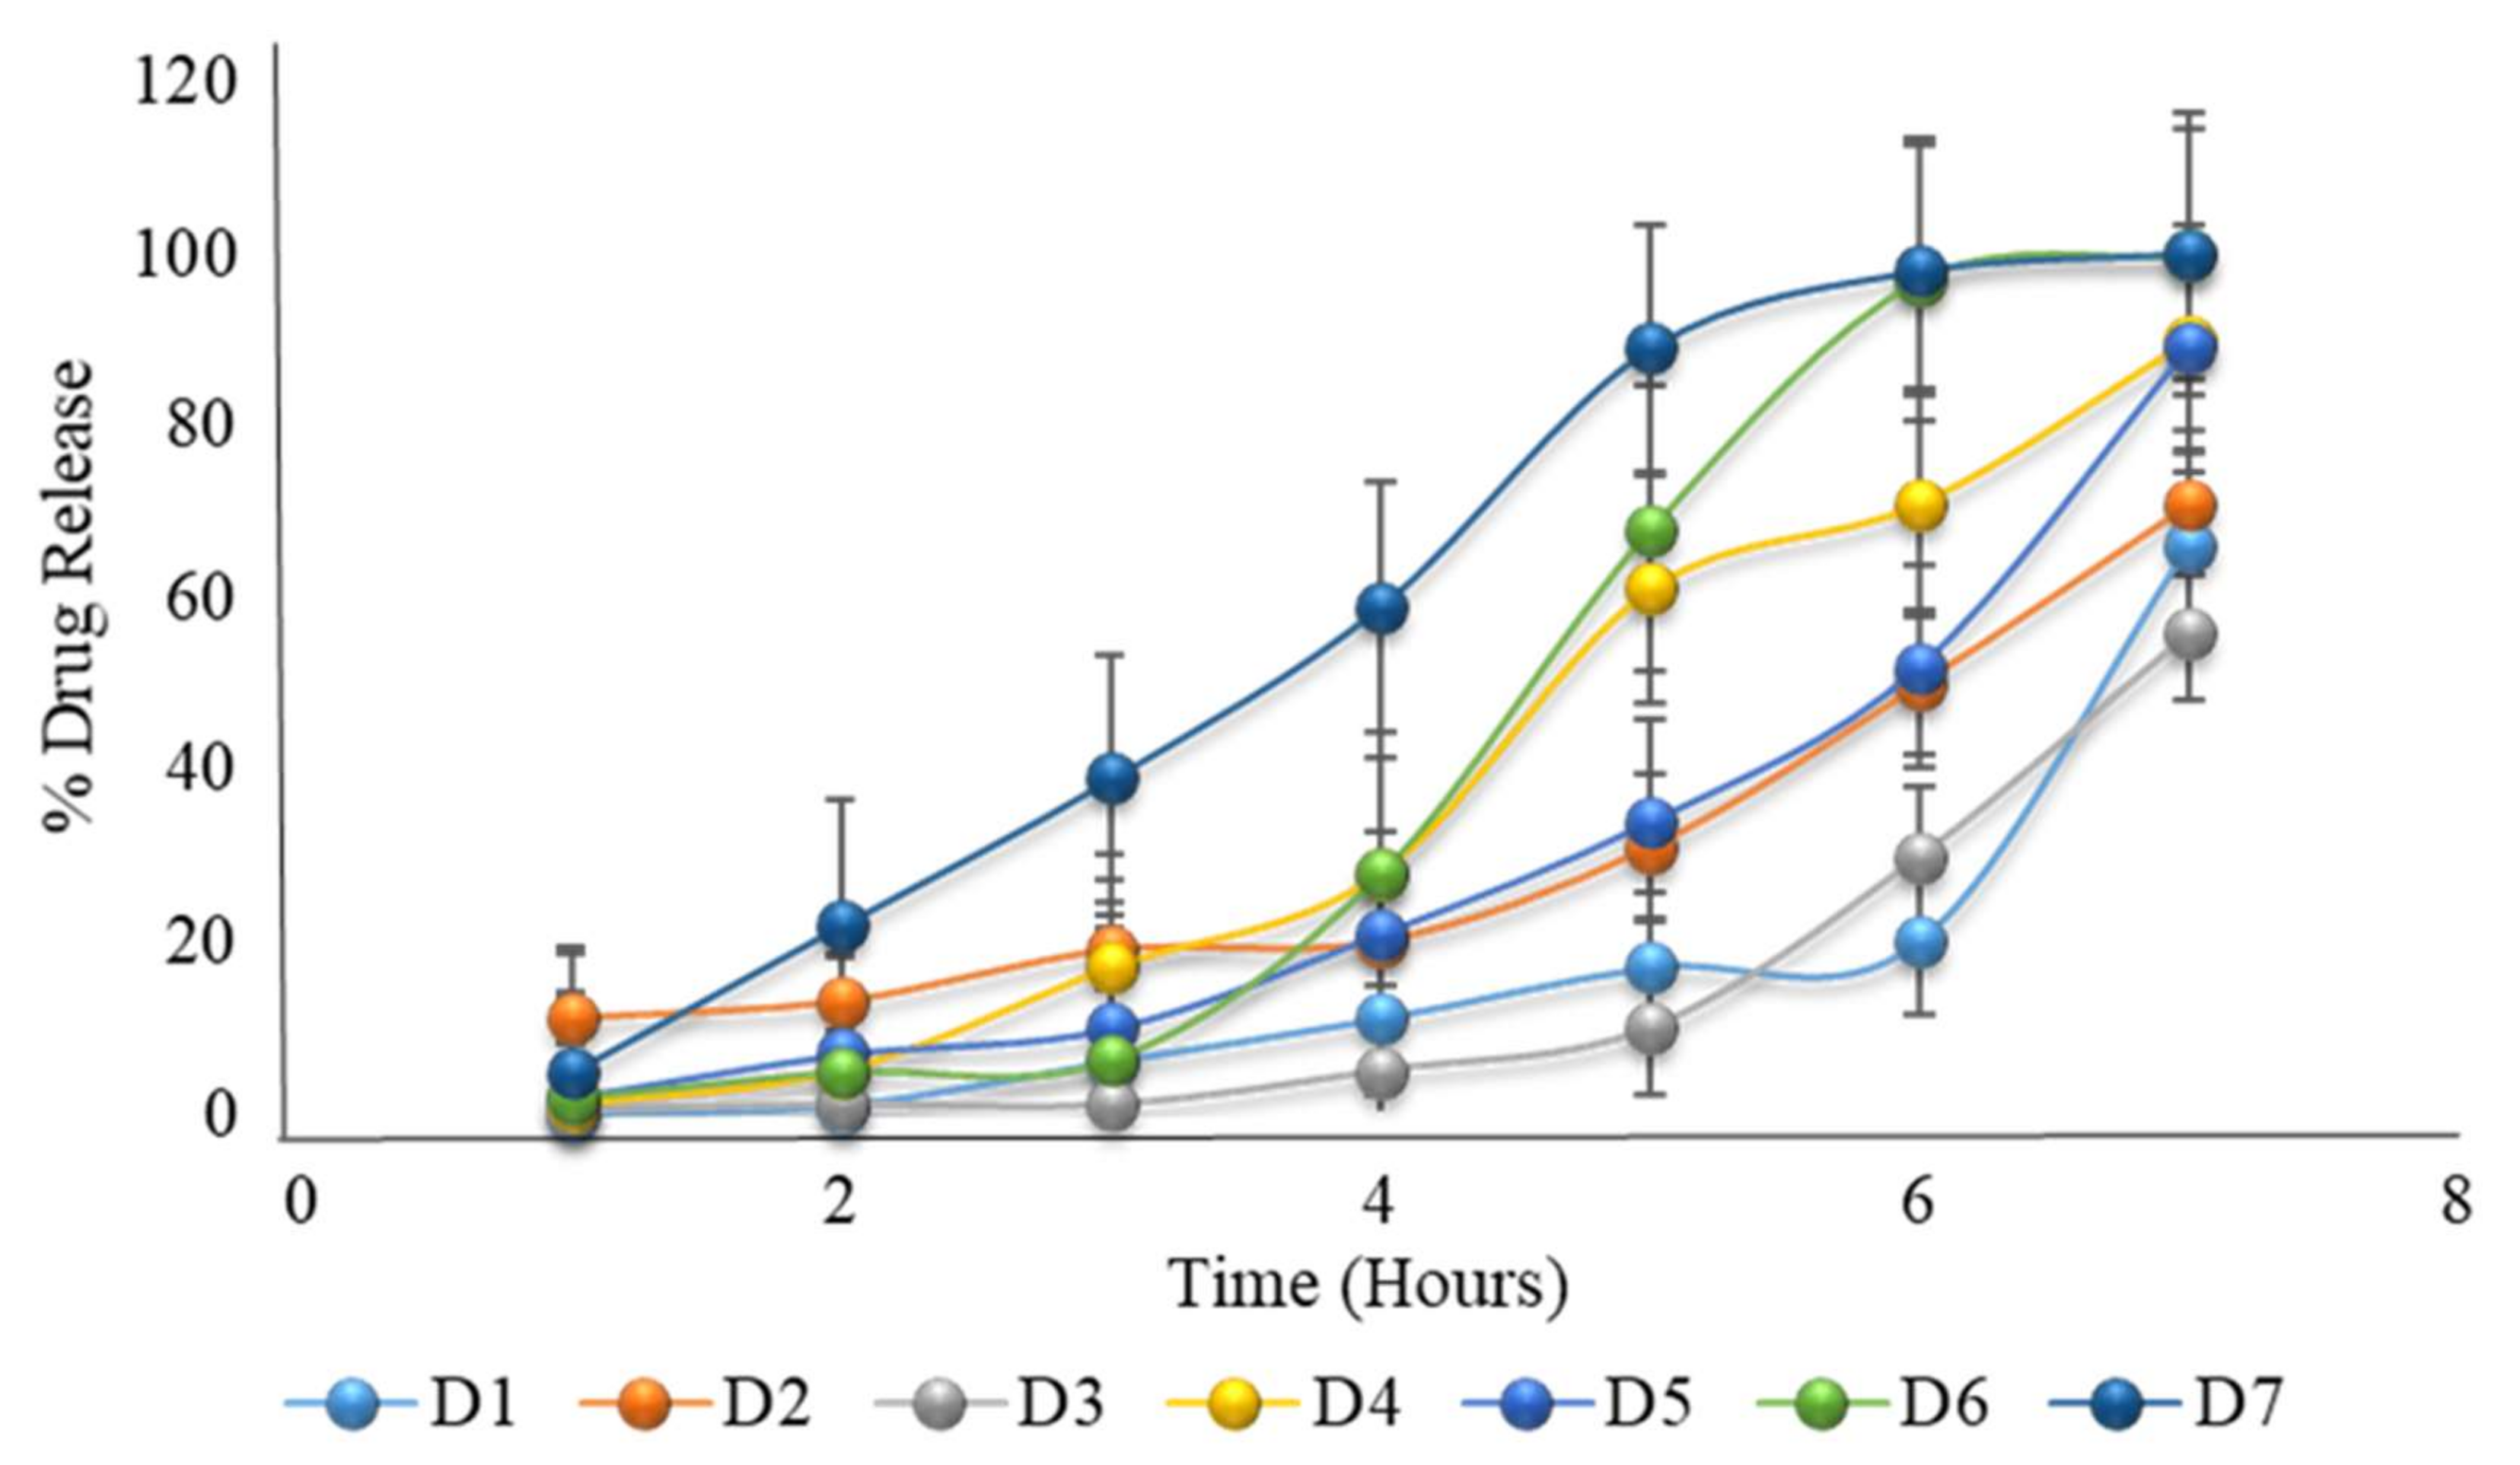
Figure 5.
The in vitro dissolution of formulation D1 to D7 (the first 2 h in an acid medium of pH 1.2, and then in a phosphate buffer medium of pH 6.8) showing the desired drug release after a delay time of 5 to 6 h.
Figure 5.
The in vitro dissolution of formulation D1 to D7 (the first 2 h in an acid medium of pH 1.2, and then in a phosphate buffer medium of pH 6.8) showing the desired drug release after a delay time of 5 to 6 h.
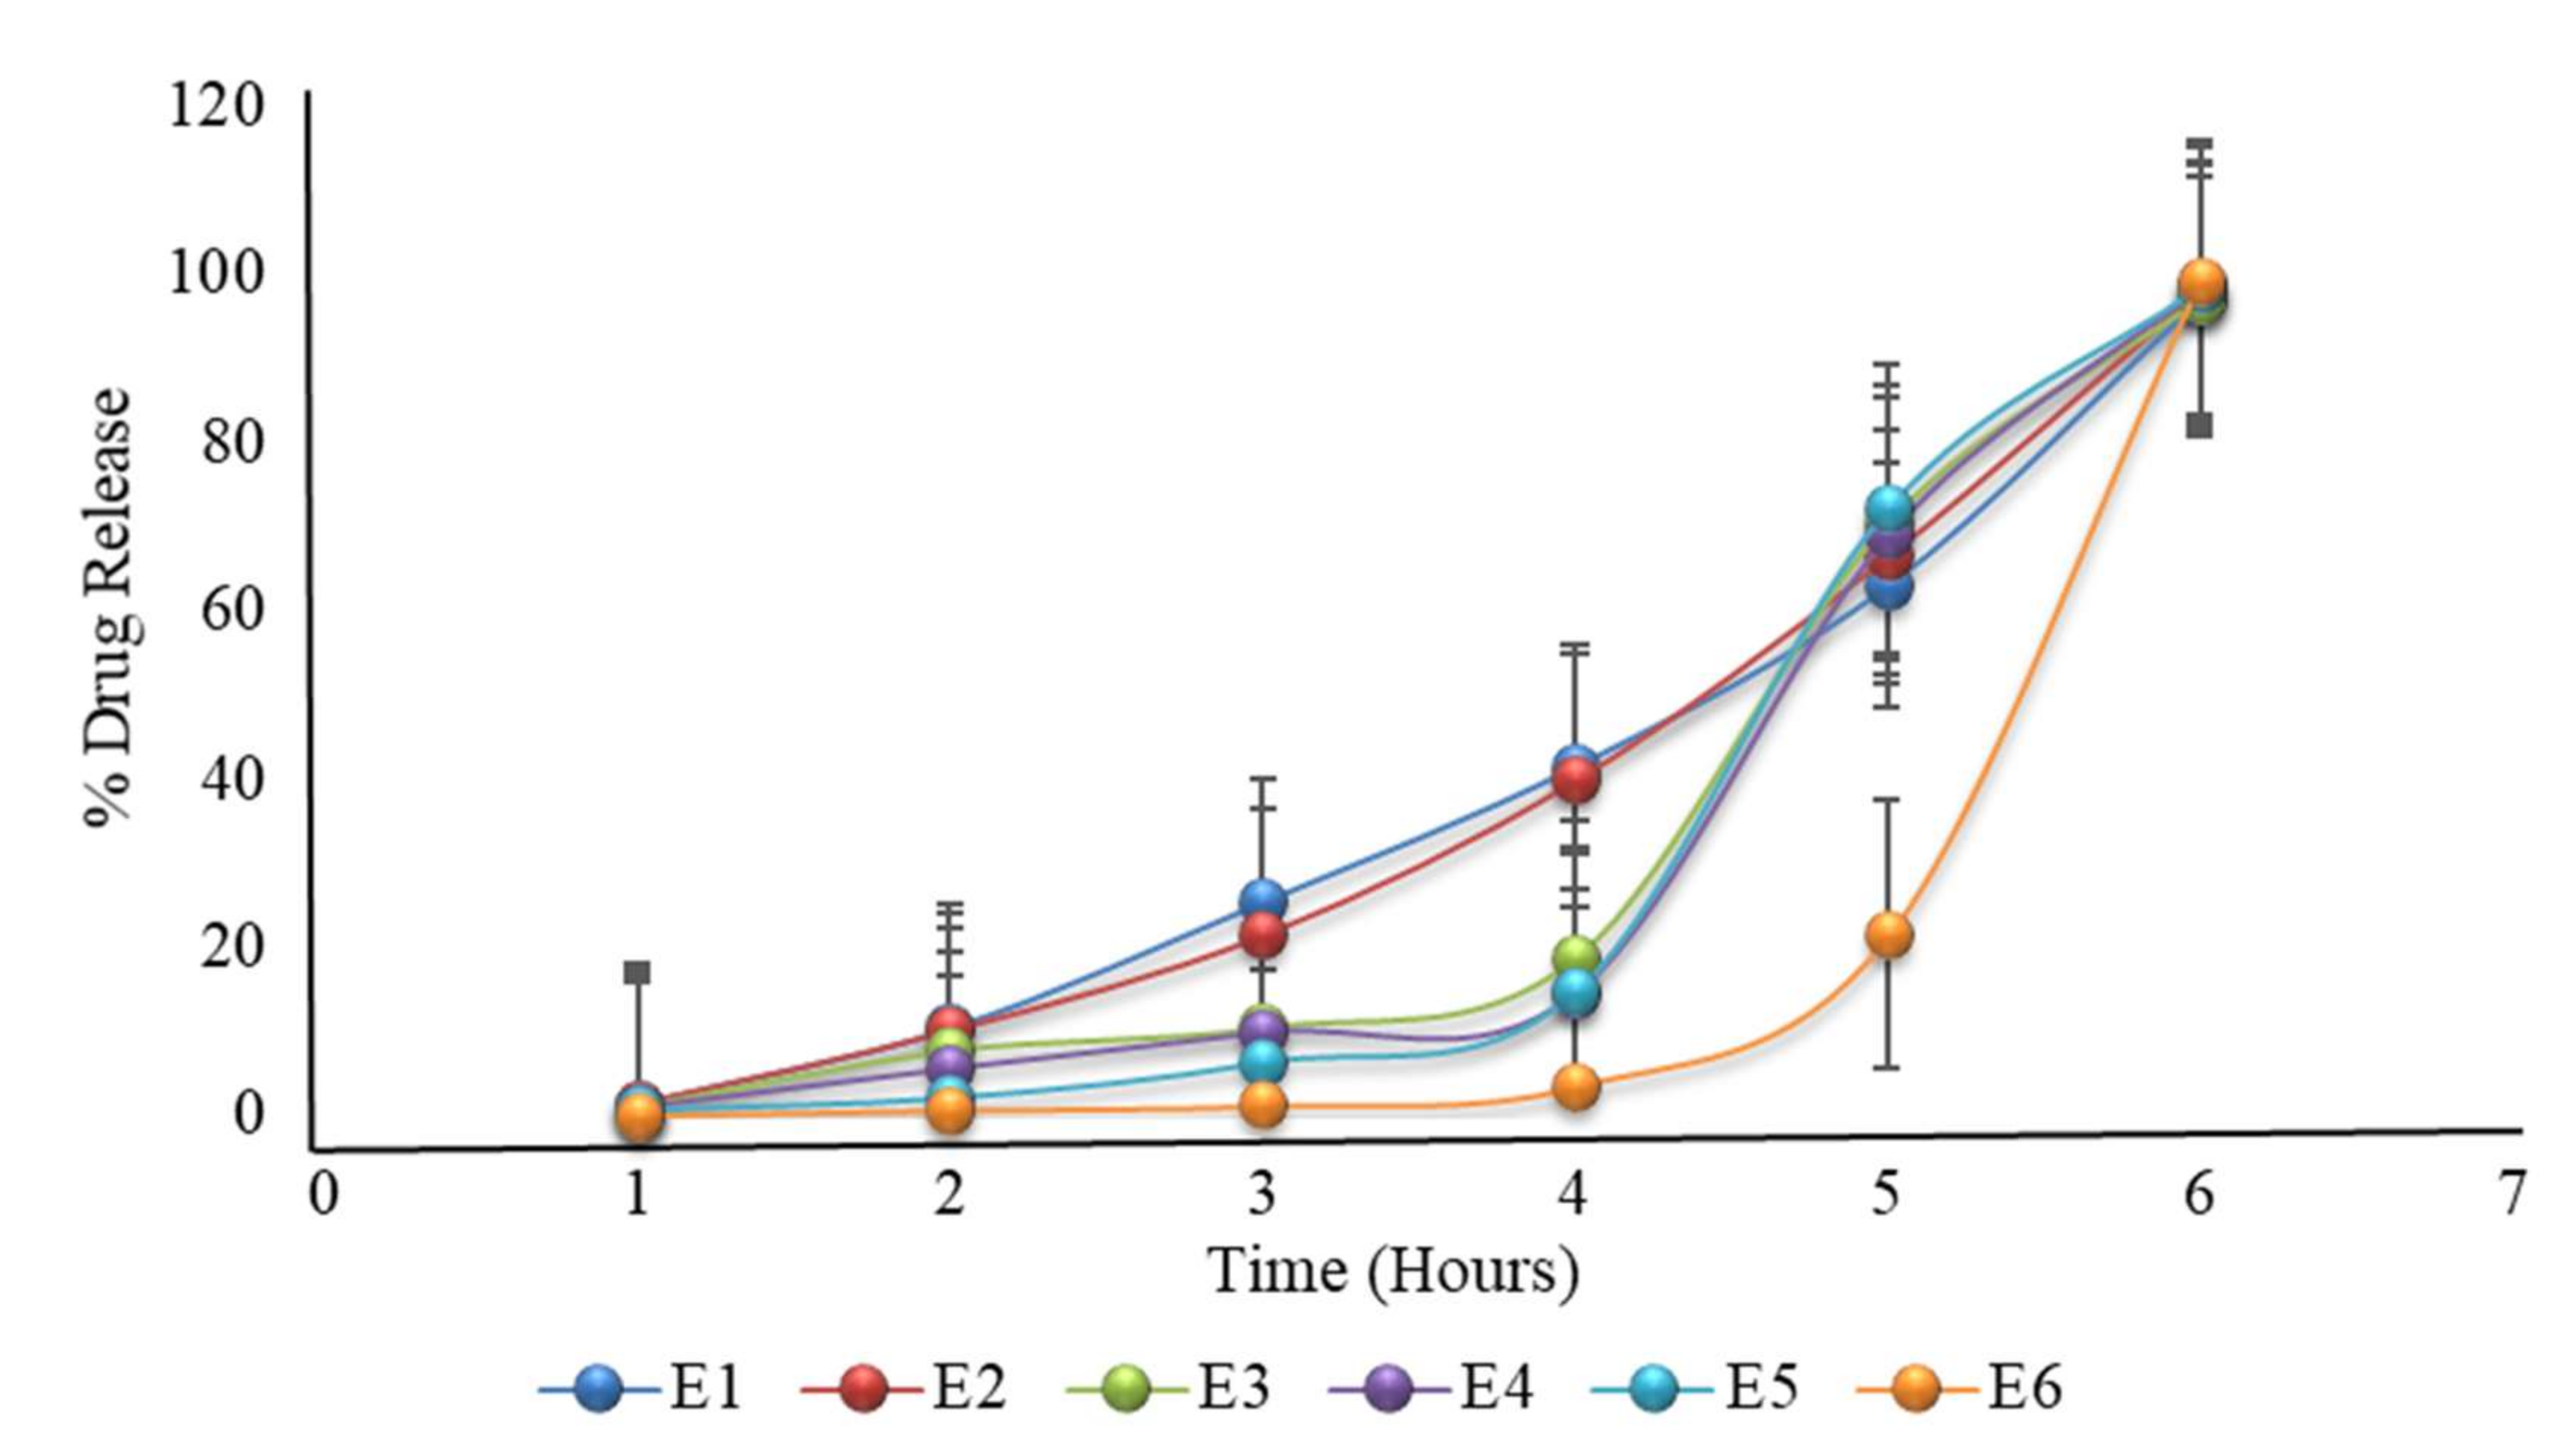
Figure 6.
The in vitro dissolution of formulation E1 to E6 (the first 2 h in an acidic medium of pH 1.2, then in a phosphate buffer medium of pH 6.8) prepared after modifying the formulation of D6. The E6 formulation showed promising drug release, as required.
Figure 6.
The in vitro dissolution of formulation E1 to E6 (the first 2 h in an acidic medium of pH 1.2, then in a phosphate buffer medium of pH 6.8) prepared after modifying the formulation of D6. The E6 formulation showed promising drug release, as required.
Table 1.
The characterization of aceclofenac.
Table 1.
The characterization of aceclofenac.
| Description | Specification | Observation |
|---|
| Appearance | A white or off-white
crystalline powder | Off-white
crystalline powder |
| Identification | FTIR | Complies |
| Appearance of solution | Not more turbid than standard | Complies |
| Loss on drying | ≤0.5% | 0.2% |
| Melting point | 149–151 °C | 151 °C |
| Assay | 99.0–101.0% | 100.1% |
Table 2.
The pre-compression tests of the core tablets (F1 to F3).
Table 2.
The pre-compression tests of the core tablets (F1 to F3).
| Formulation | F1 | F2 | F3 |
|---|
| Bulk Density (gm/cm3) | 0.55 ± 0.015 | 0.56 ± 0.02 | 0.56 ± 0.005 |
| Tapped Density (gm/cm3) | 0.60 ± 0.017 | 0.62 ± 0.05 | 0.61 ± 0.009 |
| Angle of Repose (θ) | 27 ± 0.01 | 27 ± 0.20 | 28 ± 0.02 |
| Carr’s Index (%) | 8.3 ± 0.012 | 9.67 ± 0.04 | 8.19 ± 0.05 |
| Hausner’s Ratio | 1.09 ± 0.02 | 1.11 ± 0.02 | 1.10 ± 0.03 |
Table 3.
Characterization of the post-compression core tablets (F1 to F3).
Table 3.
Characterization of the post-compression core tablets (F1 to F3).
| Formulation | F1 | F2 | F3 |
|---|
| Diameter (mm) | 9.01 ± 0.01 | 9.00 ± 0.01 | 9.01 ± 0.01 |
| Thickness (mm) | 2.91 ± 0.02 | 2.96 ± 0.01 | 2.92 ± 0.011 |
| Hardness (kp) | 5.3 ± 0.17 | 5.56 ± 0.05 | 5.53 ± 0.05 |
| Average weight (mg) | 150.15 ± 1.53 | 150.1 ± 1.41 | 150.15 ± 0.81 |
| Friability (%) | 0.5 ± 0.01 | 0.2 ± 0.01 | 0.2 ± 0.01 |
| Assay (%) | 99.92 ± 0.04 | 99.94 ± 0.13 | 99.98 ± 0.01 |
| Content uniformity (%) | 99.87 ± 0.06 | 101.25 ± 0.07 | 99.97 ± 0.02 |
| Dissolution (%) | 98.91 ± 0.15 | 98.9 ± 0.14 | 99.95 ± 0.03 |
Table 4.
Physical characteristics of the press-coated formulations.
Table 4.
Physical characteristics of the press-coated formulations.
| Formulation | Thickness (mm) | Hardness (kp) | Average Weight (mg) | Friability (%) |
|---|
| A1 | 4.38 ± 0.05 | 13.4 ± 0.02 | 502 ± 0.5 | 0.6 ± 0.01 |
| A2 | 4.42 ± 0.07 | 11.8 ± 0.03 | 499 ± 1.1 | 0.6 ± 0.01 |
| A3 | 4.41 ± 0.08 | 13.1 ± 0.06 | 500 ± 0.7 | 0.5 ± 0.02 |
| A4 | 4.50 ± 0.06 | 11.4 ± 0.04 | 501 ± 1.0 | 0.7 ± 0.01 |
| A5 | 4.25 ± 0.11 | 10.1 ± 0.03 | 501 ± 0.4 | 0.4 ± 0.03 |
| A6 | 4.10 ± 0.07 | 12.5 ± 0.01 | 498 ± 0.07 | 0.4 ± 0.02 |
| A7 | 4.27 ± 0.04 | 12.0 ± 0.05 | 499 ± 0.13 | 0.6 ± 0.01 |
| A8 | 4.27 ± 0.05 | 13.7 ± 0.04 | 502 ± 0.6 | 0.6 ± 0.01 |
| A9 | 4.34 ± 0.07 | 13.2 ± 0.04 | 501 ± 0.09 | 0.6 ± 0.01 |
| A10 | 4.55 ± 0.04 | 13.5 ± 0.07 | 503 ± 0.5 | 0.4 ± 0.01 |
| B1 | 4.41 ± 0.02 | 12.1 ± 0.06 | 499 ± 0.42 | 0.5 ± 0.01 |
| B2 | 4.11 ± 0.04 | 12.3 ± 0.05 | 499 ± 0.33 | 0.4 ± 0.02 |
| B3 | 4.47 ± 0.03 | 11.7 ± 0.04 | 501 ± 0.09 | 0.5 ± 0.01 |
| B4 | 4.44 ± 0.03 | 11.5 ± 0.02 | 502 ± 0.11 | 0.7 ± 0.01 |
| B5 | 4.52 ± 0.02 | 11.7 ± 0.04 | 501 ± 0.09 | 0.6 ± 0.01 |
| B6 | 5.45 ± 0.01 | 12.0 ± 0.03 | 498 ± 0.11 | 0.5 ± 0.03 |
| C1 | 4.34 ± 0.01 | 12.4 ± 0.08 | 501 ± 0.13 | 0.5 ± 0.02 |
| C2 | 4.38 ± 0.04 | 13.0 ± 0.12 | 498 ± 1.2 | 0.4 ± 0.03 |
| C3 | 4.42 ± 0.02 | 13.5 ± 0.04 | 500 ± 0.8 | 0.3 ± 0.02 |
| C4 | 4.40 ± 0.05 | 12.7 ± 0.06 | 502 ± 0.17 | 0.6 ± 0.01 |
| C5 | 4.51 ± 0.08 | 11.4 ± 0.06 | 502 ± 1.1 | 0.7 ± 0.01 |
| C6 | 4.49 ± 0.04 | 12.2 ± 0.05 | 499 ± 0.7 | 0.6 ± 0.01 |
| C7 | 4.33 ± 0.07 | 12.5 ± 0.08 | 497 ± 0.14 | 0.5 ± 0.02 |
| D1 | 4.41 ± 0.06 | 12.3 ± 0.08 | 498 ± 0.14 | 0.5 ± 0.02 |
| D2 | 4.5 ± 0.02 | 12.4 ± 0.10 | 501 ± 0.11 | 0.4 ± 0.03 |
| D3 | 4.4 ± 0.02 | 13.4 ± 0.06 | 499 ± 0.09 | 0.6 ± 0.01 |
| D4 | 4.38 ± 0.05 | 11.7 ± 0.09 | 502 ± 0.17 | 0.5 ± 0.01 |
| D5 | 4.42 ± 0.01 | 11.9 ± 0.05 | 501 ± 0.14 | 0.6 ± 0.01 |
| D6 | 4.53 ± 0.04 | 12.5 ± 0.06 | 501 ± 0.09 | 0.5 ± 0.02 |
| D7 | 4.37 ± 0.02 | 12.4 ± 0.09 | 502 ± 1.1 | 0.4 ± 0.01 |
| E1 | 4.29 ± 0.02 | 11.7 ± 0.06 | 473 ± 0.14 | 0.7 ± 0.01 |
| E2 | 4.42 ± 0.04 | 12.4 ± 0.11 | 501 ± 0.23 | 0.6 ± 0.01 |
| E3 | 4.59 ± 0.01 | 12.8 ± 0.09 | 524 ± 0.18 | 0.0.7 ± 0.01 |
| E4 | 4.77 ± 0.01 | 13.1 ± 0.08 | 552 ± 0.09 | 0.5 ± 0.02 |
| E5 | 4.87 ± 0.03 | 13.7 ± 0.06 | 574 ± 0.11 | 0.5 ± 0.02 |
| E6 | 5.08 ± 0.03 | 14 ± 0.06 | 602 ± 0.14 | 0.5 ± 0.01 |
Table 5.
The in vitro dissolution of formulations A1 to A10 (the first 2 h in an acidic medium of pH 1.2, then in a phosphate buffer medium of pH 6.8).
Table 5.
The in vitro dissolution of formulations A1 to A10 (the first 2 h in an acidic medium of pH 1.2, then in a phosphate buffer medium of pH 6.8).
| Time | Percent Drug Release (%) |
|---|
| Hour | A1 | A2 | A3 | A4 | A5 | A6 | A7 | A8 | A9 | A10 |
|---|
| 1 | 85 | 40 | 10 | 12 | 10 | 2 | 1 | 2 | 0.2 | 0.01 |
| 2 | 100 | 95 | 57 | 55 | 30 | 15 | 11 | 7 | 0.9 | 0.04 |
| 3 | 100 | 100 | 89 | 90 | 65 | 40 | 34 | 7 | 1.1 | 0.24 |
| 4 | 100 | 100 | 100 | 100 | 87 | 68 | 50 | 40 | 1.3 | 0.5 |
| 5 | 100 | 100 | 100 | 100 | 100 | 70 | 56 | 56 | 2.4 | 0.51 |
| 6 | 100 | 100 | 100 | 100 | 100 | 98 | 74 | 67 | 10 | 0.8 |
| 7 | 100 | 100 | 100 | 100 | 100 | 100 | 95 | 73 | 11 | 1 |
Table 6.
The in vitro dissolution of formulations B1 to B6 (the first 2 h in an acidic medium of pH 1.2, then in a phosphate buffer medium of pH 6.8).
Table 6.
The in vitro dissolution of formulations B1 to B6 (the first 2 h in an acidic medium of pH 1.2, then in a phosphate buffer medium of pH 6.8).
| Time | Percent Drug Release (%) |
|---|
| Hour | B1 | B2 | B3 | B4 | B5 | B6 |
|---|
| 1 | 30 | 40 | 10 | 0.2 | 0 | 0 |
| 2 | 40 | 95 | 57 | 0.9 | 0 | 0 |
| 3 | 100 | 100 | 89 | 5 | 10 | 0 |
| 4 | 100 | 100 | 100 | 19 | 20 | 0 |
| 5 | 100 | 100 | 100 | 30 | 30 | 1 |
| 6 | 100 | 100 | 100 | 39 | 39 | 1.2 |
| 7 | 100 | 100 | 100 | 45 | 50 | 4 |
Table 7.
The in vitro dissolution of formulations C1 to C7 (the first 2 h in an acid medium of pH 1.2, and then in a phosphate buffer medium of pH 6.8).
Table 7.
The in vitro dissolution of formulations C1 to C7 (the first 2 h in an acid medium of pH 1.2, and then in a phosphate buffer medium of pH 6.8).
| Time | Percent Drug Release (%) |
|---|
| Hour | C1 | C2 | C3 | C4 | C5 | C6 | C7 |
|---|
| 1 | 1 | 1 | 0.2 | 0.1 | 0.01 | 0 | 0 |
| 2 | 2 | 3 | 1 | 0.5 | 0.1 | 0 | 0 |
| 3 | 10 | 7 | 1 | 0.7 | 1 | 0 | 0 |
| 4 | 11 | 10 | 5 | 2 | 1.7 | 0.2 | 0 |
| 5 | 28 | 21 | 10 | 7 | 3 | 0.9 | 0 |
| 6 | 52 | 61 | 30 | 11 | 6 | 5 | 1 |
| 7 | 69 | 78 | 56 | 21 | 10 | 7 | 2 |
Table 8.
The in vitro dissolution of formulations D1 to D7 (the first 2 h in an acid medium of pH 1.2, and then in a phosphate buffer medium of pH 6.8).
Table 8.
The in vitro dissolution of formulations D1 to D7 (the first 2 h in an acid medium of pH 1.2, and then in a phosphate buffer medium of pH 6.8).
| Time | Percent Drug Release (%) |
|---|
| Hour | D1 | D2 | D3 | D4 | D5 | D6 | D7 |
|---|
| 1 | 0.02 | 11 | 0.2 | 1 | 2 | 2 | 5 |
| 2 | 0.9 | 13 | 1 | 5 | 7 | 5 | 22 |
| 3 | 6 | 19 | 1 | 17 | 10 | 6.4 | 39 |
| 4 | 11 | 20 | 5 | 28 | 21 | 28 | 59 |
| 5 | 17 | 31 | 10 | 61 | 34 | 68 | 89 |
| 6 | 20 | 50 | 30 | 71 | 52 | 97 | 98 |
| 7 | 66 | 71 | 56 | 90 | 89 | 100 | 100 |
Table 9.
The in vitro dissolution of formulation E1 to E6 (the first 2 h in an acidic medium of pH 1.2, then in a phosphate buffer medium of pH 6.8).
Table 9.
The in vitro dissolution of formulation E1 to E6 (the first 2 h in an acidic medium of pH 1.2, then in a phosphate buffer medium of pH 6.8).
| Time | Percent Drug Release (%) |
|---|
| Hour | E1 | E2 | E3 | E4 | E5 | E6 |
|---|
| 1 | 1.42 | 1.4 | 1 | 0.9 | 0.75 | 0.08 |
| 2 | 10.4 | 10.1 | 7.7 | 5.5 | 2.2 | 0.71 |
| 3 | 25.4 | 21.4 | 10.4 | 9.8 | 6.4 | 1.2 |
| 4 | 41.5 | 39.8 | 18.7 | 14.49 | 14.8 | 3.5 |
| 5 | 63 | 66.4 | 70.5 | 68.9 | 72.17 | 21.4 |
| 6 | 97.06 | 98.01 | 97.06 | 98.46 | 98.45 | 99.27 |
Table 10.
Stability studies of the E6 formulation under different temperatures and humidity conditions (n = 3).
Table 10.
Stability studies of the E6 formulation under different temperatures and humidity conditions (n = 3).
| Time (Hours) | Dissolution after 1 Month
(% Drug Release) | Dissolution after 2 Months
(% Drug Release) | Dissolution after 3 Months
(% Drug Release) |
|---|
| Temp (°C)/ Humidity (%) | 25 °C/60% | 30 °C/65% | 40 °C/75% | 25 °C/60% | 30 °C/65% | 40 °C/75% | 25 °C/60% | 30 °C/65% | 40 °C/75% |
|---|
| 1 | 0.09 ± 0.01 | 0.08 ± 0.04 | 0.07 ± 0.01 | 0.08 ± 0.01 | 0.07 ± 0.01 | 0.06 ± 0.04 | 0.09 ± 0.02 | 0.07 ± 0.03 | 0.08 ± 0.01 |
| 2 | 0.69 ± 0.03 | 0.67 ± 0.03 | 0.71 ± 0.03 | 0.68 ± 0.04 | 0.65 ± 0.03 | 0.68 ± 0.12 | 0.70 ± 0.03 | 0.67 ± 0.01 | 0.65 ± 0.04 |
| 3 | 1.3 ± 0.02 | 1.2 ± 0.06 | 1.0 ± 0.03 | 1.3 ± 0.06 | 1.1 ± 0.05 | 1.1 ± 0.07 | 1.3 ± 0.02 | 1.2 ± 0.01 | 1.0 ± 0.04 |
| 4 | 3.6 ± 0.02 | 3.4 ± 0.01 | 3.1 ± 0.07 | 3.4 ± 0.04 | 3.4 ± 0.03 | 3.3 ± 0.04 | 3.6 ± 0.07 | 3.5 ± 0.02 | 3.2 ± 0.02 |
| 5 | 21.1 ± 0.03 | 21.0 ± 0.02 | 20.8 ± 0.05 | 21.5 ± 0.02 | 21.2 ± 0.01 | 20.4 ± 0.02 | 21.5 ± 0.03 | 21.2 ± 0.10 | 20.7 ± 0.03 |
| 6 | 99.34 ± 0.03 | 99.32 ± 0.03 | 99.27 ± 0.03 | 99.38 ± 0.05 | 99.37 ± 0.04 | 99.31 ± 0.03 | 99.33 ± 0.07 | 99.33 ± 0.03 | 99.22 ± 0.02 |
Table 11.
Assay of stability samples (n = 3).
Table 11.
Assay of stability samples (n = 3).
| Assay | Storage Conditions |
|---|
| 25 ± 2 °C/60% ± 5% RH | 30 ± 2 °C/65% ± 5% RH | 40 ± 2 °C/75% ± 5% RH |
|---|
| Initial | 99.98% ± 0.01 | 99.98% ± 0.04 | 99.98% ± 0.02 |
| After 1st month | 99.94% ± 0.03 | 99.92% ± 0.06 | 99.92% ± 0.05 |
| After 2nd month | 99.90% ± 0.03 | 99.90% ± 0.05 | 99.89% ± 0.03 |
| After 3rd month | 99.89% ± 0.03 | 99.83% ± 0.03 | 99.82% ± 0.08 |
Table 12.
The formulations of the core tablets (F1, F2, and F3).
Table 12.
The formulations of the core tablets (F1, F2, and F3).
| Tablet Ingredient * | F1 | F2 | F3 |
|---|
| Aceclofenac | 100 | 100 | 100 |
| Croscarmellose sodium | 0.75 | 1.5 | 3.75 |
| Avicel PH102 | 47.6 | 46.85 | 44.6 |
| Magnesium stearate | 1.5 | 1.5 | 1.5 |
| Sunset yellow lake E100 | 0.15 | 0.15 | 0.15 |
| Total weight of tablets | 150 | 150 | 150 |
Table 13.
The formulations of A1 to A10.
Table 13.
The formulations of A1 to A10.
| Formulation * | HPMC K100M | Avicel PH102 |
|---|
| A1 (10%) | 35 | 311.5 |
| A2 (20%) | 70 | 276.5 |
| A3 (25%) | 87.5 | 259 |
| A4 (30%) | 105 | 241.5 |
| A5 (35%) | 122.5 | 224 |
| A6 (40%) | 140 | 206.5 |
| A7 (45%) | 157.5 | 189 |
| A8 (50%) | 175 | 171.5 |
| A9 (60%) | 210 | 136.5 |
| A10 (99%) | 346.5 | 0 |
Table 14.
The formulations of B1 to B6.
Table 14.
The formulations of B1 to B6.
Formulation * %
(HPMC K100M:Eudragit L100) | HPMC K100M (mg) | Eudragit L100 (mg) | Avicel PH102 (mg) |
|---|
| B1 (10:30) | 35 | 105 | 206.5 |
| B2 (20:20) | 70 | 70 | 206.5 |
| B3 (30:10) | 105 | 35 | 206.5 |
| B4 (40:10) | 140 | 35 | 171.5 |
| B5 (45:15) | 157.5 | 52.5 | 136.5 |
| B6 (50:20) | 175 | 70 | 101.5 |
Table 15.
The formulations of C1 to C7.
Table 15.
The formulations of C1 to C7.
Formulation * %
(HPMC K100M:HEC) | HPMC K100M (mg) | HEC (mg) |
|---|
| C1 (100:0) | 346.5 | 0 |
| C2 (87.5:12.5) | 303.19 | 43.31 |
| C3 (75:25) | 260.74 | 85.76 |
| C4 (50:50) | 173.25 | 173.25 |
| C5 (25:75) | 85.76 | 260.74 |
| C6 (12.5:87.5) | 43.31 | 303.19 |
| C7 (0:100) | 0 | 346.5 |
Table 16.
The formulations of D1 to D7.
Table 16.
The formulations of D1 to D7.
| Formulation * | HPMC K100M | HPMC E5 |
|---|
| D1 (100:0) | 346.5 | 0 |
| D2 (87.5:12.5) | 303.19 | 43.31 |
| D3 (75:25) | 260.74 | 85.76 |
| D4 (50:50) | 173.25 | 173.25 |
| D5 (25:75) | 85.76 | 260.74 |
| D6 (12.5:87.5) | 43.31 | 303.19 |
| D7 (0:100) | 0 | 346.5 |
Table 17.
The formulations of E1 to E6.
Table 17.
The formulations of E1 to E6.
Formulation *
HPMC K100M: HPMC E5 (12.5:87.5) | HPMC K100M
(mg) | HPMC E5
(mg) | Magnesium Stearate (mg) | Press-Coated Tablet Weight
(mg) |
|---|
| E1 | 40.22 | 281.53 | 3.25 | 475 |
| E2 | 43.31 | 303.19 | 3.5 | 500 |
| E3 | 46.406 | 324.844 | 3.75 | 525 |
| E4 | 49.5 | 346.5 | 4 | 550 |
| E5 | 52.59 | 368.16 | 4.25 | 575 |
| E6 | 55.69 | 389.81 | 4.5 | 600 |


 ,
, 

