
In Vitro Effects of Cannabidiol on Activated Immune–Inflammatory Pathways in Major Depressive Patients and Healthy Controls

 , and
, and
Abstract
:1. Introduction
2. Results
2.1. Demographic and Clinical Data
2.2. Effects of CBD
2.3. Differences Depression Versus Controls
2.4. Enrichment Analysis in the Effects of CBD on Cytokines
3. Discussion
3.1. Effects of CBD on Immune Profiles and Cytokines/Growth Factors
3.2. Differences in Immune Profiles in Depression Versus Controls
3.3. CBD Does Not Normalize the Immune Activation in Depression, on the Contrary
4. Limitations
5. Materials and Methods
5.1. Participants
5.2. Clinical Measurements
5.3. Assays
5.4. Statistical Analysis
5.5. Protein-Protein (PPI) Network and GO Enrichment Analysis
6. Conclusions
Supplementary Materials
Author Contributions
Funding
Institutional Review Board Statement
Informed Consent Statement
Data Availability Statement
Conflicts of Interest
References
- Maes, M.; Carvalho, A.F. The Compensatory Immune-Regulatory Reflex System (CIRS) in Depression and Bipolar Disorder. Mol. Neurobiol. 2018, 55, 8885–8903. [Google Scholar] [CrossRef] [PubMed]
- Leonard, B.; Maes, M. Mechanistic explanations how cell-mediated immune activation, inflammation and oxidative and nitrosative stress pathways and their sequels and concomitants play a role in the pathophysiology of unipolar depression. Neurosci. Biobehav. Rev. 2012, 36, 764–785. [Google Scholar] [CrossRef] [PubMed]
- Ogłodek, E.A.; Szota, A.; Just, M.J.; Moś, D.; Araszkiewicz, A.S. Comparison of chemokines (CCL-5 and SDF-1), chemokine receptors (CCR-5 and CXCR-4) and IL-6 levels in patients with different severities of depression. Pharmacol. Rep. 2014, 66, 920–926. [Google Scholar] [CrossRef]
- Eyre, H.A.; Air, T.; Pradhan, A.; Johnston, J.; Lavretsky, H.; Stuart, M.J.; Baune, B.T. A meta-analysis of chemokines in major depression. Prog. Neuro-Psychopharmacol. Biol. Psychiatry 2016, 68, 1–8. [Google Scholar] [CrossRef] [Green Version]
- Maes, M.; Fišar, Z.; Medina, M.; Scapagnini, G.; Nowak, G.; Berk, M. New drug targets in depression: Inflammatory, cell-mediated immune, oxidative and nitrosative stress, mitochondrial, antioxidant, and neuroprogressive pathways. And new drug candidates—Nrf2 activators and GSK-3 inhibitors. Inflammopharmacology 2012, 20, 127–150. [Google Scholar] [CrossRef] [PubMed]
- Maes, M.; Song, C.; Lin, A.-H.; Bonaccorso, S.; Kenis, G.; De Jongh, R.; Bosmans, E.; Scharpé, S. Negative Immunoregulatory Effects of Antidepressants Inhibition of Interferon-γ and Stimulation of Interleukin-10 Secretion. Neuropsychopharmacology 1999, 20, 370–379. [Google Scholar] [CrossRef]
- Silote, G.P.; Sartim, A.; Sales, A.; Eskelund, A.; Guimarães, F.S.; Wegener, G.; Joca, S. Emerging evidence for the antidepressant effect of cannabidiol and the underlying molecular mechanisms. J. Chem. Neuroanat. 2019, 98, 104–116. [Google Scholar] [CrossRef] [PubMed]
- Gáll, Z.; Farkas, S.; Albert, Á.; Ferencz, E.; Vancea, S.; Urkon, M.; Kolcsár, M. Effects of Chronic Cannabidiol Treatment in the Rat Chronic Unpredictable Mild Stress Model of Depression. Biomolecules 2020, 10, 801. [Google Scholar] [CrossRef]
- Martín-Sánchez, A.; González-Pardo, H.; Alegre-Zurano, L.; Castro-Zavala, A.; López-Taboada, I.; Valverde, O.; Conejo, N.M. Early-life stress induces emotional and molecular alterations in female mice that are partially reversed by cannabidiol. Prog. Neuro-Psychopharmacol. Biol. Psychiatry 2022, 115, 110508. [Google Scholar] [CrossRef]
- Réus, G.Z.; Stringari, R.B.; Ribeiro, K.F.; Luft, T.; Abelaira, H.M.; Fries, G.R.; Aguiar, B.W.; Kapczinski, F.; Hallak, J.E.; Zuardi, A.W.; et al. Administration of cannabidiol and imipramine induces antidepressant-like effects in the forced swimming test and increases brain-derived neurotrophic factor levels in the rat amygdala. Acta Neuropsychiatr. 2011, 23, 241–248. [Google Scholar] [CrossRef]
- Martin, E.L.; Strickland, J.C.; Schlienz, N.J.; Munson, J.; Jackson, H.; Bonn-Miller, M.O.; Vandrey, R. Antidepressant and Anxiolytic Effects of Medicinal Cannabis Use in an Observational Trial. Front. Psychiatry 2021, 12, 729800. [Google Scholar] [CrossRef] [PubMed]
- Atalay, S.; Jarocka-Karpowicz, I.; Skrzydlewska, E. Antioxidative and Anti-Inflammatory Properties of Cannabidiol. Antioxidants 2019, 9, 21. [Google Scholar] [CrossRef] [PubMed] [Green Version]
- Borges, R.S.; Batista, J., Jr.; Viana, R.B.; Baetas, A.C.; Orestes, E.; Andrade, M.A.; Honório, K.M.; Da Silva, A.B.F. Understanding the Molecular Aspects of Tetrahydrocannabinol and Cannabidiol as Antioxidants. Molecules 2013, 18, 12663–12674. [Google Scholar] [CrossRef] [PubMed] [Green Version]
- Morris, G.; Walder, K.; Berk, M.; Carvalho, A.F.; Marx, W.; Bortolasci, C.C.; Yung, A.R.; Puri, B.K.; Maes, M. Intertwined associations between oxidative and nitrosative stress and endocannabinoid system pathways: Relevance for neuropsychiatric disorders. Prog. Neuro-Psychopharmacol. Biol. Psychiatry 2022, 114, 110481. [Google Scholar] [CrossRef]
- Pertwee, R.G. The diverse CB1and CB2receptor pharmacology of three plant cannabinoids: Δ9-tetrahydrocannabinol, cannabidiol and Δ9-tetrahydrocannabivarin. Br. J. Pharmacol. 2008, 153, 199–215. [Google Scholar] [CrossRef] [PubMed] [Green Version]
- Jehle, J.; Eich, L.; Danisch, M.; Bagheri, S.; Avraamidou, E.; Pfeifer, P.; Tiyerili, V.; Bindila, L.; Lutz, B.; Nickenig, G. The endocannabinoid 2-arachidonoylglycerol inhibits endothelial function and repair. Int. J. Cardiol. 2021, 323, 243–250. [Google Scholar] [CrossRef] [PubMed]
- Gasperi, V.; Evangelista, D.; Chiurchiu, V.; Florenzano, F.; Savini, I.; Oddi, S.; Avigliano, L.; Catani, M.V.; Maccarrone, M. 2-Arachidonoylglycerol modulates human endothelial cell/leukocyte interactions by controlling selectin expression through CB1 and CB2 receptors. Int. J. Biochem. Cell Biol. 2014, 51, 79–88. [Google Scholar] [CrossRef]
- Turcotte, C.; Blanchet, M.-R.; LaViolette, M.; Flamand, N. The CB2 receptor and its role as a regulator of inflammation. Cell. Mol. Life Sci. 2016, 73, 4449–4470. [Google Scholar] [CrossRef] [Green Version]
- Chiurchiù, V.; Cencioni, M.T.; Bisicchia, E.; De Bardi, M.; Gasperini, C.; Borsellino, G.; Centonze, D.; Battistini, L.; Maccarrone, M. Distinct modulation of human myeloid and plasmacytoid dendritic cells by anandamide in multiple sclerosis. Ann. Neurol. 2013, 73, 626–636. [Google Scholar] [CrossRef]
- Correa, F.; Hernangómez, M.; Mestre, L.; Loría, F.; Spagnolo, A.; Docagne, F.; Di Marzo, V.; Guaza, C. Anandamide enhances IL-10 production in activated microglia by targeting CB2receptors: Roles of ERK1/2, JNK, and NF-κB. Glia 2010, 58, 135–147. [Google Scholar] [CrossRef]
- Karsak, M.; Gaffal, E.; Date, R.; Wang-Eckhardt, L.; Rehnelt, J.; Petrosino, S.; Starowicz, K.; Steuder, R.; Schlicker, E.; Cravatt, B.; et al. Attenuation of Allergic Contact Dermatitis Through the Endocannabinoid System. Science 2007, 316, 1494–1497. [Google Scholar] [CrossRef] [PubMed] [Green Version]
- Hegde, V.L.; Hegde, S.; Cravatt, B.F.; Hofseth, L.J.; Nagarkatti, M.; Nagarkatti, P.S. Attenuation of Experimental Autoimmune Hepatitis by Exogenous and Endogenous Cannabinoids: Involvement of Regulatory T Cells. Mol. Pharmacol. 2008, 74, 20–33. [Google Scholar] [CrossRef] [PubMed]
- Sheng, W.S.; Hu, S.; Min, X.; Cabral, G.A.; Lokensgard, J.R.; Peterson, P.K. Synthetic cannabinoid WIN55,212-2 inhibits generation of inflammatory mediators by IL-1β-stimulated human astrocytes. Glia 2005, 49, 211–219. [Google Scholar] [CrossRef] [PubMed]
- Montecucco, F.; Di Marzo, V.; da Silva, R.F.; Vuilleumier, N.; Capettini, L.; Lenglet, S.; Pagano, S.; Piscitelli, F.; Quintao, S.; Bertolotto, M.; et al. The activation of the cannabinoid receptor type 2 reduces neutrophilic protease-mediated vulnerability in atherosclerotic plaques. Eur. Heart J. 2012, 33, 846–856. [Google Scholar] [CrossRef] [PubMed] [Green Version]
- Zoppi, S.; Perez-Nievas, B.G.; Madrigal, J.L.M.; Manzanares, J.; Leza, J.C.; García-Bueno, B. Regulatory Role of Cannabinoid Receptor 1 in Stress-Induced Excitotoxicity and Neuroinflammation. Neuropsychopharmacology 2011, 36, 805–818. [Google Scholar] [CrossRef] [Green Version]
- Petrosino, S.; Verde, R.; Vaia, M.; Allarà, M.; Iuvone, T.; Di Marzo, V. Anti-inflammatory Properties of Cannabidiol, a Nonpsychotropic Cannabinoid, in Experimental Allergic Contact Dermatitis. J. Pharmacol. Exp. Ther. 2018, 365, 652–663. [Google Scholar] [CrossRef]
- Zgair, A.; Lee, J.B.; Wong, J.C.M.; Taha, D.A.; Aram, J.; Di Virgilio, D.; McArthur, J.W.; Cheng, Y.-K.; Hennig, I.M.; Barrett, D.A.; et al. Oral administration of cannabis with lipids leads to high levels of cannabinoids in the intestinal lymphatic system and prominent immunomodulation. Sci. Rep. 2017, 7, 14542. [Google Scholar] [CrossRef]
- Szklarczyk, D.; Gable, A.L.; Nastou, K.C.; Lyon, D.; Kirsch, R.; Pyysalo, S.; Doncheva, N.T.; Legeay, M.; Fang, T.; Bork, P.; et al. The STRING database in 2021: Customizable protein–protein networks, and functional characterization of user-uploaded gene/measurement sets. Nucleic Acids Res. 2021, 49, D605–D612. [Google Scholar] [CrossRef]
- Millar, S.A.; Stone, N.L.; Bellman, Z.D.; Yates, A.S.; England, T.J.; O’Sullivan, S.E. A systematic review of cannabidiol dosing in clinical populations. Br. J. Clin. Pharmacol. 2019, 85, 1888–1900. [Google Scholar] [CrossRef]
- Millar, S.A.; Stone, N.L.; Yates, A.S.; O’Sullivan, S.E. A Systematic Review on the Pharmacokinetics of Cannabidiol in Humans. Front. Pharmacol. 2018, 9, 1365. [Google Scholar] [CrossRef]
- Garberg, H.T.; Solberg, R.; Barlinn, J.; Martinez-Orgado, J.; Løberg, E.-M.; Saugstad, O.D. High-Dose Cannabidiol Induced Hypotension after Global Hypoxia-Ischemia in Piglets. Neonatology 2017, 112, 143–149. [Google Scholar] [CrossRef] [PubMed] [Green Version]
- Uttl, L.; Hložek, T.; Mareš, P.; Páleníček, T.; Kubová, H. Anticonvulsive Effects and Pharmacokinetic Profile of Cannabidiol (CBD) in the Pentylenetetrazol (PTZ) or N-Methyl-D-Aspartate (NMDA) Models of Seizures in Infantile Rats. Int. J. Mol. Sci. 2021, 23, 94. [Google Scholar] [CrossRef] [PubMed]
- Burstein, S. Cannabidiol (CBD) and its analogs: A review of their effects on inflammation. Bioorganic Med. Chem. 2015, 23, 1377–1385. [Google Scholar] [CrossRef]
- Kaplan, B.L.F.; Springs, A.E.B.; Kaminski, N.E. The profile of immune modulation by cannabidiol (CBD) involves deregulation of nuclear factor of activated T cells (NFAT). Biochem. Pharmacol. 2008, 76, 726–737. [Google Scholar] [CrossRef] [PubMed] [Green Version]
- Kozela, E.; Pietr, M.; Juknat, A.; Rimmerman, N.; Levy, R.; Vogel, Z. Cannabinoids Δ9-Tetrahydrocannabinol and Cannabidiol Differentially Inhibit the Lipopolysaccharide-activated NF-κB and Interferon-β/STAT Proinflammatory Pathways in BV-2 Microglial Cells. J. Biol. Chem. 2010, 285, 1616–1626. [Google Scholar] [CrossRef] [PubMed] [Green Version]
- Jenny, M.; Santer, E.; Pirich, E.; Schennach, H.; Fuchs, D. Δ9-Tetrahydrocannabinol and cannabidiol modulate mitogen-induced tryptophan degradation and neopterin formation in peripheral blood mononuclear cells in vitro. J. Neuroimmunol. 2009, 207, 75–82. [Google Scholar] [CrossRef] [PubMed]
- Anil, S.M.; Shalev, N.; Vinayaka, A.C.; Nadarajan, S.; Namdar, D.; Belausov, E.; Shoval, I.; Mani, K.A.; Mechrez, G.; Koltai, H. Cannabis compounds exhibit anti-inflammatory activity in vitro in COVID-19-related inflammation in lung epithelial cells and pro-inflammatory activity in macrophages. Sci. Rep. 2021, 11, 1462. [Google Scholar] [CrossRef]
- Sermet, S.; Li, J.; Bach, A.; Crawford, R.B.; Kaminski, N.E. Cannabidiol selectively modulates interleukin (IL)-1β and IL-6 production in toll-like receptor activated human peripheral blood monocytes. Toxicology 2021, 464, 153016. [Google Scholar] [CrossRef]
- Gugliandolo, E.; Licata, P.; Peritore, A.F.; Siracusa, R.; D’Amico, R.; Cordaro, M.; Fusco, R.; Impellizzeri, D.; Di Paola, R.; Cuzzocrea, S.; et al. Effect of Cannabidiol (CBD) on Canine Inflammatory Response: An Ex Vivo Study on LPS Stimulated Whole Blood. Vet. Sci. 2021, 8, 185. [Google Scholar] [CrossRef]
- Mesiakaris, K.; Atsopardi, K.; Margarity, M.; Poulas, K. Cannabidiol pretreatment attenuates locomotor alterations and cytokine production in an autoimmune hepatitis model. bioRxiv 2021. [Google Scholar] [CrossRef]
- Chen, W.; Kaplan, B.L.F.; Pike, S.T.; Topper, L.A.; Lichorobiec, N.R.; Simmons, S.O.; Ramabhadran, R.; Kaminski, N.E. Magnitude of stimulation dictates the cannabinoid-mediated differential T cell response to HIVgp. J. Leukoc. Biol. 2012, 92, 1093–1102. [Google Scholar] [CrossRef] [PubMed] [Green Version]
- De Groote, D.; Zangerle, P.F.; Gevaert, Y.; Fassotte, M.F.; Beguin, Y.; Noizat-Pirenne, F.; Pirenne, J.; Gathy, R.; Lopez, M.; Dehart, I.; et al. Direct stimulation of cytokines (IL-1β, TNF-α, IL-6, IL-2, IFN-γ and GM-CSF) in whole blood. I. Comparison with isolated PBMC stimulation. Cytokine 1992, 4, 239–248. [Google Scholar] [CrossRef]
- Katsikis, P.D.; Wunderlich, E.S.; Smith, C.A.; Herzenberg, L.A.; Herzenberg, L.A. Fas antigen stimulation induces marked apoptosis of T lymphocytes in human immunodeficiency virus-infected individuals. J. Exp. Med. 1995, 181, 2029–2036. [Google Scholar] [CrossRef] [PubMed]
- Köhler, C.A.; Freitas, T.H.; Maes, M.; De Andrade, N.Q.; Liu, C.S.; Fernandes, B.S.; Stubbs, B.; Solmi, M.; Veronese, N.; Herrmann, N.; et al. Peripheral cytokine and chemokine alterations in depression: A meta-analysis of 82 studies. Acta Psychiatr. Scand. 2017, 135, 373–387. [Google Scholar] [CrossRef]
- Leighton, S.P.; Nerurkar, L.; Krishnadas, R.; Johnman, C.; Graham, G.J.; Cavanagh, J. Chemokines in depression in health and in inflammatory illness: A systematic review and meta-analysis. Mol. Psychiatry 2018, 23, 48–58. [Google Scholar] [CrossRef] [Green Version]
- Maes, M. A review on citation amnesia in depression and inflammation research. Neuro Endocrinol. Lett. 2015, 36, 1–6. [Google Scholar]
- Kahl, K.G.; Kruse, N.; Faller, H.; Weiss, H.; Rieckmann, P. Expression of tumor necrosis factor-α and interferon-γ mRNA in blood cells correlates with depression scores during an acute attack in patients with multiple sclerosis. Psychoneuroendocrinology 2002, 27, 671–681. [Google Scholar] [CrossRef]
- Inserra, A.; Mastronardi, C.A.; Rogers, G.; Licinio, J.; Wong, M.-L. Neuroimmunomodulation in Major Depressive Disorder: Focus on Caspase 1, Inducible Nitric Oxide Synthase, and Interferon-Gamma. Mol. Neurobiol. 2019, 56, 4288–4305. [Google Scholar] [CrossRef] [PubMed] [Green Version]
- Daria, S.; Proma, M.A.; Shahriar, M.; Islam, S.M.A.; Bhuiyan, M.A.; Islam, M.R. Serum interferon-gamma level is associated with drug-naïve major depressive disorder. SAGE Open Med. 2020, 8, 2050312120974169. [Google Scholar] [CrossRef]
- Dahl, J.; Ormstad, H.; Aass, H.C.D.; Malt, U.; Bendz, L.T.; Sandvik, L.; Brundin, L.; Andreassen, O.A. The plasma levels of various cytokines are increased during ongoing depression and are reduced to normal levels after recovery. Psychoneuroendocrinology 2014, 45, 77–86. [Google Scholar] [CrossRef]
- Schmidt, F.M.; Lichtblau, N.; Minkwitz, J.; Chittka, T.; Thormann, J.; Kirkby, K.C.; Sander, C.; Mergl, R.; Faßhauer, M.; Stumvoll, M.; et al. Cytokine levels in depressed and non-depressed subjects, and masking effects of obesity. J. Psychiatr. Res. 2014, 55, 29–34. [Google Scholar] [CrossRef] [PubMed]
- Villanueva, L.E.B.; Pérez-Sánchez, G.; Alvarez-Herrera, S.; Girón-Pérez, M.I.; Arreola, R.; Cruz-Fuentes, C.; Palacios, L.; De La Peña, F.R.; Pavón, L. Alterations in the Levels of Growth Factors in Adolescents with Major Depressive Disorder: A Longitudinal Study during the Treatment with Fluoxetine. Mediat. Inflamm. 2019, 2019, 9130868. [Google Scholar] [CrossRef] [Green Version]
- Simeonova, D.; Stoyanov, D.; Leunis, J.-C.; Murdjeva, M.; Maes, M. Construction of a nitro-oxidative stress-driven, mechanistic model of mood disorders: A nomothetic network approach. Nitric Oxide 2021, 106, 45–54. [Google Scholar] [CrossRef] [PubMed]
- Wu, C.-K.; Tseng, P.-T.; Chen, Y.-W.; Tu, K.-Y.; Lin, P.-Y. Significantly higher peripheral fibroblast growth factor-2 levels in patients with major depressive disorder: A preliminary meta-analysis under MOOSE guidelines. Medicine 2016, 95, e4563. [Google Scholar] [CrossRef]
- He, S.; Zhang, T.; Hong, B.; Peng, D.; Su, H.; Lin, Z.; Fang, Y.; Jiang, K.; Liu, X.; Li, H. Decreased serum fibroblast growth factor—2 levels in pre- and post-treatment patients with major depressive disorder. Neurosci. Lett. 2014, 579, 168–172. [Google Scholar] [CrossRef]
- Clark-Raymond, A.; Halaris, A. VEGF and depression: A comprehensive assessment of clinical data. J. Psychiatr. Res. 2013, 47, 1080–1087. [Google Scholar] [CrossRef]
- Kahl, K.G.; Bens, S.; Ziegler, K.; Rudolf, S.; Kordon, A.; Dibbelt, L.; Schweiger, U. Angiogenic factors in patients with current major depressive disorder comorbid with borderline personality disorder. Psychoneuroendocrinology 2009, 34, 353–357. [Google Scholar] [CrossRef]
- Iga, J.-I.; Ueno, S.-I.; Yamauchi, K.; Numata, S.; Tayoshi-Shibuya, S.; Kinouchi, S.; Nakataki, M.; Song, H.; Hokoishi, K.; Tanabe, H.; et al. Gene expression and association analysis of vascular endothelial growth factor in major depressive disorder. Prog. Neuro-Psychopharmacol. Biol. Psychiatry 2007, 31, 658–663. [Google Scholar] [CrossRef]
- Arimura, K.; Ago, T.; Kamouchi, M.; Nakamura, K.; Ishitsuka, K.; Kuroda, J.; Sugimori, H.; Ooboshi, H.; Sasaki, T.; Kitazono, T. PDGF Receptor β Signaling in Pericytes Following Ischemic Brain Injury. Curr. Neurovascular Res. 2012, 9, 1–9. [Google Scholar] [CrossRef]
- Jha, M.K.; Minhajuddin, A.; Gadad, B.S.; Trivedi, M.H. Platelet-Derived Growth Factor as an Antidepressant Treatment Selection Biomarker: Higher Levels Selectively Predict Better Outcomes with Bupropion-SSRI Combination. Int. J. Neuropsychopharmacol. 2017, 20, 919–927. [Google Scholar] [CrossRef] [Green Version]
- Aaronson, D.S.; Horvath, C.M. A Road Map for Those Who Don’t Know JAK-STAT. Science 2002, 296, 1653–1655. [Google Scholar] [CrossRef] [PubMed]
- Zanelati, T.V.; Biojone, C.; Moreira, F.A.; Guimaraes, F.S.; Joca, S.R.L. Antidepressant-like effects of cannabidiol in mice: Possible involvement of 5-HT1A receptors. Br. J. Pharmacol. 2010, 159, 122–128. [Google Scholar] [CrossRef] [PubMed] [Green Version]
- Gomes, F.V.; Resstel, L.B.M.; Guimarães, F.S. The anxiolytic-like effects of cannabidiol injected into the bed nucleus of the stria terminalis are mediated by 5-HT1A receptors. Psychopharmacology 2011, 213, 465–473. [Google Scholar] [CrossRef] [PubMed]
- Viudez-Martínez, A.; García-Gutiérrez, M.S.; Manzanares, J. Cannabidiol regulates the expression of hypothalamus-pituitary-adrenal axis-related genes in response to acute restraint stress. J. Psychopharmacol. 2018, 32, 1379–1384. [Google Scholar] [CrossRef] [PubMed]
- Sales, A.J.; Fogaça, M.V.; Sartim, A.G.; Pereira, V.S.; Wegener, G.; Guimarães, F.S.; Joca, S.R.L. Cannabidiol Induces Rapid and Sustained Antidepressant-Like Effects Through Increased BDNF Signaling and Synaptogenesis in the Prefrontal Cortex. Mol. Neurobiol. 2019, 56, 1070–1081. [Google Scholar] [CrossRef] [PubMed]
- Benjamini, Y.; Hochberg, Y. Controlling the False Discovery Rate: A Practical and Powerful Approach to Multiple Testing. J. R. Stat. Soc. Ser. B Methodol. 1995, 57, 289. [Google Scholar] [CrossRef]
- Cohen, E.; Margalit, I.; Shochat, T.; Goldberg, E.; Krause, I. Markers of Chronic Inflammation in Overweight and Obese Individuals and the Role of Gender: A Cross-Sectional Study of a Large Cohort. J. Inflamm. Res. 2021, 14, 567–573. [Google Scholar] [CrossRef]
- Zimmerman, M.; Martinez, J.H.; Young, D.; Chelminski, I.; Dalrymple, K. Severity classification on the Hamilton depression rating scale. J. Affect. Disord. 2013, 150, 384–388. [Google Scholar] [CrossRef]
- Spielberger, C.; Gorsuch, R.; Lushene, R.; Vagg, P.R.; Jacobs, G. Manual for the State-Trait Anxiety Inventory (Form Y1–Y2); Consulting Psychologists Press: Palo Alto, CA, USA, 1983; Volume 4. [Google Scholar]
- Pettersson, A.; Modin, S.; Wahlström, R.; Hammarberg, S.A.W.; Krakau, I. The Mini-International Neuropsychiatric Interview is useful and well accepted as part of the clinical assessment for depression and anxiety in primary care: A mixed-methods study. BMC Fam. Pract. 2018, 19, 19. [Google Scholar] [CrossRef]
- Breen, E.J.; Polaskova, V.; Khan, A. Bead-based multiplex immuno-assays for cytokines, chemokines, growth factors and other analytes: Median fluorescence intensities versus their derived absolute concentration values for statistical analysis. Cytokine 2015, 71, 188–198. [Google Scholar] [CrossRef]
- Wu, T.; Hu, E.; Xu, S.; Chen, M.; Guo, P.; Dai, Z.; Feng, T.; Zhou, L.; Tang, W.; Zhan, L.; et al. clusterProfiler 4.0: A universal enrichment tool for interpreting omics data. Innovation 2021, 2, 100141. [Google Scholar] [CrossRef] [PubMed]
- Carlson, M.; Falcon, S.; Pages, H.; Li, N. GO.db: A Set of Annotation Maps Describing the Entire Gene Ontology. R Package Version 3.8.2. 2019. Available online: https://bioconductor.org/packages/release/data/annotation/html/GO.db.html (accessed on 22 March 2022).


| Variables | HC (n = 20) | Depression (n = 30) | F/X2 | df | p |
|---|---|---|---|---|---|
| Sex (Male/Female) | 6/14 | 11/19 | 0.24 | 1 | 0.626 |
| Age (years) | 33.6 (8.0) | 28.7 (8.6) | 4.28 | 1/48 | 0.04 |
| Education (years) | 16.1 (2.2) | 15.6 (1.4) | 0.84 | 1/48 | 0.363 |
| BMI (kg/m2) | 21.3 (2.5) | 25.5 (5.9) | 8.82 | 1/48 | 0.005 |
| HAM-D | 0.95 (1.59) | 23.5 (5.8) | 281.87 | 1/48 | <0.001 |
| STAI | 37.7 (10.6) | 56.8 (7.2) | 57.15 | 1/48 | <0.001 |
| Smoking (N/Y) | 18/2 | 23/7 | FEPT | - | 0.285 |
| Variables (z Scores) | Control a | CBD 0.1 µg/mL b | CBD 1.0 µg/mL c | CBD 10 µg/mL d | Wald | df | p |
|---|---|---|---|---|---|---|---|
| M1 | −0.094 (0.122) | −0.079 (0.143) | −0.029 (0.118) | 0.114 (0.118) | 5.02 | 3 | 0.171 |
| Th-1 | 0.045 (0.115) d | 0.013 (0.125) c,d | 0.091 (0.121) b,d | −0.374 (0.110) a,b,c | 53.45 | 3 | <0.001 |
| Th-17 | 0.018 (0.121) d | −0.013 (0.128) d | 0.012 (0.121) d | −0.216 (0.124) a,b,c | 17.66 | 3 | 0.001 |
| Th-2 | −0.038 (0.126) | −0.037 (0.123) | −0.075 (0.125) | −0.099 (0.119) | 0.96 | 3 | 0.812 |
| IRS | −0.008 (0.113) | −0.116 (0.117) | 0.004 (0.110) | −0.228 (0.106) | 22.53 | 3 | <0.001 |
| CIRS | 0.084 (0.131) c,d | 0.074 (0.133) c,d | −0.001 (0.126) a,b,d | −0.356 (0.104) a,b,c | 37.23 | 3 | <0.001 |
| Tcell | −0.150 (0.113) d | −0.165 (0.112) d | −0.114 (0.099) d | 0.226 (0.108) a,b,c | 36.30 | 3 | <0.001 |
| GF | −0.139 (0.109) c,d | −0.135 (0.107) c,d | −0.107 (0.107) a,b,d | 0.094 (0.117) a,b,c | 155.52 | 3 | <0.001 |
| NT | 0.052 (0.117) d | 0.018 (0.129) d | 0.043 (0.122) d | −0.303 (0.116) a,b,c | 35.84 | 3 | <0.001 |
| Variables z Scores | Control a | CBD 0.1 µg/mL b | CBD 1 µg/mL c | CBD 10 µg/mL d | Wald ×2 (df = 3) | p Value |
|---|---|---|---|---|---|---|
| IL-1β | −0.461(0.090) c,d | −0.429 (0.092) c,d | −0.230 (0.096) a,b,d | 1.144 (0.123) a,b,c | 425.40 | <0.001 |
| IL−1RA | 0.018 (0.090) c,d | 0.005 (0.089) d | −0.007 (0.090) a,d | −0.230 (0.092) a,b,c | 168.27 | <0.001 |
| IL-2 | −0.109 (0.124) c | −0.105 (0.136) c | 0.103 (0.134) a,b | −0.018 (0.130) | 29.23 | <0.001 |
| IL-4 | −0.272 (0.125) c,d | −0.227 (0.142) c,d | −0.096 (0.137) a,b,d | 0.551 (0.137) a,b,c | 61.81 | <0.001 |
| IL-6 | 0.167 (0.130) d | 0.152 (0.140) d | 0.124 (0.125) d | −0.484 (0.118) a,b,c | 105.82 | <0.001 |
| CXCL8 | 0.091 (0.127) c,d | 0.091 (0.142) d | −0.007 (0.108) a,d | −0.383 (0.021) a,b,c | 21.10 | <0.001 |
| IL-9 | −0.026 (0.116) c,d | −0.038 (0.114) c,d | −0.072 (0.109) a,b,d | −0.137 (0.107) a,b,c | 49.68 | <0.001 |
| IL-10 | 0.433 (0.139) c,d | 0.384 (0.132) c,d | 0.119 (0.114) a,b,d | −0.992 (0.022) a,b,c | 138.95 | <0.001 |
| IL-13 | 0.266 (0.143) c,d | 0.246 (0.121) d | 0.043 (0.133) a,d | −0.609 (0.079) a,b,c | 56.32 | <0.001 |
| IL-15 | −0.133 (0.095) c,d | −0.133 (0.099) c,d | −0.093 (0.098) a,b,d | 0.056 (0.096) a,b,c | 125.91 | <0.001 |
| IL−17 | −0.140 (0.106) d | −0.175 (0.108) c,d | −0.107 (0.110) b,d | 0.146 (0.127) a,b,c | 36.24 | <0.001 |
| CCL11 | 0.127 (0.127) c,d | 0.079 (0.135) d | 0.023 (0.135) a,d | −0.132 (0.110) a,b,c | 17.00 | <0.001 |
| FGF | −0.179 (0.107) c,d | −0.177 (0.105) c,d | −0.121 (0.106) a,b,d | 0.208 (0.101) a,b,c | 143.85 | <0.001 |
| G-CSF | 0.046 (0.111) d | 0.053 (0.114) d | 0.034 (0.115) d | −0.148 (0.100) a,b,c | 29.09 | <0.001 |
| GM-CSF | −0.168 (0.137) c,d | −0.133 (0.121) d | −0.031 (0.122) a,d | 0.422 (0.132) a,b,c | 31.88 | <0.001 |
| IFN-γ | 0.277 (0.123) c,d | 0.251 (0.126) c,d | 0.196 (0.126) a,b,d | −0.895 (0.071) a,b,c | 166.03 | <0.001 |
| CXCL10 | −0.030 (0.089) c,d | −0.034 (0.090) c,d | 0.009 (0.089) a,b,d | −0.183 (0.117) a,b,c | 36.70 | <0.001 |
| CCL2 | 0.399 (0.147) c,d | 0.355 (0.143) c,d | 0.139 (0.140) a,b,d | −0.819 (0.060) a,b,c | 159.52 | <0.001 |
| CCL3 | 0.079 (0.109) d | 0.079 (0.109) d | 0.077 (0.109) d | 0.054 (0.112) a,b,c | 35.39 | <0.001 |
| PDGF | −0.034 (0.030) d | −0.036 (0.026) d | −0.037 (0.09) d | 0.098 (0.043) a,b,c | 14.77 | 0.002 |
| CCL4 | 0.168 (0.128) c,d | 0.147 (0.127) d | 0.120 (0.123) a,d | −0.316 (0.117) a,b,c | 231.01 | <0.001 |
| CCL5 | 0.041 (0.094) c,d | 0.023 (0.096) c,d | −0.038 (0.096) a,b,d | −0.174 (0.083) a,b,c | 64.97 | <0.001 |
| TNF-α | −0.048 (0.091) c,d | −0.041 (0.097) c,d | −0.005 (0.099) a,b,d | 0.070 (0.091) a,b,c | 13.30 | 0.004 |
| VEGF | −0.124 (0.099) c,d | −0.111 (0.101) c,d | −0.084 (0.099) a,b,d | 0.042 (0.103) a,b,c | 138.92 | <0.001 |
| Variables z Values | HC | Depression | Wald (df = 1) | p |
|---|---|---|---|---|
| M1 | −0.131 (0.116) | 0.087 (0.205) | 0.86 | 0.354 |
| Th-1 | −0.337 (0.119) | 0.225 (0.198) | 5.59 | 0.018 |
| Th-17 | −0.299 (0.122) | 0.199 (0.204) | 4.43 | 0.035 |
| Th-2 | −0.374 (0.125) | 0.250 (0.196) | 7.16 | 0.007 |
| IRS | −0.366 (0.114) | 0.244 (0.184) | 7.91 | 0.005 |
| CIRS | −0.299 (0.169) | 0.199 (0.172) | 4.18 | 0.041 |
| Tcell | −0.305 (0.110) | 0.203 (0.169) | 6.64 | 0.011 |
| GF | −0.430 (0.029) | 0.287 (0.217) | 10.71 | 0.001 |
| NT | −0.286 (0.125) | 0.190 (0.197) | 4.09 | 0.043 |
| Variables z Scores | HC | Depression | Effect | Wald | Df | p |
|---|---|---|---|---|---|---|
| IL-1RA | −0.321 (0.106) | 0.214 (0.141) | G | 9.45 | 1 | 0.002 |
| IL-5 | −0.442 (0.034) | 0.295 (0.217) | G | 11.02 | 1 | 0.001 |
| CXCL8 | −0.312 (0.015) | 0.208 (0.192) | G G × T | 7.30 8.85 | 1 3 | 0.007 0.031 |
| IL-9 | −0.178 (0.064) | 0.118 (0.121) | G | 5.19 | 1 | 0.023 |
| IL-10 | −0.083 (0.150) | 0.055 (0.134) | G × T | 13.34 | 3 | 0.004 |
| IL-12 | −0.391 (0.067) | 0.261 (0.204) | G | 8.09 | 1 | 0.004 |
| IL-15 | −0.455 (0.098) | 0.303 (0.178) | G | 12.81 | 1 | <0.001 |
| IL-17 | −0.415 (0.073) | 0.277 (0.208) | G | 9.71 | 1 | 0.002 |
| FGF | −0.404 (0.093) | 0.269 (0.183) | G | 10.75 | 1 | 0.001 |
| G-CSF | −0.421 (0.013) | 0.281 (0.219) | G | 10.28 | 1 | 0.001 |
| GM-CSF | 0.134 (0.166) | −0.089 (0.181) | G × T | 8.05 | 3 | 0.045 |
| IFN-γ | −0.255 (0.145) | 0.170 (0.155) | G | 4.05 | 1 | 0.044 |
| CXCL10 | −0.357 (0.140) | 0.238 (0.129) | G | 9.48 | 1 | 0.002 |
| CCL3 | 0.437 (0.009) | −0.292 (0.220) | G | 10.91 | 1 | 0.001 |
| CCL5 | −0.223 (0.115) | 0.149 (0.140) | G G × T | 4.21 8.11 | 1 3 | 0.040 0.044 |
| TNF-α | −0.246 (0.092) | 0.169 (0.148) | G | 6.19 | 1 | 0.013 |
| VEGF | −0.415 (0.112) | 0.277 (0.163) | G | 12.54 | 1 | <0.001 |
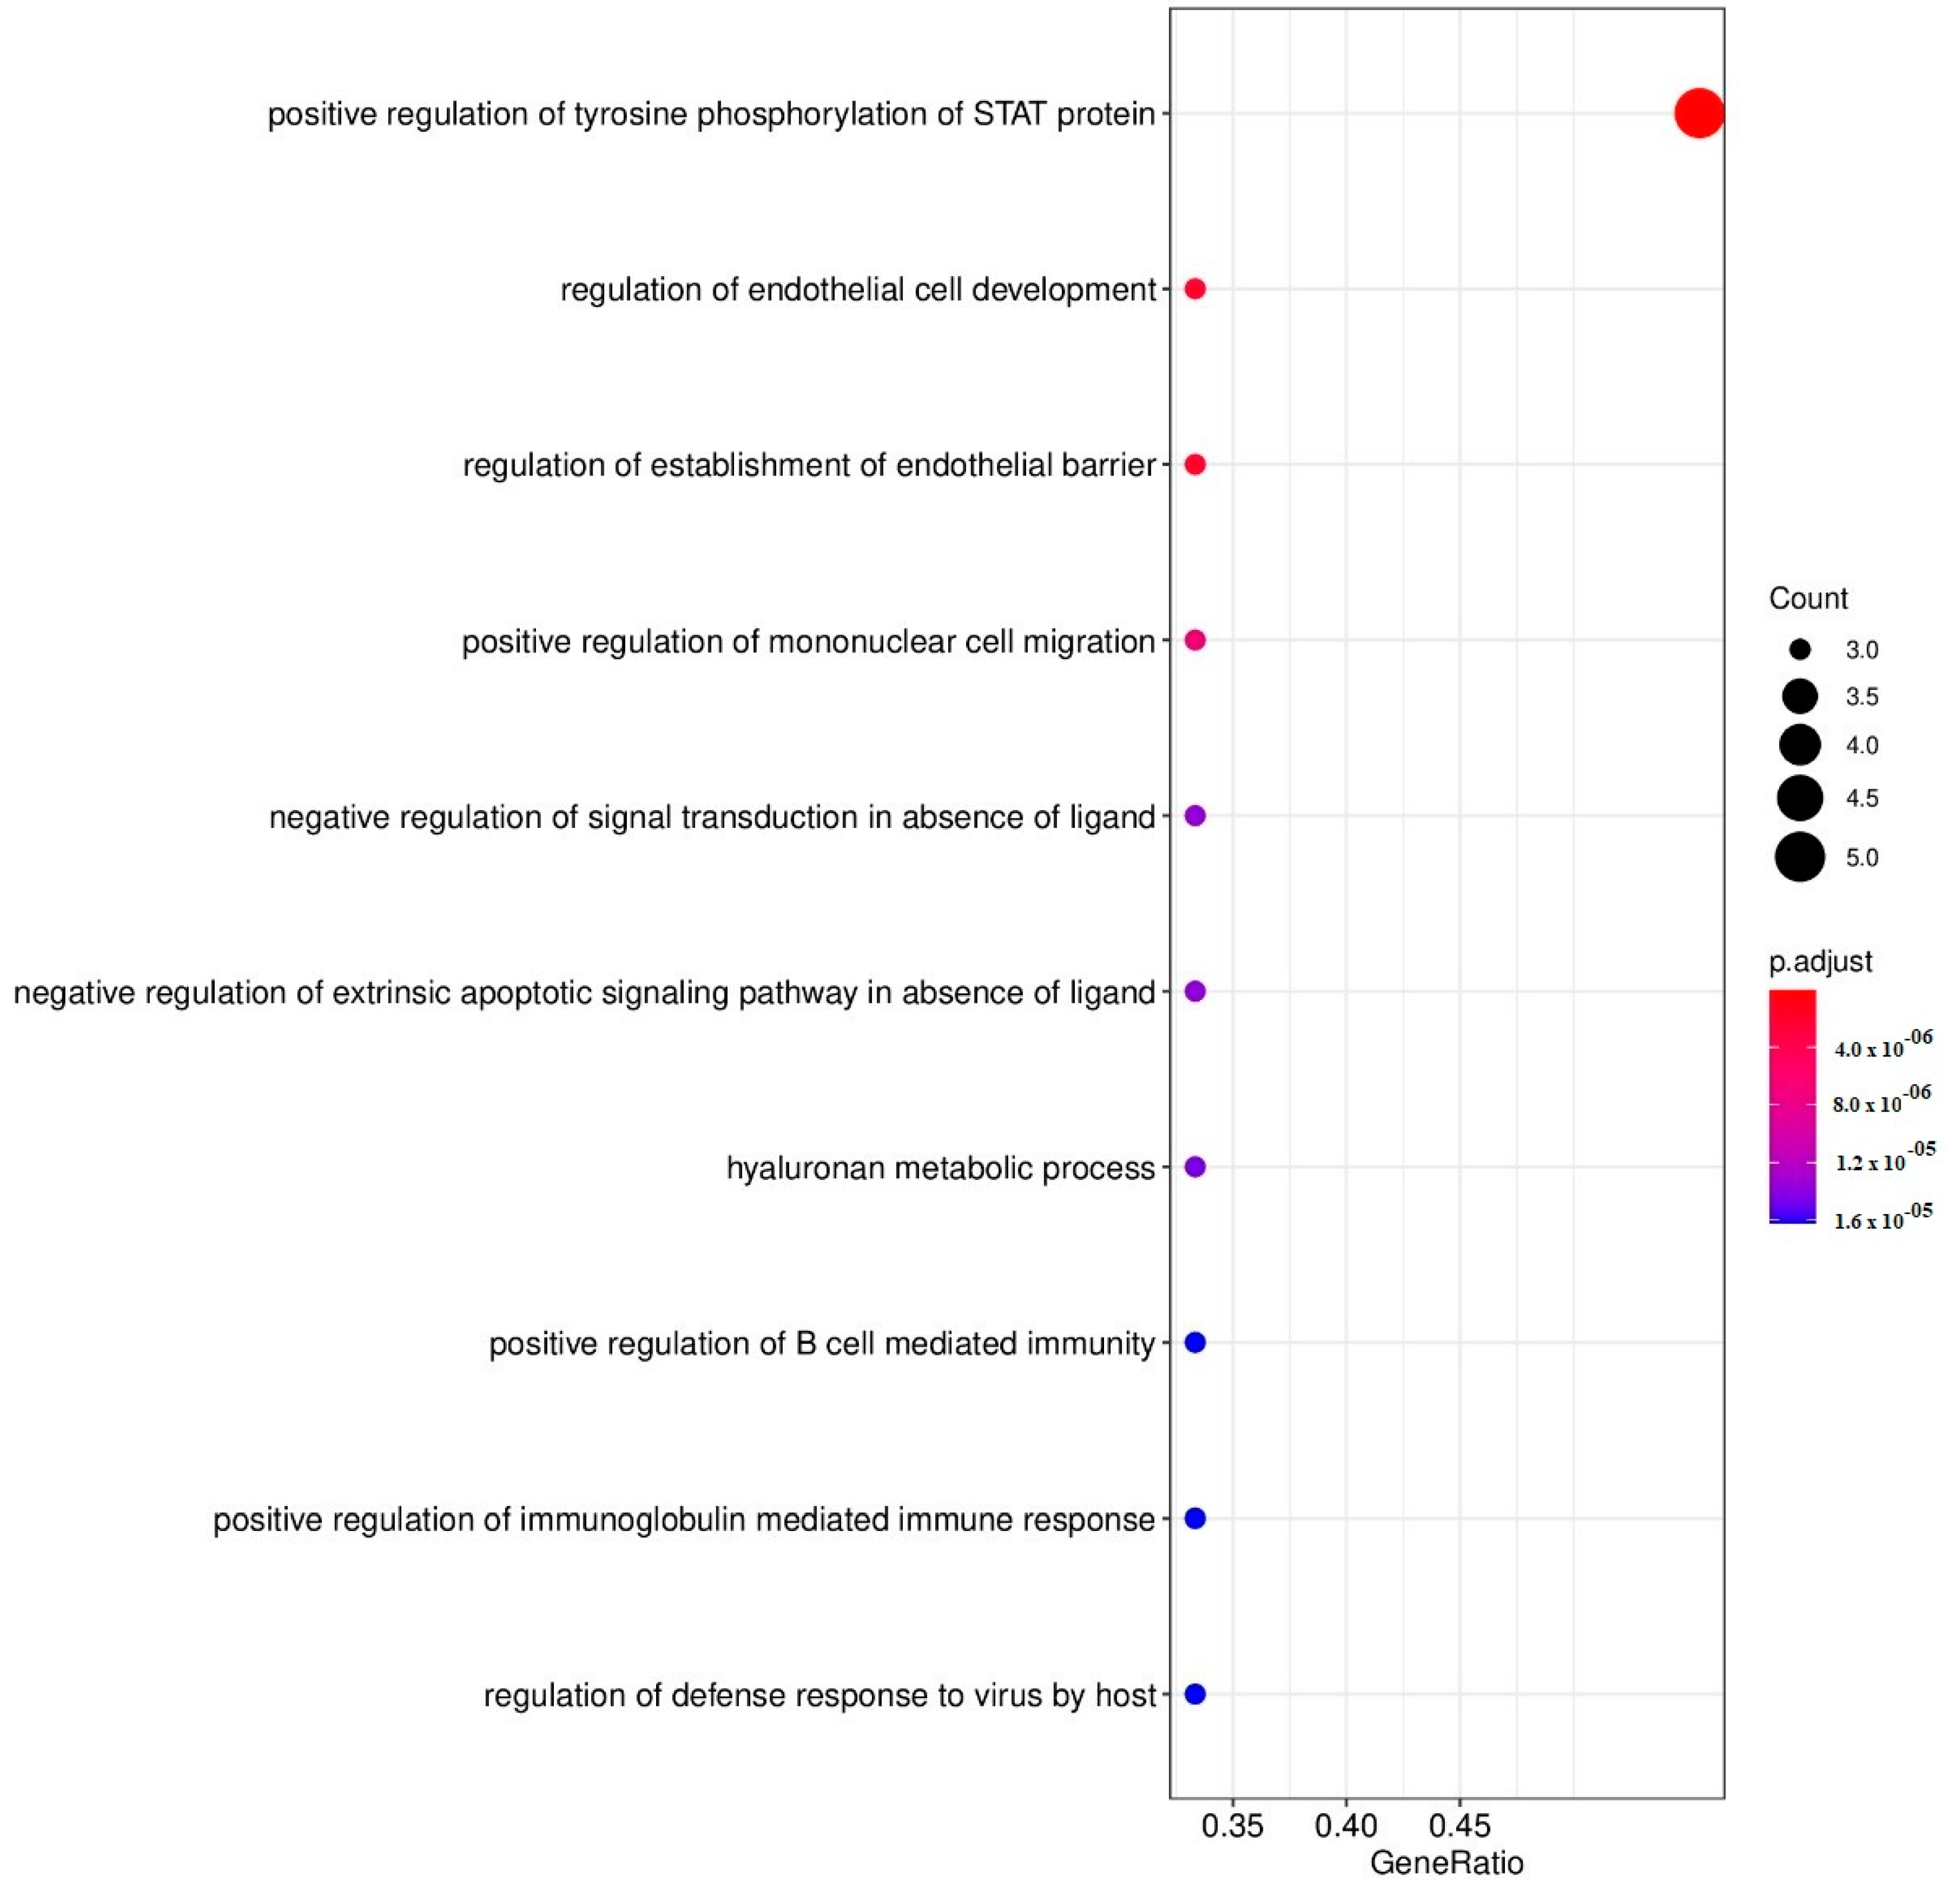
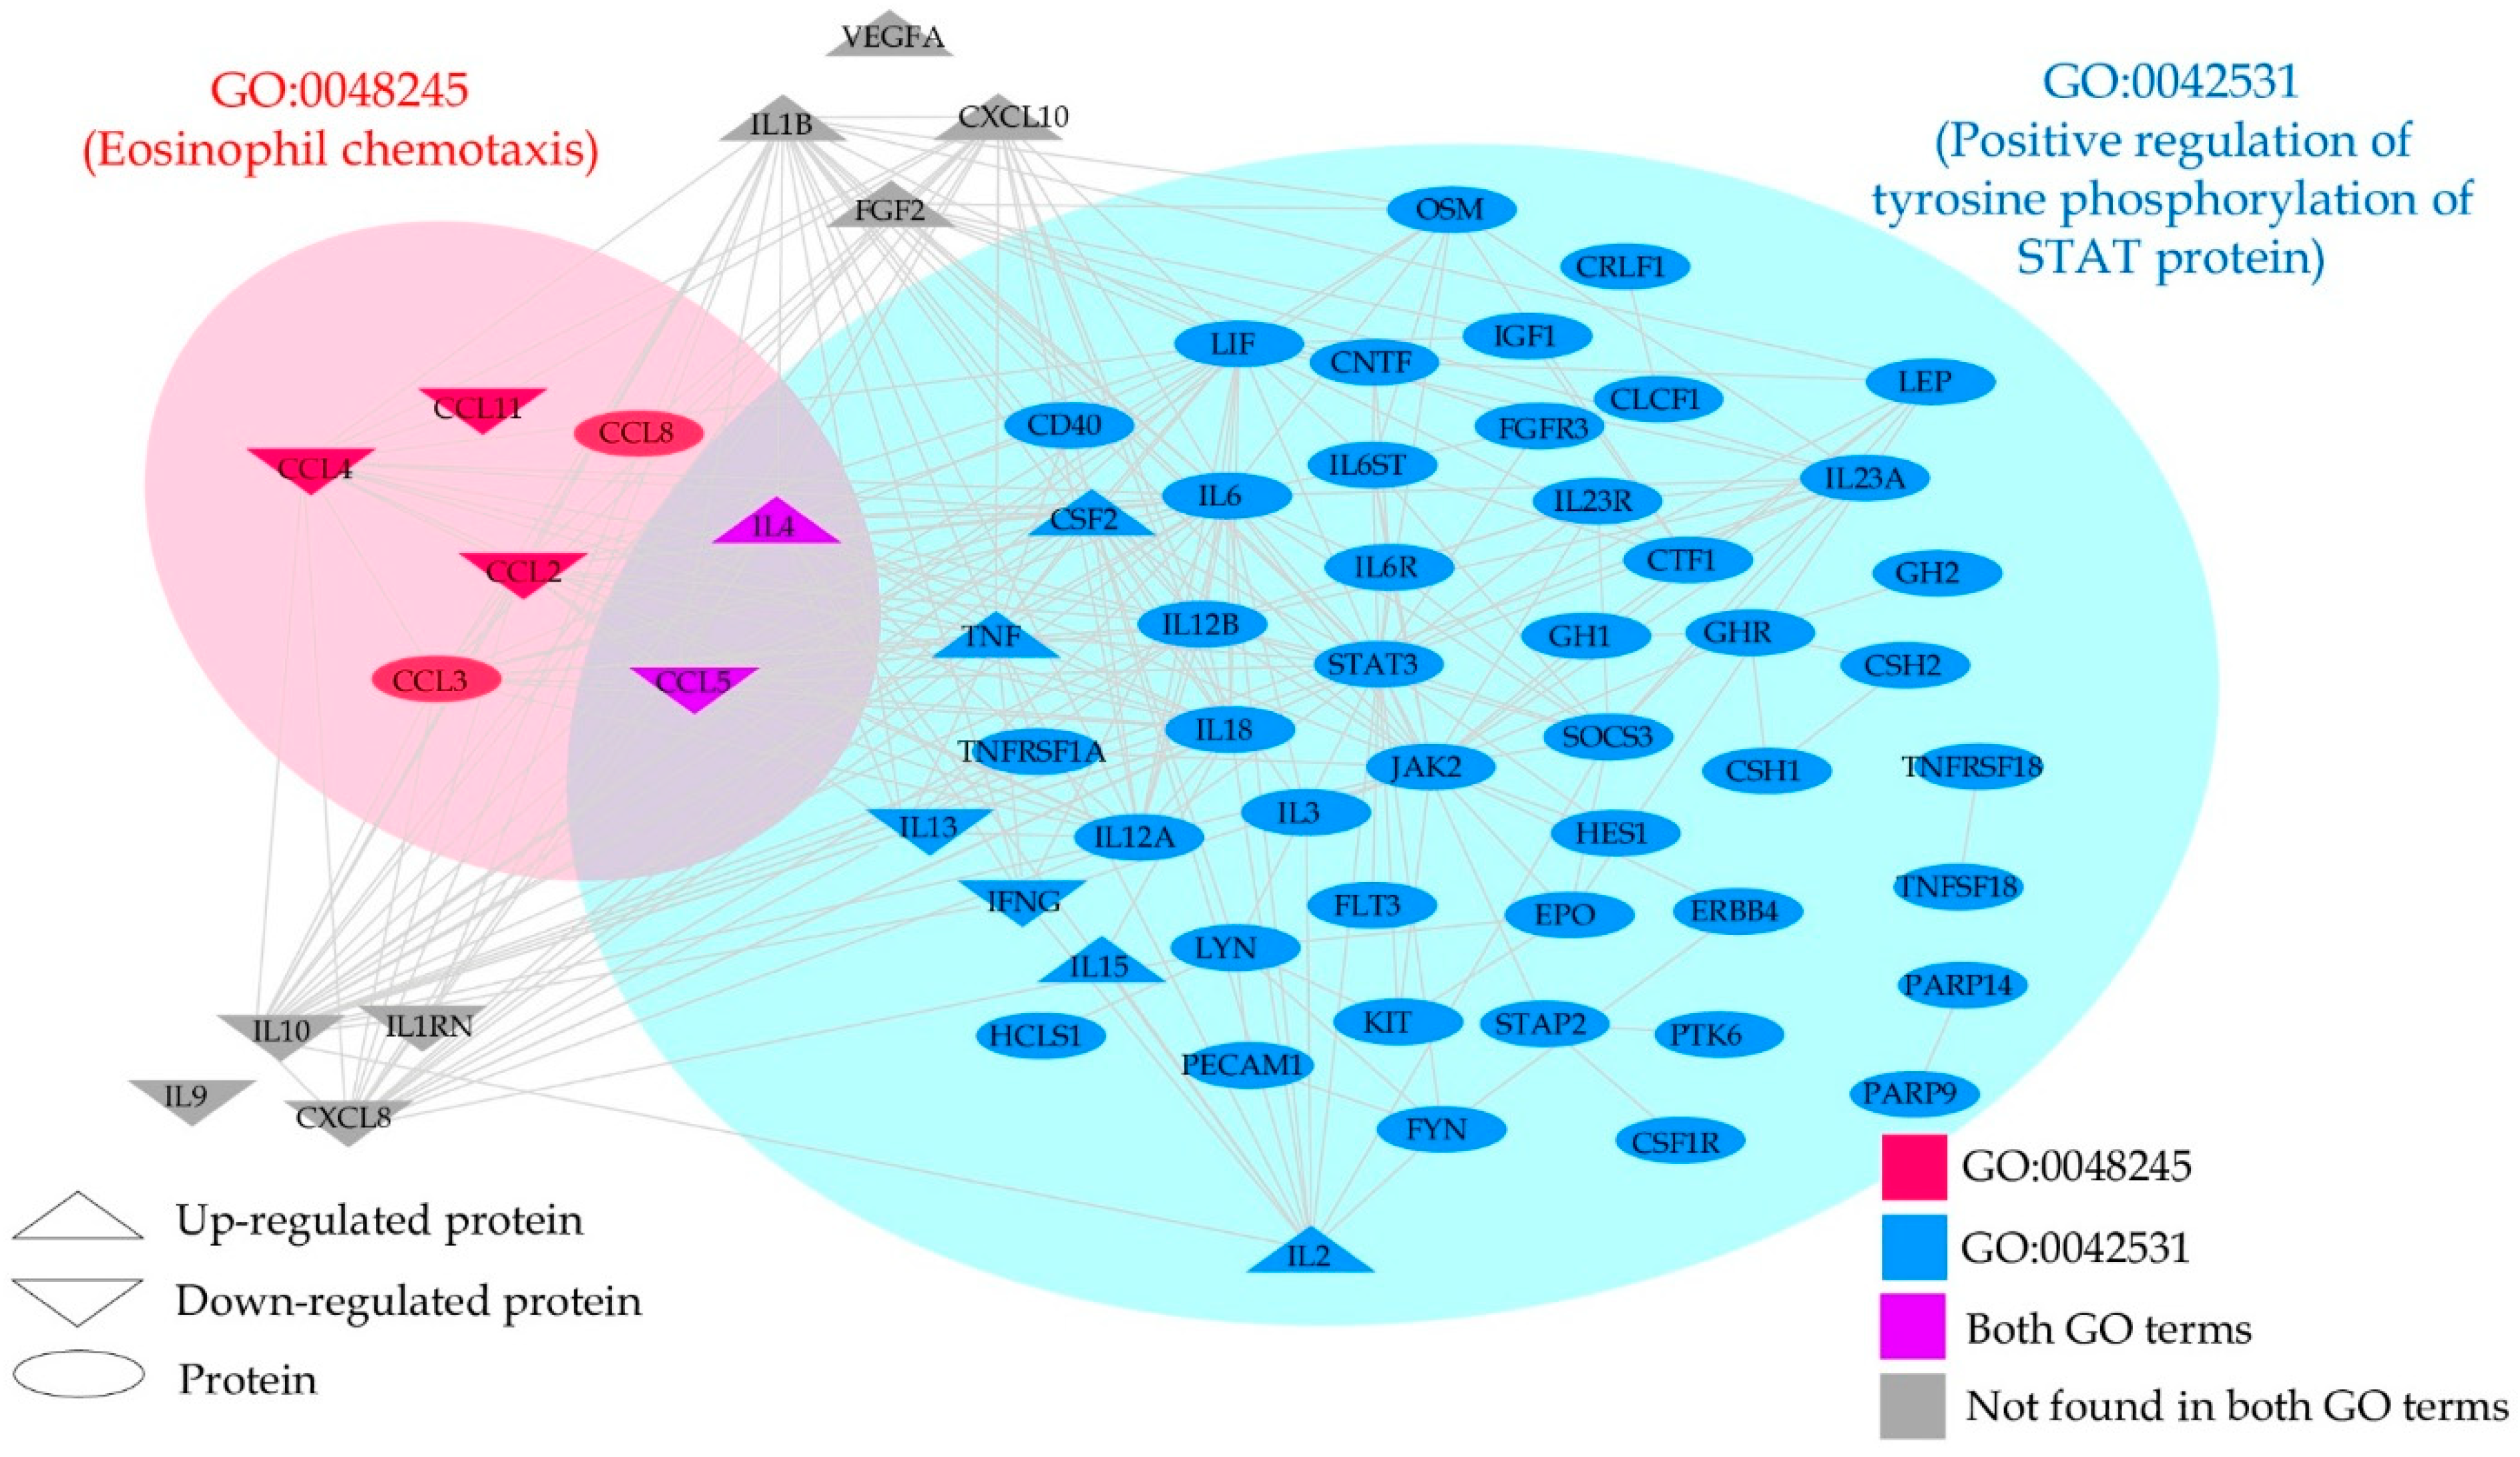
| ID | Description (Upregulated DEPs by CBD) | Gene Members | Gene Ratio | p-Adjust | q-Value |
|---|---|---|---|---|---|
| GO:0042531 | Positive regulation of tyrosine phosphorylation of STAT protein | 71 | 5/9 | 2.95 × 10⁻⁸ | 6.33 × 10⁻⁹ |
| GO:1901550 | Regulation of endothelial cell development | 15 | 3/9 | 1.90 × 10⁻⁶ | 4.08 × 10⁻⁷ |
| GO:1903140 | Regulation of establishment of endothelial barrier | 15 | 3/9 | 1.90 × 10⁻⁶ | 4.08 × 10⁻⁷ |
| GO:0071677 | Positive regulation of mononuclear cell migration | 25 | 3/9 | 6.56 × 10⁻⁶ | 1.41 × 10⁻⁶ |
| GO:1901099 | Negative regulation of signal transduction in absence of ligand | 36 | 3/9 | 1.37 × 10⁻⁵ | 2.95 × 10⁻⁶ |
| GO:2001240 | Negative regulation of extrinsic apoptotic signaling pathway in absence of ligand | 36 | 3/9 | 1.37 × 10⁻⁵ | 2.95 × 10⁻⁶ |
| GO:0030212 | Hyaluronan metabolic process | 37 | 3/9 | 1.45 × 10⁻⁵ | 3.13 × 10⁻⁶ |
| GO:0002714 | Positive regulation of B cell-mediated immunity | 40 | 3/9 | 1.62 × 10⁻⁵ | 3.48 × 10⁻⁶ |
| GO:0002891 | Positive regulation of immunoglobulin mediated immune response | 40 | 3/9 | 1.62 × 10⁻⁵ | 3.48 × 10⁻⁶ |
| GO:0050691 | Regulation of defense response to virus by host | 40 | 3/9 | 1.62 × 10⁻⁵ | 3.48 × 10⁻⁶ |
| ID | Description (Downregulated DEPs by CBD) | Gene Members | Gene Ratio | p-Adjust | q-Value |
| GO:0048245 | Eosinophil chemotaxis | 19 | 4/10 | 4.82 × 10⁻⁸ | 1.54 × 10⁻⁸ |
| GO:0072677 | Eosinophil migration | 23 | 4/10 | 7.60 × 10⁻⁸ | 2.42 × 10⁻⁸ |
| GO:2000501 | Regulation of natural killer cell chemotaxis | 9 | 3/10 | 6.95 × 10⁻⁷ | 2.21 × 10⁻⁷ |
| GO:0035747 | Natural killer cell chemotaxis | 11 | 3/10 | 1.15 × 10⁻⁶ | 3.66 × 10⁻⁷ |
| GO:0002544 | Chronic inflammatory response | 20 | 3/10 | 5.37 × 10⁻⁶ | 1.71 × 10⁻⁶ |
| GO:1901623 | Regulation of lymphocyte chemotaxis | 27 | 3/10 | 1.09 × 10⁻⁵ | 3.46 × 10⁻⁶ |
| Pathways in Upregulated DEPs | Total | Expected | Hits | p | FDR p |
|---|---|---|---|---|---|
| Cytokine Signaling in Immune system | 286 | 2.18 | 18 | 1.08 × 10⁻¹² | 1.51 × 10⁻⁹ |
| TRIF-mediated TLR3/TLR4 signaling | 87 | 0.665 | 10 | 6.88 × 10⁻¹⁰ | 2.70 × 10⁻⁷ |
| MyD88-independent cascade | 88 | 0.672 | 10 | 7.71 × 10⁻¹⁰ | 2.70 × 10⁻⁷ |
| Toll Like Receptor 3 (TLR3) Cascade | 88 | 0.672 | 10 | 7.71 × 10⁻¹⁰ | 2.70 × 10⁻⁷ |
| Activated TLR4 signaling | 100 | 0.764 | 10 | 2.76 × 10⁻⁹ | 7.75 × 10⁻⁷ |
| Pathways in Downregulated DEPs | |||||
| Phosphatidylinositol signaling system | 100 | 0.694 | 31 | 1.59 × 10−46 | 5.33 × 10−44 |
| FoxO signaling pathway | 294 | 2.04 | 38 | 1.53 × 10−42 | 2.57 × 10−40 |
| Sphingolipid signaling pathway | 189 | 1.31 | 29 | 2.06 × 10⁻³³ | 2.30 × 10⁻³¹ |
Publisher’s Note: MDPI stays neutral with regard to jurisdictional claims in published maps and institutional affiliations. |
© 2022 by the authors. Licensee MDPI, Basel, Switzerland. This article is an open access article distributed under the terms and conditions of the Creative Commons Attribution (CC BY) license (https://creativecommons.org/licenses/by/4.0/).
Share and Cite
Rachayon, M.; Jirakran, K.; Sodsai, P.; Klinchanhom, S.; Sughondhabirom, A.; Plaimas, K.; Suratanee, A.; Maes, M. In Vitro Effects of Cannabidiol on Activated Immune–Inflammatory Pathways in Major Depressive Patients and Healthy Controls. Pharmaceuticals 2022, 15, 405. https://doi.org/10.3390/ph15040405
Rachayon M, Jirakran K, Sodsai P, Klinchanhom S, Sughondhabirom A, Plaimas K, Suratanee A, Maes M. In Vitro Effects of Cannabidiol on Activated Immune–Inflammatory Pathways in Major Depressive Patients and Healthy Controls. Pharmaceuticals. 2022; 15(4):405. https://doi.org/10.3390/ph15040405
Chicago/Turabian StyleRachayon, Muanpetch, Ketsupar Jirakran, Pimpayao Sodsai, Siriwan Klinchanhom, Atapol Sughondhabirom, Kitiporn Plaimas, Apichat Suratanee, and Michael Maes. 2022. "In Vitro Effects of Cannabidiol on Activated Immune–Inflammatory Pathways in Major Depressive Patients and Healthy Controls" Pharmaceuticals 15, no. 4: 405. https://doi.org/10.3390/ph15040405
APA StyleRachayon, M., Jirakran, K., Sodsai, P., Klinchanhom, S., Sughondhabirom, A., Plaimas, K., Suratanee, A., & Maes, M. (2022). In Vitro Effects of Cannabidiol on Activated Immune–Inflammatory Pathways in Major Depressive Patients and Healthy Controls. Pharmaceuticals, 15(4), 405. https://doi.org/10.3390/ph15040405