Article

Combinatory Effect and Modes of Action of Chrysin and Bone Marrow-Derived Mesenchymal Stem Cells on Streptozotocin/Nicotinamide-Induced Diabetic Rats

by
Hesham M. Sayed
1,
Ashraf S. Awaad
2,
Fatma El-Zahraa S. Abdel Rahman
3,
M. Al-Dossari
4,
N. S. Abd El-Gawaad
4 and
Osama M. Ahmed
1,*
1
Physiology Division, Department of Zoology, Faculty of Science, Beni-Suef University, Beni Suef 62521, Egypt
2
Department of Anatomy and Embryology, Faculty of Veterinary Medicine, Beni-Suef University, Beni Suef 62521, Egypt
3
Department of Basic Sciences, Faculty of Oral and Dental Medicine, Nahda University, Beni Suef 62764, Egypt
4
Department of Physics, Faculty of Science, King Khalid University, Abha 62529, Saudi Arabia
*
Author to whom correspondence should be addressed.
Pharmaceuticals 2023, 16(1), 34; https://doi.org/10.3390/ph16010034
Submission received: 11 October 2022 / Revised: 25 November 2022 / Accepted: 18 December 2022 / Published: 27 December 2022
(This article belongs to the Special Issue Natural Products in Diabetes Mellitus)

Abstract

:
The purpose of this study was to see how chrysin and/or bone marrow-derived mesenchymal stem cells (BM-MSCs) affected streptozotocin (STZ)/nicotinamide (NA)-induced diabetic rats as an animal model of type 2 diabetes mellitus (T2DM). Male Wistar rats were given a single intraperitoneal (i.p.) injection of 60 mg STZ/kg bodyweight (bw) 15 min after an i.p. injection of NA (120 mg/kg bw) to induce T2DM. The diabetic rats were given chrysin orally at a dose of 100 mg/kg bw every other day, BM-MSCs intravenously at a dose of 1 × 10⁶ cells/rat/week, and their combination for 30 days after diabetes induction. The rats in the diabetic group displayed impaired oral glucose tolerance and a decrease in liver glycogen content and in serum insulin, C-peptide, and IL-13 levels. They also had significantly upregulated activities in terms of liver glucose-6-phosphatase and glycogen phosphorylase and elevated levels of serum free fatty acids, IL-1β, and TNF-α. In addition, the diabetic rats exhibited a significant elevation in the adipose tissue resistin protein expression level and a significant decrease in the expression of adiponectin, insulin receptor-beta subunit, insulin receptor substrate-1, and insulin receptor substrate-2, which were associated with a decrease in the size of the pancreatic islets and in the number of β-cells and insulin granules in the islets. The treatment of diabetic rats with chrysin and/or BM-MSCs significantly improved the previously deteriorated alterations, with chrysin combined with BM-MSCs being the most effective. Based on these findings, it can be concluded that combining chrysin with BM-MSCs produced greater additive therapeutic value than using them separately in NA/STZ-induced T2DM rats.

1. Introduction

Diabetes mellitus (DM) is a debilitating, long-term disease that arises when the body is unable to produce enough insulin or is unable to use the insulin produced efficiently. The primary DM types include type 1, type 2 DM (T2DM), and gestational DM [1]. DM affected approximately 537 million people worldwide in 2021 and is expected to affect 643 million and 784 million people by 2030 and 2045, respectively, according to the International Diabetes Federation (IDF) [2]. Approximately 4.2 million deaths are attributable to DM and its complications [2]. T2DM is marked by a severe elevation in the blood glucose level over the normal values due to both insulin resistance and insufficient insulin secretion [3]. It is the most prevalent type of disease, responsible for around 90% of all cases of diabetes globally [2]. The general aims of diabetes care are to avoid acute decompensation, prevent or postpone complications in the onset of late disease, decrease mortality, and preserve a good quality of life [4].
Medicinal plants and plant-derived natural agents are among the conventional treatments for DM. The therapeutic assessments of constituents from natural sources have attracted several investigators because they have fewer side effects [5,6]. Flavonoids are a broad class of plant-synthesized polyphenolic compounds, and they are secondary metabolites which have a wide variety of pharmacological properties with limited side effects [7,8,9]. Chrysin (5,7-dihydroxyflavone) belongs to the flavone family of polyphenolic compounds, and its major natural origins are various plant extracts, propolis, blue passionflower (Passiflora caerulea), and honey [7,10]. Recently, chrysin was reported to demonstrate anti-hyperglycemic, anti-inflammatory, and antioxidant activities in several experimental animals [9,11]. Satyanarayana et al. [12] disclosed that chrysin possessed anti-diabetic, antidyslipidemic, and other properties that reduce inflammation in rats that have developed type 2 diabetes as a result of a high-fat diet. Moreover, chrysin attenuated nicotinamide/streptozotocin (NA/STZ)-induced T2DM rats by improving oral glucose tolerance [13].
Stem cell therapy was successfully implemented in preclinical and clinical DM trials [14,15]. The transplantation of islet cells was formerly thought to be a feasible therapeutic strategy. Due to the scarcity of participants, ethical dilemmas, and the possibility of immunogenicity, this method is not frequently used [16]. One of the most appropriate categories of multipotent adult stem cells, mesenchymal stem cells (MSCs), are readily available from bone marrow (BM), adipose tissues, the umbilical cord, umbilical cord blood, and dental pulp [17,18]. MSCs are undifferentiated cells that possess the properties of self-renewal, the expansion in the presence of culture medium, the activation of endogenous progenitor cells, the modulation of the local environment, the secretion of various factors, and low immunogenicity, but they come with a number of ethical concerns [19,20].
Recent studies have indicated that BM-derived MSCs (BM-MSCs) could potentially exert anti-diabetic effects in a HFD/STZ rat model of T2DM that resulted in the recovery of pancreatic islets, increased insulin secretion, the correction of hyperglycemia, and ameliorated insulin sensitivity [19,20,21,22]. In another animal model, the effect of BM-MSCs therapy in NA/STZ-induced T2DM rats was reported by Hamza et al. [23], who stated their potential effects in ameliorating elevated blood glucose levels.
Several researchers have claimed that the implantation or intravenous injection of MSCs reduced blood glucose levels and improved the regeneration of pancreatic islets [20,21,22,23,24,25]. In T2DM, there is the excessive production of reactive oxygen species and pro-inflammatory and inflammatory cytokines [3,26,27]. Thus, the use of natural products or plant constituents that have both antioxidant and anti-inflammatory properties may potentiate the efficiency of MSCs in the treatment of the disease. The use of a natural flavone, chrysin, which has antioxidant and anti-inflammatory properties [7,10,11,12], may boost stem cell therapy in T2DM. To the best of our knowledge, no such research has yet been published.
Hence, this research sought to examine the therapeutic potential of chrysin and/or BM-MSCs, with a focus on their modes of action, in NA/STZ-induced T2DM in albino rats.

2. Materials and Methods

2.1. Reagents and Chemicals

DMEM, Dulbecco’s modified Eagle’s high-glucose medium, contains 2 mM L-glutamine without ribonucleosides and ribonucleotides (cat. no. BE12-604F). Penicillin–streptomycin antibiotic mixture (cat. no. 17-602F), 1X phosphate-buffered saline (cat. no. 17-516F), and 0.25% trypsin/1 mM ethylenediaminetetraacetic acid (cat. no. CC-5012) were obtained from Lonza, Belgium. Fetal bovine serum (cat. no. S-001C-BR) was obtained from Life Science Production, Brazil. Sodium hydrogen carbonate (NaHCO3) (cat. no. 144-55-8) was delivered from LOBA Chemie (India). Chrysin (5,7-dihydroxyflavone) was purchased from MRM Nutrition, USA. STZ [2-deoxy-2-(3-(methyl-3-nitrosoureido)-Dglucopyranose] (cat. no. 18883-66-4) and NA (cat. no. 98-92-0) were sourced from Sigma-Aldrich (St. Louis, MO, USA).

2.2. Experimental Animals

Male rats of the Wistar strain (age: 8–9 weeks, weight: 100–120 g) were sourced from the animal house of the Egyptian Company for the Production of Sera and Vaccines (VACSERA; Helwan, Egypt). To allow acclimation and rule out any concurrent infections, the animals were kept under observation for roughly 15 days prior to the experiment’s start. The chosen animals were kept in well-ventilated polypropylene cages with a regular 12-h light/dark cycle, a humidity of 55 ± 5%, and an ambient temperature of 25 ± 5 °C. The Experimental Animal Ethics Committee for Care and Use of Animals at Beni-Suef University in Egypt gave their clearance (Ethical Approval Number: BSU/FS/2017/21).

2.3. Isolation, Culture, and Characterization of BM-MSCs

BM-MSCs were isolated and cultured according to the procedure described by Chaudhary and Rath [28] and in our past publications [29,30,31]. Trypan blue (0.4%) was used to check the vitality of the cultivated cells prior to injection; the results showed that this was 95%. Moreover, reverse transcription polymerase chain reaction (RT-PCR) analysis was used to describe the cells using positive (CD73 and CD105) and negative (CD34 and CD45) BM-MSCS markers [32,33].

2.4. Induction of T2DM Animal Model

A single intraperitoneal (i.p.) injection of 60 mg STZ/kg bw was administered after 15 min of NA i.p. injection (120 mg/kg body weight) to the overnight-fasted rats in order to induce T2DM [34,35,36]. STZ was dissolved in citrate buffer (pH 4.5), while NA was dissolved in 0.9% saline solution. After 10 days, STZ-injected rats that had been fasting overnight (10–12 h) were orally given 3 g/kg bw of glucose (dissolved in distilled water) by oral gavage. Blood samples were drawn from the lateral tail vein by puncture after two hours of oral glucose delivery, and blood glucose levels were measured using a glucometer (GM100; Bionime Corporation, Taichung, Taiwan). We selected in our study the rats that had a 2-h blood glucose level more than 200 mg/dL.

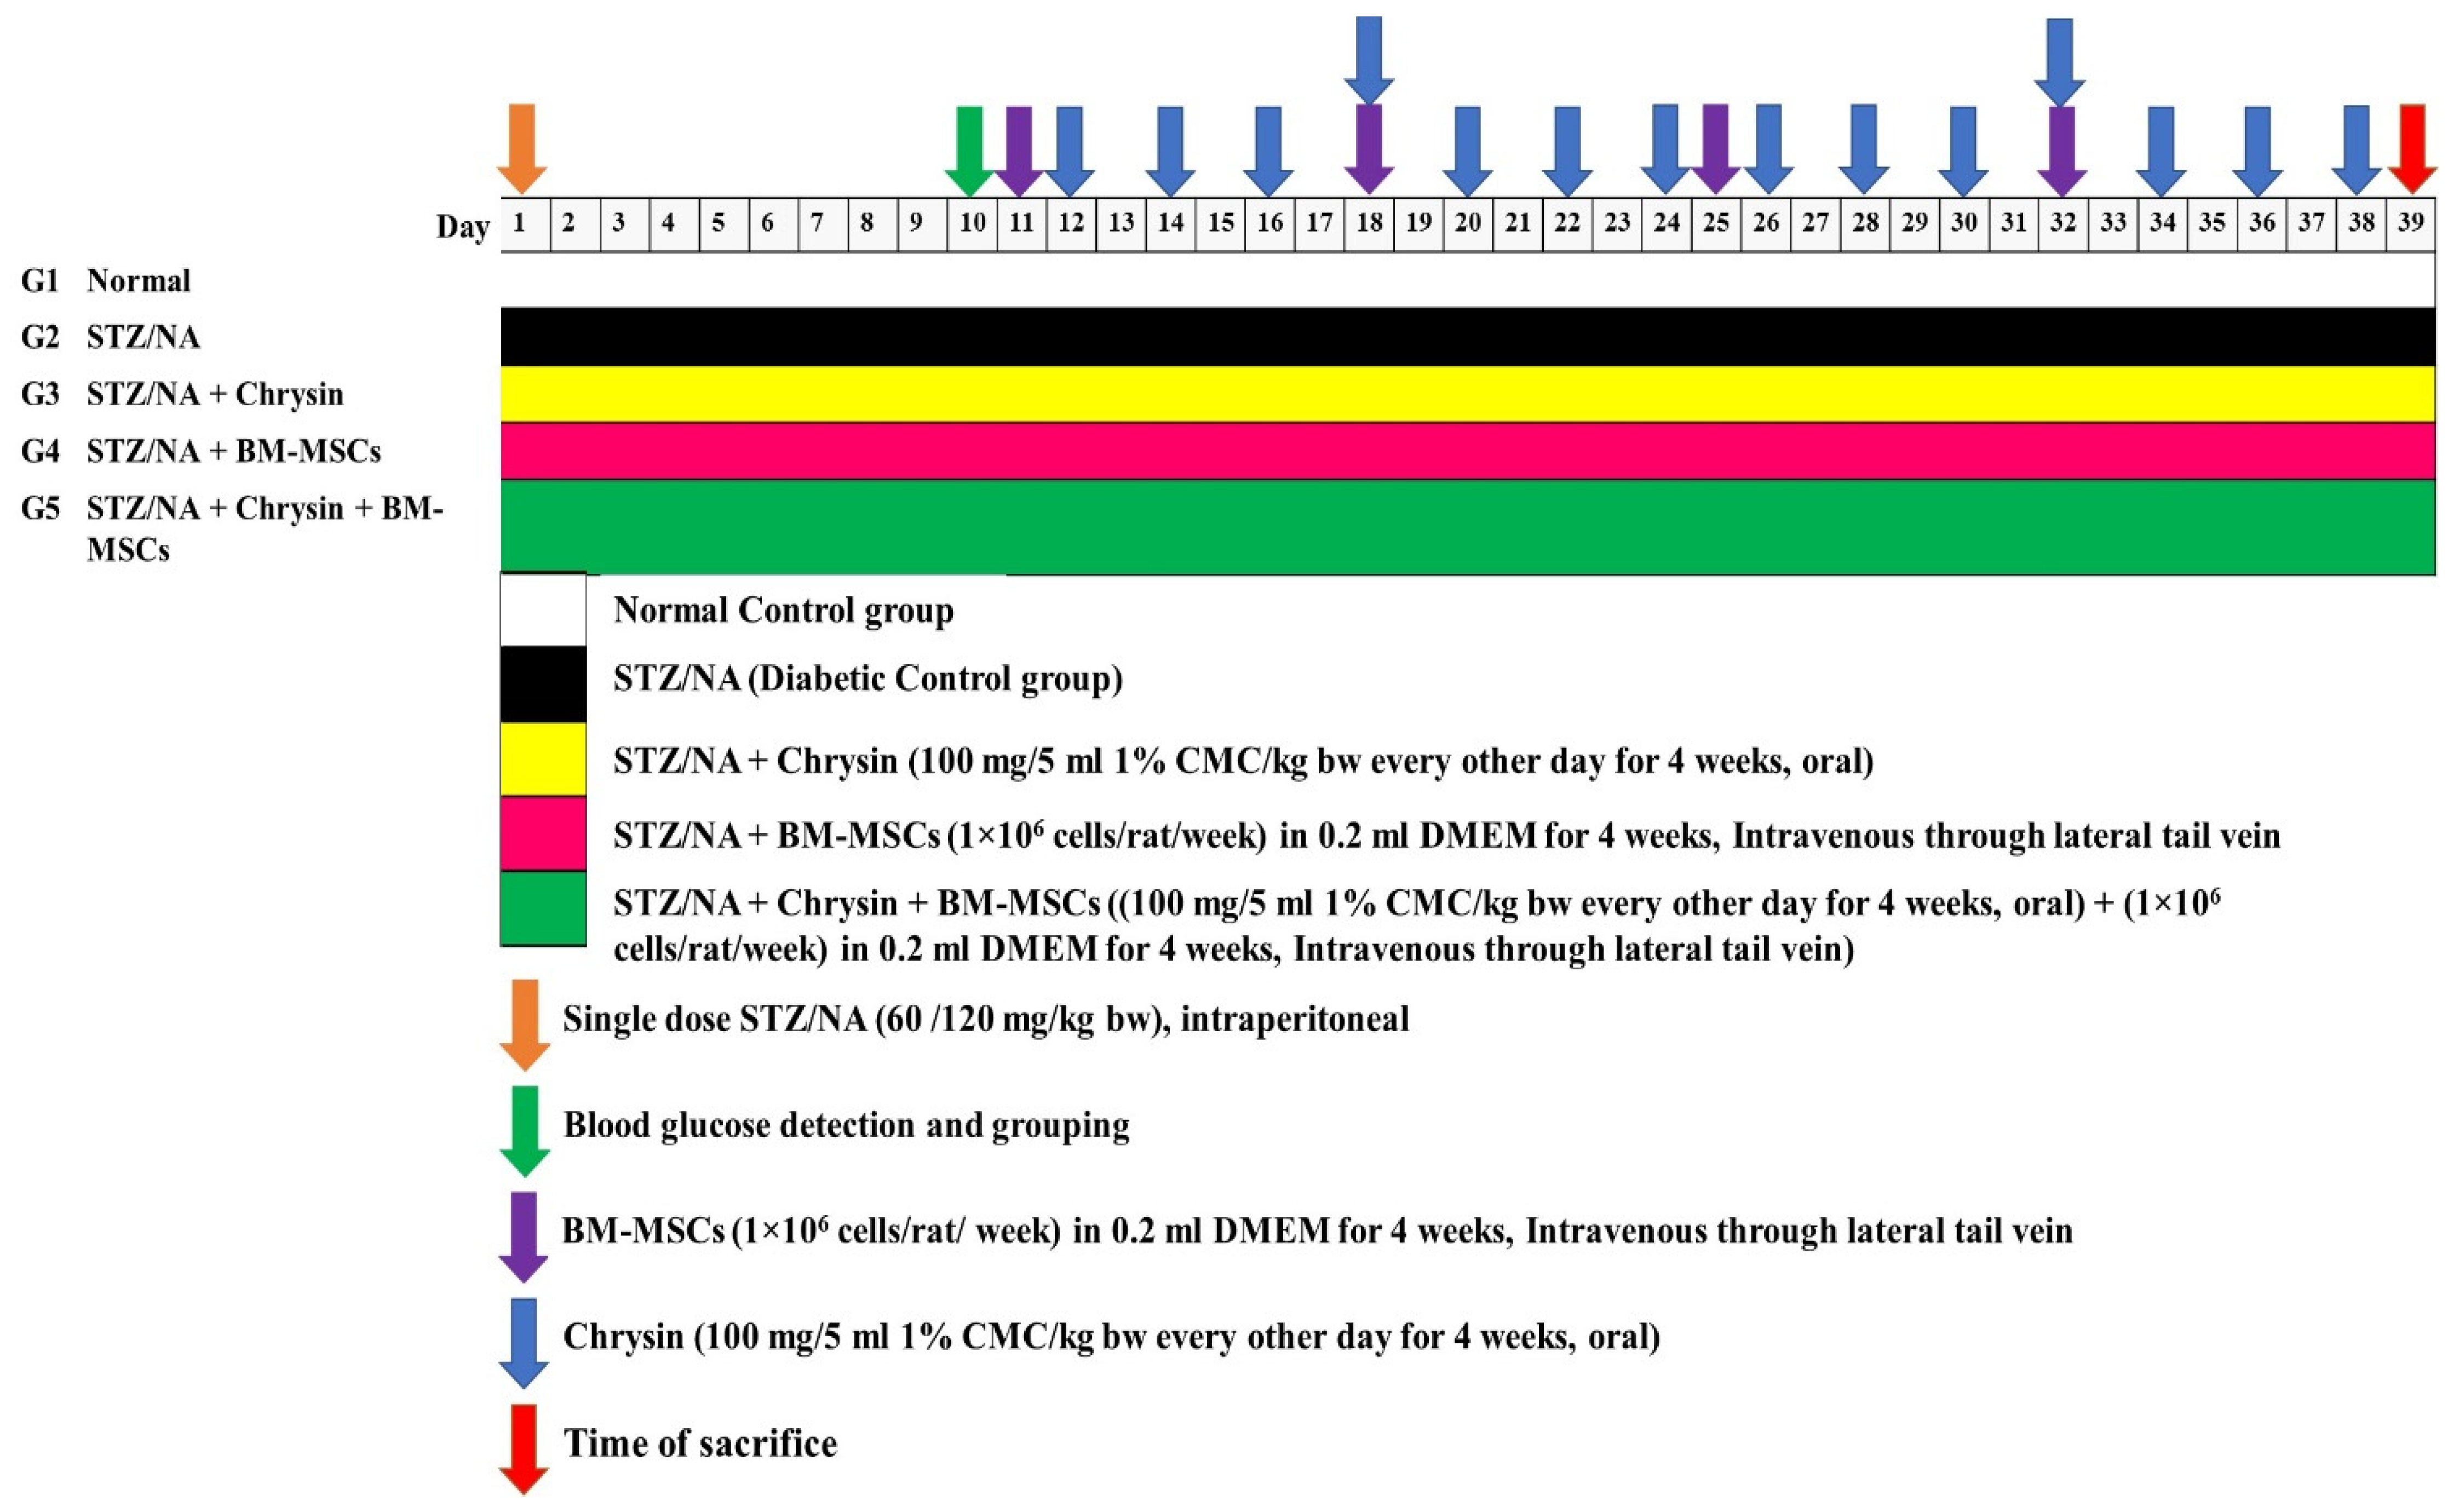
2.5. Experimental Protocol

In this study, a total of 30 male albino rats were randomly assigned to five groups, each consisting of six rats, and were given unlimited access to food and water for the duration of the study, as follows (Figure 1):
Group 1 (normal control): this group were healthy rats and received an equivalent volume of DMEM (0.2 mL/rat) intravenously in the lateral tail vein every week and 1% carboxymethylcellulose (CMC) via oral gavage (5 mL/kg bw) every alternate day.
Group 2 (diabetic control): this group included diabetic rats that received a weekly intravenous injection of DMEM (0.2 mL/rat) in the lateral tail vein and 1% CMC (5 mL/kg bw) via oral gavage every alternate day all the way through the time of study.
Group 3 (diabetic rats treated with chrysin): this group included diabetic rats that orally received chrysin at the dose level of 100 mg/5 mL of 1% CMC/kg bw [12,37] every alternate day until the end of the study (four weeks). Additionally, for a period of four weeks, this group received an equivalent volume of DMEM (0.2 mL/rat) intravenously in the lateral tail vein.
Group 4 (diabetic rats treated with BM-MSCs): this group consisted of six diabetic rats that were treated with 1 × 10⁶ cells/rat in 0.2 mL of DMEM through intravenous injection into lateral tail vein every week for a period of four weeks. Additionally, for four weeks, this group received an oral gavage dosing of 1% CMC (5 mL/kg bw) every other day.
Group 5 (diabetic rats treated with chrysin and BM-MSCs): this group included six diabetic rats, which were treated with BM-MSCs every week in the same way as group 5 and were orally treated with chrysin at a dose level of 100 mg/5 mL of 1% CMC/kg bw every other day for four weeks.

2.6. Sampling and Tissue Preparation

At the end of the experiment, the rats were fasted for an entire night before blood samples were taken from the jugular vein under diethyl ether inhalation anaesthesia. The blood samples were drawn into gel and clot activator tubes, allowed to clot, and then centrifuged for 15 min at 3000 rpm. With a Pasteur pipette, the clear, non-hemolyzed supernatant sera were promptly collected into three Eppendorf tubes for each animal and kept at 80 °C until further use for the detection of insulin, C-peptide, tumor necrosis factor-alpha (TNF-α), interleukin-1β (IL-1β), and IL-13 levels. The rats were euthanized, then quickly dissected. Their visceral adipose tissues were removed and kept at 80 °C until resistin, adiponectin, insulin receptor beta subunit (IR-Bs), insulin receptor substrate 1 (IRS-1), and insulin receptor substrate 2 (IRS-2) expression as well as the glucose-6-phosphatase (G-6-Pase), glycogen phosphorylase activities, and glycogen content in the liver were measured. For histological and immunohistochemical analyses, the pancreas was removed and fixed in 10% neutral buffer formalin (NBF).

2.7. Oral Glucose Tolerance Test (OGTT)

The OGTT was carried out the day before the sacrifice by measuring the blood glucose levels in overnight-fasted healthy, diabetic control, and normal rats treated with chrysin and/or BM-MSCs at 0, 30, 60, 90, and 120 min after the administration of oral glucose (3 g/kg bw). The blood glucose levels were measured using a BIONIME GM100 glucometer.

2.8. Serum Fasting C-Peptide and Insulin Analysis

Following the manufacturer’s instructions, a sandwich enzyme-linked immunosorbent assay (ELISA) kit from MyBioSource (USA) was used to assess the levels of fasting serum insulin and C-peptide (Catalog Number: MBS724709 and MBS704133, respectively).

2.9. Serum-Free Fatty Acids (FFAs)

The method outlined by Duncombe [38] was used to estimate the serum FFAs level.

2.10. Detection of Liver Glycogen Content, G-6-Pase, and Glycogen Phosphorylase Activities

Using reagents prepared in the lab, the liver glycogen content was determined according to the method of Seifter et al. [39], and G-6-Pase and glycogen phosphorylase activities were detected based on the procedures of Begum et al. [40] and Stalmans and Hers [41], respectively.

2.11. Detection of Serum IL-1β, TNF-α, and IL-13

According to the manufacturer’s instructions, the RayBio® Rat IL-1 ELISA kit (Catalog No: ELR-IL1) and the BioLegend Rat TNF-ELISA kit (Catalog No: 438205) procured from RayBiotech (Norcross, GA, USA) and BioLegend, Inc (San Diego, CA, USA), respectively, were used to measure the blood levels of IL-1 and TNF- as pro-inflammatory cytokines. Using the rat IL-13 ELISA kit (Catalog No: MBS175932) acquired from MyBioSource (San Diego, CA, USA) and used in accordance with MyBioSource’s instructions, serum IL-13 was identified as an anti-inflammatory cytokine.

2.12. Detection of BM-MSCs’ Different CDs’ mRNA Expression

The total RNA was extracted from the adipose tissues using the Direct-zol RNA Miniprep kit (Zymo Research, Irvine, CA, USA) (Catalog No. R2050) based on the manufacturer’s instructions. Thermo Scientific’s RevertAid First-Strand cDNA synthesis kit (Catalog No. AB1454LDB) was used to create cloned DNA (cDNA), which was then amplified using the Thermal cycler Techne 312 in the presence of specific forward and reverse primers (Fisher Scientific, Leicestershire, LE11 5RG). RNA was reverse transcribed into cDNA in a single step, and the cDNA that was created was amplified using a Techne 312 Thermocycler. The Cleaver Scientific Ltd. MP-300V Power System electrophoresed PCR products at 90 volts on a 1.5% agarose gel stained with ethidium bromide in a 1X Tris borate EDTA buffer (TBE; pH 8.3–8.5). A UV transilluminator was used to observe the electrophoretic image, which was then captured on camera and analyzed using the ImageJ 1.52v java 1.8.0 112 (64-bit) application [42]. The primer pair sequences used included: for CD73 5’-TGCATCGATATGGCCAGTCC-3’ (forward) and 5’-AATCCATCCCCACCGTTGAC-3’ (reverse) [32], for CD105 5’-ACTGAGTTGCACATCTGGGG-3’ (forward) and 5’-TTCCGAAGTGGTGGTAAGCC-3’ (reverse) [32], for CD34 5’-AGCCATGTGCTCACACATCA-3’ (forward) and 5’-CAAACACTCGGGCCTAACCT-3’ (reverse) [32], and for CD45 5’-TTGCTCCCCATCCGATAAGAC-3’ (forward) and 5’-AGCGTGGATGAAAAACCATCG-3’ (reverse) [32]. The primers were obtained from LIGO Scientific Collaboration through National BioLab, Cairo, Egypt.

2.13. Western Blotting Analysis

The adipose tissue sample was homogenised using the ReadyPrepTM protein extraction kit (Bio-Rad Inc; Catalog No: 163-2086). The Bradford protein assay kit (SK3041) for quantitative protein analysis offered by Bio Basic Inc. was used in accordance with the manufacturer’s instructions (Markham, Ontario L3R 8T4 Canada). In an equal volume of 2X Laemmli sample buffer that also contained SDS (4%), 2-mercaptoehtanol (10%), glycerol (20%), bromophenol blue (0.004%), and Tris HCl (0.125 M), 20 μg of the protein concentration of each sample was loaded. The pH was measured and set at 6.8. Each of the previous mixtures was boiled at 95 °C for 5 min to induce protein denaturation prior to loading on polyacrylamide gel electrophoresis. The polyacrylamide gels were created using Bio-Rad Laboratories Inc.’s TGX Stain-FreeTM FastCastTM Acrylamide Kit (SDS-PAGE) (Catalog No. 161-0181). According to the manufacturer’s instructions, the SDS-PAGE TGX Stain-Free FastCast was created. From below to above, the gel was built in a transfer sandwich (filter paper, PVDF membrane, and gel and filter paper). The sandwich was placed in a transfer tank containing 1X transfer buffer (Tris (25 mM), glycine (190 mM), and methanol (20%).
The blot was passed through the Bio-Rad Trans-Blot Turbo for 7 min at 25 V to allow the protein bands to move from the gel to the membrane. The membrane was blocked in Tris-buffered saline with Tween 20 (TBST) buffer and 3% bovine serum albumin for 1 h at room temperature. Adiponectin, resistin, IR-Bs, IRS-1, and IRS-2 primary antibodies were purchased. Following the manufacturer’s directions, these primary antibodies were diluted in TBST. The blotted target protein was incubated with each primary antibody solution for the entire night at 4 °C. For five minutes, the blot was rinsed three–five times with TBST. The secondary antibody solution (goat anti-rabbit IgG-HRP-1 mg Goat mab-Novus Biologicals) was HRP-conjugated and treated with the blotted target protein for 1 h at room temperature. With the TBST buffer, the blot was washed three–five times for 5 min. Clarity TM Western ECL Substrate Bio-Rad (Catalog No: 170-5060), a chemiluminescent substrate, was added to the blot in accordance with the manufacturer’s instructions. Briefly, solution A (Clarity Western luminal/enhancer solution) and solution B were blended in equal parts (peroxidase solution). The chemiluminescent signals were gathered using a CCD camera-based imager. Using protein normalization on the ChemiDoc MP imager, image analysis software was used to compare the band intensity of the target proteins to that of the housekeeping protein β-actin in the control sample.

2.14. Histological Investigation

Each rat’s pancreas was removed following dissection after four weeks, and it was then fixed in 10% (v/v) NBF for 48 h. All specimens were then cleared, paraffin-embedded for 24 h at 56 °C in a hot air oven, and transferred to 70% alcohol for histological analysis. The paraffin wax blocks for the pancreas were ready for cutting at 5 m. Trichrome-PAS was used to stain the acquired tissue sections [43,44]. A high-power microscope was used for the investigation, and a camera was used to create photomicrographs.

2.15. Immunohistochemical Investigation

Each pancreas was routinely treated for paraffin embedding after being fixed in 10% (v/v) NBF. Sections of the tissue blocks that were 5-µm thick were taken off. Rat insulin (polyclonal antibody) immunohistochemistry was carried out using the streptavidin-biotin-peroxidase staining technique [45]. All sections were incubated with the same amount of antibodies at the same time and under the same conditions, allowing the results of the immunostaining to be compared between the various experimental groups. Using a photomicrograph camera and high-power light microscopy, the binding of antibodies was studied. Three random fields were estimated for each section. The number of sections in each group was six. ImageJ (1.51 d), a free software program, was used to measure the integrated density and area fraction of immune positivity of insulin granules [42].

2.16. Statistical Analysis

The mean and standard error served as a general illustration of the results. The GraphPad Prism software (version 8.0.2; GraphPad Software, San Diego, CA, USA) was used to perform a one-way analysis of variance (ANOVA), followed by a Tukey’s post hoc analysis test to assess the statistical differences between the groups. Significant differences were defined as those with a p-value < 0.05. Percentage changes were calculated by comparing the diabetic control with normal and diabetic treated groups with diabetic control by using the equation: % change = [(Final–Initial)/Initial] × 100. The area under curve (AUC) for the OGTT was also calculated the GraphPad Prism software.

3. Results

3.1. Characterization of MSCs

Under inverted microscopy, the separated MSCS were verified for adherence and spindle shape, after which MSC-specific markers including CD73 and CD105 were expressed, with CD34 and CD105 being negatively expressed (Figure 2).

3.2. Effect of Chrysin and BM-MSCs on Oral Glucose Tolerance in NA/STZ-Induced Diabetic Rats

Following the delivery of glucose at a dose of 3 g/kg bw, blood glucose levels in rats were assessed at 0, 30, 60, 90, and 120 min (Figure 3). The blood glucose levels of the diabetic control rats continued to rise up until 60 min and they subsequently decreased at 90 and 120 min. The blood glucose levels were considerably (p < 0.05) elevated at all phases of the OGTT following the administration of glucose relative to normal rats. A significant (p < 0.05) improvement in the increased glucose levels was seen in the diabetic rats treated with chrysin, BM-MSCs, and their combination. The combination was discovered to be the most effective method for lowering the blood glucose levels of diabetic rats when they were fasting, and the effectiveness peaked 60, 90, and 120 min after oral glucose administration.
The calculated AUC for the OGTT in Table 1 was significantly (p < 0.05) increased in the diabetic rats when compared to the normal rats. The treatment of diabetic rats with chrysin, BM-MSCs, and their combination produced a significant decrease (p < 0.05) in the AUC. The recorded percentage changes were −30.09, −19.43, and −36.03, respectively. Thus, the combinatory effect was the most potent in improving the oral glucose tolerance.

3.3. Effect of Chrysin and BM-MSCs on the Serum Insulin and C-Peptide Levels in NA/STZ-Induced Diabetic Rats

When compared to the normal control rats, the diabetic rats’ serum levels of insulin and C-peptide significantly (p < 0.05) reduced, with percentage changes of 64.86 and 71.64%, respectively. The serum insulin levels in diabetic rats treated with chrysin, BM-MSCs, and chrysin plus BM-MSCs increased significantly (p < 0.05), with percentage changes of 122.98, 136.90, and 138.56%, respectively, when compared with the diabetic control. Additionally, there were changes in the serum C-peptide level of 101.34, 143.70, and 130.28%, respectively (Table 2). Although the serum insulin and C-peptide levels significantly (p < 0.05) increased in the diabetic rats treated with chrysin and/or BM-MSCs, they did not return to normal levels. They remained significantly lower (p < 0.05) than the normal values.

3.4. Effect of Chrysin and BM-MSCs on Serum Free Fatty Acid Levels in NA/STZ-Induced Diabetic Rats

Table 3 demonstrates the effect of chrysin and BM-MSCs on the FFAs of diabetic rats. When compared to the control group, the NA/STZ-induced diabetic rats showed a significant increase (p < 0.05) in serum FFAs. The increased serum FFAs levels were significantly reduced (p < 0.05) in diabetic rats after treatment with chrysin and BM-MSCs. The serum FFAs levels of diabetic groups treated with chrysin and BM-MSCs returned to values that were not significantly (p > 0.05) different to normal levels.

3.5. Effects on Liver Glycogen Content, G-6-Pase, and Glycogen Phosphorylase Activities in NA/STZ-Induced Diabetic Rats

In comparison with the normal group, the diabetic control rats’ liver glycogen content showed a significant decrease (p < 0.05); the measured percentage drop was −52.69%. The liver glycogen content of NA/STZ-induced diabetic rats significantly increased (p < 0.05) after receiving chrysin, BM-MSCs, or chrysin plus BM-MSCs. The liver glycogen content of NA/STZ-induced diabetic rats increased most effectively with chrysin plus BM-MSCs; the measured percentage increase in comparison to the diabetic control was 68.20%. Although the liver glycogen content significantly (p < 0.05) increased in the diabetic rats treated with chrysin and/or BM-MSCs, it did not return to normal. It remained significantly lower (p < 0.05) than the normal values (Table 4).
On the other hand, compared to the normal group, the NA/STZ-induced diabetic rats’ liver G-6-Pase and glycogen phosphorylase activities showed a substantial increase (p < 0.05); the observed percentage changes were 93.08% and 120.53%, respectively. The enhanced enzyme activities in NA/STZ-induced diabetic rats were significantly improved (p < 0.05) by the administration of chrysin, BM-MSCs, and chrysin combined with BM-MSCs; however, they remained significantly higher than normal levels (p < 0.05) (Table 4).

3.6. Effect on IL-1β, TNF-α, and IL-13 Levels

When compared to the serum of the normal rats, the levels of the pro-inflammatory cytokines IL-1 and TNF-α in the NA/STZ-induced diabetic rats showed a substantial (p < 0.05) elevation. The serum levels of IL-1 and TNF-α were significantly (p < 0.05) reduced in the diabetic rats treated with chrysin, BM-MSCs, and chrysin + BM-MSCs. When compared to the serum of normal rats, the anti-inflammatory cytokine IL-13, however, showed a substantial (p < 0.05) drop in diabetic rats. Chrysin, BM-MSCs, and chrysin plus BM-MSCs treatment resulted in a significant (p < 0.05) rise in serum IL-13 levels in diabetic rats (Table 5). Chrysin plus BM-MSCs treatment was the most potent treatment in decreasing the elevated serum TNF-α level in diabetic rats compared to the normal level.

3.7. Effects on the Protein Expression Levels of Resistin and Adiponectin

Figure 4 shows the data on how resistin and adiponectin expressions in the adipose tissues of NA/STZ-induced T2DM rats were affected by chrysin, BM-MSCs, and chrysin plus MSCs. When compared to normal rats, NA/STZ-induced diabetic rats showed a significantly higher level of resistin expression (p < 0.05) and a significantly lower level of adiponectin expression relative to β-actin. As opposed to the diabetic control group, diabetic rats treated with chrysin, BM-MSCs, and chrysin plus MSCs showed a significant enhancement in every parameter (p < 0.05).

3.8. Effects on the Protein Expression Levels of IR-Βs, IRS-1, and IRS-2

Figure 5 shows the data concerning the effects of chrysin, BM-MSCs, and chrysin plus MSCs on IR-Bs, IRS-1, and IRS-2 expressions relative to the expression of β-actin in the adipose tissues of NA/STZ-induced T2DM rats. When compared to the expression of β-actin in the normal rats, the diabetic rats showed a significantly lower level of IR-s, IRS-1, and IRS-2 expression (p < 0.05). In contrast, diabetic rats given chrysin, BM-MSCs, or chrysin plus MSCs showed a significant improvement in all parameters (p < 0.05) when compared to the diabetic control.

3.9. Effects of Chrysin and BM-MSCs on Histological Changes in the Pancreas in NA/STZ-Induced Diabetic Rats

Figure 6 shows the pancreatic histological architectures of normal, NA/STZ-administered, and NA/STZ-administered rats treated with chrysin, BM-MSCs, and their combination. The normal control group’s pancreas sections demonstrated a typical histological architecture composed of densely packed lobules of pancreatic acinar cells. The alpha cells and exocrine sections contained the islets of Langerhans (Figure 6A). The endocrine sections of the pancreas of NA/STZ-administered rats showed histological abnormalities, which were manifested by a notable reduction in the size and number of cells and islets in other portions (Figure 6B). The NA/STZ-administered group was treated with chrysin (Figure 6C), BM-MSCs (Figure 6D), and their combination (Figure 6E) and exhibited a marked improvement in pancreas histological abnormalities, resulting in virtually normal structures in terms of the islets of Langerhans.

3.10. Effects of Chrysin and BM-MSCs on Pancreas Immunohistochemical Staining of Insulin in NA/STZ-Induced Diabetic Rats

Photomicrographs of the immunohistochemical staining of insulin pancreatic islets of all groups were analyzed by using the ImageJ 1.52v java 1.8.0_112 (64-bit) program [42] to the achieve integrated density and area fraction. The normal rats displayed an intense insulin immunopositive reaction to anti-insulin antibodies, as brown granules occupied most of the islets (Figure 6A,B). The immunoreactivity for anti-insulin antibodies in the rat pancreas in the NA/STZ-induced diabetic group was significantly decreased (p < 0.05) in terms of the integrated density and area fraction (Figure 7C,D). Treatment with chrysin (Figure 7E,F), BM-MSCs (Figure 7G,H), and chrysin plus BM-MSCs (Figure 7I,J) resulted in a significant increase (p < 0.05) in the integrated density and area fraction when compared to the NA/STZ-induced diabetic group (Table 6).

4. Discussion

Increased levels of blood glucose, insulin resistance, and relative insulin deficiency are the characteristics of T2DM [11,35]. Thus, the physiological modulation of glucose levels in the blood can be restored either by increasing the β-cell mass or by enhancing the tissue insulin sensitivity. Similar to endothelial progenitor cells, BM-MSCs can help β-cells recover from injury [24,46] owing to their higher differentiation potential, immunosuppressive characteristics, anti-inflammatory activities, [46] and supportive micro-environmental niche [47]. Various medicinal plants have been estimated to contain flavonoids that exert beneficial and safe effects on diabetes relative to conventionally synthetic drugs [7,48,49]. The NA/STZ rat model was applied as a T2DM model based on NA’s protective effects against STZ’s toxic effects on β-cells [50]. The severity of DM is, however, somewhat lessened if NA is administered prior to STZ, resulting in a state that is similar to T2DM, with impaired insulin sensitivity [51,52,53]. As a result, the NA/STZ-induced diabetic rat model was chosen for our investigation to examine the effects of chrysin, BM-MSCs, and chrysin plus BM-MSCs.
In the present investigation, rats that had been given NA/STZ to induce T2DM showed impaired oral glucose tolerance, a significant increase in the AUC of the OGTT, and a significant reduction in serum levels of C-peptide and insulin. These outcomes line up with earlier published reports [35,42,54].
The chrysin therapy, in the present study, resulted in a significant improvement in the deteriorated oral glucose tolerance and significant decrease in the AUC of the OGTT combined with a large increase in the fallen serum insulin level in the NA/STZ-induced diabetic rats. These findings corroborate those of Satyanarayana et al. [12], who reported that the oral administration of chrysin for 10 consecutive days improved the OGTT and raised the serum insulin level after 45 days of treatment in diabetic rats. Additionally, our current research backs up the findings of Anitha and Rajadurai [13], who claimed that the prevention of defective insulin-signaling molecules and glucose tolerance was responsible for the anti-diabetic activity of chrysin after 30-days post-induction of T2DM in rats. Similar to this, Ramrez-Espinosa et al. [11] observed that the insulin-sensitizing activity of chrysin caused a significant decrease in serum glucose levels 10 days after oral chrysin administration to NA/STZ-induced diabetic mice.
Other researchers have also published their analyses of chrysin’s anti-diabetic benefits [7,10,55]. The current investigation showed that diabetic rats treated with chrysin saw a rise in the C-peptide level that was consistent with the pattern of changes in the serum insulin level. The blood C-peptide level was utilized as a good predictor of any change in insulin levels since it was co-secreted with insulin from the pancreatic cells as a consequence of the conversion of proinsulin to insulin (Figure 8) [56]. In terms of other models of T2DM, our results support those of Li et al. [19], Hussien et al. [20], Si et al. [22], and Hao et al. [57], who reported that BM-MSCs infusions enhanced the status of hyperglycemia, serum C-peptide, and insulin in T2D rats induced by a fat-fed diet and STZ. The ameliorative effect of chrysin and BM-MSCs was also confirmed by the improvement in the histological architecture of the Trichrome-PASS stain and the increase in insulin immunoreactivity. The pancreas of control animals exhibited the typical lobular histological architecture of the islets of Langerhans and pancreatic acini. In the present study, the islet numbers and diameter were markedly reduced in NA/STZ-induced diabetic rats, supporting the results of Al-Hariri et al. [58], who observed fewer Langerhans islets in diabetic rats than in control rats. The diabetic rats treated with chrysin, BM-MSCs, and chrysin plus BM-MSCs indicated a marked improvement in the amount and size of Langerhans islets. These outcomes matched those of Hamza et al. [23], who reported that the treatment of NA/STZ-induced diabetic rats with BM-MSCs restored the normal histology of pancreatic islets. Moreover, the immune reactivity for anti-insulin antibodies was decreased markedly in diabetic rats. The treatment with chrysin, BM-MSCs, and their combination resulted in a high immunoreactivity to anti-insulin antibodies, which was demonstrated by the increased integrated density and area fraction. The enhanced histological architecture and integrity of the pancreatic islet can be attributed to the capacity of BM-MSCs to facilitate the regeneration of endogenous pancreatic islet β-cells by migrating to the damaged islet cells and their involvement in the repair processes by secreting different growth factors and cytokines in both paracrine and autocrine operations. In addition, chrysin acts as an insulin sensitizer and exerts anti-inflammatory effects [59].
According to reports, elevated FFA levels in the blood of NA/STZ-injected rats may lead to insulin resistance and decreased glucose tolerance [60,61]. According to Oh et al. [62], chronically high FFA levels resulted in insulin resistance and β-cell malfunction. As a result, reducing high plasma FFA levels may be a key therapeutic objective in T2DM and obesity. In the present investigation, treatments with chrysin and BM-MSCs effectively reduced the high levels of serum FFAs in the NA/STZ-induced diabetic rats. FFAs affect the expression of genes, especially those involved in the lipid and glucose metabolisms.
Through a variety of mechanisms, including lipotoxicity [63] caused by the toxin effects on pancreatic β-cells, insulin-stimulated glucose transport inhibition [64], and increased adipose tissue lipolysis, elevated levels of FFAs reduce insulin sensitivity. Subsequent FFAs flow to non-adipose tissue, causing excessive endogenous glucose generation, insulin resistance, and the progression of T2DM [65]. Thus, in diabetic rats treated with chrysin and BM-MSCs, the decrease in serum FFAs enhanced the secretory response of β-cells and heightened their insulin-sensitizing properties.
Adiponectin, IR-Bs, IRS-1, and IRS-2 levels were significantly reduced in NA/STZ-induced T2DM rats, while resistin levels were significantly greater. This is an important finding regarding the current study. These findings are corroborated by those of Abdel Aziz et al. [35], who found that there was a large rise in resistin in NA/STZ-induced diabetic rats compared to normal rats, while the mRNA expression of adiponectin and IRs of adipose tissues demonstrated were significantly decreased. Chrysin and BM-MSCs increased the expression of adiponectin, IR-Bs, IRS-1, and IRS-2 in adipose tissue, which can be attributed to a reduction in the levels of serum FFAs in NA/STZ-induced diabetic rats. Adiponectin increases the oxidation of a muscle’s fatty acid and glucose transport via the phosphorylation of AMP-activated protein kinase (AMPK) or Akt [66] and Acetyl-CoA carboxylase inhibition [67], suppresses gluconeogenesis in the liver as a result of lowering G-6-Pase and phosphoenolpyruvate carboxylase expression [68], and increases energy consumption and fatty acid combustion, leading to low amounts of triglyceride in the skeletal muscles and the liver [69]. Through its modulation of glucose and lipid transcriptional factor expression, adiponectin may act as a direct regulator of glucose utilization in adipocytes and adipose tissues [68,70]. The well-known negative relationship between plasma adiponectin levels and insulin resistance suggests that adiponectin is the master regulator of insulin sensitivity and glucose homeostasis [71,72], possibly by activating AMPK. According to previous studies and our results, chrysin and BM-MSCs’ ability to significantly increase adiponectin expression may be the cause of their anti-diabetic impact in NA/STZ-induced diabetic rats. Chrysin and BM-MSC treatment of diabetic rats increased the expression of the IR-Bs, IRS-1, and IRS-2 genes in a manner similar to that of adiponectin in adipose tissues. The increased expression of the IR-Bs, IRS-1, IRS-2, and phosphatidylinositol 3-kinase (PI3K) proteins may play a role in the mechanism underlying insulin signaling.
The results of the current investigation revealed that the expression of resistin in adipose tissues was significantly higher than it was in normal rats, which was consistent with the reduced glucose tolerance in diabetic rats. The findings of Kim et al. [73], who revealed that resistin is produced only in adipocytes and is associated with aspects relating to insulin resistance and obesity, confirm these findings. Additionally, Rajala et al. [74] observed that in DIO mice and Lep ob/ob mice, circulatory resistin concentrations were dramatically elevated and strongly correlated with the increasing levels of glucose, insulin, and lipids. Resistin increases endogenous glucose synthesis, as shown by decreased glycogen synthase activity and the enhanced insulin-independent expression of the genes controlling the hepatic gluconeogenic enzymes G-6-Pase and phosphoenolpyruvate carboxy kinase in liver cells [75,76]. When given to diabetic rats, chrysin and BM-MSCs drastically decreased the expression of resistin in the adipose tissues. The significant anti-diabetic impact of chrysin and BM-MSCs in our investigation could therefore be attributable, at least in part, to their resistin-modulating activity (Figure 8).
The homeostasis of glucose depends on an appropriate balance in terms of glycolysis, glycogen metabolism, and gluconeogenesis [77,78]. Liver glycogen can be considered a good marker for evaluating the hypoglycemic effect of any medicine, particularly in research animals [79,80]. In the current investigation, rats that were administered NA/STZ to cause diabetes showed a decrease in the amount of hepatic glycogen in addition to a marked rise in the activities of the enzymes G-6-Pase and glycogen phosphorylase in comparison to those of control rats. These findings agree with those of Ali et al. [80], Ahmed et al. [81], Pari and Suman [82], Morral [83], and Ahmed [84], who revealed that NA/STZ-induced diabetic rats had decreased hepatic glycogen content and higher hepatic G-6-Pase and glycogen phosphorylase activity. Our research study results expressed a considerable increase in the hepatic glycogen and a significant reduction in the activity of hepatic G-6-Pase and glycogen phosphorylase, possibly due to the restoration of the insulin level that encourages glycogenesis and the increased glucose uptake, after the administration of chrysin, BM-MSCs, and chrysin plus BM-MSCs for treatment, resulting in decreased glucose production and hence an improvement in blood glucose (Figure 8).
By triggering numerous inflammatory responses, pro-inflammatory mediators play a significant role in the emergence of IR and T2DM. The β-cells of pancreatic islets and insulin-sensitive tissues, particularly adipose tissue, experience metabolic stress as a result of elevated blood glucose levels. Numerous pro-inflammatory cytokines, particularly the master pro-inflammatory mediator IL-1β, TNF-α, IL-1, IL-6, and IL-10, are released from these tissues and cause local and systemic chronic low-grade inflammation [85,86]. The activation of pro-inflammatory mediators causes β-cells to undergo apoptosis, amyloidosis, and fibrosis. Once inflammation has occurred, it triggers its harmful effects on the pancreatic islet β-cells by reducing their ability to secrete insulin. Similar to this, IL-β contributes to the progression of insulin resistance in the peripheral tissues by causing inflammation in those tissues as a result of those tissues’ diminished capacity to use insulin in response to glucose [85]. In STZ-NA-induced diabetic mice, alterations in blood glucose levels and insulin levels are accompanied by elevated levels of IL-1β and TNF-α, which is consistent with our findings and has been shown to accompany pancreatic β-cell dysfunction [86,87]. The current investigation showed that chrysin, BM-MSCs, and chrysin plus BM-MSCs therapy of NA/STZ-induced T2DM rats dramatically reduced serum levels and the production of increased pro-inflammatory cytokines IL-1β and TNF-α. These findings concur with those of Ahad et al. [88], who found that the TNF-α pathway was inhibited by chrysin for 16 weeks, resulting in a decrease in the release of pro-inflammatory cytokines and a significant decrease in blood IL-1β levels in diabetic rats. In support, Li et al. [89] reported a significant suppression of the serum IL-1β level in the BM-MSCs group. This combination is the most potent form of treatment. The activated Th2 cells secrete the anti-inflammatory cytokine IL-13 that suppressing the secretion of several inflammatory cytokines from macrophages and monocytes [90,91]. In the absence of IL-13, the postprandial hepatic glucose metabolism was disrupted, and the glucose uptake in the white adipose tissues was reduced, resulting in insulin resistance, postprandial hyperglycemia, weight gain, decreased oxygen consumption, and increased triglyceride levels in the blood and liver [92]. IL-13 may help mitigate the pro-inflammatory responses and the development of insulin resistance in T2DM [90,93], resulting to a return to normal glucose homeostasis [94]. This study demonstrated the amelioration effect of chrysin, BM-MSCs, and chrysin plus BM-MSCs on IL-13 as an anti-inflammatory in NA/STZ-induced T2DM rats, confirming its anti-inflammatory efficacy. In this context, BM-MSCs and chrysin could reduce the serum concentration and the development of the pro-inflammatory cytokines IL-1β and TNF-α, most likely through the effects of both the compounds in the cellular pathway that improve the metabolism of carbohydrates.

5. Conclusions

By lowering inflammation, restoring β-cell functionality, and attenuating insulin resistance whether used alone or in combination, BM-MSCs and chrysin enhanced oral glucose tolerance. The combination of BM-MSCs and chrysin was the most effective treatment. Both chrysin and BM-MSCs may induce insulin sensitization through the downregulation of pro-inflammatory cytokines (such as TNF-α and IL-1β), FFAs, and resistin expression in adipose tissues as well as the upregulation of adipose tissue IR-Bs, IRS-1, and IRS-2, adiponectin expression, and serum IL-13. As a result of their ability to reduce inflammation and improve the glycemic state as well as their involvement in reducing histopathological alterations, we advise combining MSCs and chrysin. Before this combination is authorized for use in the treatment of DM in humans, clinical trials are necessary to evaluate its efficacy and safety.

Author Contributions

Conceptualization, H.M.S., A.S.A., F.E.-Z.S.A.R., M.A.-D., N.S.A.E.-G. and O.M.A.; methodology, H.M.S., A.S.A., F.E.-Z.S.A.R. and O.M.A.; software, H.M.S., M.A.-D., N.S.A.E.-G. and O.M.A.; validation, H.M.S., A.S.A., F.E.-Z.S.A.R., M.A.-D., N.S.A.E.-G. and O.M.A.; formal analysis H.M.S. and O.M.A.; investigation, H.M.S., F.E.-Z.S.A.R. and O.M.A.; resources, H.M.S., M.A.-D. and N.S.A.E.-G.; data curation, H.M.S., A.S.A., F.E.-Z.S.A.R., M.A.-D., N.S.A.E.-G. and O.M.A.; writing—original draft preparation, H.M.S. and O.M.A.; writing—review and editing, H.M.S., A.S.A., F.E.-Z.S.A.R., M.A.-D., N.S.A.E.-G. and O.M.A.; visualization, H.M.S., A.S.A., F.E.-Z.S.A.R., M.A.-D., N.S.A.E.-G. and O.M.A.; supervision, A.S.A. and O.M.A.; project administration, A.S.A., F.E.-Z.S.A.R., M.A.-D., N.S.A.E.-G. and O.M.A.; funding acquisition, F.E.-Z.S.A.R., M.A.-D., N.S.A.E.-G. and O.M.A. All authors have read and agreed to the published version of the manuscript.

Funding

The current work was assisted financially to the Dean of Science and Research at King Khalid University, Saudi Arabia via the Large Group Project under grant number RGP. 2/156/43.

Institutional Review Board Statement

The experimental work was approved by the Experimental Animal Ethics Committee for Care and Use of Animals at Faculty of Science, Beni-Suef University, Egypt (Ethical Approval Number: BSU/FS/2017/21).

Informed Consent Statement

Not applicable.

Data Availability Statement

All data are contained in the article.

Acknowledgments

The authors extend their appreciation to the Deanship of Scientific Research at King Khalid University, Saudi Arabia for funding this work through the Large Groups Project under grant number RGP. 2/156/43. The authors also acknowledge Dina Sabry, Department of Biochemistry and Molecular Biology, Faculty of Medicine, Cairo University, Cairo, Egypt, for performing Western blot analysis.

Conflicts of Interest

The authors declared there no conflict of interest.

References

  1. American Diabetes Association. Classification and Diagnosis of Diabetes: Standards of Medical Care in Diabetes—2020. Diabetes Care 2020, 43, 14–31. [Google Scholar] [CrossRef] [PubMed] [Green Version]
  2. International Diabetes Federation. IDF Diabetes Atlas, 10th ed.; International Diabetes Federation: Brussels, Belgium, 2021. [Google Scholar]
  3. Xu, L.; Li, Y.; Dai, Y.; Peng, J. Natural products for the treatment of type 2 diabetes mellitus: Pharmacology and mechanisms. Pharmacol. Res. 2018, 130, 451–465. [Google Scholar] [CrossRef] [PubMed]
  4. Simó, R.; Hernández, C. Treatment of diabetes mellitus: General goals, and clinical practice management. Rev. Esp. De Cardiol. 2002, 55, 845–860. [Google Scholar] [CrossRef] [PubMed]
  5. Farzaei, M.H.; Rahimi, R.; Farzaei, F.; Abdollahi, M. Traditional Medicinal Herbs for the Management of Diabetes and its Complications: An Evidence-Based Review. Int. J. Pharmacol. 2015, 11, 874–887. [Google Scholar] [CrossRef] [Green Version]
  6. Peter, E.L.; Kasali, F.M.; Deyno, S.; Mtewa, A.; Nagendrappa, P.B.; Tolo, C.U.; Ogwang, P.E.; Sesaazi, D. Momordica charantia L. lowers elevated glycaemia in type 2 diabetes mellitus patients: Systematic review and meta-analysis. J. Ethnopharmacol. 2019, 231, 311–324. [Google Scholar] [CrossRef]
  7. Naz, S.; Imran, M.; Rauf, A.; Orhan, I.E.; Shariati, M.A.; Haq, I.U.; Yasmin, I.; Shahbaz, M.; Qaisrani, T.B.; Shah, Z.A.; et al. Chrysin: Pharmacological and therapeutic properties. Life Sci. 2019, 235, 116797. [Google Scholar] [CrossRef]
  8. Sangeetha, R. Luteolin in the Management of Type 2 Diabetes Mellitus. Curr. Res. Nutr. Food Sci. J. 2019, 7, 393–398. [Google Scholar] [CrossRef] [Green Version]
  9. Siddiqui, A.; Badruddeen, A.J.; Uddin, M.S.S.; Khan, M.I.; Khalid, M.; Ahmad, M. A naturally occurring flavone (chrysin): Chemistry, occurrence, pharmacokinetic, toxicity, molecular targets and medicinal properties. J. Biol. Act. Prod. Nat. 2018, 8, 208–227. [Google Scholar] [CrossRef]
  10. Mani, R.; Natesan, V. Chrysin: Sources, beneficial pharmacological activities, and molecular mechanism of action. Phytochemistry 2018, 145, 187–196. [Google Scholar] [CrossRef]
  11. Ramírez-Espinosa, J.J.; Saldaña-Ríos, J.; García-Jiménez, S.; Villalobos-Molina, R.; Ávila-Villarreal, G.; Rodríguez-Ocampo, A.N.; Bernal-Fernández, G.; Estrada-Soto, S. Chrysin Induces Antidiabetic, Antidyslipidemic and Anti-Inflammatory Effects in Athymic Nude Diabetic Mice. Molecules 2017, 23, 67. [Google Scholar] [CrossRef]
  12. Satyanarayana, K.; Sravanthi, K.; Shaker, I.; Ponnulakshmi, R.; Selvaraj, J. Role of chrysin on expression of insulin signaling molecules. J. Ayurveda Integr. Med. 2015, 6, 248–258. [Google Scholar] [CrossRef] [PubMed] [Green Version]
  13. Anitha, T.A.; Rajadurai, M. Evaluation of biochemical profile of chrysin in streptozotocin–nictonimaide induced diabetic rats. Int. J. Pharma Bio Sci. 2015, 6, 905–912. [Google Scholar]
  14. Dang, L.T.-T.; Phan, N.K.; Truong, K.D. Mesenchymal stem cells for diabetes mellitus treatment: New advances. Biomed. Res. Ther. 2017, 4, 1062–1081. [Google Scholar] [CrossRef] [Green Version]
  15. Le, P.T.-B.; Van Pham, P.; Vu, N.B.; Dang, L.T.-T.; Phan, N.K. Expanded autologous adipose derived stem cell transplantation for type 2 diabetes mellitus. Biomed. Res. Ther. 2016, 3, 1034–1044. [Google Scholar] [CrossRef] [Green Version]
  16. Peng, B.-Y.; Dubey, N.K.; Mishra, V.K.; Tsai, F.-C.; Dubey, R.; Deng, W.-P.; Wei, H.-J. Addressing Stem Cell Therapeutic Approaches in Pathobiology of Diabetes and Its Complications. J. Diabetes Res. 2018, 2018, 7806435. [Google Scholar] [CrossRef] [PubMed]
  17. Ahmed, O.M.; Sayed, H.M. Stem Cell Therapies in Regenerative Medicine and Diabetes Mellitus: Advances, Constraints and Future Prospects. J. Transplant. Stem Cell Biol. 2016, 3, 1–22. [Google Scholar] [CrossRef]
  18. Van Pham, P.; Vu, N.B.; Phan, N.K. Umbilical cord-derived stem cells (ModulatistTM) show strong immunomodulation capacity compared to adipose tissue-derived or bone marrow-derived mesenchymal stem cells. Biomed. Res. Ther. 2016, 3, 687–696. [Google Scholar] [CrossRef]
  19. Li, G.; Peng, H.; Qian, S.; Zou, X.; Du, Y.; Wang, Z.; Zou, L.; Feng, Z.; Zhang, J.; Zhu, Y.; et al. Bone Marrow-Derived Mesenchymal Stem Cells Restored High-Fat-Fed Induced Hyperinsulinemia in Rats at Early Stage of Type 2 Diabetes Mellitus. Cell Transplant. 2020, 29, 1–9. [Google Scholar] [CrossRef]
  20. Hussien, N.I.; Ebrahim, N.; Mohammed, O.M.; Sabry, D. Combination of Obestatin and Bone Marrow Mesenchymal Stem Cells Prevents Aggravation of Endocrine Pancreatic Damage in Type II Diabetic Rats. Int. J. Stem Cells 2017, 10, 129–143. [Google Scholar] [CrossRef] [Green Version]
  21. Li, Z.; XIE, Z.; LIU, J.J.; HAO, H.J.; MU, Y.M. Comparative effects on type 2 diabetes of mesenchymal stem cells derived from bone marrow and adipose tissue. Med. J. Chinese People’s Lib. Army 2016, 41, 534–538. [Google Scholar] [CrossRef]
  22. Si, Y.; Zhao, Y.; Hao, H.; Liu, J.; Guo, Y.; Mu, Y.; Shen, J.; Cheng, Y.; Fu, X.; Han, W. Infusion of Mesenchymal Stem Cells Ameliorates Hyperglycemia in Type 2 Diabetic Rats. Diabetes 2012, 61, 1616–1625. [Google Scholar] [CrossRef] [PubMed]
  23. Hamza, A.A.; Fikry, E.M.; Abdallah, W.; Amin, A. Mechanistic insights into the augmented effect of bone marrow mesenchymal stem cells and thiazolidinediones in streptozotocin-nicotinamide induced diabetic rats. Sci. Rep. 2018, 8, 9827. [Google Scholar] [CrossRef] [PubMed] [Green Version]
  24. Bouwens, L.; Houbracken, I.; Mfopou, J.K. The use of stem cells for pancreatic regeneration in diabetes mellitus. Nat. Rev. Endocrinol. 2013, 9, 598–606. [Google Scholar] [CrossRef]
  25. Yeung, T.Y.; Seeberger, K.L.; Kin, T.; Adesida, A.; Jomha, N.; Shapiro, A.M.J.; Korbutt, G.S. Human Mesenchymal Stem Cells Protect Human Islets from Pro-Inflammatory Cytokines. PLoS ONE 2012, 7, e38189. [Google Scholar] [CrossRef] [Green Version]
  26. Fletcher, B.; Gulanick, M.; Lamendola, C. Risk factors for type 2 diabetes mellitus. J. Cardiovasc. Nurs. 2002, 16, 17–23. [Google Scholar] [CrossRef]
  27. Zaky, A.S.; Kandeil, M.; Abdel-Gabbar, M.; Fahmy, E.M.; Almehmadi, M.M.; Ali, T.M.; Ahmed, O.M. The Antidiabetic Effects and Modes of Action of the Balanites aegyptiaca Fruit and Seed Aqueous Extracts in NA/STZ-Induced Diabetic Rats. Pharmaceutics 2022, 14, 263. [Google Scholar] [CrossRef] [PubMed]
  28. Chaudhary, J.K.; Rath, P.C. A Simple Method for Isolation, Propagation, Characterization, and Differentiation of Adult Mouse BoneMarrow-Derived Multipotent Mesenchymal Stem Cells. J. Cell Sci. Ther. 2017, 8, 1000261. [Google Scholar] [CrossRef]
  29. Ahmed, O.M.; Hassan, M.A.; Saleh, A.S. Combinatory effect of hesperetin and mesenchymal stem cells on the deteriorated lipid profile, heart and kidney functions and antioxidant activity in STZ-induced diabetic rats. Biocell 2020, 44, 27–29. [Google Scholar] [CrossRef]
  30. Ahmed, E.A.; Ahmed, O.M.; Fahim, H.I.; Mahdi, E.A.; Ali, T.M.; Elesawy, B.H.; Ashour, M.B. Combinatory Effects of Bone Marrow-Derived Mesenchymal Stem Cells and Indomethacin on Adjuvant-Induced Arthritis in Wistar Rats: Roles of IL-1β, IL-4, Nrf-2, and Oxidative Stress. Evid.-Based Complement. Altern. Med. 2021, 2021, 8899143. [Google Scholar] [CrossRef]
  31. Ahmed, R.H.; Galaly, S.R.; Moustafa, N.; Ahmed, R.R.; Ali, T.M.; Elesawy, B.H.; Ahmed, O.M.; Abdul-Hamid, M. Curcumin and Mesenchymal Stem Cells Ameliorate Ankle, Testis, and Ovary Deleterious Histological Changes in Arthritic Rats via Suppression of Oxidative Stress and Inflammation. Stem Cells Int. 2021, 2021, 3516834. [Google Scholar] [CrossRef]
  32. Yanai, G.; Hayashi, T.; Zhi, Q.; Yang, K.-C.; Shirouzu, Y.; Shimabukuro, T.; Hiura, A.; Inoue, K.; Sumi, S. Electrofusion of Mesenchymal Stem Cells and Islet Cells for Diabetes Therapy: A Rat Model. PLoS ONE 2013, 8, e64499. [Google Scholar] [CrossRef] [PubMed]
  33. Babiker, N.E.; Gassoum, A.; Abdelraheem, N.E.; Arbab, M.A.; Aldeaf, S.A.H.; El-Sheikh, M.A.A.; Musa, H.H. The progress of Stem cells in the treatment of diabetes mellitus type 1. Prog. Stem Cell 2017, 4, 175–188. [Google Scholar] [CrossRef]
  34. Rouhi, S.Z.T.; Sarker, M.R.; Rahmat, A.; Alkahtani, S.A.; Othman, F. The effect of pomegranate fresh juice versus pomegranate seed powder on metabolic indices, lipid profile, inflammatory biomarkers, and the histopathology of pancreatic islets of Langerhans in streptozotocin-nicotinamide induced type 2 diabetic Sprague–Dawley rats. BMC Complement. Altern. Med. 2017, 17, 1–13. [Google Scholar] [CrossRef] [Green Version]
  35. Aziz, S.M.A.; Ahmed, O.M.; El-Twab, S.M.A.; Al-Muzafar, H.M.; Amin, K.A.; Abdel-Gabbar, M. Antihyperglycemic Effects and Mode of Actions of Musa paradisiaca Leaf and Fruit Peel Hydroethanolic Extracts in Nicotinamide/Streptozotocin-Induced Diabetic Rats. Evid.-Based Complement. Altern. Med. 2020, 2020, 9276343. [Google Scholar] [CrossRef] [Green Version]
  36. Ahmed, O.M.; El-Twab, S.M.A.; Al-Muzafar, H.M.; Amin, K.A.; Aziz, S.M.A.; Abdel-Gabbar, M. Musa paradisiaca L. leaf and fruit peel hydroethanolic extracts improved the lipid profile, glycemic index and oxidative stress in nicotinamide/streptozotocin-induced diabetic rats. Vet. Med. Sci. 2020, 7, 500–511. [Google Scholar] [CrossRef] [PubMed]
  37. Pai, S.A.; Martis, E.A.; Munshi, R.P.; Gursahani, M.S.; Mestry, S.N.; Juvekar, A.R. Chrysin mitigated obesity by regulating energy intake and expenditure in rats. J. Tradit. Complement. Med. 2019, 10(6), 577–585. [Google Scholar] [CrossRef]
  38. Duncombe, W. The colorimetric micro-determination of non-esterified fatty acids in plasma. Clin. Chim. Acta 1964, 9, 122–125. [Google Scholar] [CrossRef]
  39. Seifter, S.; Dayton, S. The estimation of glycogen with the anthrone reagent. Arch. Biochem. 1950, 25, 191–200. [Google Scholar]
  40. Begum, N.; Moses, S.G.; Shanmugasundaram, K.R. Serum enzymes in human and experimental diabetes mellitus. Indian J. Med. Res. 1978, 68, 774–784. [Google Scholar]
  41. Stalmans, W.; Hers, H.-G. The Stimulation of Liver Phosphorylase b by AMP, Fluoride and Sulfate. A Technical Note on the Specific Determination of the a and b Forms of Liver Glycogen Phosphorylase. JBIC J. Biol. Inorg. Chem. 1975, 54, 341–350. [Google Scholar] [CrossRef]
  42. Schneider, C.A.; Rasband, W.S.; Eliceiri, K.W. NIH Image to ImageJ: 25 Years of image analysis. Nat. Methods 2012, 9, 671–675. [Google Scholar] [CrossRef] [PubMed]
  43. Bancroft, J.D.; Gamble, M. Theory and Practice of Histological Techniques, 6th ed.; Churchill Livingstone (Elsevier): London, UK, 2008. [Google Scholar]
  44. Suvarna, K.S.; Layton, C.; Bancroft, J.D. Bancroft’s Theory and Practice of Histological Techniques; Elsevier Health Sciences Elsevier Ltd.: London, UK, 2019. [Google Scholar] [CrossRef]
  45. Cemek, M.; Kaga, S.; Simsek, N.; Buyukokuroglu, M.E.; Konuk, M. Antihyperglycemic and antioxidative potential of Matricaria chamomilla L. in streptozotocin-induced diabetic rats. J. Nat. Med. 2008, 62, 284–293. [Google Scholar] [CrossRef] [PubMed]
  46. Zang, L.; Hao, H.; Liu, J.; Li, Y.; Han, W.; Mu, Y. Mesenchymal stem cell therapy in type 2 diabetes mellitus. Diabetol. Metab. Syndr. 2017, 9, 36. [Google Scholar] [CrossRef] [PubMed] [Green Version]
  47. Solis, M.A.; Velásquez, I.M.; Correa, R.; Huang, L.L.H. Stem cells as a potential therapy for diabetes mellitus: A call-to-action in Latin America. Diabetol. Metab. Syndr. 2019, 11, 20. [Google Scholar] [CrossRef] [PubMed] [Green Version]
  48. Al-Ishaq, R.K.; Abotaleb, M.; Kubatka, P.; Kajo, K.; Büsselberg, D. Flavonoids and Their Anti-Diabetic Effects: Cellular Mechanisms and Effects to Improve Blood Sugar Levels. Biomolecules 2019, 9, 430. [Google Scholar] [CrossRef] [Green Version]
  49. Ahmed, O.M.; AbouZid, S.F.; Ahmed, N.A.; Zaky, M.Y.; Liu, H. An Up-to-Date Review on Citrus Flavonoids: Chemistry and Benefits in Health and Diseases. Curr. Pharm. Des. 2021, 27, 513–530. [Google Scholar] [CrossRef]
  50. Masiello, P. Animal models of type 2 diabetes with reduced pancreatic β-cell mass. Int. J. Biochem. Cell Biol. 2006, 38, 873–893. [Google Scholar] [CrossRef]
  51. Punitha, I.R.; Rajendran, K.; Shirwaikar, A.; Shirwaikar, A. Alcoholic Stem Extract of Coscinium fenestratum Regulates Carbohydrate Metabolism and Improves Antioxidant Status in Streptozotocin–Nicotinamide Induced Diabetic Rats. Evid.-Based Complement. Altern. Med. 2005, 2, 375–381. [Google Scholar] [CrossRef] [Green Version]
  52. Veerapur, V.; Prabhakar, K.; Kandadi, M.; Srinivasan, K.; Unnikrishnan, M. Antidiabetic effect of Dodonaea viscosa aerial parts in high fat diet and low dose streptozotocin-induced type 2 diabetic rats: A mechanistic approach. Pharm. Biol. 2010, 48, 1137–1148. [Google Scholar] [CrossRef]
  53. Schaalan, M.; El-Abhar, H.S.; Barakat, M.; El-Denshary, E.S. Westernized-like-diet-fed rats: Effect on glucose homeostasis, lipid profile, and adipocyte hormones and their modulation by rosiglitazone and glimepiride. J. Diabetes Its Complicat. 2009, 23, 199–208. [Google Scholar] [CrossRef]
  54. Ruan, H.; Dong, L.Q. Adiponectin signaling and function in insulin target tissues. J. Mol. Cell Biol. 2016, 8, 101–109. [Google Scholar] [CrossRef] [PubMed] [Green Version]
  55. Vinayagam, R.; Xu, B. Antidiabetic properties of dietary flavonoids: A cellular mechanism review. Nutr. Metab. 2015, 12, 60. [Google Scholar] [CrossRef]
  56. Granata, R.; Volante, M.; Settanni, F.; Gauna, C.; Ghé, C.; Annunziata, M.; Deidda, B.; Gesmundo, I.; Abribat, T.; van der Lely, A.-J.; et al. Unacylated ghrelin and obestatin increase islet cell mass and prevent diabetes in streptozotocin-treated newborn rats. J. Mol. Endocrinol. 2010, 45, 9–17. [Google Scholar] [CrossRef] [PubMed] [Green Version]
  57. Hao, H.; Liu, J.; Shen, J.; Zhao, Y.; Liu, H.; Hou, Q.; Tong, C.; Ti, D.; Dong, L.; Cheng, Y.; et al. Multiple intravenous infusions of bone marrow mesenchymal stem cells reverse hyperglycemia in experimental type 2 diabetes rats. Biochem. Biophys. Res. Commun. 2013, 436, 418–423. [Google Scholar] [CrossRef] [PubMed]
  58. Al-Hariri, M.T.; Eldin, T.A.G.; Al-Harb, M.M. Protective effect and potential mechanisms of propolis on streptozotocin-induced diabetic rats. J. Taibah Univ. Med. Sci. 2016, 11, 7–12. [Google Scholar] [CrossRef] [Green Version]
  59. El-Bassossy, H.M.; Abo-Warda, S.M.; Fahmy, A. Chrysin and Luteolin Alleviate Vascular Complications Associated with Insulin Resistance Mainly Through PPAR-γ Activation. Am. J. Chin. Med. 2014, 42, 1153–1167. [Google Scholar] [CrossRef]
  60. Kapoor, R.; Kakkar, P. Naringenin accords hepatoprotection from streptozotocin induced diabetes in vivo by modulating mitochondrial dysfunction and apoptotic signaling cascade. Toxicol. Rep. 2014, 1, 569–581. [Google Scholar] [CrossRef] [Green Version]
  61. Mahmoud, M.F.; Hassan, N.A.; El-Bassossy, H.; Fahmy, A. Quercetin Protects against Diabetes-Induced Exaggerated Vasoconstriction in Rats: Effect on Low Grade Inflammation. PLoS ONE 2013, 8, e63784. [Google Scholar] [CrossRef]
  62. Oh, Y.S.; Bae, G.D.; Baek, D.J.; Park, E.-Y.; Jun, H.-S. Fatty Acid-Induced Lipotoxicity in Pancreatic Beta-Cells During Development of Type 2 Diabetes. Front. Endocrinol. 2018, 9, 384. [Google Scholar] [CrossRef]
  63. Unger, R.H. Lipotoxicity in the Pathogenesis of Obesity-Dependent NIDDM: Genetic and Clinical Implications. Diabetes 1995, 44, 863–870. [Google Scholar] [CrossRef]
  64. Randle, P.; Garland, P.; Hales, C.; Newsholme, E. The Glucose Fatty-Acid Cycle Its Role In Insulin Sensitivity and the Metabolic Disturbances of Diabetes Mellitus. Lancet 1963, 281, 785–789. [Google Scholar] [CrossRef] [PubMed]
  65. Lewis, G.F.; Carpentier, A.; Adeli, K.; Giacca, A. Disordered Fat Storage and Mobilization in the Pathogenesis of Insulin Resistance and Type 2 Diabetes. Endocr. Rev. 2002, 23, 201–229. [Google Scholar] [CrossRef] [PubMed]
  66. Lee, C.; Lee, C.; Tsai, S.; Huang, C.; Wu, M.; Tai, S.; Lin, F.; Chao, N.; Chang, C. Association Between Serum Leptin and Adiponectin Levels with Risk of Insulin Resistance and Impaired Glucose Tolerance in Non-diabetic Women. Kaohsiung J. Med. Sci. 2009, 25, 116–125. [Google Scholar] [CrossRef] [Green Version]
  67. Tomas, E.; Tsao, T.-S.; Saha, A.K.; Murrey, H.E.; Zhang, C.C.; Itani, S.I.; Lodish, H.F.; Ruderman, N.B. Enhanced muscle fat oxidation and glucose transport by ACRP30 globular domain: Acetyl–CoA carboxylase inhibition and AMP-activated protein kinase activation. Proc. Natl. Acad. Sci. USA 2002, 99, 16309–16313. [Google Scholar] [CrossRef] [PubMed] [Green Version]
  68. Yamauchi, T.; Kamon, J.; Waki, H.; Terauchi, Y.; Kubota, N.; Hara, K.; Mori, Y.; Ide, T.; Murakami, K.; Tsuboyama-Kasaoka, N.; et al. The fat-derived hormone adiponectin reverses insulin resistance associated with both lipoatrophy and obesity. Nat. Med. 2001, 7, 941–946. [Google Scholar] [CrossRef] [PubMed]
  69. Yamauchi, T.; Kamon, J.; Ito, Y.; Tsuchida, A.; Yokomizo, T.; Kita, S.; Sugiyama, T.; Miyagishi, M.; Hara, K.; Tsunoda, M.; et al. Cloning of adiponectin receptors that mediate antidiabetic metabolic effects. Nature 2003, 423, 762–769. [Google Scholar] [CrossRef]
  70. Ajuwon, K.M.; Spurlock, M.E. Adiponectin inhibits LPS-induced NF-κB activation and IL-6 production and increases PPARγ2 expression in adipocytes. Am. J. Physiol. Integr. Comp. Physiol. 2005, 288, R1220–R1225. [Google Scholar] [CrossRef]
  71. Mather, K.J.; Funahashi, T.; Matsuzawa, Y.; Edelstein, S.; Bray, G.A.; Kahn, S.E.; Crandall, J.; Marcovina, S.; Goldstein, B.; Goldberg, R.; et al. Adiponectin, Change in Adiponectin, and Progression to Diabetes in the Diabetes Prevention Program. Diabetes 2008, 57, 980–986. [Google Scholar] [CrossRef] [Green Version]
  72. Ohashi, K.; Ouchi, N.; Matsuzawa, Y. Anti-inflammatory and anti-atherogenic properties of adiponectin. Biochimie 2012, 94, 2137–2142. [Google Scholar] [CrossRef]
  73. Kim, K.-H.; Lee, K.; Moon, Y.S.; Sul, H.S.; Matter, N.; Marx, M.; Weg-Remers, S.; Ponta, H.; Herrlich, P.; König, H. A Cysteine-rich Adipose Tissue-specific Secretory Factor Inhibits Adipocyte Differentiation. J. Biol. Chem. 2001, 276, 11252–11256. [Google Scholar] [CrossRef] [Green Version]
  74. Rajala, M.W.; Qi, Y.; Patel, H.R.; Takahashi, N.; Banerjee, R.; Pajvani, U.B.; Sinha, M.K.; Gingerich, R.L.; Scherer, P.E.; Ahima, R.S. Regulation of Resistin Expression and Circulating Levels in Obesity, Diabetes, and Fasting. Diabetes 2004, 53, 1671–1679. [Google Scholar] [CrossRef] [PubMed] [Green Version]
  75. Lochhead, P.A.; Salt, I.P.; Walker, K.S.; Hardie, D.G.; Sutherland, C. 5-aminoimidazole-4-carboxamide riboside mimics the effects of insulin on the expression of the 2 key gluconeogenic genes PEPCK and glucose-6-phosphatase. Diabetes 2000, 49, 896–903. [Google Scholar] [CrossRef] [PubMed]
  76. Banerjee, R.R.; Rangwala, S.M.; Shapiro, J.S.; Rich, A.S.; Rhoades, B.; Qi, Y.; Wang, J.; Rajala, M.W.; Pocai, A.; Scherer, P.E.; et al. Regulation of Fasted Blood Glucose by Resistin. Science 2004, 303, 1195–1198. [Google Scholar] [CrossRef] [PubMed]
  77. Zhang, S.; Ma, X.; Zhang, L.; Sun, H.; Liu, X. Capsaicin Reduces Blood Glucose by Increasing Insulin Levels and Glycogen Content Better than Capsiate in Streptozotocin-Induced Diabetic Rats. J. Agric. Food Chem. 2017, 65, 2323–2330. [Google Scholar] [CrossRef]
  78. Iftikhar, A.; Aslam, B.; Iftikhar, M.; Majeed, W.; Batool, M.; Zahoor, B.; Amna, N.; Gohar, H.; Latif, I. Effect of Caesalpinia bonduc Polyphenol Extract on Alloxan-Induced Diabetic Rats in Attenuating Hyperglycemia by Upregulating Insulin Secretion and Inhibiting JNK Signaling Pathway. Oxidative Med. Cell. Longev. 2020, 2020, 9020219. [Google Scholar] [CrossRef]
  79. Ahmed, O.M.; Mahmoud, A.M.; Abdel-Moneim, A.; Ashour, M.B. Antidiabetic effects of hesperidin and naringin in type 2 diabetic rats. Diabetol. Croat. 2012, 41, 53–67. [Google Scholar]
  80. Ali, A.M.; Gabbar, M.A.; Abdel-Twab, S.M.; Fahmy, E.M.; Ebaid, H.; Alhazza, I.M.; Ahmed, O.M. Antidiabetic Potency, Antioxidant Effects, and Mode of Actions of Citrus reticulata Fruit Peel Hydroethanolic Extract, Hesperidin, and Quercetin in Nicotinamide/Streptozotocin-Induced Wistar Diabetic Rats. Oxidative Med. Cell. Longev. 2020, 2020, 1–22. [Google Scholar] [CrossRef]
  81. Ahmed, O.M.; Moneim, A.A.; Yazid, I.A.; Mahmoud, A.M. Antihyperglycemic, antihyperlipidemic and antioxidant effects and the probable mechanisms of action of Rutagraveolens infusion and rutin in nicotinamide-streptozotocin-induced diabetic rats. Diabetol. Croat. 2010, 39, 15–35. [Google Scholar]
  82. Pari, L.; Suman, S. Antihyperglycemic and antilipidperoxidative effects of flavonoid naringin in streptozotocin-nicotinamide induced diabetic rats. Int. J. Biol. Med. Res. 2010, 1, 206–210. [Google Scholar]
  83. Morral, N. Novel targets and therapeutic strategies for type 2 diabetes. Trends Endocrinol. Metab. 2003, 14, 169–175. [Google Scholar] [CrossRef]
  84. Ahmed, O.M. The hypoglycemic effect of curcumin and esculetin and their probable mechanisms of action in streptozotocin diabetic albino rats. J. Egypt. Ger. Soc. Zool. 2005, 46, 351–375. [Google Scholar]
  85. Rehman, K.; Akash, M.S.H. Mechanisms of inflammatory responses and development of insulin resistance: How are they interlinked? J. Biomed. Sci. 2016, 23, 87. [Google Scholar] [CrossRef] [Green Version]
  86. Hanchang, W.; Khamchan, A.; Wongmanee, N.; Seedadee, C. Hesperidin ameliorates pancreatic β-cell dysfunction and apoptosis in streptozotocin-induced diabetic rat model. Life Sci. 2019, 235, 116858. [Google Scholar] [CrossRef] [PubMed]
  87. Tsalamandris, S.; Antonopoulos, A.S.; Oikonomou, E.; Papamikroulis, G.-A.; Vogiatzi, G.; Papaioannou, S.; Deftereos, S.; Tousoulis, D. The Role of Inflammation in Diabetes: Current Concepts and Future Perspectives. Eur. Cardiol. Rev. 2019, 14, 50–59. [Google Scholar] [CrossRef] [PubMed] [Green Version]
  88. Ahad, A.; Ganai, A.A.; Mujeeb, M.; Siddiqui, W.A. Chrysin, an anti-inflammatory molecule, abrogates renal dysfunction in type 2 diabetic rats. Toxicol. Appl. Pharmacol. 2014, 279, 1–7. [Google Scholar] [CrossRef]
  89. Li, Y.; Liu, J.; Liao, G.; Zhang, J.; Chen, Y.; Li, L.; Li, L.; Liu, F.; Chen, B.; Guo, G.; et al. Early intervention with mesenchymal stem cells prevents nephropathy in diabetic rats by ameliorating the inflammatory microenvironment. Int. J. Mol. Med. 2018, 41, 2629–2639. [Google Scholar] [CrossRef]
  90. Jiang, L.Q.; Franck, N.; Egan, B.; Sjögren, R.J.O.; Katayama, M.; Duque-Guimaraes, D.; Arner, P.; Zierath, J.R.; Krook, A. Autocrine role of interleukin-13 on skeletal muscle glucose metabolism in type 2 diabetic patients involves microRNA let-7. Am. J. Physiol. Metab. 2013, 305, 1359–1366. [Google Scholar] [CrossRef] [Green Version]
  91. Chan, M.H.S.; Carey, A.L.; Watt, M.J.; Febbraio, M.A. Cytokine gene expression in human skeletal muscle during concentric contraction: Evidence that IL-8, like IL-6, is influenced by glycogen availability. Am. J. Physiol. Integr. Comp. Physiol. 2004, 287, 322–327. [Google Scholar] [CrossRef] [Green Version]
  92. Machado, M.V.; Yang, Y.; Diehl, A.M. The benefits of restraint: A pivotal role for IL-13 in hepatic glucose homeostasis. J. Clin. Investig. 2012, 123, 115–117. [Google Scholar] [CrossRef] [Green Version]
  93. Maedler, K.; Størling, J.; Sturis, J.; Zuellig, R.A.; Spinas, G.A.; Arkhammar, P.O.; Mandrup-Poulsen, T.; Donath, M.Y. Glucose- and Interleukin-1β-Induced β-Cell Apoptosis Requires Ca2+ Influx and Extracellular Signal-Regulated Kinase (ERK) 1/2 Activation and Is Prevented by a Sulfonylurea Receptor 1/Inwardly Rectifying K+ Channel 6.2 (SUR/Kir6.2) Selective Potassium Channel Opener in Human Islets. Diabetes 2004, 53, 1706–1713. [Google Scholar] [CrossRef] [Green Version]
  94. Stanya, K.; Jacobi, D.; Liu, S.; Bhargava, P.; Dai, L.; Gangl, M.R.; Inouye, K.; Barlow, J.L.; Ji, Y.; Mizgerd, J.; et al. Direct control of hepatic glucose production by interleukin-13 in mice. J. Clin. Investig. 2013, 123, 261–271. [Google Scholar] [CrossRef] [PubMed]
Figure 1. Animal grouping and the experimental procedure.
Pharmaceuticals 16 00034 g001
Figure 2. RT-PCR analysis showing mRNA expression of CD73, CD105, CD34, and CD45 in rat MSCs. CD73 and CD105 were strongly expressed from MSCs. However, CD34 and CD45 were weakly expressed.
Pharmaceuticals 16 00034 g002
Figure 3. OGTT of normal, diabetic control, and diabetic rats treated with chrysin and BM-MSCs. Data are expressed as mean ± SE (n = 6). At p < 0.05, the means (a, b, c, and d) are significantly different from one another.
Pharmaceuticals 16 00034 g003
Figure 4. Effects of chrysin and BM-MSCs on resistin (B) and adiponectin (C) in adipose tissue in NA/STZ-induced diabetic rats. Western blot analysis was used to measure the expressions of resistin and adiponectin in the adipose tissues of the experimental groups. Representative immunoblots for the quantification of resistin and adiponectin proteins are depicted in (A). Data are expressed as mean ± SE (n = 3). Means (with various symbols: a, b, c, and d) for each parameter differ significantly at p < 0.05.
Pharmaceuticals 16 00034 g004
Figure 5. Effects of chrysin and BM-MSCs on IR-Βs (B), IRS-1 (C), and IRS-2 (D) in adipose tissue in NA/STZ-induced diabetic rats. Western blot analysis was used to measure the expressions of IR-Βs, IRS-1, and IRS-2 in the adipose tissues of the experimental groups. Representative immunoblots for quantification of resistin and adiponectin proteins are depicted in (A). Data are expressed as mean ± SE (n = 3). Means (with various symbols: a, b, and c) for each parameter differ significantly at p < 0.05.
Pharmaceuticals 16 00034 g005
Figure 6. Trichrome-PASS-stained rat pancreas photomicrographs of the normal, diabetic control, and treated groups. (A): Pancreas sections of normal rats showing normal histological architecture formed of closely packed lobules of pancreatic acinar cells and islets of Langerhans embedded in the exocrine portions. (B): Pancreas sections of NA/STZ-administrated rats showing a marked decrease in the size and number of β-cells and islets. Pancreas sections of NA/STZ-administrated rats treated with chrysin (C), BM-MSCs (D) and chrysin plus BM-MSCs (E) showing marked improvement regarding pancreas histological changes, resulting in a nearly normal structure in terms of the islets of Langerhans. (Arrows: islets of Langerhans; AC: acinar cells; BV: blood vessel).
Pharmaceuticals 16 00034 g006
Figure 7. Photomicrographs of immunohistochemical staining of insulin in pancreatic islets of the normal, diabetic control, and diabetic treated rats. (A,B) Pancreas section of rats from normal group showing strong immunoreactivity of insulin in β-cells which are distributed over the pancreatic islets (arrows) and stained with deep brown color. (C,D) Pancreas section of rats from NA/STZ-induced diabetic group showing evident decline in the immunohistochemical expression of insulin in islet of Langerhans (arrows). (E,F) In the pancreas of diabetic rats treated with chrysin, the apparent marked increase in number and area of β-cells with dense immunohistochemical staining of insulin granules is evident in comparison with NA/STZ-induced diabetic group (arrows). (G,H) Pancreas section of rats treated with BM-MSCs showing an evident increase in insulin expressing β-cells (arrows). (I,J) In the pancreas of diabetic group rats treated with chrysin plus BM-MSCs, the apparent marked increase in number and area of β-cells is evident in comparison with NA/STZ-induced diabetic group (arrows).
Pharmaceuticals 16 00034 g007
Figure 8. Diagrammatic representation showing the target effects of BM-MSCs and chrysin in NA/STZ-induced type 2 diabetes, illustrating the immunomodulatory and anti-diabetic effects. BM-MSCs: bone marrow-derived mesenchymal stem cells; TNF-α: tumor necrosis factor-alpha; IL-1β; interleukin-1β; IL-13; interleukin-13; NA: nicotinamide; STZ; streptozotocin; Glut4: glucose transporter 4; Glut2: glucose transporter 2; IRS-1: insulin receptor substrate-1; IRS-2: insulin receptor substrate-2; IR-Βs: insulin receptor-beta subunit.
Pharmaceuticals 16 00034 g008
Table 1. Effect of chrysin and BM-MSCs on AUC for OGTT in NA/STZ-induced diabetic rats.
GroupsAUC (mg/dL × 120 min) × 102%
Change
Normal81.57 ± 4.71 a
Diabetic control478.94 ± 21.85 d487.15
Diabetic treated with chrysin334.83 ± 28.99 b,c−30.09
Diabetic treated with BM-MSCs385.88 ± 10.84 c−19.43
Diabetic treated with chrysin and BM-MSCs306.36 ± 30.50 b−36.03
F-probabilityp < 0.001
Data are expressed as mean ± SE. Six samples from each group were detected. Means (with various superscript symbols: a, b, c and d) for each parameter differ significantly at p < 0.05. Percentage changes were calculated by comparing the diabetic control with normal and diabetic treated groups with diabetic control. % change = [(Final − Initial)/Initial] × 100.
Table 2. Effect of chrysin and BM-MSCs on serum insulin and C-peptide levels in NA/STZ-induced diabetic rats.
GroupsInsulin
(ng/mL)
%
Change
C-Peptide
(pg/mL)
%
Change
Normal2.92 ± 0.10 c 8.93 ± 0.43 c
Diabetic control1.03 ± 0.02 a−64.862.53 ± 0.15 a−71.64
Diabetic treated with chrysin2.29 ± 0.08 b122.985.1 ± 0.11 b101.34
Diabetic treated with BM-MSCs2.43 ± 0.13 b136.906.17 ± 0.27 b143.70
Diabetic treated with chrysin and BM-MSCs2.45 ± 0.05 b138.565.83 ± 0.43 b130.28
F-probabilityp < 0.001p < 0.001
Data are expressed as mean ± SE. Six samples from each group were detected. Means (with various superscript symbols: a, b, and c) for each parameter differ significantly at p < 0.05. Percentage changes were calculated by comparing the diabetic control with normal and diabetic treated groups with diabetic control. % change = [(Final − Initial)/Initial] × 100.
Table 3. Effect of chrysin and BM-MSCs on serum FFAs levels in NA/STZ-induced diabetic rats.
GroupsFFAs (mg/dL)%
Change
Normal14.72 ± 0.34 a
Diabetic control26.45 ± 1.47 b79.69
Diabetic treated with chrysin17.56 ± 0.50 a−33.61
Diabetic treated with BM-MSCs17.46 ± 0.39 a−33.99
Diabetic treated with chrysin and BM-MSCs15.48 ± 0.93 a−41.47
F-probabilityp < 0.001
Data are expressed as mean ± SE. Six samples from each group were detected. Means (with various superscript symbols: a and b) for each parameter differ significantly at p < 0.05. Percentage changes were calculated by comparing the diabetic control with normal and diabetic treated groups with diabetic control. % change = [(Final − Initial)/Initial] × 100.
Table 4. Effect of chrysin and BM-MSCs on liver glycogen content, G-6-Pase, and glycogen phosphorylase activities in NA/STZ-induced diabetic rats.
GroupsLiver Glycogen
(mg/g Tissue)
%
Change
G-6-Pase
(mg Pi Liberated/g Tissue/Hour)
%
Change
Glycogen Phosphorylase
(mg Pi Liberated/g Tissue/Hour)
%
Change
Normal36.84 ± 1.10 d 14.89 ± 0.67 a 11.69 ± 0.50 a
Diabetic control16.76 ± 0.34 a−52.6928.75 ± 0.67 d93.0825.78 ± 0.48 d120.53
Diabetic treated with chrysin23.54 ± 1.1 b40.4518.44 ± 0.73 b−35.8618.83 ± 0.29 b,c−26.96
Diabetic treated with BM-MSCs21.01 ± 0.25 b25.3620.01 ± 0.94 b,c−30.4016.47 ± 0.88 b−36.11
Diabetic treated with chrysin and BM-MSCs28.19 ± 1.19 c68.2021.77 ± 0.63 c−24.2819.03 ± 0.56 c−26.18
F-probabilityp < 0.001p < 0.001p < 0.001
Data are expressed as mean ± SE. Six samples from each group were detected. Means (with various superscript symbols: a, b, c, and d) for each parameter differ significantly at p < 0.05. Percentage changes were calculated by comparing the diabetic control with normal and diabetic treated groups with diabetic control. % change = [(Final − Initial)/Initial] × 100.
Table 5. Effect of chrysin and BM-MSCs on serum IL-1β, TNF-α, and IL-13 levels in NA/STZ-induced diabetic rats.
GroupsIL-1β
(pg/mL)
%
Change
TNF-α
(pg/mL)
%
Change
IL-13
(pg/mL)
%
Change
Normal15.23 ± 0.82 a 42.7 ± 1.45 a 116.30 ± 3.01 c
Diabetic control91.43 ± 4.55 d500.33138.3 ± 7.71 d223.8955.13 ± 6.35 a−52.60
Diabetic treated with chrysin31.90 ± 2.75 b−65.1165.07 ± 1.85 b−52.9597.13 ± 1.42 b76.18
Diabetic treated with BM-MSCs39.47 ± 5.58 b,c−56.8394.5 ± 2.41 c−31.6795.67 ± 3.49 b73.54
Diabetic treated with chrysin and BM-MSCs49.07 ± 2.56 c−46.3344.1 ± 2.08 a−68.1193.03 ± 6.36 b68.75
F-probabilityp < 0.001p < 0.001p < 0.001
Data are expressed as mean ± SE. Six samples from each group were detected. Means (with various superscript symbols: a, b, c, and d) for each parameter differ significantly at p < 0.05. Percentage changes were calculated by comparing the diabetic control with normal and diabetic treated groups with diabetic control. % change = [(Final − Initial)/Initial] × 100.
Table 6. Effect of chrysin and BM-MSCs on integrated density and area fraction levels of immunohistochemical staining of pancreas in NA/STZ-induced diabetic rats.
GroupsIntegrated Density%
Change
Area Fraction%
Change
Normal28,094 ± 237.1 e 13.74 ± 0.12 e
Diabetic control772.3 ± 19.0 a−97.250.38 ± 0.01 a−97.23
Diabetic treated with chrysin6111 ± 576.2 c691.272.99 ± 0.28 c686.84
Diabetic treated with BM-MSCs3917 ± 600.2 b407.191.92 ± 0.29 b404.74
Diabetic treated with chrysin and BM-MSCs11,245 ± 196 d1356.045.31 ± 0.19 d1297.11
F-probabilityp < 0.001p < 0.001
Data are expressed as mean ± SE. Four samples from each group were detected. Means (with various superscript symbols: a, b, c, d and e) for each parameter differ significantly at p < 0.05. Percentage changes were calculated by comparing the diabetic control with normal and diabetic treated groups with diabetic control. % change = [(Final − Initial)/Initial] × 100.
Disclaimer/Publisher’s Note: The statements, opinions and data contained in all publications are solely those of the individual author(s) and contributor(s) and not of MDPI and/or the editor(s). MDPI and/or the editor(s) disclaim responsibility for any injury to people or property resulting from any ideas, methods, instructions or products referred to in the content.

