

Optimisation of Solid-Phase Extraction and LC-MS/MS Analysis of Six Breast Cancer Drugs in Patient Plasma Samples

 ,
,  , ,
, , 
Abstract
:1. Introduction
2. Results and Discussion
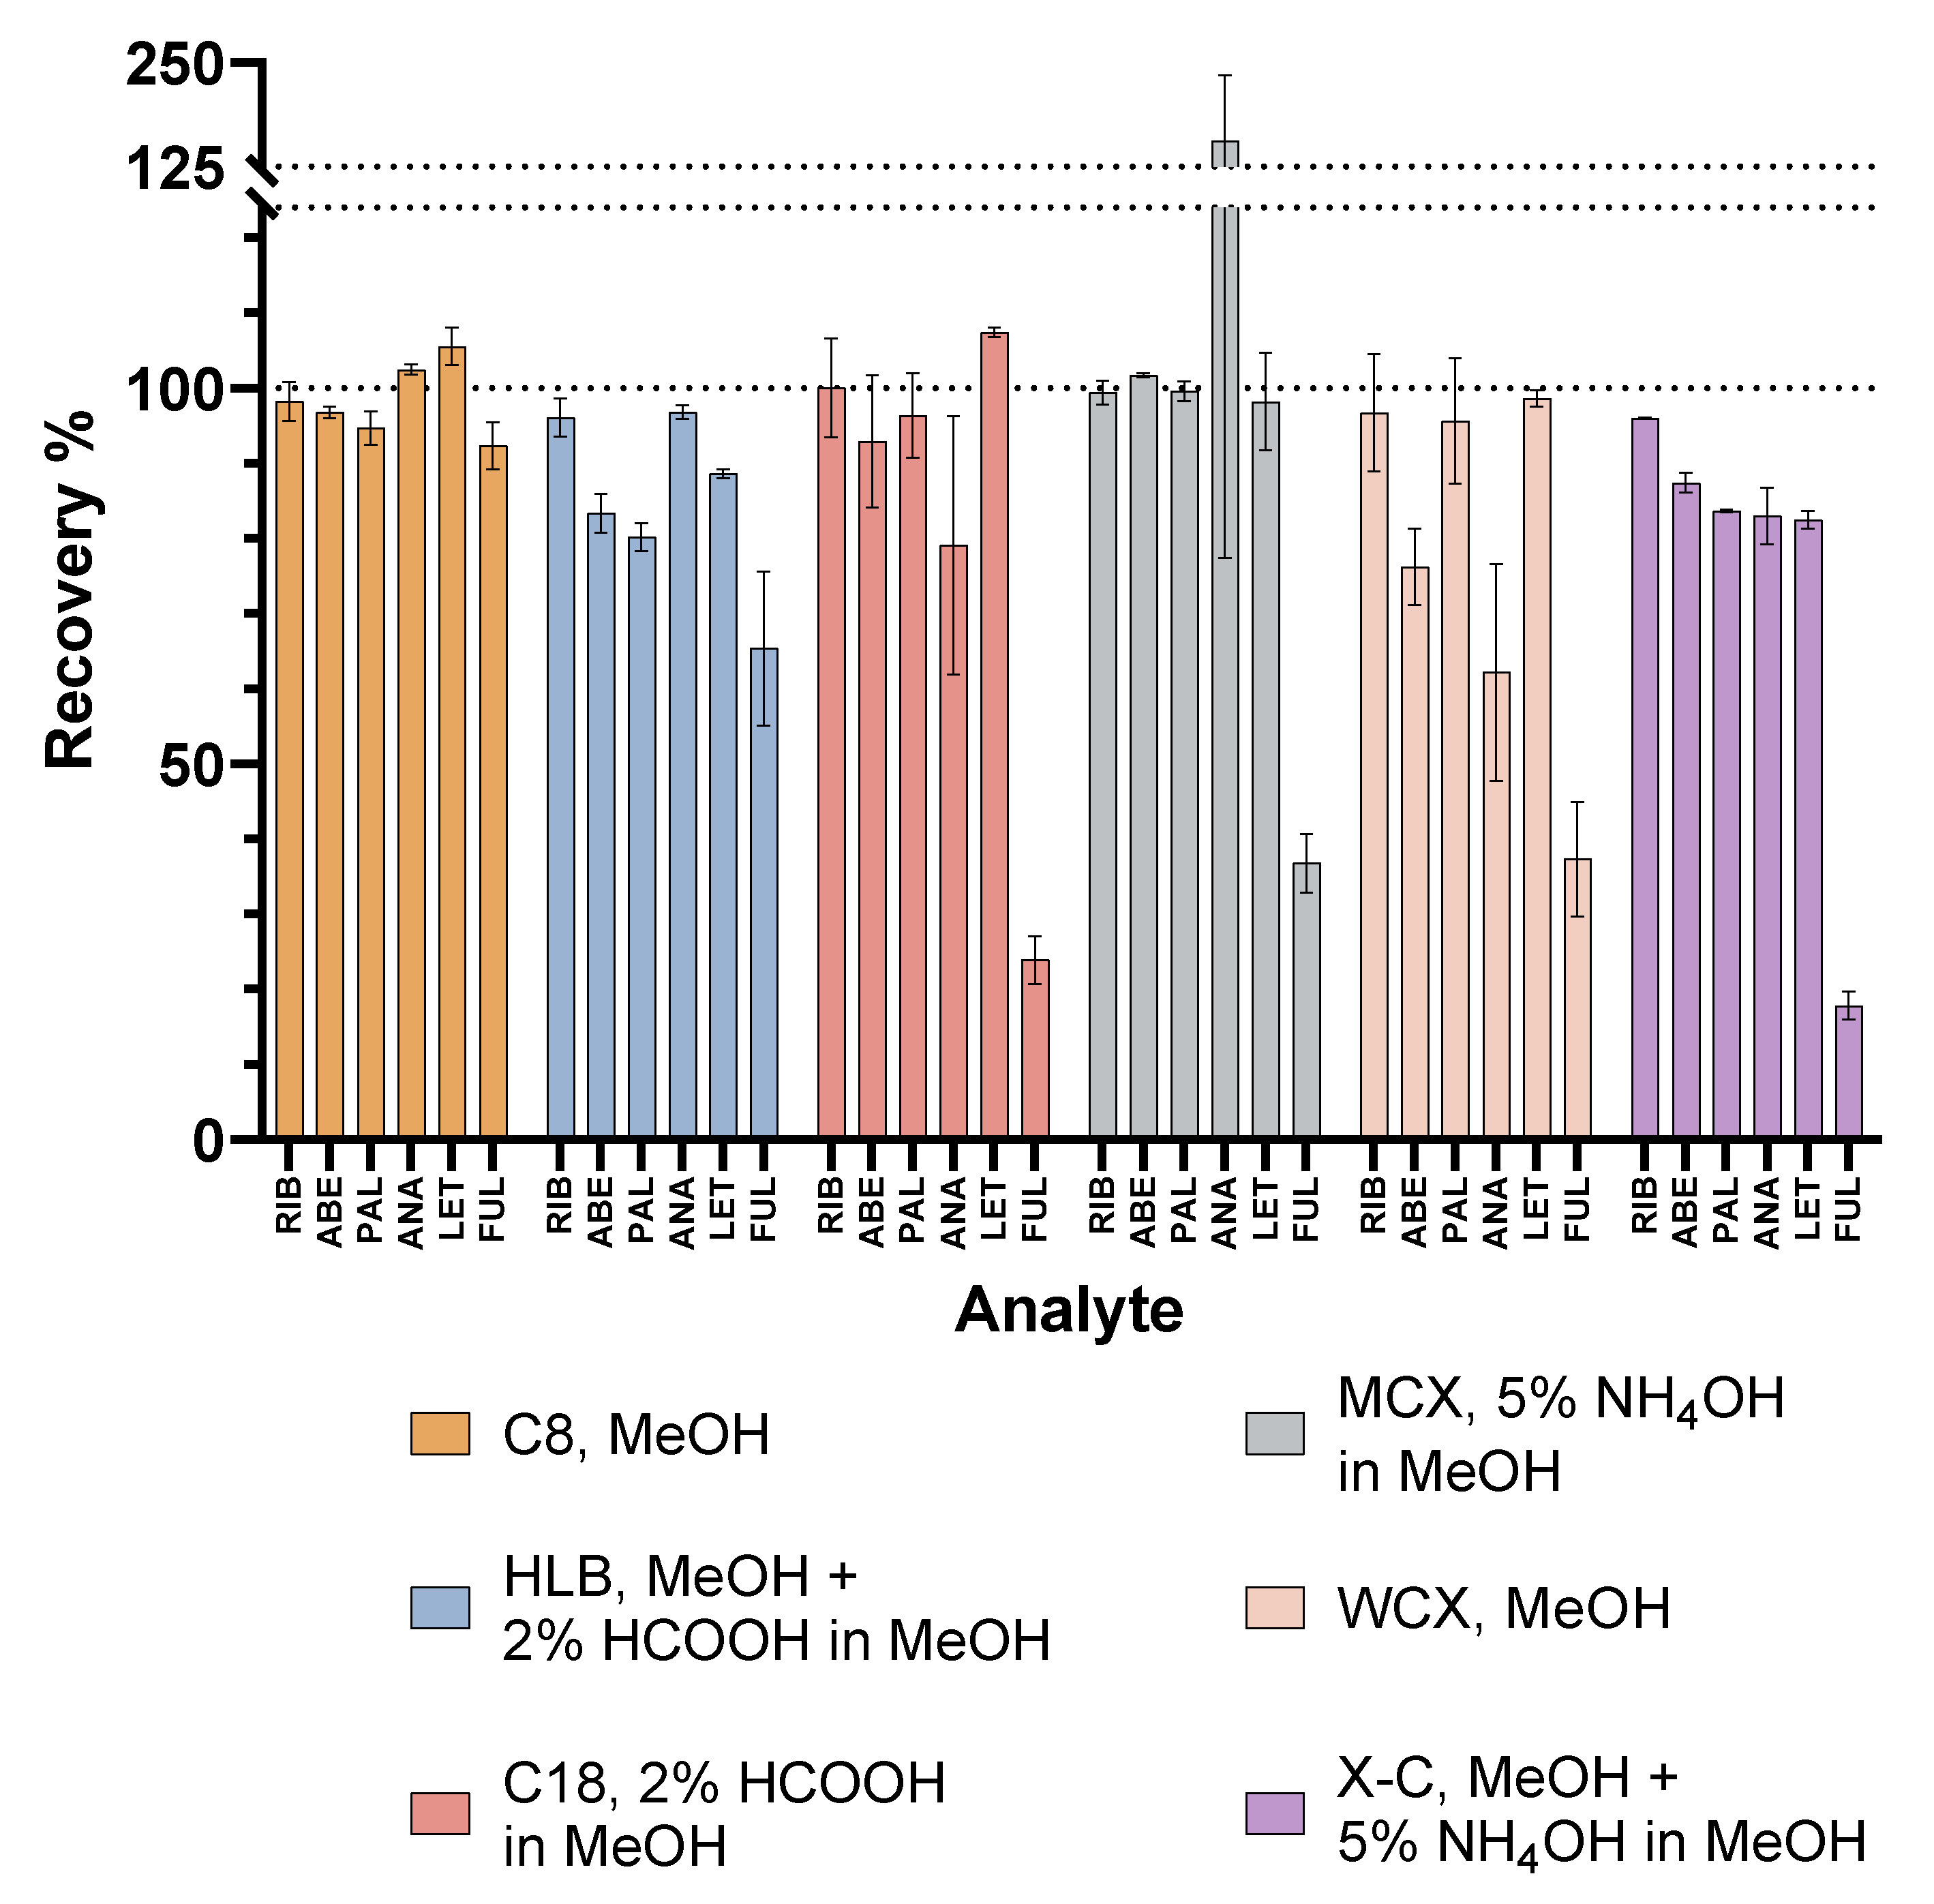
2.1. Optimisation of the SPE Procedure
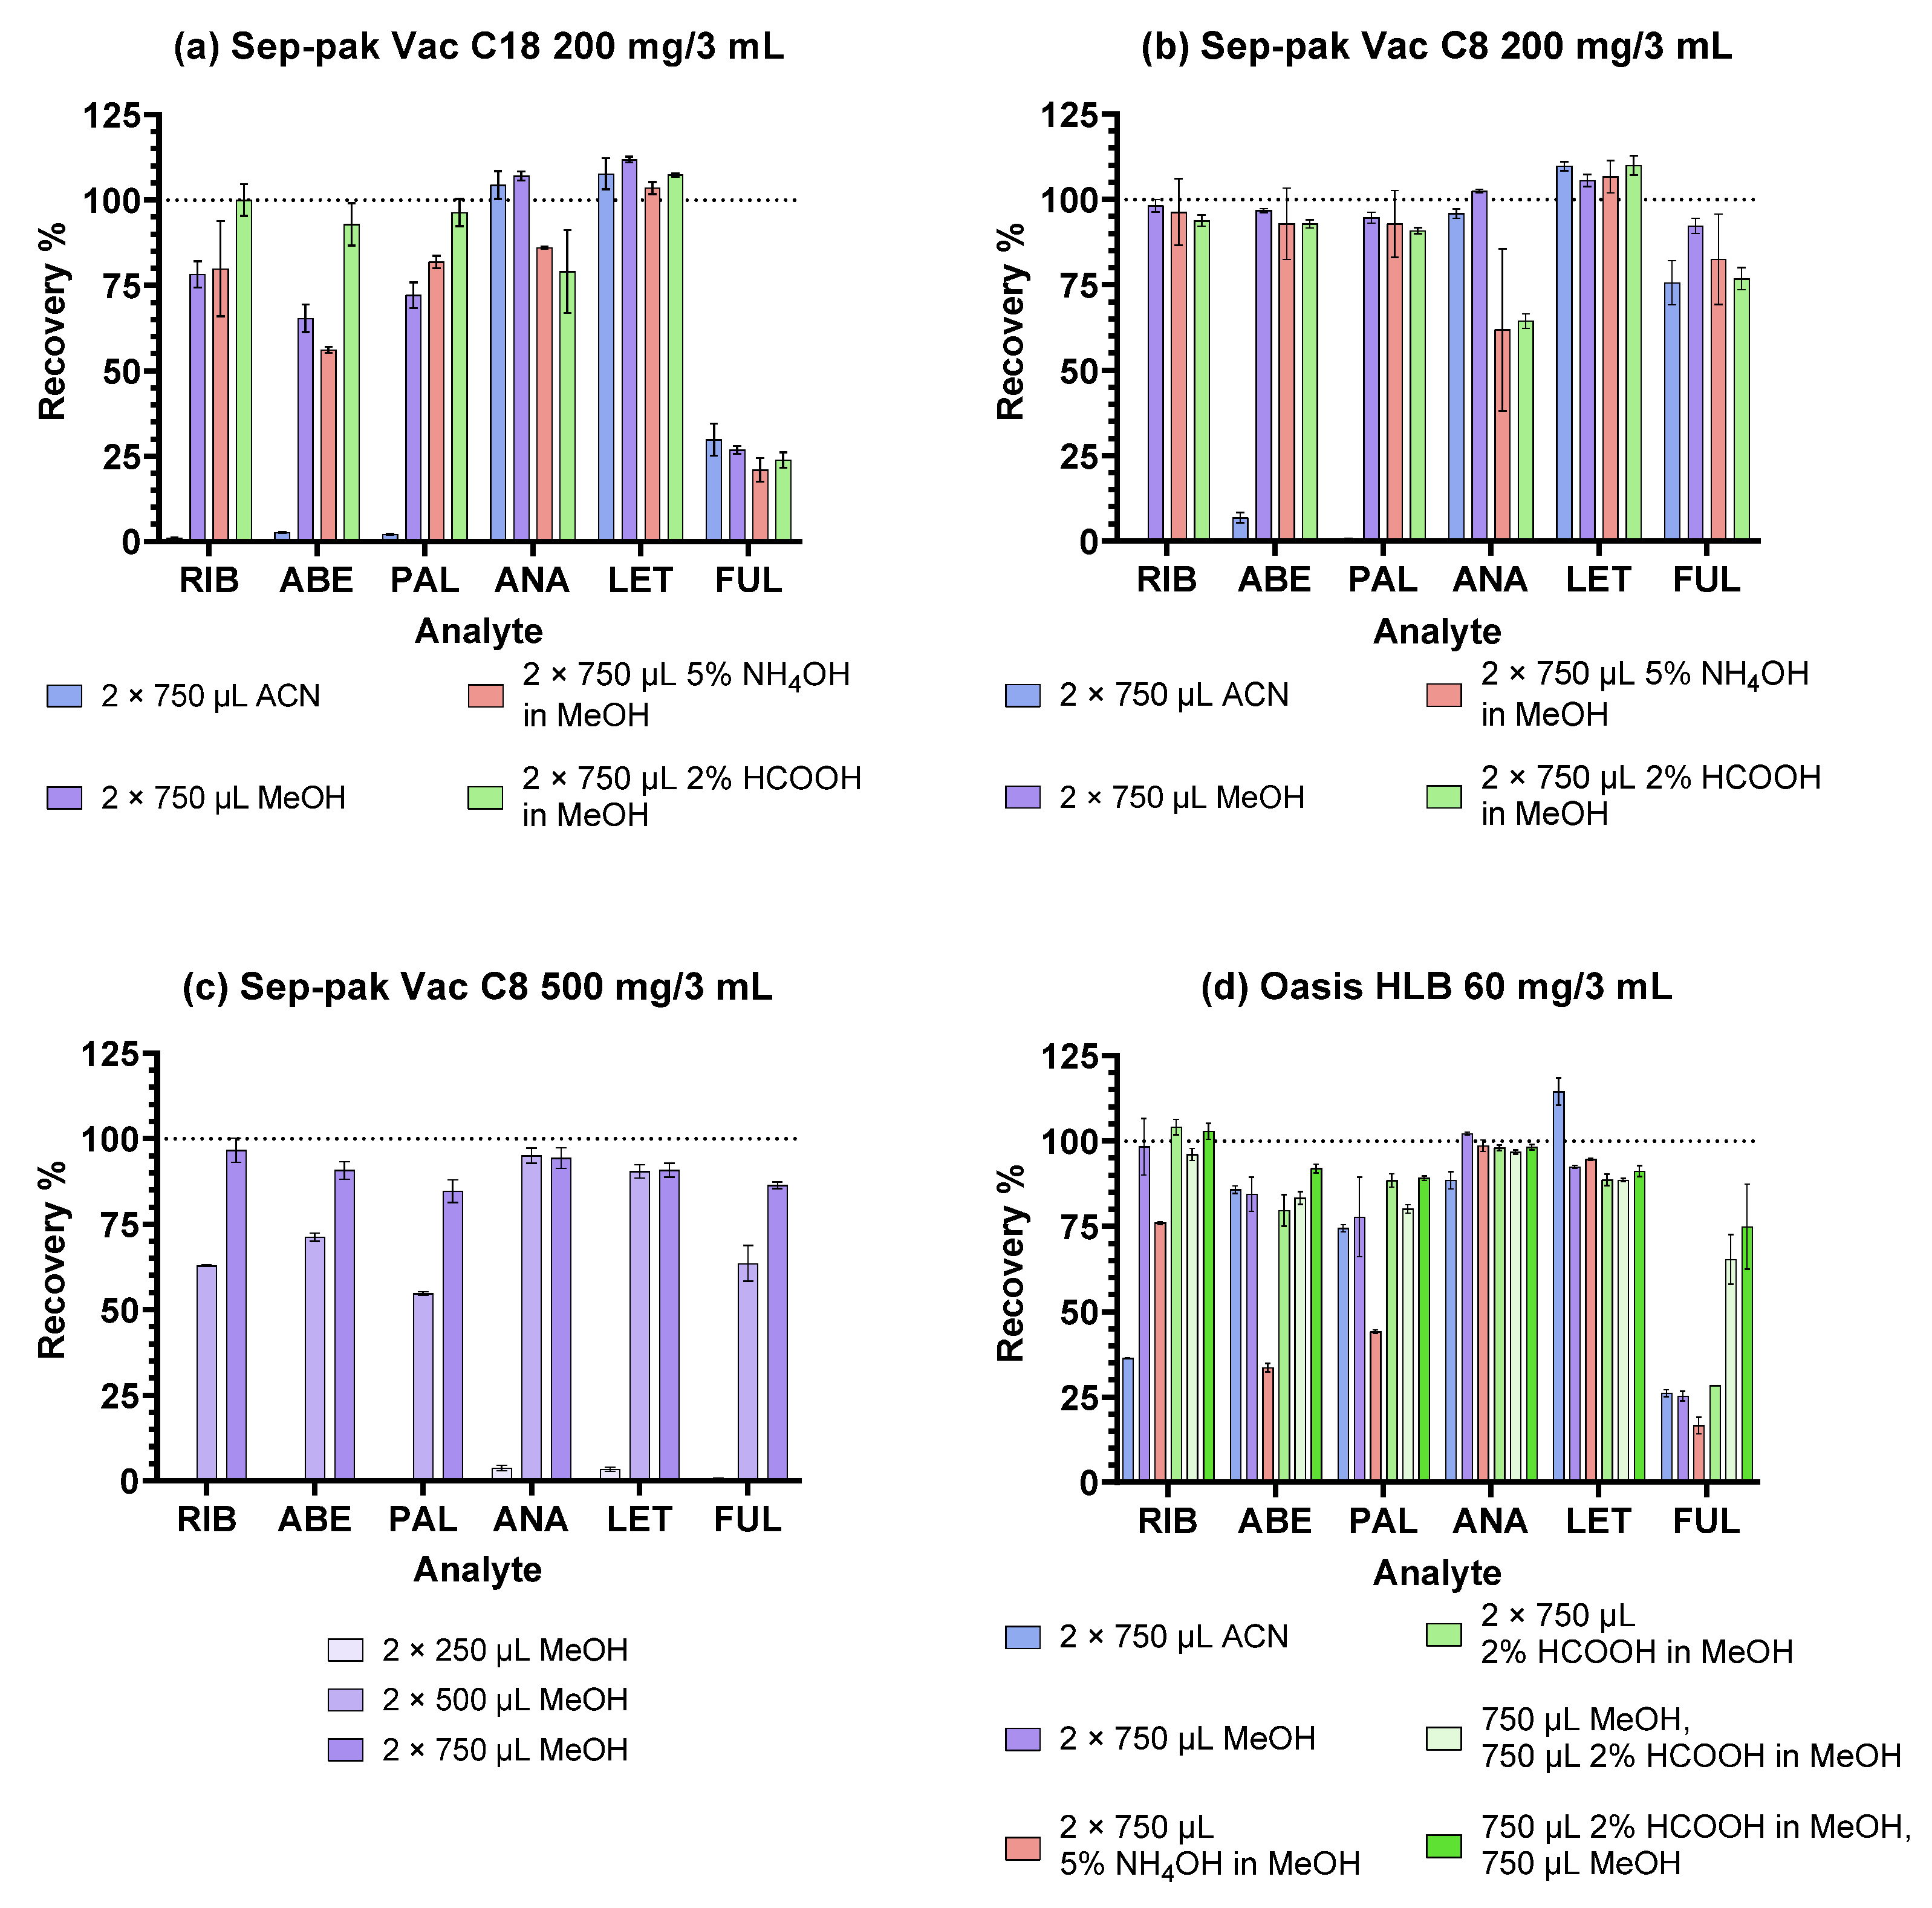
2.1.1. Reversed-Phase Sorbents
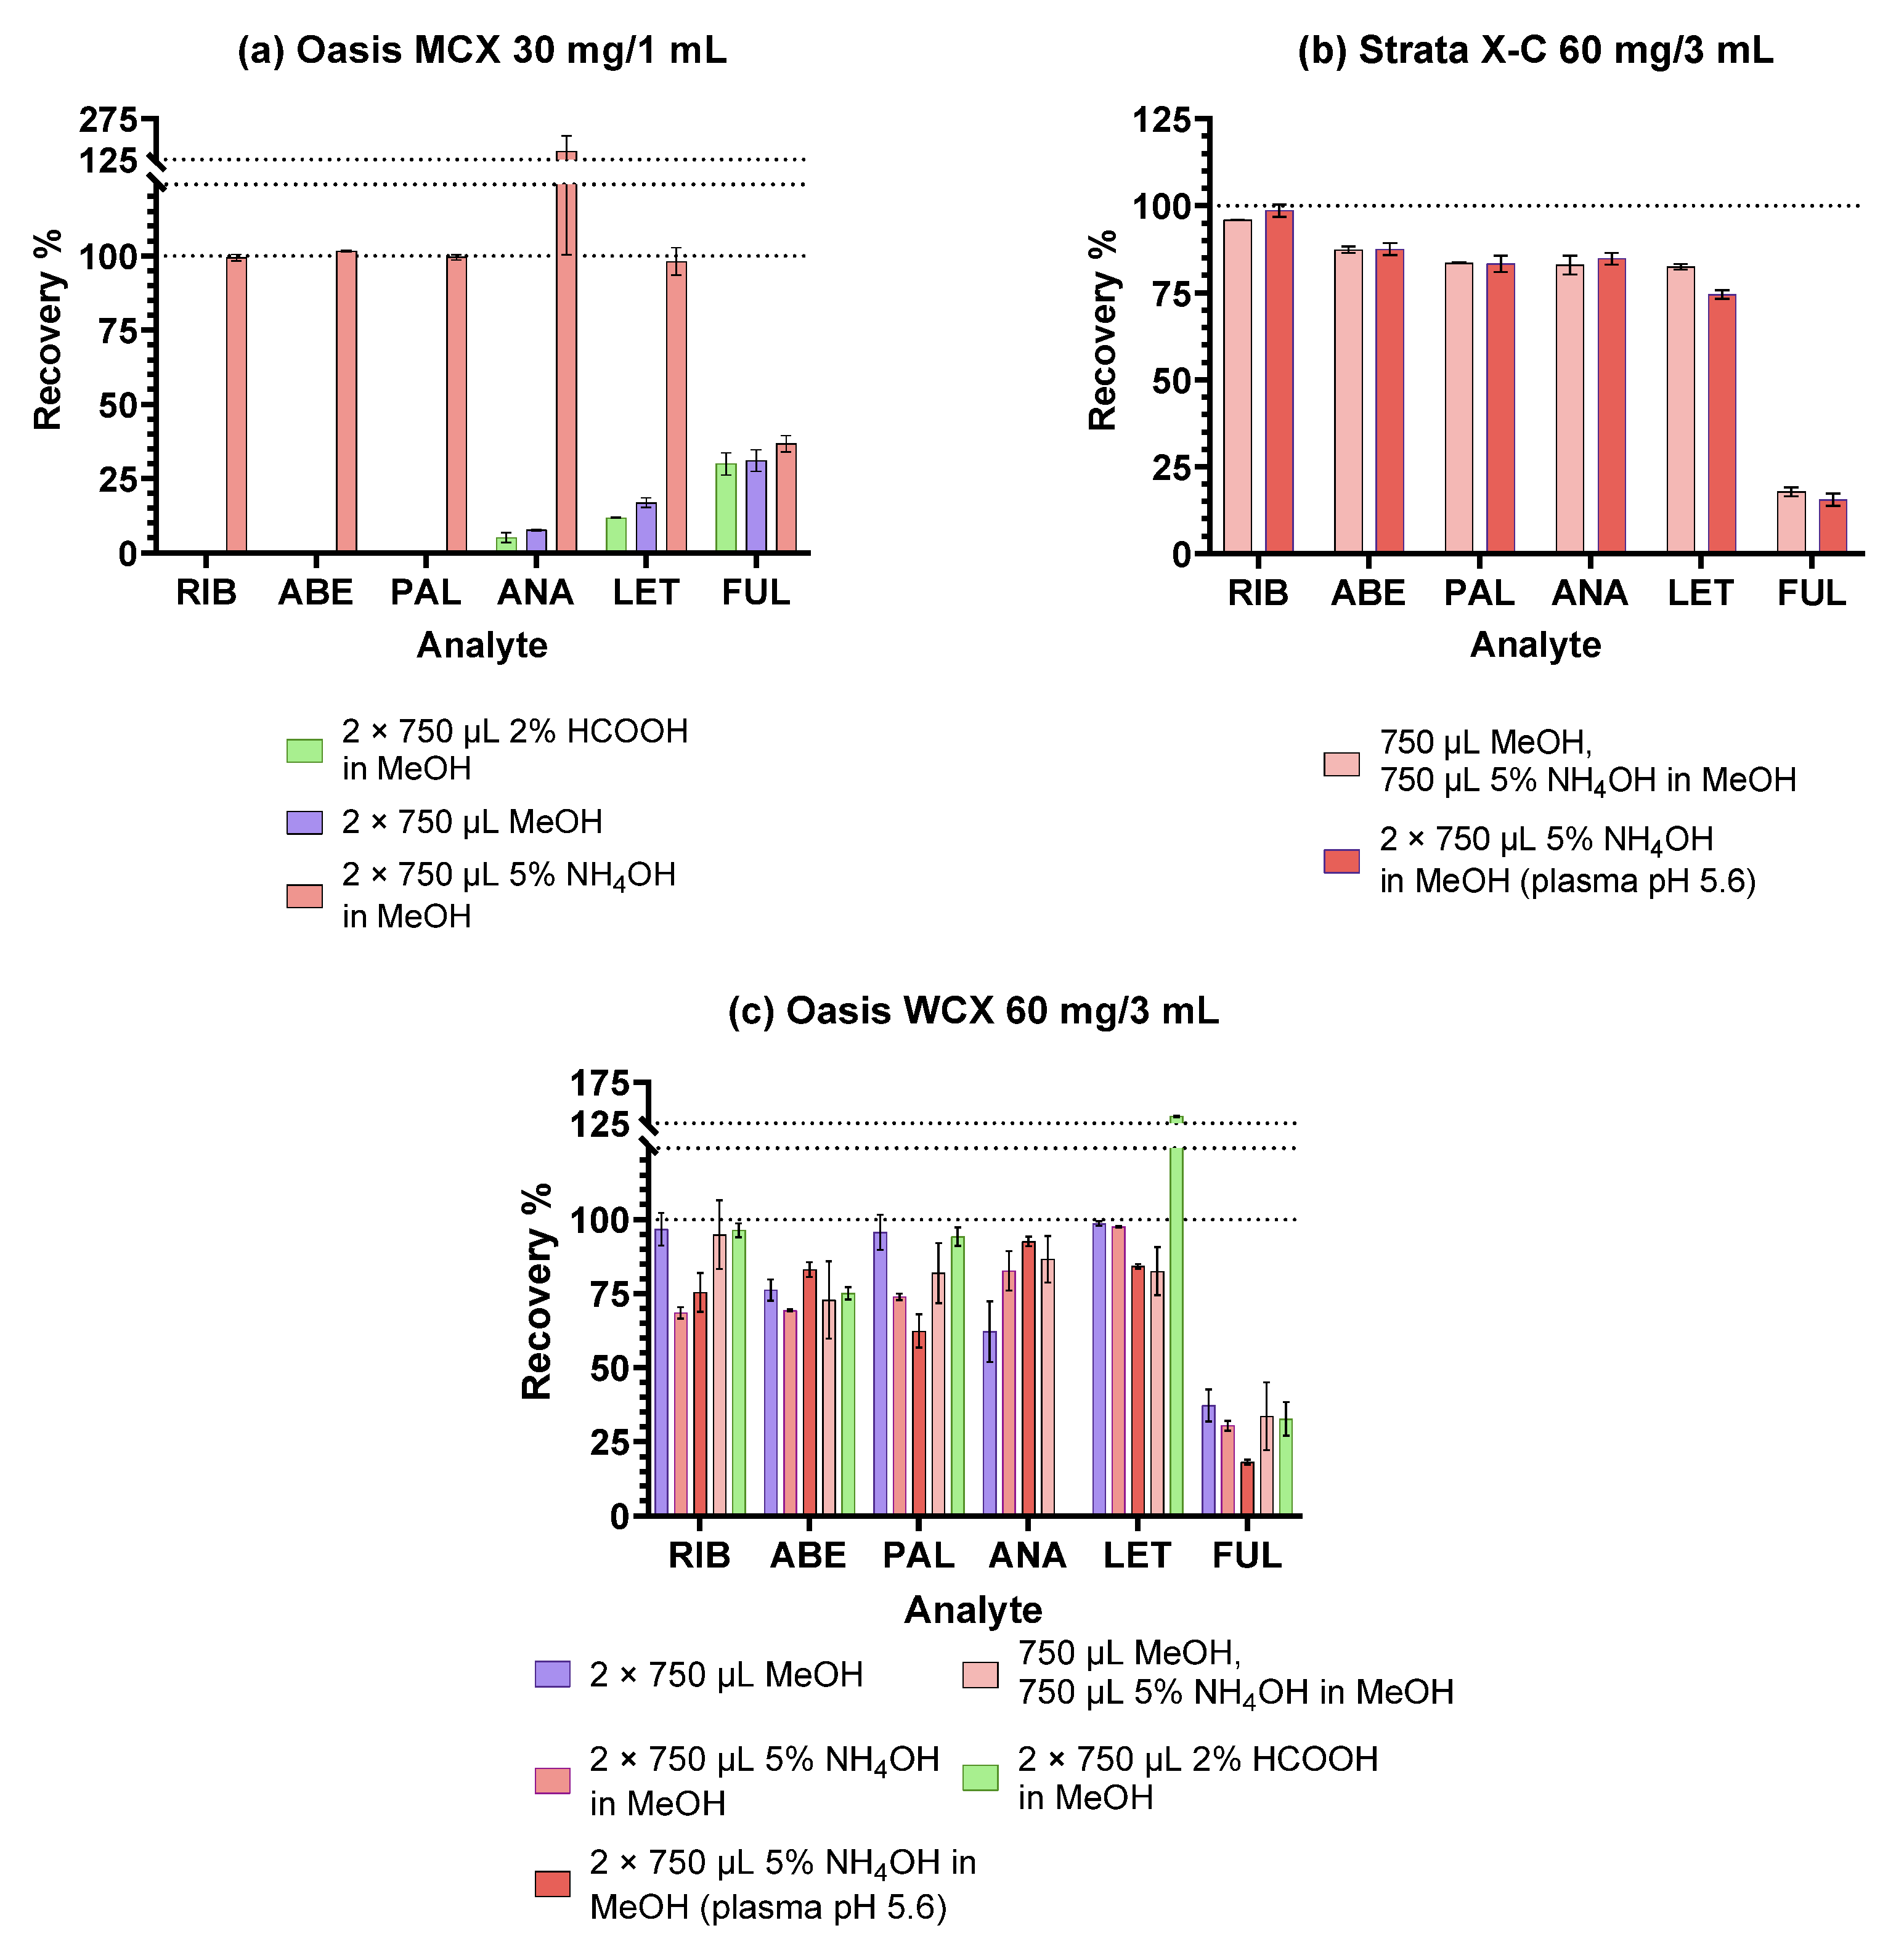
2.1.2. Ion-Exchange Sorbents
2.2. Method Validation
2.2.1. Linearity and Calibration range
2.2.2. Accuracy and Precision
2.2.3. Selectivity and Carry-Over
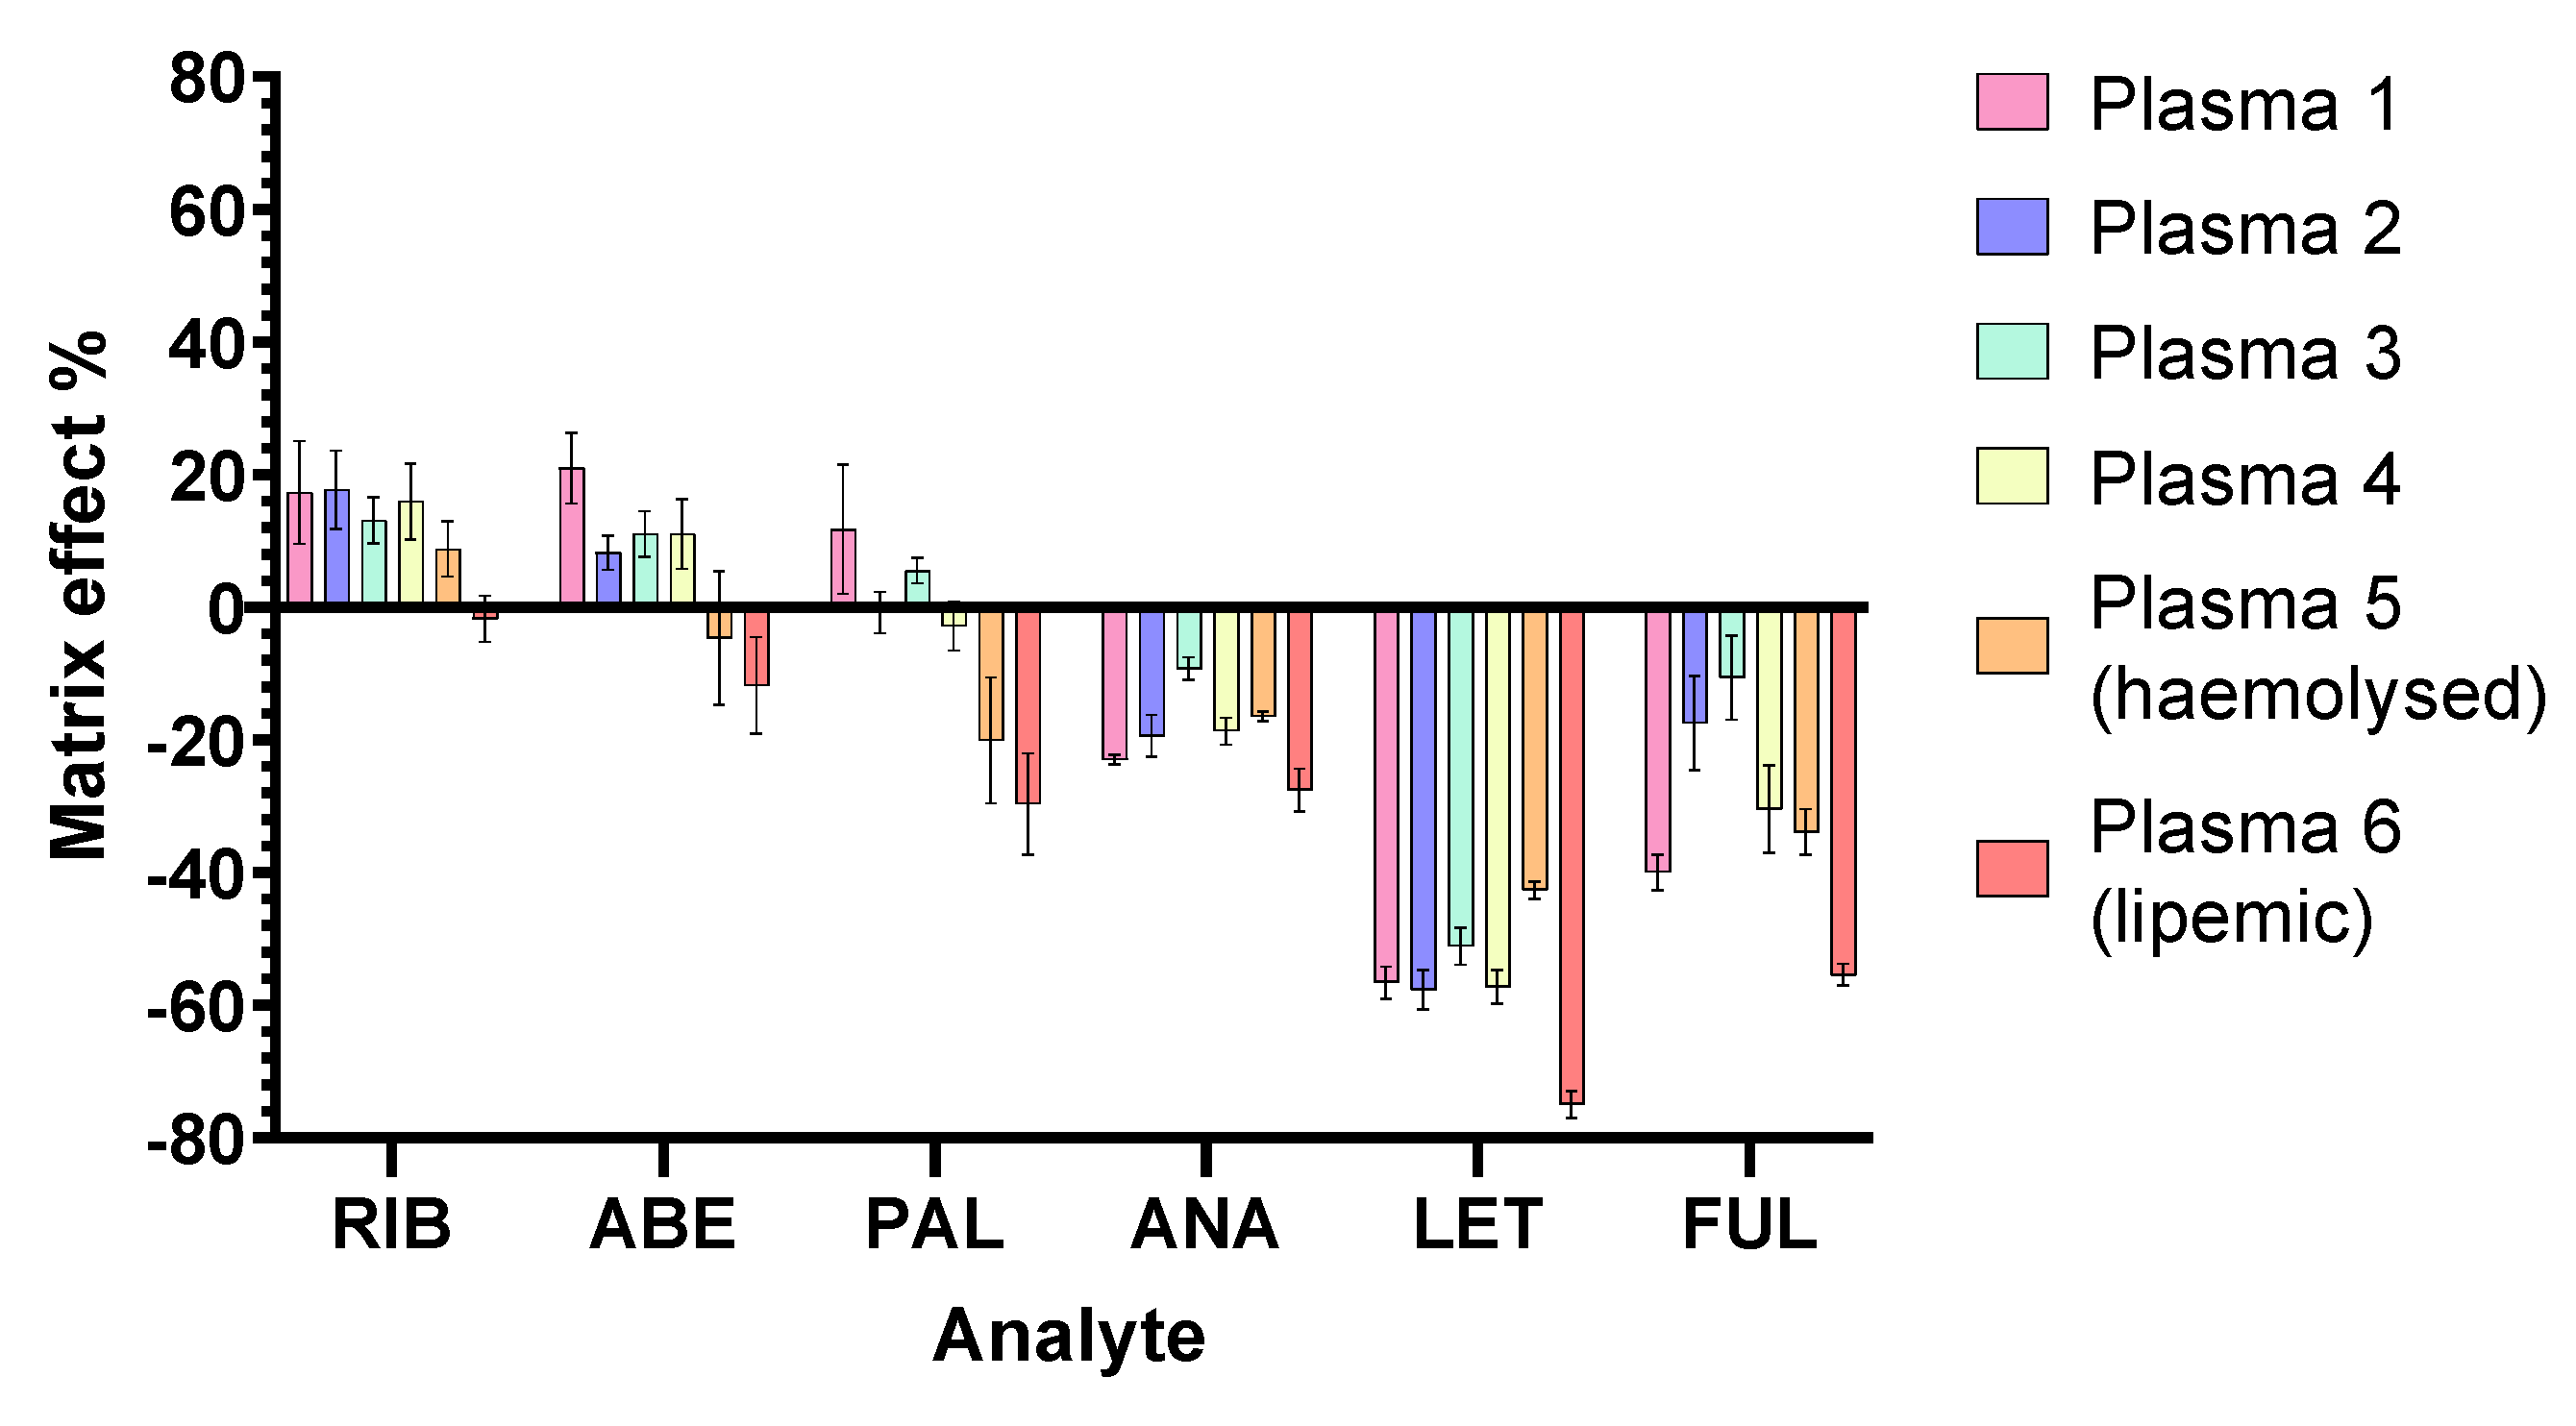
2.2.4. Matrix Effects
2.3. Analysis of Patient Samples
2.4. Comparison with Previously Published Methods
3. Materials and Methods
3.1. Chemicals and Reagents
3.2. Preparation of the Standard Solutions
3.3. Plasma Sample Pretreatment
3.4. Plasma Sample Preparation
3.5. Chromatographic Conditions
3.6. Detection Conditions
3.7. Data Collection and Analysis
4. Conclusions
Supplementary Materials
Author Contributions
Funding
Institutional Review Board Statement
Informed Consent Statement
Data Availability Statement
Acknowledgments
Conflicts of Interest
References
- Engler, T.; Fasching, P.A.; Lüftner, D.; Hartkopf, A.D.; Müller, V.; Kolberg, H.C.; Hadji, P.; Tesch, H.; Häberle, L.; Ettl, J.; et al. Implementation of CDK4/6 Inhibitors and its Influence on the Treatment Landscape of Advanced Breast Cancer Patients—Data from the Real-World Registry PRAEGNANT. Geburtshilfe Frauenheilkd. 2022, 82, 1055–1067. [Google Scholar] [CrossRef]
- Mueller-Schoell, A.; Groenland, S.L.; Scherf-Clavel, O.; van Dyk, M.; Huisinga, W.; Michelet, R.; Jaehde, U.; Steeghs, N.; Huitema, A.D.R.; Kloft, C. Therapeutic drug monitoring of oral targeted antineoplastic drugs. Eur. J. Clin. Pharmacol. 2021, 77, 441–464. [Google Scholar] [CrossRef] [PubMed]
- Pena-Pereira, F.; Wojnowski, W.; Tobiszewski, M. AGREE—Analytical GREEnness Metric Approach and Software. Anal. Chem. 2020, 92, 10076–10082. [Google Scholar] [CrossRef] [PubMed]
- Mlinarić, Z.; Turković, L.; Begović, I.; Nigović, B.; Sertić, M. Rapid Capillary Electrophoresis Method for Simultaneous Determination of Abemaciclib, Ribociclib, and Palbociclib in Pharmaceutical Dosage Forms: A Green Approach. Molecules 2022, 27, 7603. [Google Scholar] [CrossRef] [PubMed]
- Turković, L.; Koraj, N.; Mlinarić, Z.; Silovski, T.; Crnković, S.; Sertić, M. Optimisation of dispersive liquid-liquid microextraction for plasma sample preparation in bioanalysis of CDK4/6 inhibitors in therapeutic combinations for breast cancer treatment. Heliyon 2023, 9, e18880. [Google Scholar] [CrossRef]
- Sentellas, S.; Saurina, J.; Núñez, O. Solid-phase extraction in bioanalytical applications. In Solid-Phase Extraction; Poole, C.F., Ed.; Elsevier: Amsterdam, The Netherlands, 2020; pp. 673–698. ISBN 9780128169063. [Google Scholar]
- Waters Oasis Sample Extraction Products—Taking the Complexity Out of SPE Method Development. Available online: https://www.waters.com/webassets/cms/library/docs/720005685en.pdf (accessed on 25 August 2023).
- Fontanals, N.; Marcé, R.M.; Borrull, F.; Cormack, P.A.G. Mixed-mode ion-exchange polymeric sorbents: Dual-phase materials that improve selectivity and capacity. TrAC Trends Anal. Chem. 2010, 29, 765–779. [Google Scholar] [CrossRef]
- Dias, N.C.; Poole, C.F. Mechanistic study of the sorption properties of Oasis® HLB and its use in solid-phase extraction. Chromatographia 2002, 56, 269–275. [Google Scholar] [CrossRef]
- Mutavdžić Pavlović, D.; Babić, S.; Horvat, A.J.M.; Kaštelan-Macan, M. Sample preparation in analysis of pharmaceuticals. TrAC Trends Anal. Chem. 2007, 26, 1062–1075. [Google Scholar] [CrossRef]
- Sato, Y.; Shigeta, K.; Hirasawa, T.; Sato, T.; Ogura, J.; Maekawa, M.; Ebata, A.; Hamanaka, Y.; Tada, H.; Ishida, T.; et al. Establishment of an analytical method for simultaneous quantitation of CDK4/6 inhibitors, aromatase inhibitors, and an estrogen receptor antagonist in human plasma using LC-ESI-MS/MS. J. Chromatogr. B Anal. Technol. Biomed. Life Sci. 2021, 1173, 122655. [Google Scholar] [CrossRef]
- Turković, L.; Bočkor, L.; Ekpenyong, O.; Silovski, T.; Lovrić, M.; Crnković, S.; Nigović, B.; Sertić, M. Development and Validation of a Novel LC-MS/MS Method for the Simultaneous Determination of Abemaciclib, Palbociclib, Ribociclib, Anastrozole, Letrozole, and Fulvestrant in Plasma Samples: A Prerequisite for Personalized Breast Cancer Treatment. Pharmaceuticals 2022, 15, 614. [Google Scholar] [CrossRef]
- Gumustas, M.; Sengel-Turk, C.T.; Hascicek, C.; Ozkan, S.A. Optimization of a validated stability-indicating RP-LC method for the determination of fulvestrant from polymeric based nanoparticle systems, drugs and biological samples. Biomed. Chromatogr. 2014, 28, 1409–1417. [Google Scholar] [CrossRef]
- Chavan, B.B.; Tiwari, S.; Shankar, G.; Nimbalkar, R.D.; Garg, P.; Srinivas, R.; Talluri, M.V.N.K. In vitro and in vivo metabolic investigation of the Palbociclib by UHPLC-Q-TOF/MS/MS and in silico toxicity studies of its metabolites. J. Pharm. Biomed. Anal. 2018, 157, 59–74. [Google Scholar] [CrossRef] [PubMed]
- Martínez-Chávez, A.; Rosing, H.; Hillebrand, M.; Tibben, M.; Schinkel, A.H.; Beijnen, J.H. Development and validation of a bioanalytical method for the quantification of the CDK4/6 inhibitors abemaciclib, palbociclib, and ribociclib in human and mouse matrices using liquid chromatography-tandem mass spectrometry. Anal. Bioanal. Chem. 2019, 411, 5331–5345. [Google Scholar] [CrossRef]
- Soledad Poetto, A.; Posocco, B.; Zanchetta, M.; Gagno, S.; Orleni, M.; Canil, G.; Alberti, M.; Puglisi, F.; Toffoli, G. A new LC-MS/MS method for the simultaneous quantification of abemaciclib, its main active metabolites M2 and M20, and letrozole for therapeutic drug monitoring. J. Chromatogr. B Anal. Technol. Biomed. Life Sci. 2022, 1207, 123403. [Google Scholar] [CrossRef] [PubMed]
- Posocco, B.; Buzzo, M.; Poetto, A.S.; Orleni, M.; Gagno, S.; Zanchetta, M.; Iacuzzi, V.; Guardascione, M.; Puglisi, F.; Basile, D.; et al. Simultaneous quantification of palbociclib, ribociclib and letrozole in human plasma by a new LC-MS/MS method for clinical application. PLoS ONE 2020, 15, e0228822. [Google Scholar] [CrossRef]
- Habler, K.; Kalla, A.S.; Rychlik, M.; Vogeser, M.; Teupser, D. Therapeutic drug monitoring in breast cancer therapy—LC-MS/MS method for quantification of the CDK4/6 inhibitors abemaciclib, palbociclib, ribociclib, and major metabolites abemaciclib M20 and M2 in human serum. J. Pharm. Biomed. Anal. 2023, 225, 115211. [Google Scholar] [CrossRef] [PubMed]
- Margaryan, T.; Elliott, M.; Sanai, N.; Tovmasyan, A. Simultaneous determination of LY3214996, abemaciclib, and M2 and M20 metabolites in human plasma, cerebrospinal fluid, and brain tumor by LC-MS/MS. J. Pharm. Anal. 2022, 12, 601–609. [Google Scholar] [CrossRef]
- Burke, S.M.; Kamal, M.K.; Goey, A.K. Development and Validation of a Quantitative LC-MS/MS Method for CDK4/6 Inhibitors Palbociclib, Ribociclib, Abemaciclib, and Abemaciclib-M2 in Human Plasma. Ther. Drug Monit. 2023, 45, 327–336. [Google Scholar] [CrossRef]
- Alegete, P.; Kancherla, P.; Albaseer, S.S.; Boodida, S. A validated liquid chromatography–tandem mass spectrometric (LC-MS/MS) method for the estimation of fulvestrant in human plasma. Orient. J. Chem. 2017, 33, 1146–1155. [Google Scholar] [CrossRef]
- Jolibois, J.; Schmitt, A.; Royer, B. A simple and fast LC-MS/MS method for the routine measurement of cabozantinib, olaparib, palbociclib, pazopanib, sorafenib, sunitinib and its main active metabolite in human plasma. J. Chromatogr. B Anal. Technol. Biomed. Life Sci. 2019, 1132, 121844. [Google Scholar] [CrossRef]
- Beer, B.; Schubert, B.; Oberguggenberger, A.; Meraner, V.; Hubalek, M.; Oberacher, H. Development and validation of a liquid chromatography-tandem mass spectrometry method for the simultaneous quantification of tamoxifen, anastrozole, and letrozole in human plasma and its application to a clinical study. Anal. Bioanal. Chem. 2010, 398, 1791–1800. [Google Scholar] [CrossRef]
- Nalanda, R.B.; Srinivasa Rao, A.; Gowri Sankar, D. Determination of palbociclib in human plasma using high performance liquid chromatography—Ultraviolet detection. Int. J. Pharm. Sci. Res. 2018, 9, 3883–3888. [Google Scholar] [CrossRef]
- Leenhardt, F.; Gracia, M.; Perrin, C.; Muracciole-Bich, C.; Marion, B.; Roques, C.; Alexandre, M.; Firmin, N.; Pouderoux, S.; Mbatchi, L.; et al. Liquid chromatography–tandem mass spectrometric assay for the quantification of CDK4/6 inhibitors in human plasma in a clinical context of drug-drug interaction. J. Pharm. Biomed. Anal. 2020, 188, 113438. [Google Scholar] [CrossRef]
- Daina, A.; Michielin, O.; Zoete, V. SwissADME: A free web tool to evaluate pharmacokinetics, drug-likeness and medicinal chemistry friendliness of small molecules. Sci. Rep. 2017, 7, 42717. [Google Scholar] [CrossRef] [PubMed]
- ChemAxon Chemicalize. Available online: www.chemicalize.com (accessed on 1 October 2023).
- Phenomenex Strata X-C SPE Products. Available online: https://www.phenomenex.com/products/strata-x-solid-phase-extraction-products/strata-x-c (accessed on 1 October 2023).
- Phenomenex SPE Method Development Tool. Available online: https://www.phenomenex.com/Tools/SPEMethodDevelopment (accessed on 17 May 2022).
- Mutavdžić Pavlović, D.; Babić, S.; Dolar, D.; Ašperger, D.; Košutić, K.; Horvat, A.J.M.; Kaštelan-Macan, M. Development and optimization of the SPE procedure for determination of pharmaceuticals in water samples by HPLC-diode array detection. J. Sep. Sci. 2010, 33, 258–267. [Google Scholar] [CrossRef]
- Samant, T.S.; Dhuria, S.; Lu, Y.; Laisney, M.; Yang, S.; Grandeury, A.; Mueller-Zsigmondy, M.; Umehara, K.; Huth, F.; Miller, M.; et al. Ribociclib Bioavailability Is Not Affected by Gastric pH Changes or Food Intake: In Silico and Clinical Evaluations. Clin. Pharmacol. Ther. 2018, 104, 374–383. [Google Scholar] [CrossRef] [PubMed]
- Fujiwara, Y.; Tamura, K.; Kondo, S.; Tanabe, Y.; Iwasa, S.; Shimomura, A.; Kitano, S.; Ogasawara, K.; Turner, P.K.; Mori, J.; et al. Phase 1 study of abemaciclib, an inhibitor of CDK 4 and 6, as a single agent for Japanese patients with advanced cancer. Cancer Chemother. Pharmacol. 2016, 78, 281–288. [Google Scholar] [CrossRef] [PubMed]
- Tamura, K.; Mukai, H.; Naito, Y.; Yonemori, K.; Kodaira, M.; Tanabe, Y.; Yamamoto, N.; Osera, S.; Sasaki, M.; Mori, Y.; et al. Phase I study of palbociclib, a cyclin-dependent kinase 4/6 inhibitor, in Japanese patients. Cancer Sci. 2016, 107, 755–763. [Google Scholar] [CrossRef] [PubMed]
- Dowsett, M.; Cuzick, J.; Howell, A.; Jackson, I. Pharmacokinetics of anastrozole and tamoxifen alone, and in combination, during adjuvant endocrine therapy for early breast cancer in postmenopausal women: A sub-protocol of the “ArimidexTM and tamoxifen alone or in combination” (ATAC) trial. Br. J. Cancer 2001, 85, 317–324. [Google Scholar] [CrossRef]
- Desta, Z.; Kreutz, Y.; Nguyen, A.; Li, L.; Skaar, T.; Kamdem, L.; Henry, N.; Hayes, D.; Storniolo, A.; Stearns, V.; et al. Plasma Letrozole Concentrations in Postmenopausal Women with Breast Cancer Are Associated with CYP2A6 Genetic Variants, Body Mass Index, and Age. Clin. Pharmacol. Ther. 2011, 90, 693–700. [Google Scholar] [CrossRef]
- European Medicines Agency (EMA). EPAR Product Information: Faslodex. Available online: https://www.ema.europa.eu/en/documents/product-information/faslodex-epar-product-information_en.pdf (accessed on 15 February 2022).

| Analyte | RIB | PAL |
|---|---|---|
| Structure, interactions, pKa | 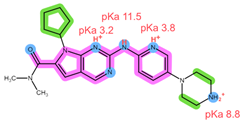 | 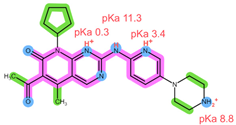 |
| Emp. formula Molar mass logP HB donors HB acceptors TPSA Rotatable bonds | C23H30N8O 434.5 g/mol 2.04 2 5 91.21 Ų 5 | C24H29N7O2 447.5 g/mol 2.39 2 6 105.04 Ų 5 |
| Analyte | ABE | FUL |
| Structure, interactions, pKa | 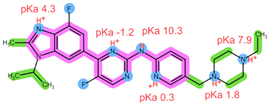 | 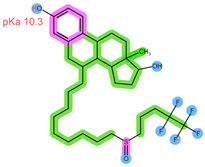 |
| Emp. formula Molar mass logP HB donors HB acceptors TPSA Rotatable bonds | C27H32F2N8 506.6 g/mol 4.04 1 8 75.00 Ų 7 | C32H47F5O3S 606.8 g/mol 8.06 2 8 76.74 Ų 14 |
| Analyte | ANA | LET |
| Structure, interactions, pKa | 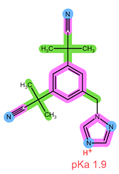 | 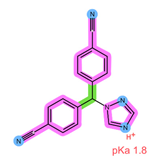 |
| Emp. formula Molar mass logP HB donors HB acceptors TPSA Rotatable bonds | C17H19N5 293.4 g/mol 2.35 0 4 78.29 Ų 4 | C17H11N5 285.3 g/mol 2.32 0 4 78.29 Ų 3 |
| Sorbent | Sep-Pak Vac C18 | Sep-Pak Vac C8 | Oasis HLB |
|---|---|---|---|
| Structure | 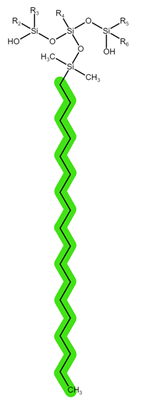 | 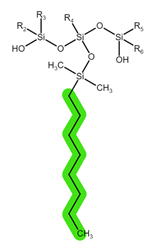 | 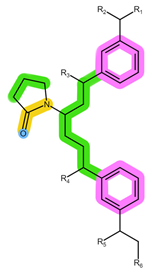 |
| Experiment | I. | II. |
|---|---|---|
| SPE cartridges | Oasis HLB 60 mg/3 mL Sep-Pak Vac C18 200 mg/3 mL Sep-Pak Vac C8 200 mg/3 mL | Oasis HLB 60 mg/3 mL Sep-Pak Vac C8 500 mg/3 mL |
| 1. Conditioning | 2 mL MeOH 2 mL H2O | 2 mL MeOH 2 mL H2O |
| 2. Sample addition (400 µL diluted plasma sample) | ||
| 3. Washing | 1 mL H2O 1 mL 5% MeOH | 1 mL H2O 1 mL 5% MeOH |
| 4. Elution | 2 × 750 µL MeOH or 2 × 750 µL ACN or 2 × 750 µL 5% NH4OH in MeOH or 2 × 750 µL 2% HCOOH in MeOH | HLB: 750 µL MeOH and 750 µL 2% HCOOH in MeOH or 750 µL 2% HCOOH in MeOH and 750 µL MeOH C8: 2 × 250 µL MeOH or 2 × 500 µL MeOH or 2 × 750 µL MeOH |
| Sorbent | Oasis MCX | Oasis WCX | Strata X-C |
|---|---|---|---|
| Structure | 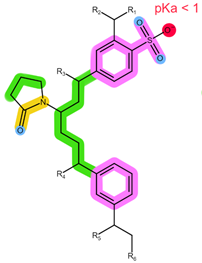 | 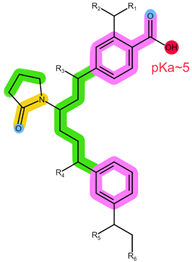 | 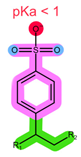 |
| Experiment | IV. | V. | VI. |
|---|---|---|---|
| SPE cartridges | Oasis MCX 30 mg/1 mL Oasis WCX 60 mg/3 mL | Oasis WCX 60 mg/3 mL Strata-X-C 60 mg/3 mL | Oasis WCX 60 mg/3 mL Strata-X-C 60 mg/3 mL |
| 1. Conditioning | 2 mL MeOH 2 mL 0.2% H3PO4 | 2 mL MeOH 2 mL 0.2% H3PO4 | 1 mL MeOH 1 mL 100 mM Na-Ac (pH 5.6) |
| 2. Sample addition (400 µL diluted plasma sample) | |||
| 3. Washing | 3 mL 0.2% H3PO4 2 mL 0.1 M HCl | 3 mL 0.2% H3PO4 2 mL 0.1 M HCl | 1 mL Na-Ac (pH 5.6) 1 mL MeOH:100 mM Na-Ac (pH 5.6) = 2:8 |
| 4. Elution | 2 × 750 µL MeOH or 2 × 750 µL 5% NH4OH in MeOH or 2 × 750 µL 2% HCOOH in MeOH | 750 µL MeOH and 750 µL 5% NH4OH in MeOH | 2 × 750 µL 5% NH4OH in MeOH |
| Analyte | RIB | ABE | PAL | ANA | LET | FUL |
|---|---|---|---|---|---|---|
| Range (ng/mL) | 700–3500 | 80–400 | 40–200 | 20–100 | 40–200 | 10–50 |
| Slope | 1103 | 10,846 | 11,875 | 68,230 | 5066 | 3013 |
| Intercept | 620,726 | 613,810 | −6744 | −28,605 | 4075 | −17,390 |
| R | 0.9953 | 0.9933 | 0.9970 | 0.9983 | 0.9948 | 0.9972 |
| N(points) | 7 | 7 | 7 | 7 | 7 | 7 |
| Max. %bias * | 5.77 | −7.85 | 4.62 | −5.01 | 8.06 | −6.60 |
| Analyte | Concentration (ng/mL) | Intra-Day, n = 10 | Inter-Day, n = 15 | ||
|---|---|---|---|---|---|
| Bias% | RSD% | Bias% | RSD% | ||
| RIB | 700 | 0.6 | 7.1 | 1.3 | 6.6 |
| 1120 | 9.5 | 1.8 | 10.4 | 2.9 | |
| 2800 | −3.2 | 1.8 | −2.8 | 2.0 | |
| ABE | 80 | −12.1 | 12.2 | −7.7 | 11.3 |
| 128 | −1.3 | 3.9 | 4.2 | 6.1 | |
| 320 | −2.3 | 3.1 | −3.6 | 3.0 | |
| PAL | 40 | 7.0 | 9.1 | 4.7 | 8.2 |
| 64 | 10.0 | 4.7 | 8.1 | 4.3 | |
| 160 | 3.1 | 3.0 | −0.5 | 4.9 | |
| ANA | 20 | −6.0 | 9.6 | −2.0 | 8.8 |
| 32 | −4.3 | 6.6 | −0.4 | 7.3 | |
| 80 | −5.8 | 4.4 | 1.1 | 8.6 | |
| LET | 40 | 7.3 | 9.2 | 3.2 | 9.0 |
| 64 | 6.0 | 8.6 | 4.6 | 9.1 | |
| 160 | −3.9 | 12.4 | 1.4 | 13.4 | |
| FUL | 10 | 8.2 | 14.2 | 13.5 | 14.3 |
| 16 | 8.7 | 14.8 | 2.0 | 14.3 | |
| 40 | −11.5 | 6.6 | −12.7 | 12.9 | |
| Reference | Analytes | Analytical Technique | Sample Preparation Technique | Mean Extraction Recovery | Linear Range |
|---|---|---|---|---|---|
| Beer et al., 2010. [23] | ANA, LET, tamoxifen | LC-MS/MS | SPE w/Strata X-C (200 mg/3 mL) | 92% ANA, 89% LET | 5–200 ng/mL ANA, 10–300 ng/mL LET |
| Chavan et al., 2018. [14] | PAL | LC-MS/MS | PPT w/ACN, evaporation, SPE w/Phenomenex C18 | n.a. | n.a. |
| Nalanda et al., 2018. [24] | PAL | LC-DAD | SPE w/Oasis HLB (30 mg/1 mL) | 72.1% | 100–3000 ng/mL |
| Leenhardt et al., 2021. [25] | PAL, RIB | LC-MS/MS | SPE w/Oasis HLB (30 mg/1 mL) | n.a. | 3.9–129 ng/mL |
| Sato et al., 2021. [11] | PAL, RIB, ABE, ANA, LET, FUL | LC-MS/MS | PPT w/ACN:MeOH 9:1 | n.a. | 1–75 ng/mL ANA and FUL, 5–375 ng/mL PAL, 10–750 ng/mL ABE and LET, 100–7500 ng/mL RIB |
| Turković et al., 2022. [12] | PAL, RIB, ABE, ANA, LET, FUL | LC-MS/MS | PPT w/ACN | >85% | 1–200 ng/mL ANA, 2.5–500 ng/mL LET, 3.1–500 ng/mL PAL, 5–1000 ng/mL FUL, 15–3000 ng/mL ABE, 25–5000 ng/mL RIB |
| Turković et al., 2023. [5] | PAL, RIB, ABE, ANA, LET, FUL | LC-DAD- FLD | PPT w/ACN, DLLME | 81.7–95.6% | 2.50–60.0 µg/mL ANA, 0.04–1.00 µg/mL LET, 0.08–1.92 µg/mL PAL, 0.50–12.0 µg/mL FUL, 0.11–2.61 µg/mL ABE, 0.25–5.95 µg/mL RIB |
| This work | PAL, RIB, ABE, ANA, LET, FUL | LC-MS/MS | SPE w/Sep-Pak Vac C8 (200 mg/ 3 mL) | 92.3–105.5% | 20–100 ng/mL ANA, 40–200 ng/mL LET and PAL, 10–50 ng/mL FUL, 80–400 ng/mL ABE, 700–3500 ng/mL RIB |
| Calibrant | RIB | ABE | PAL | ANA | LET | FUL |
|---|---|---|---|---|---|---|
| 1 | 700 | 80 | 40 | 20 | 40 | 10 |
| 2 | 1120 | 128 | 64 | 32 | 64 | 16 |
| 3 | 1400 | 160 | 80 | 40 | 80 | 20 |
| 4 | 1750 | 200 | 100 | 50 | 100 | 25 |
| 5 | 2100 | 240 | 120 | 60 | 120 | 30 |
| 6 | 2520 | 288 | 144 | 72 | 144 | 36 |
| 7 | 2800 | 320 | 160 | 80 | 160 | 40 |
| 8 | 3500 | 400 | 200 | 100 | 200 | 50 |
| Time (min) | Mobile Phase B (%) |
|---|---|
| 0.0 | 30.0 |
| 5.5 | 85.0 |
| 9.5 | 90.0 |
| 10.0 | 100.0 |
| 16.5 | 100.0 |
| 17.0 | 30.0 |
| 30.0 | 30.0 |
| Time (min) | Mobile Phase B (%) |
|---|---|
| 0.0 | 5.0 |
| 10.5 | 85.0 |
| 14.5 | 90.0 |
| 15.0 | 100.0 |
| 20.0 | 100.0 |
| 20.5 | 30.0 |
| 26.0 | 30.0 |
| Analyte | Precursor Ion (m/z) | Product Ion (m/z) | CE (V) | Dwell Time (ms) | Fragmentor (V) |
|---|---|---|---|---|---|
| RIB | 435.2 | 322.1 | 25 | 200 | 200 |
| 252.1 | 30 | ||||
| ABE | 507.2 | 393.1 | 25 | 60 | 140 |
| 245.0 | 75 | ||||
| PAL | 448.0 | 380.3 | 30 | 60 | 180 |
| 362.0 | 45 | ||||
| ANA | 294.1 | 225.4 | 25 | 60 | 140 |
| 115.2 | 70 | ||||
| LET | 217.0 | 190.3 | 25 | 60 | 120 |
| 164.1 | 50 | ||||
| FUL | 607.4 | 589.0 | 15 | 200 | 160 |
| 467.0 | 29 |
Disclaimer/Publisher’s Note: The statements, opinions and data contained in all publications are solely those of the individual author(s) and contributor(s) and not of MDPI and/or the editor(s). MDPI and/or the editor(s) disclaim responsibility for any injury to people or property resulting from any ideas, methods, instructions or products referred to in the content. |
© 2023 by the authors. Licensee MDPI, Basel, Switzerland. This article is an open access article distributed under the terms and conditions of the Creative Commons Attribution (CC BY) license (https://creativecommons.org/licenses/by/4.0/).
Share and Cite
Turković, L.; Mutavdžić Pavlović, D.; Mlinarić, Z.; Skenderović, A.; Silovski, T.; Sertić, M. Optimisation of Solid-Phase Extraction and LC-MS/MS Analysis of Six Breast Cancer Drugs in Patient Plasma Samples. Pharmaceuticals 2023, 16, 1445. https://doi.org/10.3390/ph16101445
Turković L, Mutavdžić Pavlović D, Mlinarić Z, Skenderović A, Silovski T, Sertić M. Optimisation of Solid-Phase Extraction and LC-MS/MS Analysis of Six Breast Cancer Drugs in Patient Plasma Samples. Pharmaceuticals. 2023; 16(10):1445. https://doi.org/10.3390/ph16101445
Chicago/Turabian StyleTurković, Lu, Dragana Mutavdžić Pavlović, Zvonimir Mlinarić, Anamarija Skenderović, Tajana Silovski, and Miranda Sertić. 2023. "Optimisation of Solid-Phase Extraction and LC-MS/MS Analysis of Six Breast Cancer Drugs in Patient Plasma Samples" Pharmaceuticals 16, no. 10: 1445. https://doi.org/10.3390/ph16101445
APA StyleTurković, L., Mutavdžić Pavlović, D., Mlinarić, Z., Skenderović, A., Silovski, T., & Sertić, M. (2023). Optimisation of Solid-Phase Extraction and LC-MS/MS Analysis of Six Breast Cancer Drugs in Patient Plasma Samples. Pharmaceuticals, 16(10), 1445. https://doi.org/10.3390/ph16101445