
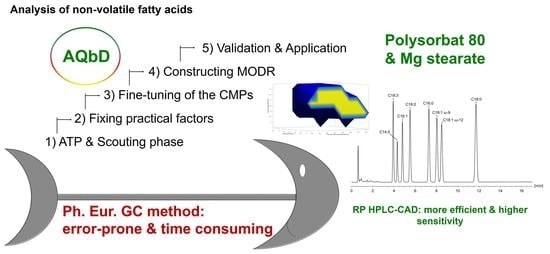
Analytical Quality by Design: Achieving Robustness of an LC-CAD Method for the Analysis of Non-Volatile Fatty Acids
 , , and
Abstract
:
1. Introduction
2. Results and Discussion
2.1. Analytical Target Profile: Defining the Scope of the Method
2.2. Design of Experiments in Modeling of Critical Method Attributes
2.2.1. Scouting Stage: Selection of Organic Solvent and Column Type
2.2.2. Fixing Some of the High-Risk Factors at Reasonable Levels
2.2.3. Fine-Tuning of CMPs via RSM
2.3. Computation of the MODR via Monte Carlo Simulations
2.4. Validation and Application
2.4.1. Validation
2.4.2. Application Examples
3. Materials and Methods
3.1. Chemicals and Reagents
3.2. Preparation of Solutions and Samples
3.2.1. Standard Solutions for Method Development
3.2.2. Application Examples—FA Composition in PS 80 and in Magnesium Stearate
3.3. HPLC-CAD Conditions and Equipment
3.4. Tools Used for Generating RSM and MODR
4. Conclusions
Supplementary Materials
Author Contributions
Funding
Institutional Review Board Statement
Informed Consent Statement
Data Availability Statement
Acknowledgments
Conflicts of Interest
Abbreviations
| ACN | Acetonitrile |
| ATP | Analytical Target Profile |
| AQbD | Analytical Quality by Design |
| CAD | Charged Aerosol Detector |
| CCD | Central Composite Design |
| CMA | Critical Method Attribute |
| CMP | Critical Method Parameter |
| DoE | Design of Experiments |
| DS | Design Space |
| FA | Fatty Acid |
| k | Retention factor |
| LC | Liquid Chromatography |
| LOQ | Limit of Quantitation |
| MC simulation | Monte Carlo simulation |
| MeOH | Methanol |
| MODR | Method Operable Design Region |
| PFV | Power Function Value |
| PS | Polysorbate |
| Ph. Eur. | European Pharmacopoeia |
| QbD | Quality by Design |
| R2 | Coefficient of Determination |
| RP | Reversed Phase |
| RSD | Relative Standard Deviation |
| RSM | Response Surface Methodology |
| S criterion | Separation criterion |
| S/N | Signal-to-Noise Ratio |
References
- Deidda, R.; Orlandini, S.; Hubert, P.; Hubert, C. Risk-Based Approach for Method Development in Pharmaceutical Quality Control Context: A Critical Review. J. Pharm. Biomed. Anal. 2018, 161, 110–121. [Google Scholar] [CrossRef] [PubMed]
- Industry 5.0. Available online: https://research-and-innovation.ec.europa.eu/research-area/industrial-research-and-innovation/industry-50_en (accessed on 27 December 2022).
- International Conference on Harmonization (ICH) Guideline Q14 “Analytical Procedure Development”; International Council for Harmonisation of Technical Requirements for Pharmaceuticals for Human Use: Geneva, Switzerland, 2022; Available online: https://www.ich.org/page/quality-guidelines (accessed on 11 January 2023).
- Inuwa, H.M.; Ravi Raja, A.; Kumar, A.; Singh, B.; Singh, S. Status of Industry 4.0 Applications in Healthcare 4.0 and Pharma 4.0. Mater. Today Proc. 2022, 62, 3593–3598. [Google Scholar] [CrossRef]
- Jackson, P.; Borman, P.; Campa, C.; Chatfield, M.; Godfrey, M.; Hamilton, P.; Hoyer, W.; Norelli, F.; Orr, R.; Schofield, T. Using the Analytical Target Profile to Drive the Analytical Method Lifecycle. Anal. Chem. 2019, 91, 2577–2585. [Google Scholar] [CrossRef] [PubMed]
- Borman, P.; Nethercote, P.; Chatfield, M.; Thompson, D.; Truman, K. The Application of Quality by Design to Analytical Methods; Advanstar Communications Inc.: Santa Monica, CA, USA, 2007. [Google Scholar]
- Rozet, E.; Lebrun, P.; Hubert, P.; Debrus, B.; Boulanger, B. Design Spaces for Analytical Methods. TrAC Trends Anal. Chem. 2013, 42, 157–167. [Google Scholar] [CrossRef]
- Gkountanas, K.; Malenović, A.; Dotsikas, Y. Determination of Bupropion and Its Impurities via a Chaotropic Chromatography Method Following Analytical Quality-by-Design Principles for Method Development. Pharmaceuticals 2022, 15, 1196. [Google Scholar] [CrossRef]
- Szoleczky, R.; Budai-Szűcs, M.; Csányi, E.; Berkó, S.; Tonka-Nagy, P.; Csóka, I.; Kovács, A. Analytical Quality by Design (AQbD) Approach to the Development of In Vitro Release Test for Topical Hydrogel. Pharmaceutics 2022, 14, 707. [Google Scholar] [CrossRef]
- Dispas, A.; Avohou, H.T.; Lebrun, P.; Hubert, P.; Hubert, C. ‘Quality by Design’ Approach for the Analysis of Impurities in Pharmaceutical Drug Products and Drug Substances. TrAC Trends Anal. Chem. 2018, 101, 24–33. [Google Scholar] [CrossRef]
- Park, G.; Kim, M.K.; Go, S.H.; Choi, M.; Jang, Y.P. Analytical Quality by Design (AQbD) Approach to the Development of Analytical Procedures for Medicinal Plants. Plants 2022, 11, 2960. [Google Scholar] [CrossRef]
- Verch, T.; Campa, C.; Chéry, C.C.; Frenkel, R.; Graul, T.; Jaya, N.; Nakhle, B.; Springall, J.; Starkey, J.; Wypych, J.; et al. Analytical Quality by Design, Life Cycle Management, and Method Control. AAPS J. 2022, 24, 34. [Google Scholar] [CrossRef]
- Tome, T.; Žigart, N.; Časar, Z.; Obreza, A. Development and Optimization of Liquid Chromatography Analytical Methods by Using AQbD Principles: Overview and Recent Advances. Org. Process Res. Dev. 2019, 23, 1784–1802. [Google Scholar] [CrossRef] [Green Version]
- International Conference on Harmonization (ICH) Guideline Q2 (R2) “Validation of Analytical Procedures”; International Council for Harmonisation of Technical Requirements for Pharmaceuticals for Human Use: Geneva, Switzerland, 2022; Available online: https://www.ich.org/page/quality-guidelines (accessed on 11 January 2023).
- Polysorbate 80 Monograph No. 0428. In European Pharmacopoeia; Council of Europe: European Department for the Quality of Medicines: Strasbourg, France, 2020; Available online: https://pheur.edqm.eu/app/11-0/content/default/0428E.htm (accessed on 8 November 2022).
- Macrogol Stearate Monograph No. 1234. In European Pharmacopoeia; Council of Europe: European Department for the Quality of Medicines: Strasbourg, France, 2020; Available online: https://pheur.edqm.eu/app/11-0/content/default/1234E.htm (accessed on 8 November 2022).
- Glycerol Monostearate 40–55 Monograph No. 0495. In European Pharmacopoeia; Council of Europe: European Department for the Quality of Medicines: Strasbourg, France, 2020; Available online: https://pheur.edqm.eu/app/11-0/content/default/0495E.htm (accessed on 8 November 2022).
- Magnesium Stearate Monograph No. 0229. In European Pharmacopoeia; Council of Europe: European Department for the Quality of Medicines: Strasbourg, France, 2020; Available online: https://pheur.edqm.eu/app/11-0/content/default/0229E.htm (accessed on 8 November 2022).
- 19. 2.4.22. Composition of Fatty Acids by Gas Chromatography. In European Pharmacopoeia; Council of Europe: European Department for the Quality of Medicines: Strasbourg, France, 2020.
- Grechkin, A.N.; Mukhtarova, L.S.; Hamberg, M. Thermal Conversions of Trimethylsilyl Peroxides of Linoleic and Linolenic Acids. Chem. Phys. Lipids 2005, 138, 93–101. [Google Scholar] [CrossRef] [PubMed]
- Ilko, D.; Braun, A.; Germershaus, O.; Meinel, L.; Holzgrabe, U. Fatty Acid Composition Analysis in Polysorbate 80 with High Performance Liquid Chromatography Coupled to Charged Aerosol Detection. Eur. J. Pharm. Biopharm. 2015, 94, 569–574. [Google Scholar] [CrossRef]
- Schilling, K.; Pawellek, R.; Lovejoy, K.; Muellner, T.; Holzgrabe, U. Influence of Charged Aerosol Detector Instrument Settings on the Ultra-High-Performance Liquid Chromatography Analysis of Fatty Acids in Polysorbate 80. J. Chromatogr. A 2018, 1576, 58–66. [Google Scholar] [CrossRef] [PubMed]
- International Conference on Harmonization (ICH) Guideline Q8 (R2) “Pharmaceutical Development”; International Council for Harmonisation of Technical Requirements for Pharmaceuticals for Human Use: Geneva, Swithzerland, 2009; Available online: https://www.ich.org/page/quality-guidelines (accessed on 11 January 2023).
- Snyder, L.R.; Kirkland, J.J.; Dolan, J.W. Introduction to Modern Liquid Chromatography, 3rd ed.; John Wiley & Sons, Inc.: Hoboken, NJ, USA, 2009; pp. 1–65. ISBN 978-0-470-16754-0. [Google Scholar]
- Martin, G.P.; Barnett, K.; Burgess, C.; Curry, P.D.; Ermer, J.; Gratzl, G.S.; Hammond, J.; Herrmann, J.; Kovacs, E.; LeBlond, D.J.; et al. Lifecycle Management of Analytical Procedures: Method Development, Procedure Performance Qualification, and Procedure Performance Verification. Available online: https://www.uspnf.com/sites/default/files/usp_pdf/EN/USPNF/revisions/lifecycle_pdf.pdf (accessed on 1 March 2023).
- International Conference on Harmonization (ICH) Guideline Q9 (R1) “Quality Risk Management”; International Council for Harmonisation of Technical Requirements for Pharmaceuticals for Human Use: Geneva, Swithzerland, 2023; Available online: https://www.ich.org/page/quality-guidelines (accessed on 11 January 2023).
- Tol, T.; Kadam, N.; Raotole, N.; Desai, A.; Samanta, G. A Simultaneous Determination of Related Substances by High Performance Liquid Chromatography in a Drug Product Using Quality by Design Approach. J. Chromatogr. A 2016, 1432, 26–38. [Google Scholar] [CrossRef] [PubMed]
- Candioti, L.V.; De Zan, M.M.; Cámara, M.S.; Goicoechea, H.C. Experimental Design and Multiple Response Optimization. Using the Desirability Function in Analytical Methods Development. Talanta 2014, 124, 123–138. [Google Scholar] [CrossRef] [PubMed]
- Gamache, P.H.; Kaufman, S.L. Principles of Charged Aerosol Detection. In Charged Aerosol Detection for Liquid Chromatography and Related Separation Techniques; John Wiley & Sons, Ltd.: Hoboken, NJ, USA, 2017; ISBN 978-1-119-39072-5. [Google Scholar]
- Stojanović, J.; Krmar, J.; Protić, A.; Svrkota, B.; Djajić, N.; Otašević, B. DoE Experimental Design in HPLC Separation of Pharmaceuticals: A Review. Arch. Pharm. 2021, 71, 279–301. [Google Scholar] [CrossRef]
- Pasquini, B.; Orlandini, S.; Furlanetto, S.; Gotti, R.; Del Bubba, M.; Boscaro, F.; Bertaccini, B.; Douša, M.; Pieraccini, G. Quality by Design as a Risk-Based Strategy in Pharmaceutical Analysis: Development of a Liquid Chromatography-Tandem Mass Spectrometry Method for the Determination of Nintedanib and Its Impurities. J. Chromatogr. A 2020, 1611, 460615. [Google Scholar] [CrossRef]
- Ferey, L.; Raimbault, A.; Rivals, I.; Gaudin, K. UHPLC Method for Multiproduct Pharmaceutical Analysis by Quality-by-Design. J. Pharm. Biomed. Anal. 2018, 148, 361–368. [Google Scholar] [CrossRef]
- Otašević, B.; Šljivić, J.; Protić, A.; Maljurić, N.; Malenović, A.; Zečević, M. Comparison of AQbD and Grid Point Search Methodology in the Development of Micellar HPLC Method for the Analysis of Cilazapril and Hydrochlorothiazide Dosage Form Stability. Microchem. J. 2019, 145, 655–663. [Google Scholar] [CrossRef]
- Bezerra, M.A.; Santelli, R.E.; Oliveira, E.P.; Villar, L.S.; Escaleira, L.A. Response Surface Methodology (RSM) as a Tool for Optimization in Analytical Chemistry. Talanta 2008, 76, 965–977. [Google Scholar] [CrossRef]
- Lebrun, P.; Govaerts, B.; Debrus, B.; Ceccato, A.; Caliaro, G.; Hubert, P.; Boulanger, B. Development of a New Predictive Modelling Technique to Find with Confidence Equivalence Zone and Design Space of Chromatographic Analytical Methods. Chemom. Intell. Lab. Syst. 2008, 91, 4–16. [Google Scholar] [CrossRef]
- Ferreira, S.L.C.; Bruns, R.E.; da Silva, E.G.P.; dos Santos, W.N.L.; Quintella, C.M.; David, J.M.; de Andrade, J.B.; Breitkreitz, M.C.; Jardim, I.C.S.F.; Neto, B.B. Statistical Designs and Response Surface Techniques for the Optimization of Chromatographic Systems. J. Chromatogr. A 2007, 1158, 2–14. [Google Scholar] [CrossRef]
- International Conference on Harmonization (ICH) Q2 (R1), “Validaton of Analytical Procedures: Text and Methodology"; International Council for Harmonisation of Technical Requirements for Pharmaceuticals for Human Use: Geneva, Switzerland, 2005; Available online: https://www.ich.org/page/quality-guidelines (accessed on 11 January 2023).
- Risley, D.S.; Magnusson, L.-E.; Morow, P.R.; Aburub, A. Analysis of Magnesium from Magnesium Stearate in Pharmaceutical Tablet Formulations Using Hydrophilic Interaction Liquid Chromatography with Nano Quantity Analyte Detection. J. Pharm. Biomed. Anal. 2013, 78–79, 112–117. [Google Scholar] [CrossRef]
- Li, J.; Stolee, J.A.; Meda, A. Simultaneous Quantitation of Inorganic Ions in Oligonucleotides Using Mixed-Mode Liquid Chromatography Coupled with a Charged Aerosol Detector. J. Pharm. Biomed. Anal. 2021, 204, 114244. [Google Scholar] [CrossRef]


| Critical Method Parameters | Critical Method Attributes | ||||||
|---|---|---|---|---|---|---|---|
| Flow Rate [mL/min] | Gradient Time [min] | Column Temperature [°C] | k(stearic acid) | ||||
| 0.50 | 8.0 | 30.00 | 4.84 | 4.94 | 8.99 | 9.01 | 15.80 |
| 0.70 | 8.0 | 30.00 | 3.53 | 3.6 | 6.85 | 6.85 | 16.99 |
| 0.50 | 15.0 | 30.00 | 4.95 | 5.07 | 9.98 | 10.02 | 18.78 |
| 0.70 | 15.0 | 30.00 | 3.61 | 3.67 | 7.47 | 7.49 | 19.86 |
| 0.50 | 8.0 | 40.00 | 4.31 | 4.31 | 7.82 | 7.82 | 13.73 |
| 0.70 | 8.0 | 40.00 | 3.12 | 3.12 | 5.86 | 5.86 | 14.64 |
| 0.50 | 15.0 | 40.00 | 4.37 | 4.37 | 8.47 | 8.47 | 15.86 |
| 0.70 | 15.0 | 40.00 | 3.15 | 3.15 | 6.27 | 6.27 | 16.59 |
| 0.50 | 11.5 | 35.00 | 4.56 | 4.61 | 8.83 | 8.84 | 16.41 |
| 0.70 | 11.5 | 35.00 | 3.33 | 3.38 | 6.66 | 6.66 | 17.32 |
| 0.60 | 8.0 | 35.00 | 3.84 | 3.87 | 7.21 | 7.21 | 15.45 |
| 0.60 | 15.0 | 35.00 | 3.9 | 3.95 | 7.85 | 7.87 | 17.88 |
| 0.60 | 11.5 | 30.00 | 4.11 | 4.19 | 8.22 | 8.23 | 18.44 |
| 0.60 | 11.5 | 40.00 | 3.62 | 3.62 | 7.00 | 7.00 | 15.48 |
| 0.60 | 11.5 | 35.00 | 3.89 | 3.93 | 7.63 | 7.64 | 16.65 |
| 0.60 | 11.5 | 35.00 | 3.86 | 3.9 | 7.57 | 7.58 | 16.71 |
| 0.60 | 11.5 | 35.00 | 3.85 | 3.89 | 7.55 | 7.57 | 17.26 |
| 0.60 | 11.5 | 35.00 | 3.85 | 3.91 | 7.57 | 7.6 | 16.87 |
| k8 | |||||
|---|---|---|---|---|---|
| b0 | +0.26 | +0.26 | +0.88 | +0.88 | +16.89 |
| b1 | +0.041 | +0.041 | −0.062 | −0.062 | +0.48 |
| b2 | −2.111 × 10⁻³ | −2.196 × 10⁻³ | +0.018 | +0.019 | +1.24 |
| b3 | +0.016 | +0.019 | −0.035 | −0.035 | −1.36 |
| b12 | / | / | −1.631 × 10⁻³ | −1.582 × 10⁻³ | / |
| b13 | +3.182 × 10⁻³ | +3.317 × 10⁻³ | −1.506 × 10⁻³ | −1.313 × 10⁻³ | / |
| b23 | / | / | −2.369 × 10⁻³ | −2.611 × 10⁻³ | −0.22 |
| b11 | / | / | +4.776 × 10⁻³ | +4.493 × 10⁻³ | / |
| b22 | / | / | −3.539 × 10⁻³ | −3.515 × 10⁻³ | −0.33 |
| b33 | / | / | / | / | / |
| R2 | 0.9993 | 0.9993 | 0.9997 | 0.9998 | 0.9902 |
| Adj. R2 | 0.9991 | 0.9991 | 0.9995 | 0.9996 | 0.9861 |
| Pred. R2 | 0.9985 | 0.9987 | 0.9991 | 0.9992 | 0.9805 |
| Lack of fit; p value | 0.7790 | 0.6445 | 0.9730 | 0.9650 | 0.9718 |
| R2 | Slope | y-Intercept | Correction Factor | LOQ (ng/Column) | |
|---|---|---|---|---|---|
| α-linolenic acid | 0.9873 | 0.9350 | 0.0935 | 1.01 | 0.38 |
| Myristic acid | 0.9995 | 1.1522 | 0.0219 | 1.25 | 1.85 |
| Palmitoleic acid | 0.9955 | 1.0025 | 0.0529 | 1.09 | 0.91 |
| Linoleic acid | 0.9936 | 0.9419 | 0.0937 | 1.02 | 0.62 |
| Palmitic acid | 0.9934 | 0.9914 | 0.0921 | 1.07 | 0.77 |
| Oleic acid | 0.9951 | 0.9231 | 0.1128 | 1.00 | 0.64 |
| Petroselinic acid | 0.9952 | 0.9343 | 0.1089 | 1.01 | 0.82 |
| Stearic acid | 0.9899 | 0.9540 | 0.1517 | 1.03 | 0.77 |
| PS 80 | Mg Stearate | ||||
|---|---|---|---|---|---|
| Ph. Eur. Monograph | LC-CAD | Ph. Eur. Monograph | LC-CAD | ||
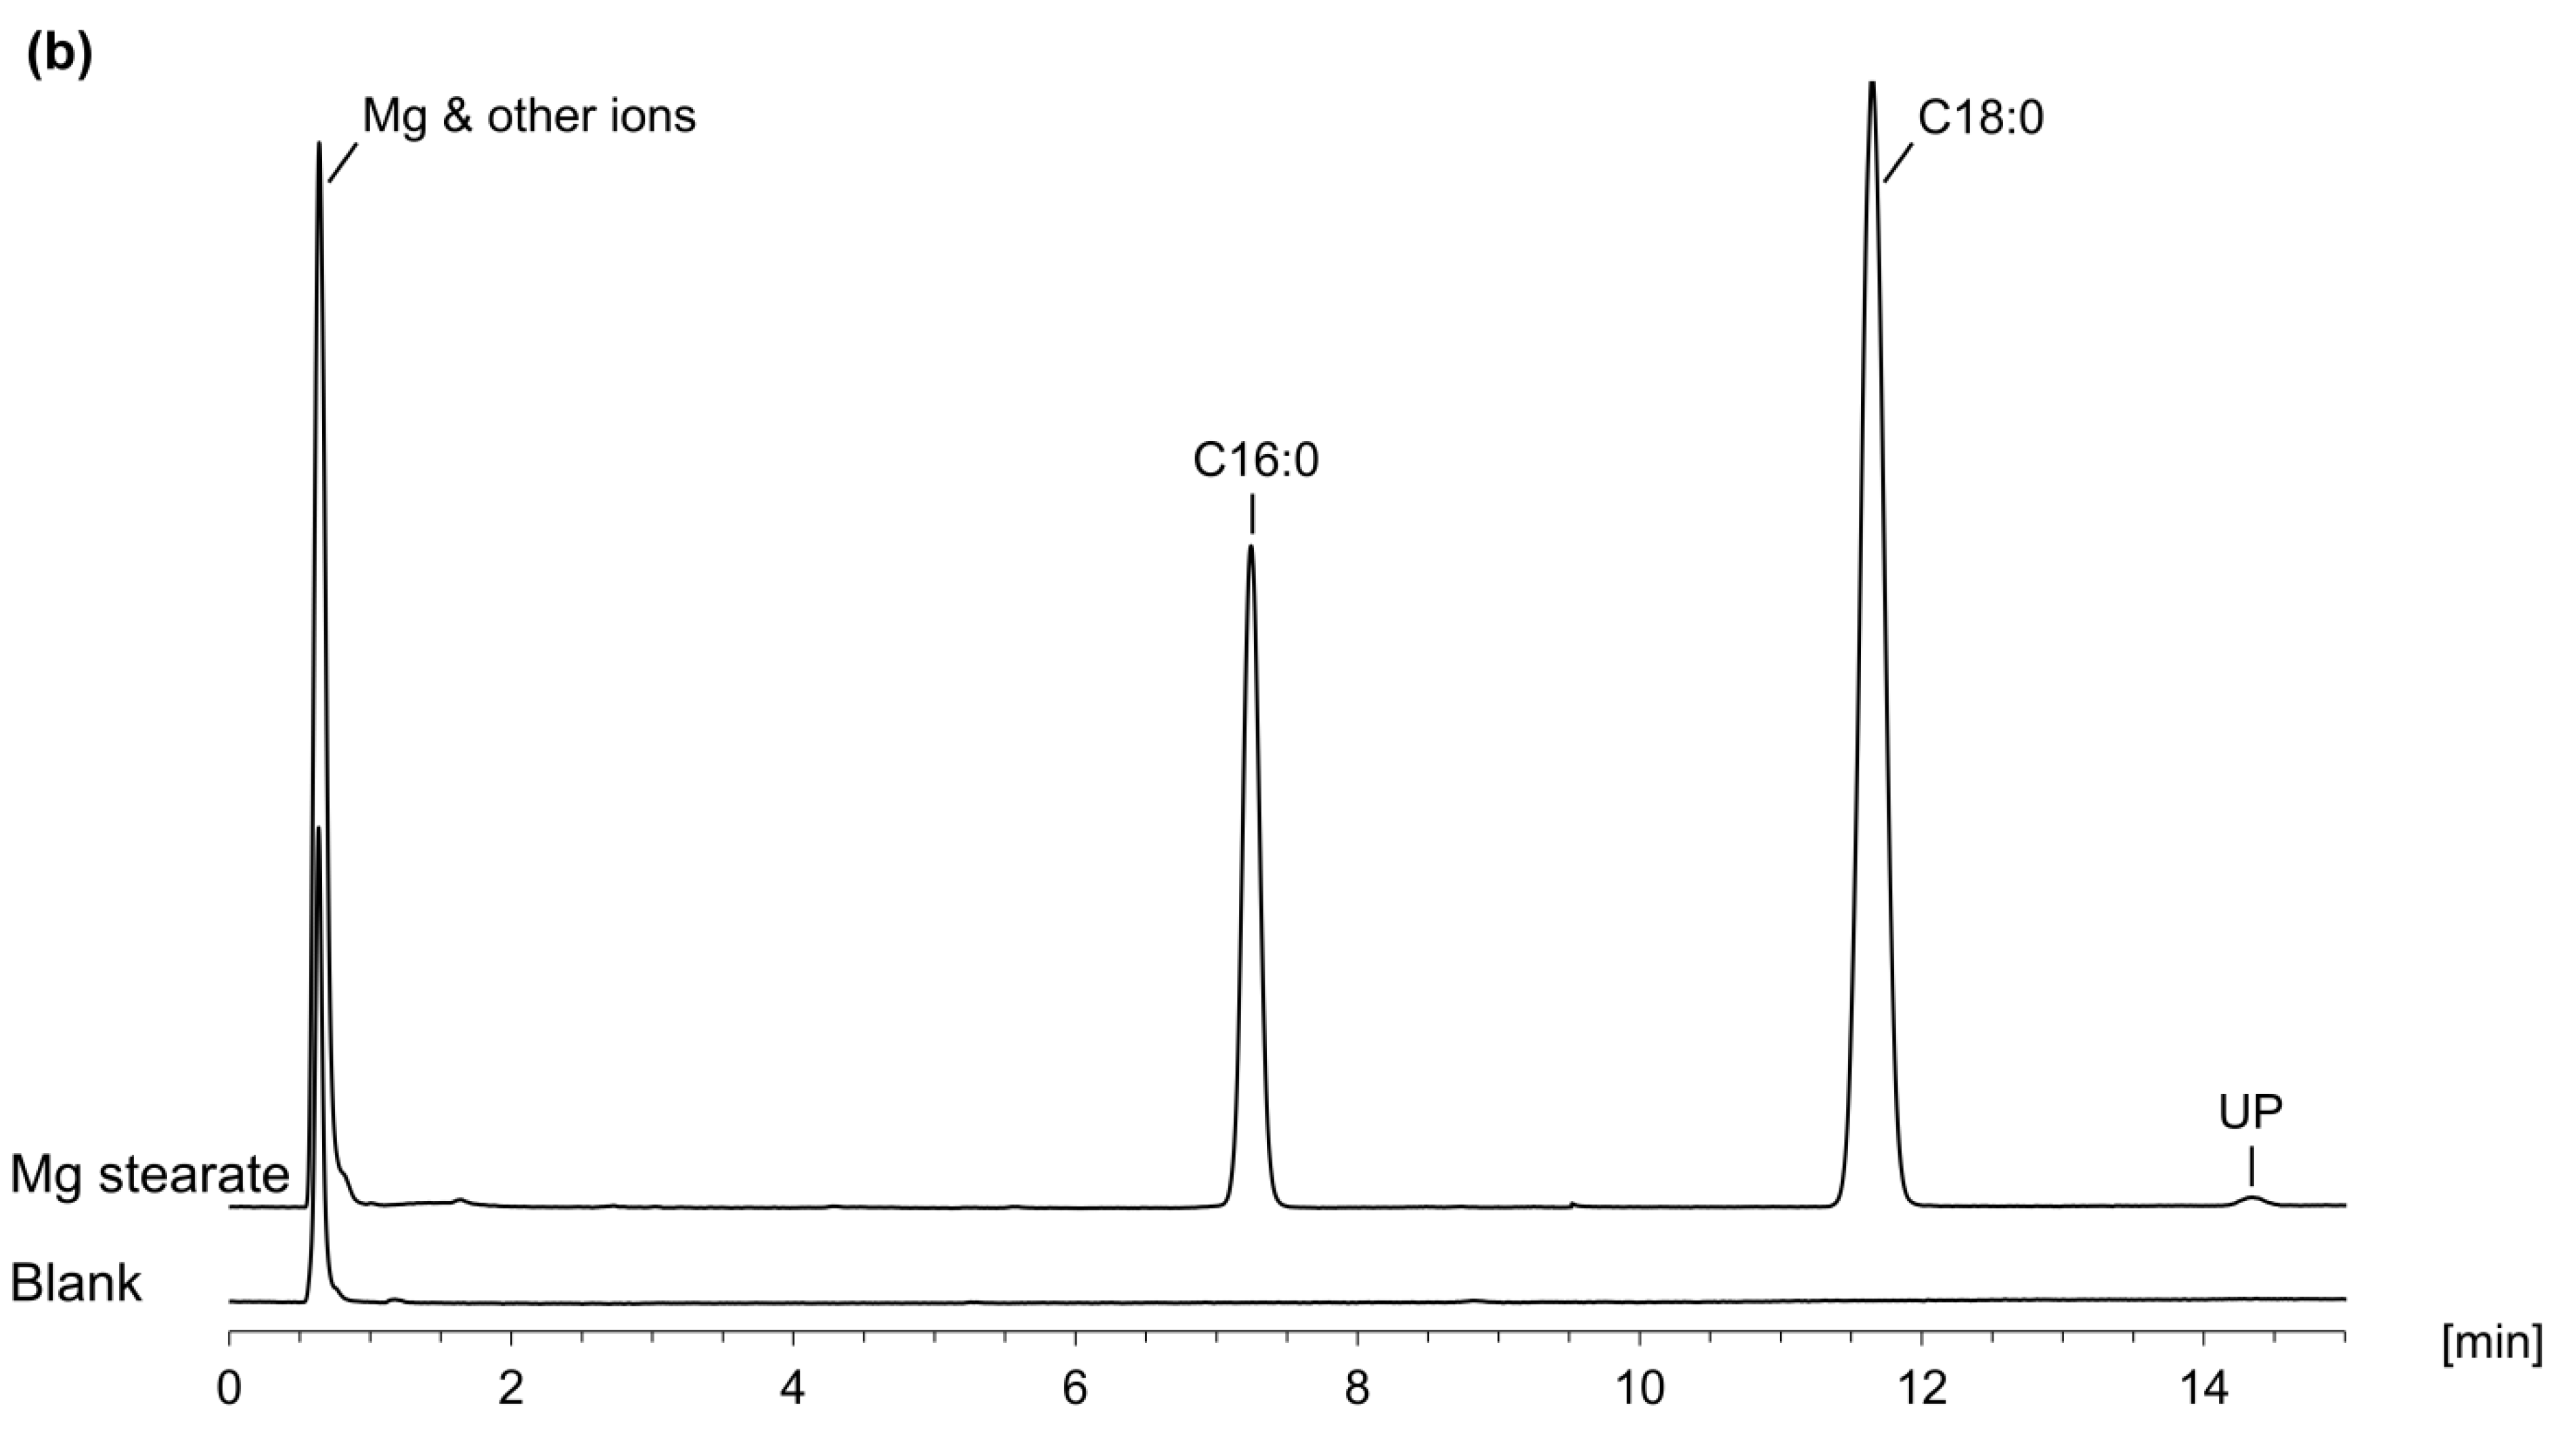
| Myristic acid | ≤5.0% | 0.21% | Stearic acid Palmitic acid Unknown peaks Sum of stearic and palmitic acid | ≥40.0% n.s. a n.s. a ≥90.0% | 69.3% 30.2% 0.5% 99.5% |
| Palmitic acid | ≤16.0% | 15.6% | |||
| Palmitoleic acid | ≤8.0% | 0.47% | |||
| Stearic acid | ≤6.0% | 5.8% | |||
| Oleic acid | ≥58.0% | 62.1% | |||
| Petroselinic acid | n.s. a | 6.35% | |||
| Linoleic acid | ≤18.0% | 8.72% | |||
| Linolenic acid | ≤4.0% | 0.13% | |||
| Unknown peaks | n.s. a | 0.62% | |||
Disclaimer/Publisher’s Note: The statements, opinions and data contained in all publications are solely those of the individual author(s) and contributor(s) and not of MDPI and/or the editor(s). MDPI and/or the editor(s) disclaim responsibility for any injury to people or property resulting from any ideas, methods, instructions or products referred to in the content. |
© 2023 by the authors. Licensee MDPI, Basel, Switzerland. This article is an open access article distributed under the terms and conditions of the Creative Commons Attribution (CC BY) license (https://creativecommons.org/licenses/by/4.0/).
Share and Cite
Walther, R.; Krmar, J.; Leistner, A.; Svrkota, B.; Otašević, B.; Malenović, A.; Holzgrabe, U.; Protić, A. Analytical Quality by Design: Achieving Robustness of an LC-CAD Method for the Analysis of Non-Volatile Fatty Acids. Pharmaceuticals 2023, 16, 478. https://doi.org/10.3390/ph16040478
Walther R, Krmar J, Leistner A, Svrkota B, Otašević B, Malenović A, Holzgrabe U, Protić A. Analytical Quality by Design: Achieving Robustness of an LC-CAD Method for the Analysis of Non-Volatile Fatty Acids. Pharmaceuticals. 2023; 16(4):478. https://doi.org/10.3390/ph16040478
Chicago/Turabian StyleWalther, Rasmus, Jovana Krmar, Adrian Leistner, Bojana Svrkota, Biljana Otašević, Andjelija Malenović, Ulrike Holzgrabe, and Ana Protić. 2023. "Analytical Quality by Design: Achieving Robustness of an LC-CAD Method for the Analysis of Non-Volatile Fatty Acids" Pharmaceuticals 16, no. 4: 478. https://doi.org/10.3390/ph16040478