Article

Predicting Pharmacokinetics of Active Constituents in Spatholobi caulis by Using Physiologically Based Pharmacokinetic Models

1
Department of Toxicology, School of Public Health, Peking University, Beijing 100191, China
2
State Key Laboratory of Natural and Biomimetic Drugs, Department of Natural Medicines, School of Pharmaceutical Sciences, Peking University, Beijing 100191, China
3
Key Laboratory of State Administration of Traditional Chinese Medicine for Compatibility Toxicology, Beijing 100191, China
4
Key Laboratory of Toxicological Research and Risk Assessment for Food Safety, Beijing 100191, China
*
Author to whom correspondence should be addressed.
These authors contributed equally to this work.
Pharmaceuticals 2024, 17(12), 1621; https://doi.org/10.3390/ph17121621
Submission received: 17 October 2024 / Revised: 26 November 2024 / Accepted: 30 November 2024 / Published: 3 December 2024
(This article belongs to the Section Natural Products)

Abstract

:
Background/Objectives: Spatholobi Caulis (SPC) is a medicinal plant that mainly grows in China and Southeast Asian countries and commonly used in clinics; the pharmacokinetic characteristics in humans need to be determined. This study was to establish the physiologically based pharmacokinetic (PBPK) models of multiple active constituents from SPC in rats, and predict the pharmacokinetic properties of rats with different dosages and extrapolated to humans. Methods: The parameters were collected based on our previous study and by prediction using ADMET Predictor software predict. The PBPK models for 3′-methoxydadizein (1), 8-O-methylretusin (2), daidzin (3), and isolariciresinol (4) administered orally to rats were established using GastroPlus software. These models were employed to simulate the pharmacokinetic properties in rats across various dosages, and subsequently extrapolated to humans. The calculated parameters including Cmax, Tmax, and AUC were compared with observed values. The accuracy of the PBPK models was assessed using fold-error (FE) values. Result: The FE values ranged from 1.03 to 1.52, meeting the PBPK model regulations where FE should be less than 2. The sensitivity analysis focusing on the absorption amount and AUC0→t of these four constituents in humans was also conducted. These results confirm the successful establishment of PBPK models of these four constituents from SPC in this study, and these models were applicable to predict pharmacokinetics across various doses and extrapolate across species. Conclusions: The PBPK models of four constituents can be used to predict the pharmacokinetic characteristics in humans after oral administration of SPC and provide useful data for safe and rational medication in clinical practice.

Graphical Abstract

1. Introduction

Spatholobi Caulis (SPC), derived from the dried tuber of Spatholobus suberectus Dunn [1], is one of the medicinal plants that grows in China, Japan, and other countries in Southeast Asia, especially has been commonly used in traditional Chinese medicine (TCM). It is commonly used, in combination with other TCMs, to treat dysmenorrhea, amenorrhea, and rheumatoid arthritis [2,3,4]. Modern pharmacological studies have revealed that SPC exhibits diverse effects, including antioxidant and anti-inflammatory properties, regulation of lipid metabolism, and anti-tumor activities [5,6,7,8]. Various constituents enriched in SPC, particularly flavonoids, play pivotal roles in its pharmacological effects [8,9,10]. In clinical practice, oral administration is one of the primary routes of drug delivery for the TCM, the constituents of which can be absorbed into the blood through the gastrointestinal tract, and distributed to target organs via blood circulation to exert their effects; after being metabolized in the liver, these constituents or their metabolites are excreted eventually by the kidneys or other organs. The in vivo pharmacokinetics of TCM have thus become crucial for determining its efficacy and safety. Currently, studies have reported the pharmacokinetics of individual constituents such as ononin [11], formononetin [11], genistein [12,13], and daidzein [14], which are monomers from SPC. However, only two studies have investigated the pharmacokinetics of multiple components from SPC in rats [15,16], and there is a lack of pharmacokinetic data in humans. The characteristics of “multi-component, multi-target, and multi-pathway” in TCM pose significant challenges in understanding their mechanisms of action. Pharmacokinetic evaluations of multiple active constituents from SPC, and the extrapolation of pharmacokinetics from animals to humans, are critically important for rational clinical medication.
The physiologically based pharmacokinetic (PBPK) model utilizes knowledge of human physiology, biochemistry, and drug characteristics to mechanistically and quantitatively describe drug absorption, distribution, metabolism, and excretion through fitting and simulation methods. This model can simulate the dynamic changes in pharmacokinetics within organisms and facilitate extrapolation across various drug doses, dosage forms, and even different species [17,18,19]. Due to its unique capabilities in prediction and extrapolation, the PBPK model has been extensively utilized in pharmacokinetic studies, both in vitro and in vivo and in data mining, drug design, drug-drug interactions, and toxicity and safety evaluations [20,21]. Recognized by the Food and Drug Administration (FDA) as a convenient research tool for pharmacokinetic studies [22], the PBPK model has also been applied in TCM [23]. By simulating the body’s physiological environment, this model not only explains the absorption of TCM constituents in the human body but also predicts their pharmacokinetic behavior.
The pharmacokinetic behaviors of SPC at various dosages in humans remain unclear and warrant further investigation. Based on our previous study on SPC pharmacokinetics, four representative constituents with significant activity [16], 3′-methoxydadizein (1), 8-O-methylretusin (2), daidzin (3), and isolariciresinol (4) were selected to predict the pharmacokinetic behaviors at different doses for the first time. ADMET Predictor software was used to estimate relevant parameters and GastroPlus software to construct PBPK models for these four constituents. The pharmacokinetic results for different doses and multiple dosing were predicted and subsequently verified through experiments in rats. Subsequently, the rat pharmacokinetic data were extrapolated to humans to simulate human pharmacokinetic characteristics. This study supports the research and development of innovative drugs and provides scientific data for the safe and rational clinical use of medications.

2. Results

2.1. Establishing the PBPK Models of Active Constituents

2.1.1. Parameterization

The main parameters, molecular weight (MW), the logarithm of octanol: water partition coefficient (Log P), the negative logarithm of the acid ionization constant (pKa), apparent partition coefficient (Log D), solubility, apparent permeability coefficients (Papp), blood-plasma concentration ratio (Rbp), plasma free fraction (fup), clearance (CL), and steady-state volume of distribution (Vss) of rats and humans used to construct the PBPK model of four constituents from SPC (the structures are shown in Figure 1) in rats are shown in Table 1. The Papp values were determined by our previous study using the Caco-2 cell monolayer model to simulate the intestinal permeability of these constituents [24,25]. Solubility and respective pH were predicted by GastroPlus software, and other parameters were predicted by ADMET Predictor software. The Kp values of four constituents in different tissues are listed in Table 2. These parameters not only affect drug absorption, distribution, and metabolism, but also play a decisive role in the quality of the model, making them key parameters that cannot be ignored in PBPK modeling.

2.1.2. Construction and Validation of PBPK Models

The parameters of the four constituents presented in Table 1 were imported into GastroPlus software in the module of the drug in rats by oral administration. The doses of constituents 14 were set to 0.062, 0.11, 0.71, and 1.31 mg/kg by referring to our previous pharmacokinetic study [16], respectively. The PBPK models of these four constituents were constructed after the parameters were optimized repeatedly.
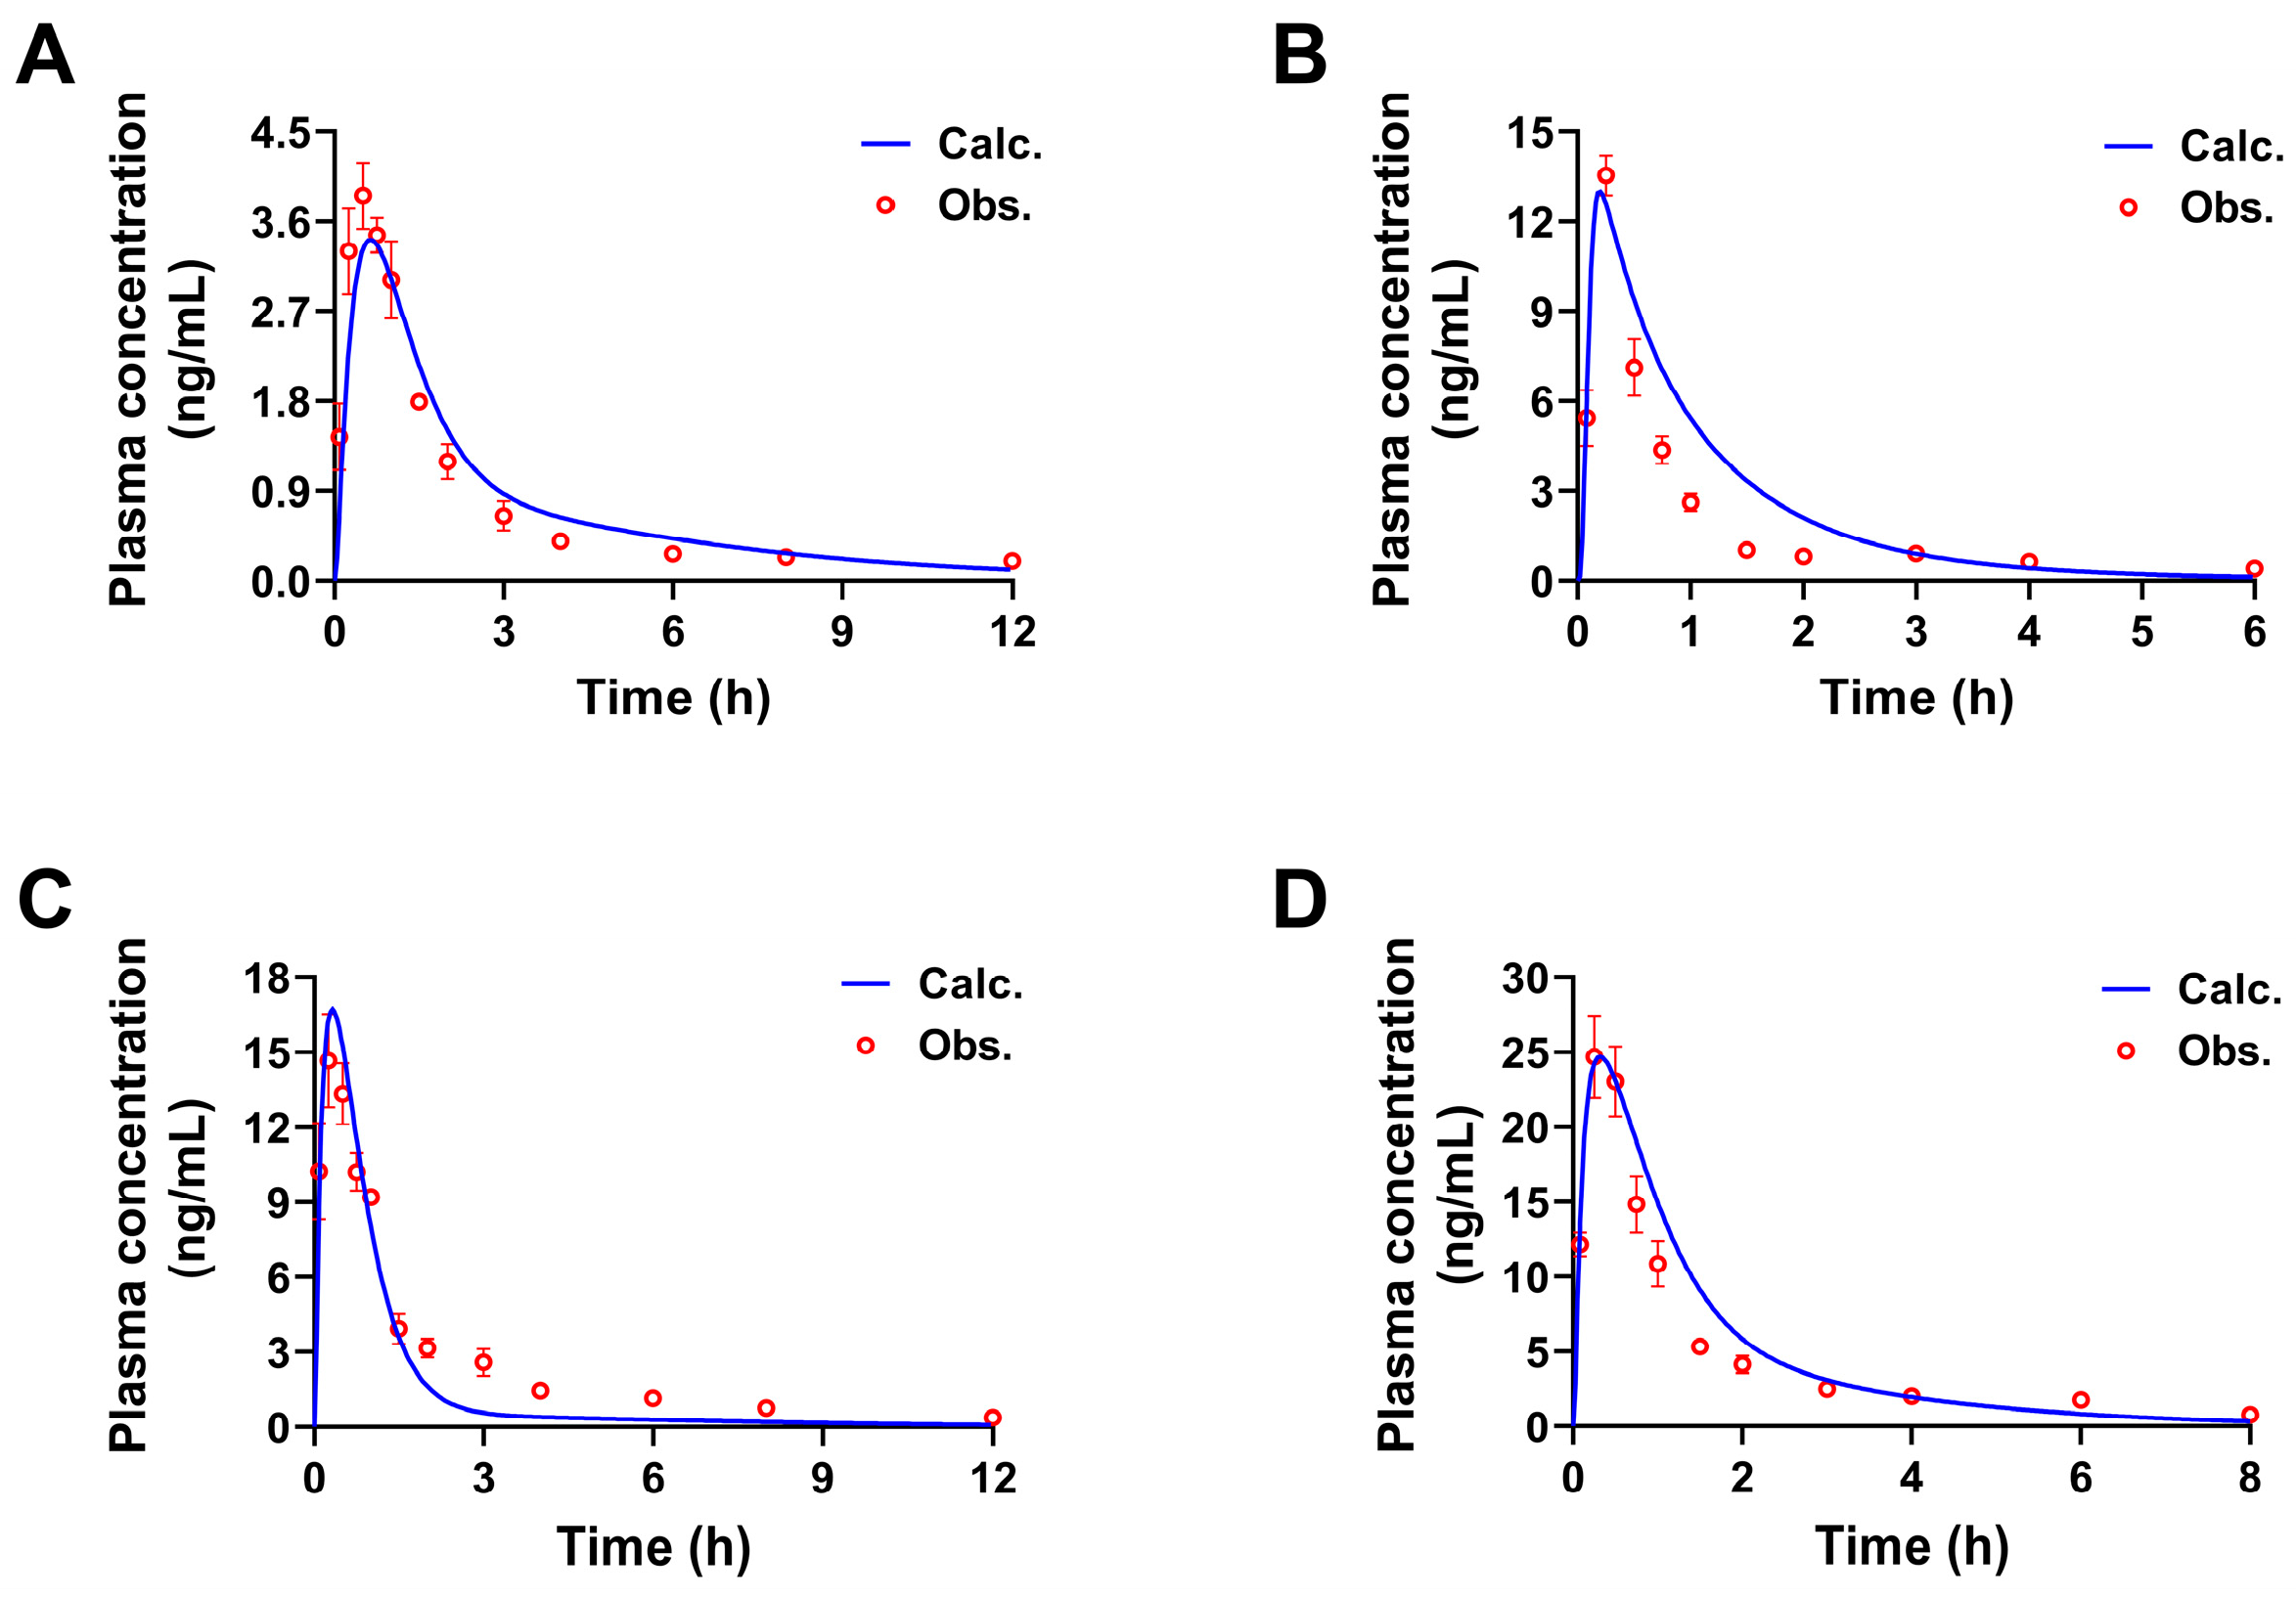
The calculated concentration-time curves were in good coincidence with the observed curves to a certain extent (Figure 2), and both fit the linear mathematical regression model by analyzing their correlation (Figure 3). R2 was in the range of 0.9030 to 0.9749 (the limit of the value was 0.8 [26,27]), indicating a reasonable fitting effect. By comparing the calculated and observed pharmacokinetic parameters Cmax, Tmax, AUC0→t, and AUC0 of each constituent, it could be seen (Table 3) that the two values were similar and had no difference in the order of magnitude. The fold error (FE) is one of the indicators to evaluate the fit degree of observed and calculated values of PBPK models, the FE values of the listed parameters ranged from 1.03 to 1.52, less than 2 [28], indicating that the PBPK models have a good fitting effect. Hence, the PBPK models were well established by assessing the R2 and FE values and could be used to accurately reflect the pharmacokinetic processes of these constituents from SPC after oral administration to rats.

2.1.3. Sensitivity Analysis of Parameters

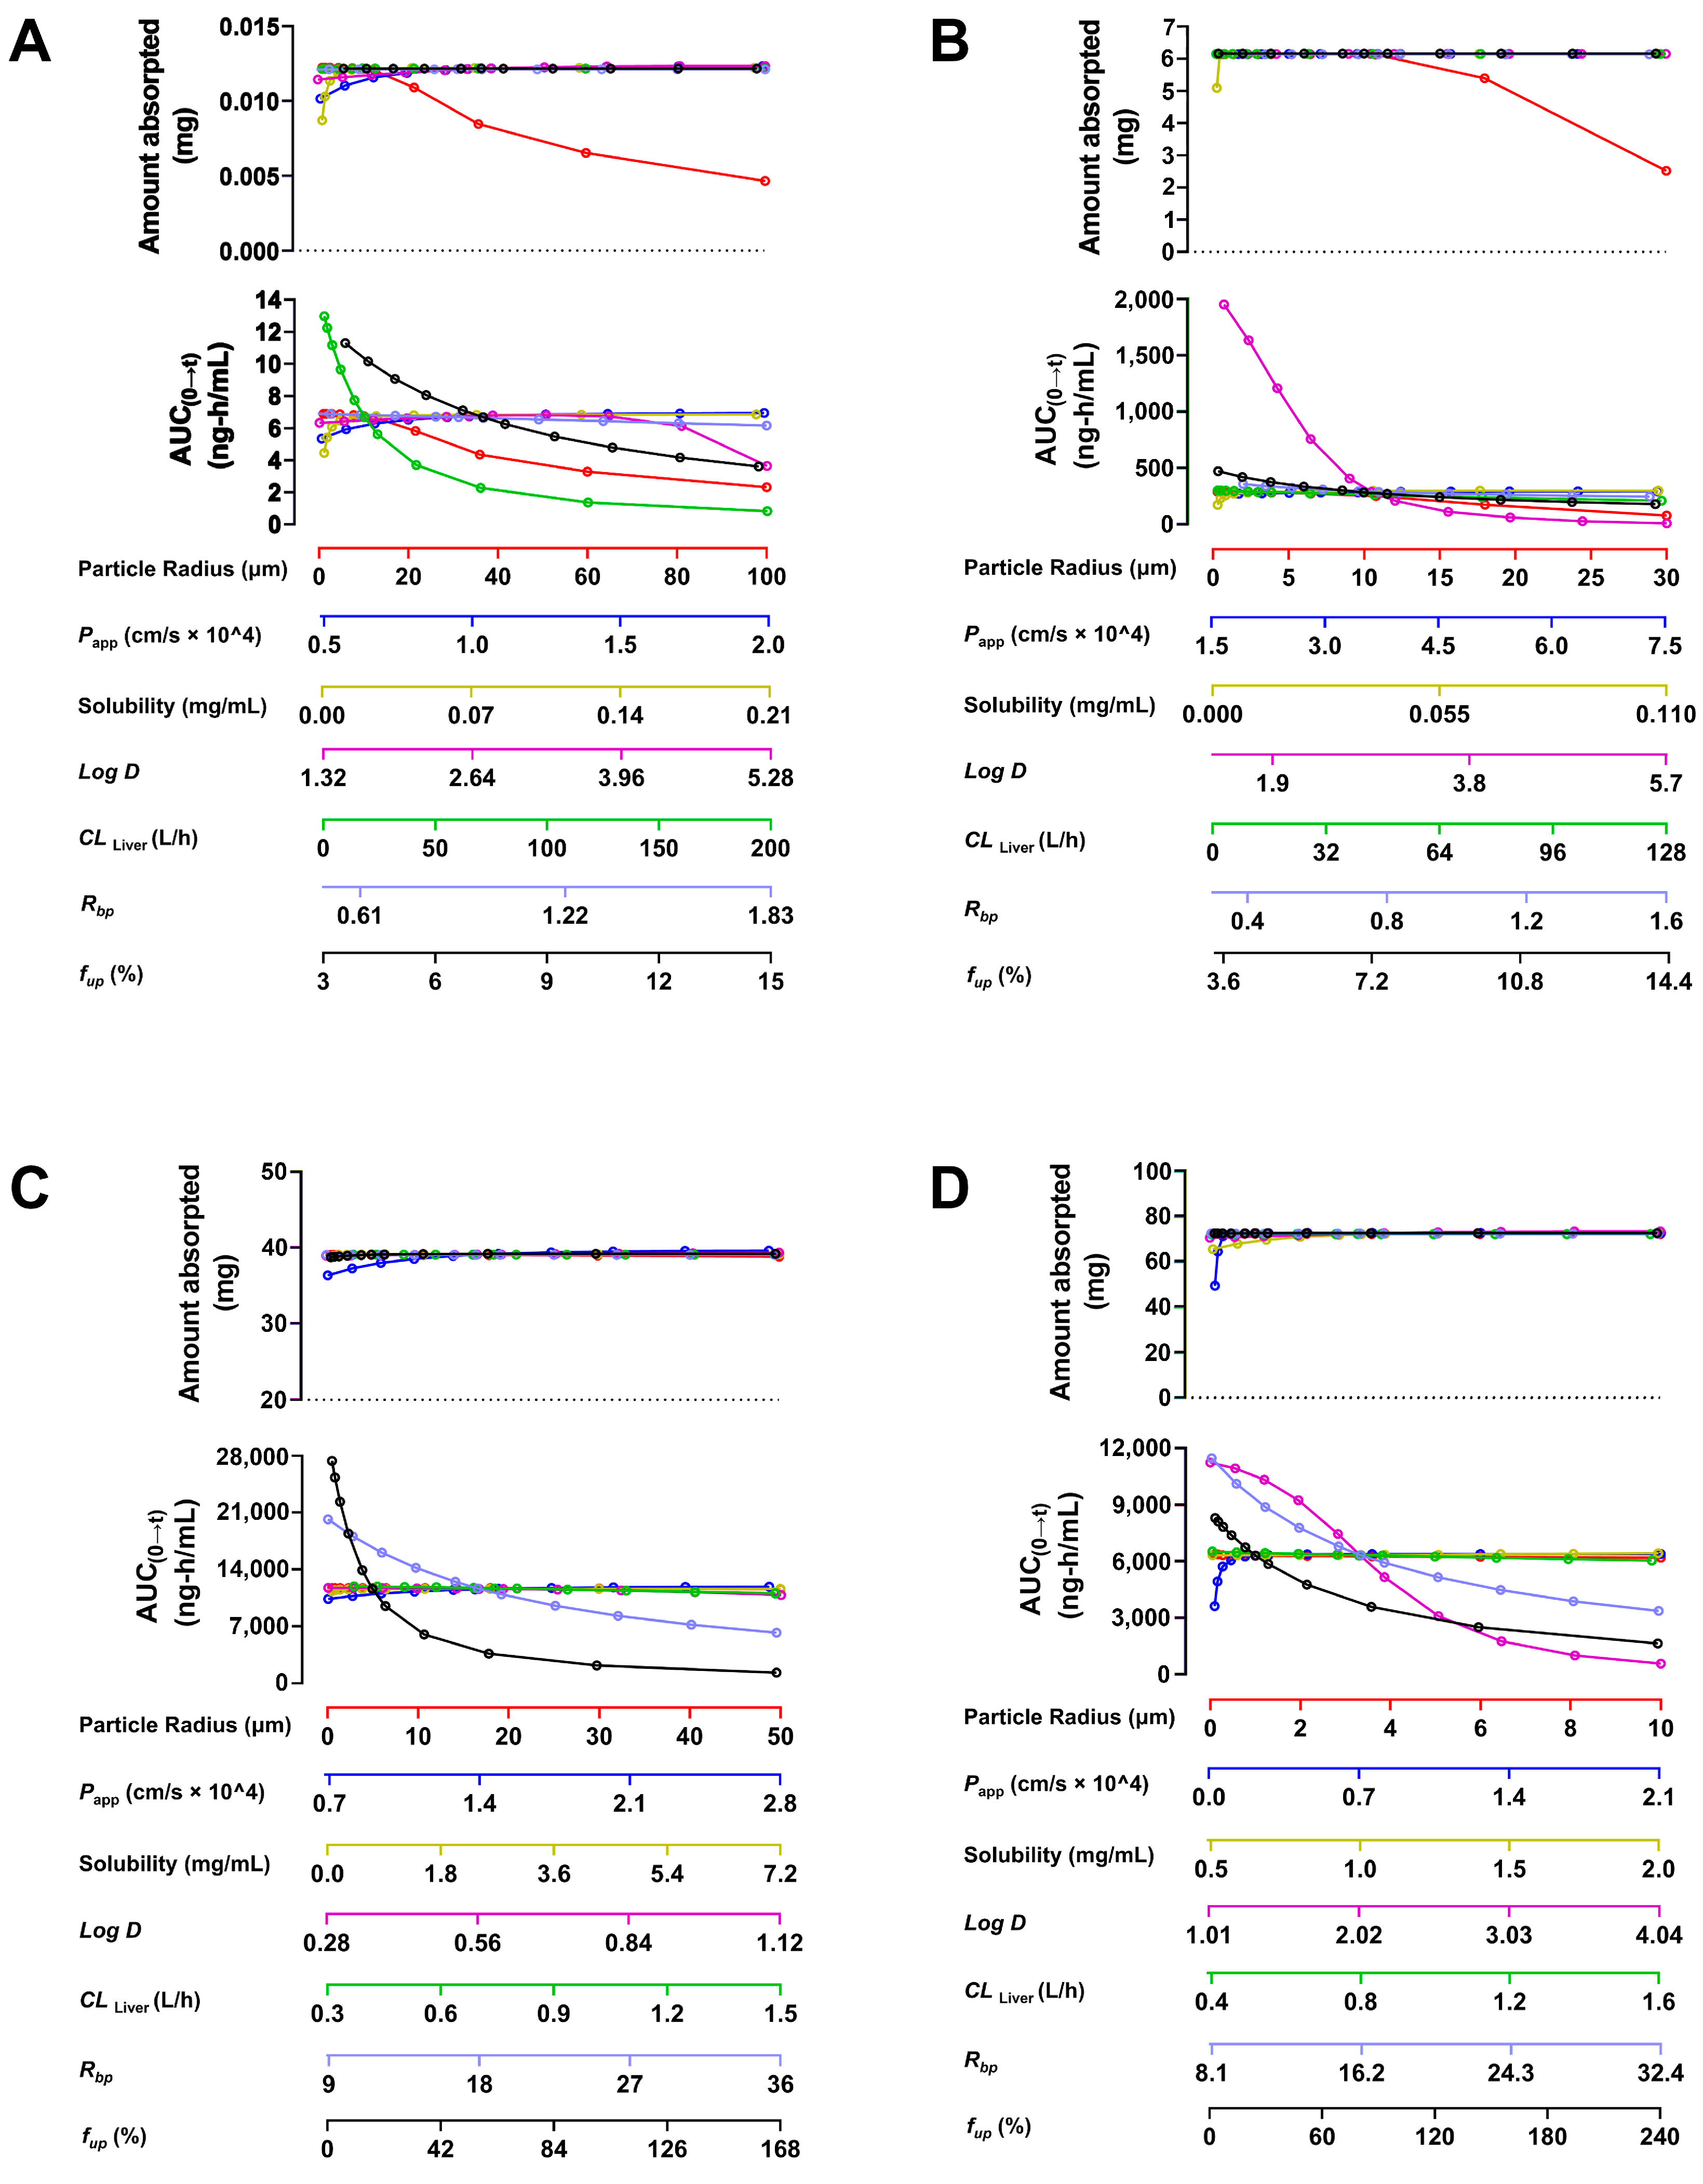
We conducted sensitivity analysis focusing on the absorption amount and AUC0→t of these four constituents in humans, examining the parameters such as particle size of constituents, Papp, Solubility, Log D, CLLiver, Rbp, and fup that influence drug absorption and distribution. The results are presented in Figure 4.
As shown in Figure 4, the absorption of 3′-methoxydadizein (A) and 8-O-methylretusin (B) in blood exhibited significant sensitivity to particle size; the larger particle size of the constituents makes it difficult to be absorbed into the blood, while these two constituents showed no notable sensitivity to other parameters. The AUC0t of all four constituents demonstrated high sensitivity to fup. Additionally, 3′-methoxydadizein (A) was sensitive to CLLiver, 8-O-methylretusin (B) and isolariciresinol (D) were sensitive to Log D, daidzin (C) and isolariciresinol (D) were sensitive to Rbp. These results suggest that these parameters impact the absorption, distribution, and metabolism of these four constituents in the human body to varying degrees. Therefore, adjusting and optimizing these parameters can enhance the alignment between predicted and observed values.

2.2. Pharmacokinetic Predictions of the Four Constituents in Rats at Different Doses

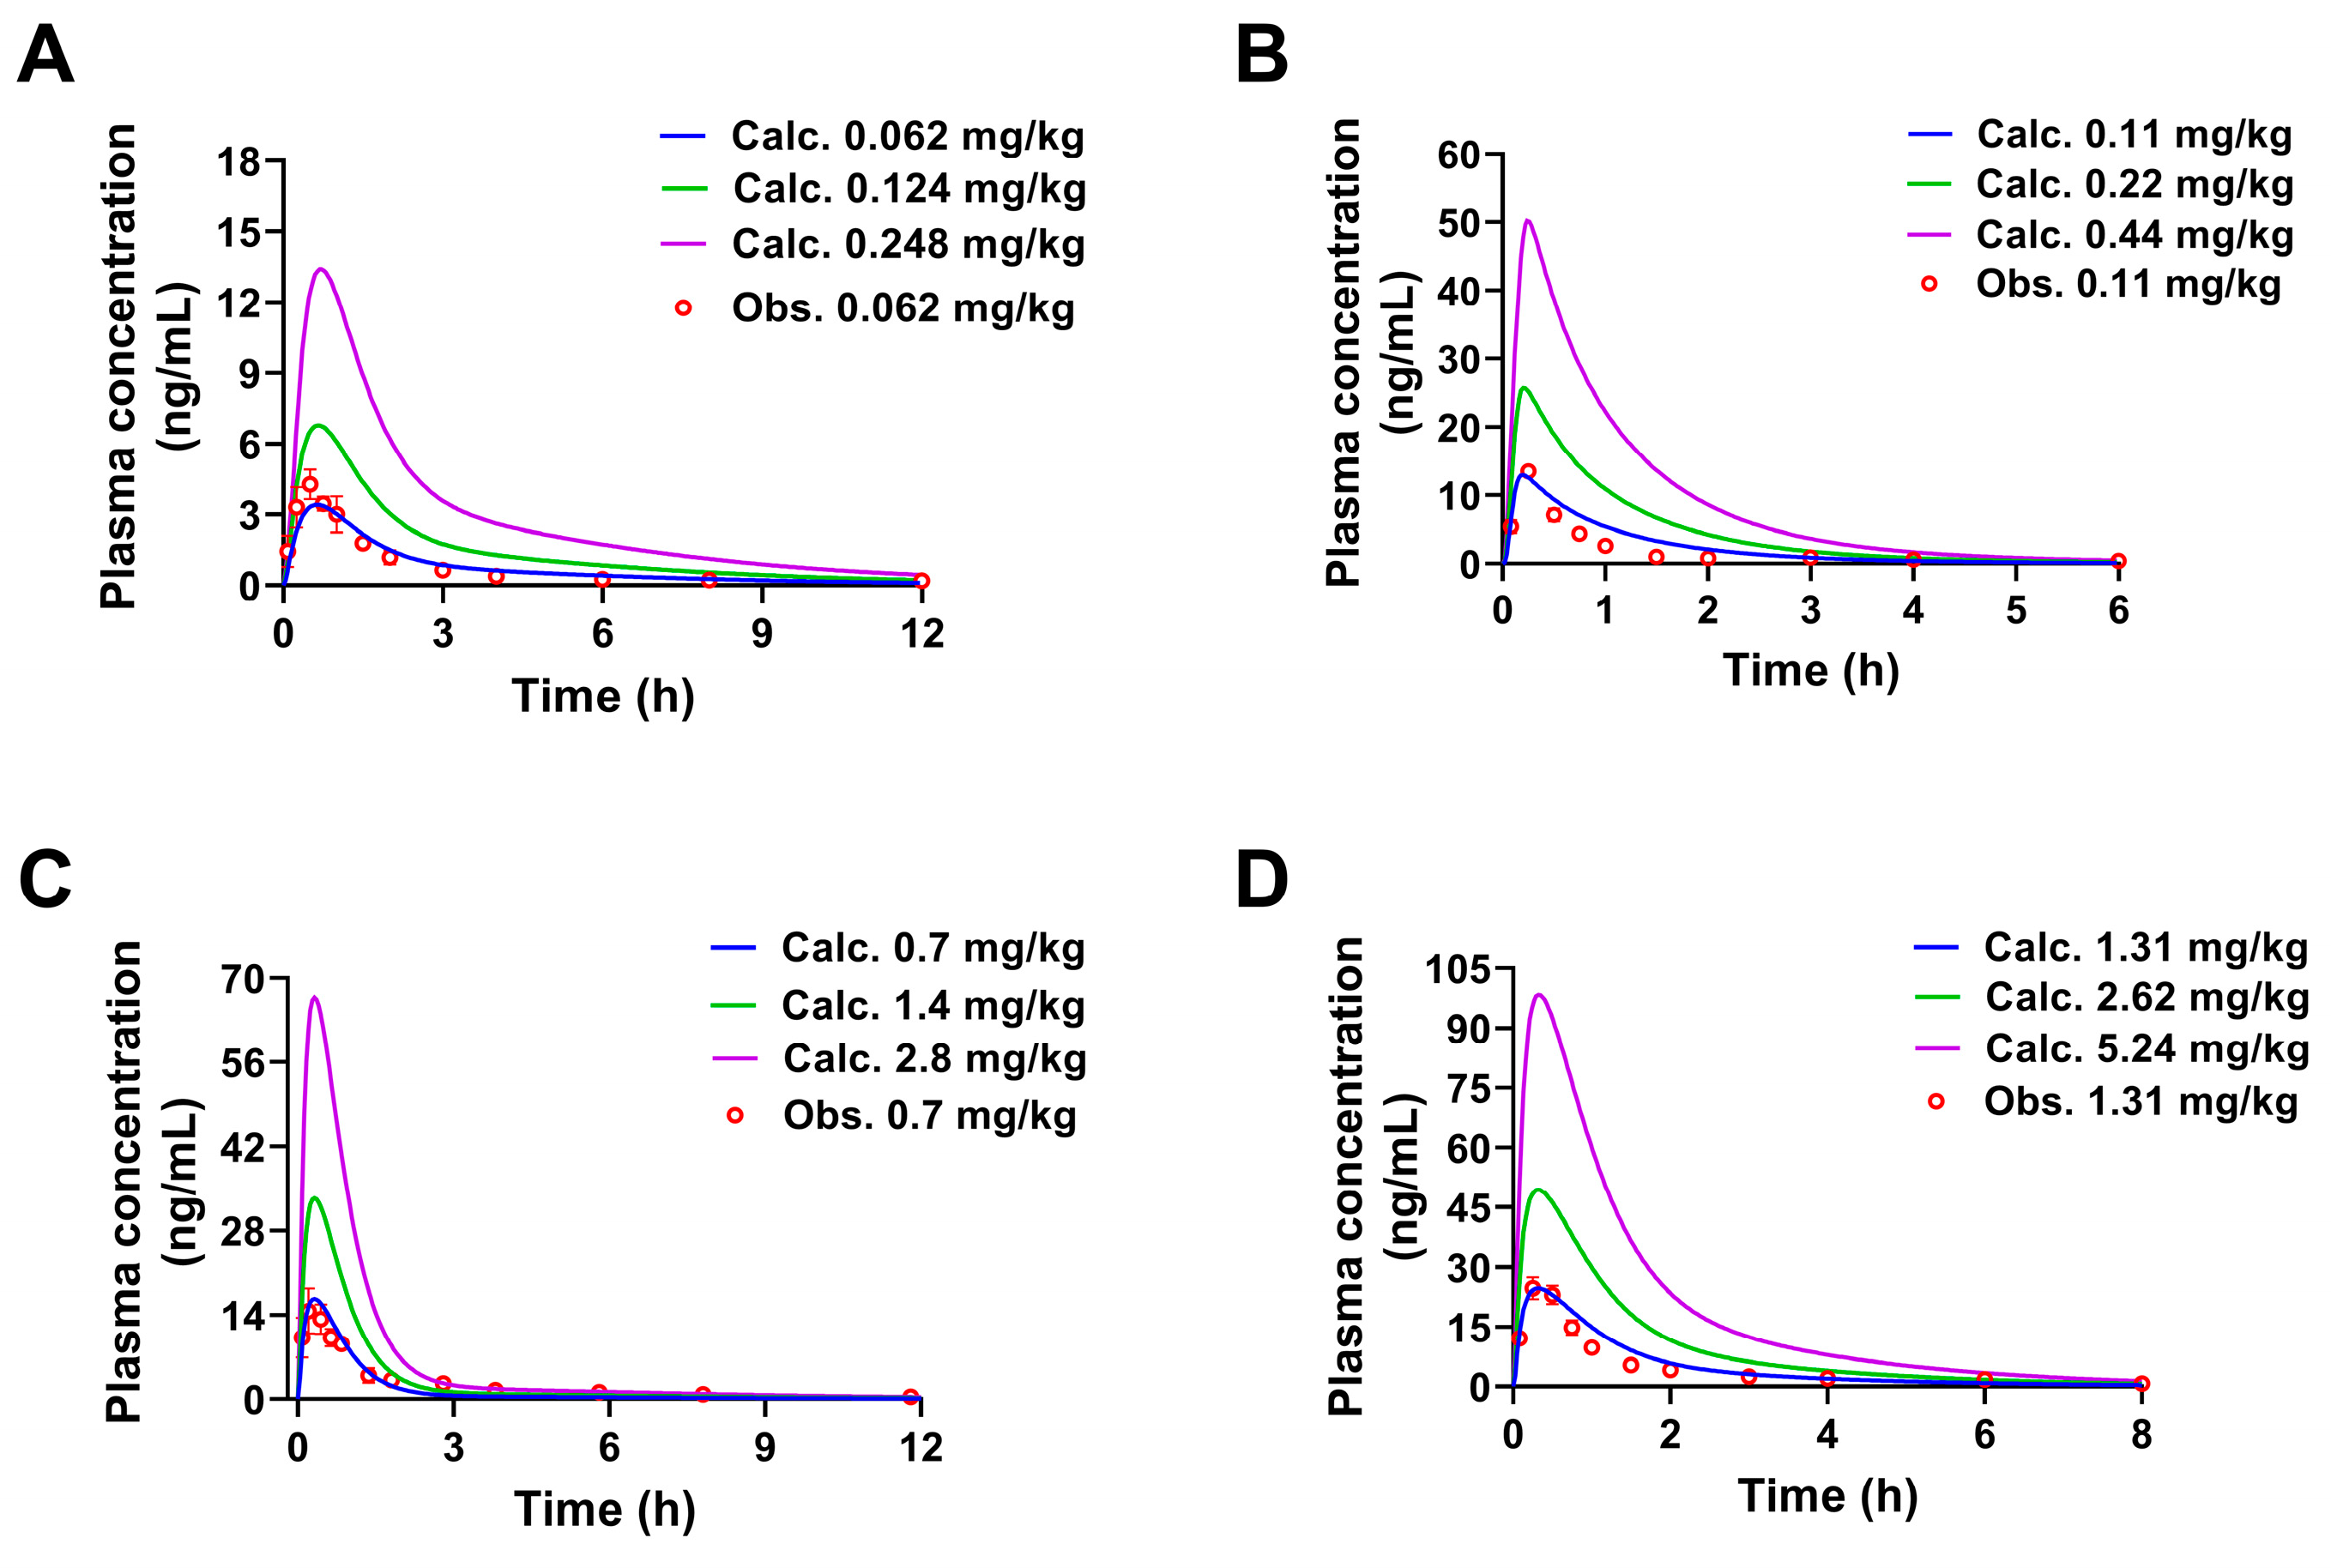
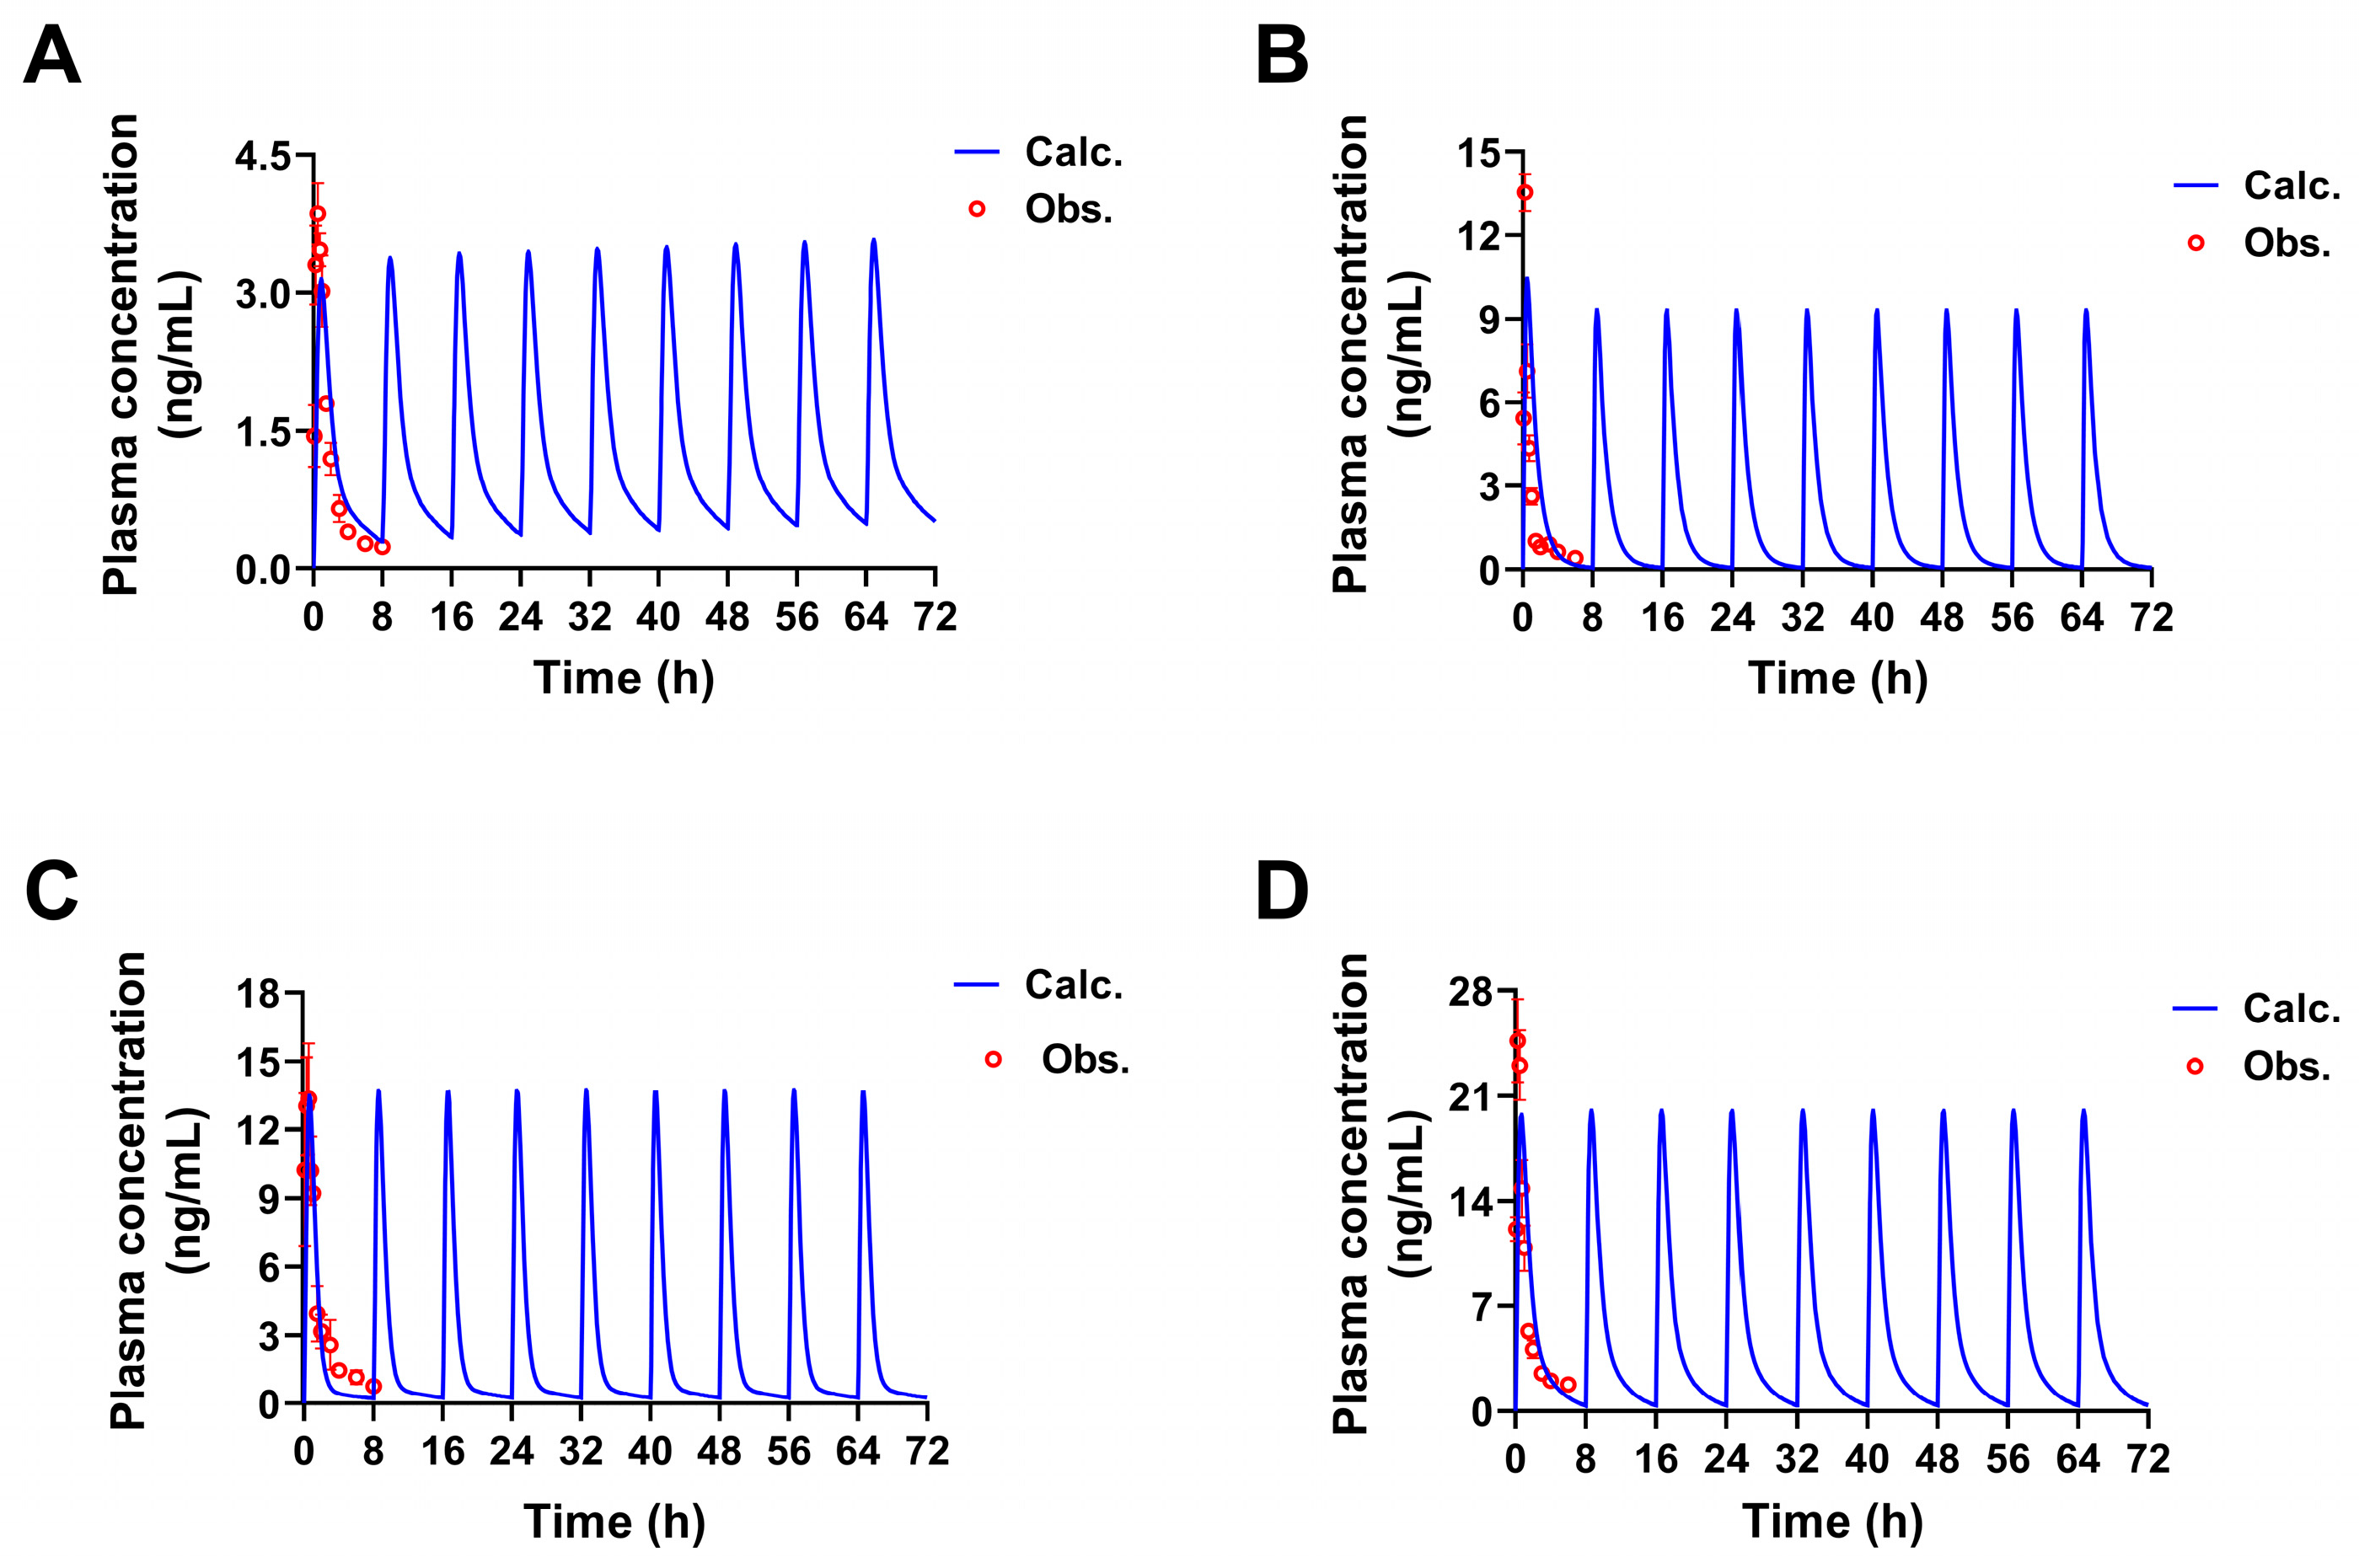
The pharmacokinetic characteristics of the four constituents in SPC at twice (60 g crude drug/kg body weight), quadruple, and multiple the previous dose (30 g crude drug/kg body weight) given to rats by gavage were predicted by the established PBPK models. As shown in Figure 5, when the oral dose was gradually increasing, the Tmax of constituents did not change significantly, but Cmax almost increased exponentially. The results of administering multiple doses every 8 h showed the pharmacokinetic characteristics of rapid absorption and metabolism for these four constituents (Figure 6), with no accumulation of the constituents within this time interval. These predicted results showed that the four constituents could be absorbed into the blood and eliminated rapidly, even at increased doses. This result can provide reference significance for the safety range use of SPC.
To validate the accuracy of PBPK models in predicting the pharmacokinetics of SPC constituents at different oral doses, the pharmacokinetic behavior of these four constituents from SPC in rats were analyzed by UFLC-MS/MS. The parameters were calculated using Drug and Statistics Software version 2.0, and then these validated values (Val.) were used to check the accuracy of the Calc. values and evaluated by FE.
Compared with the predicted values, when the doses of 3′-methoxydadizein (1), 8-O-methylretusin (2), daidzin (3), and isolariciresinol (4) were 0.124, 0.22, 1.42, and 2.62 mg/kg, respectively (Twice of the primary doses), the trend of the concentration-time curves obtained from experiments were consistent with the calculated by PBPK models. R2 was in the range of 0.8578 to 0.9698 (Figure 7 and Figure 8), and the FE values obtained by Val. and Calc. parameters of Cmax, Tmax, AUC0→t, and AUC0 were all less than 2 (Table 4). These results indicated that the established PBPK models are acceptable and can be used to predict the pharmacokinetic characteristics of the constituents in SPC at different doses.

2.3. Pharmacokinetic Predictions of the Four Constituents in Humans

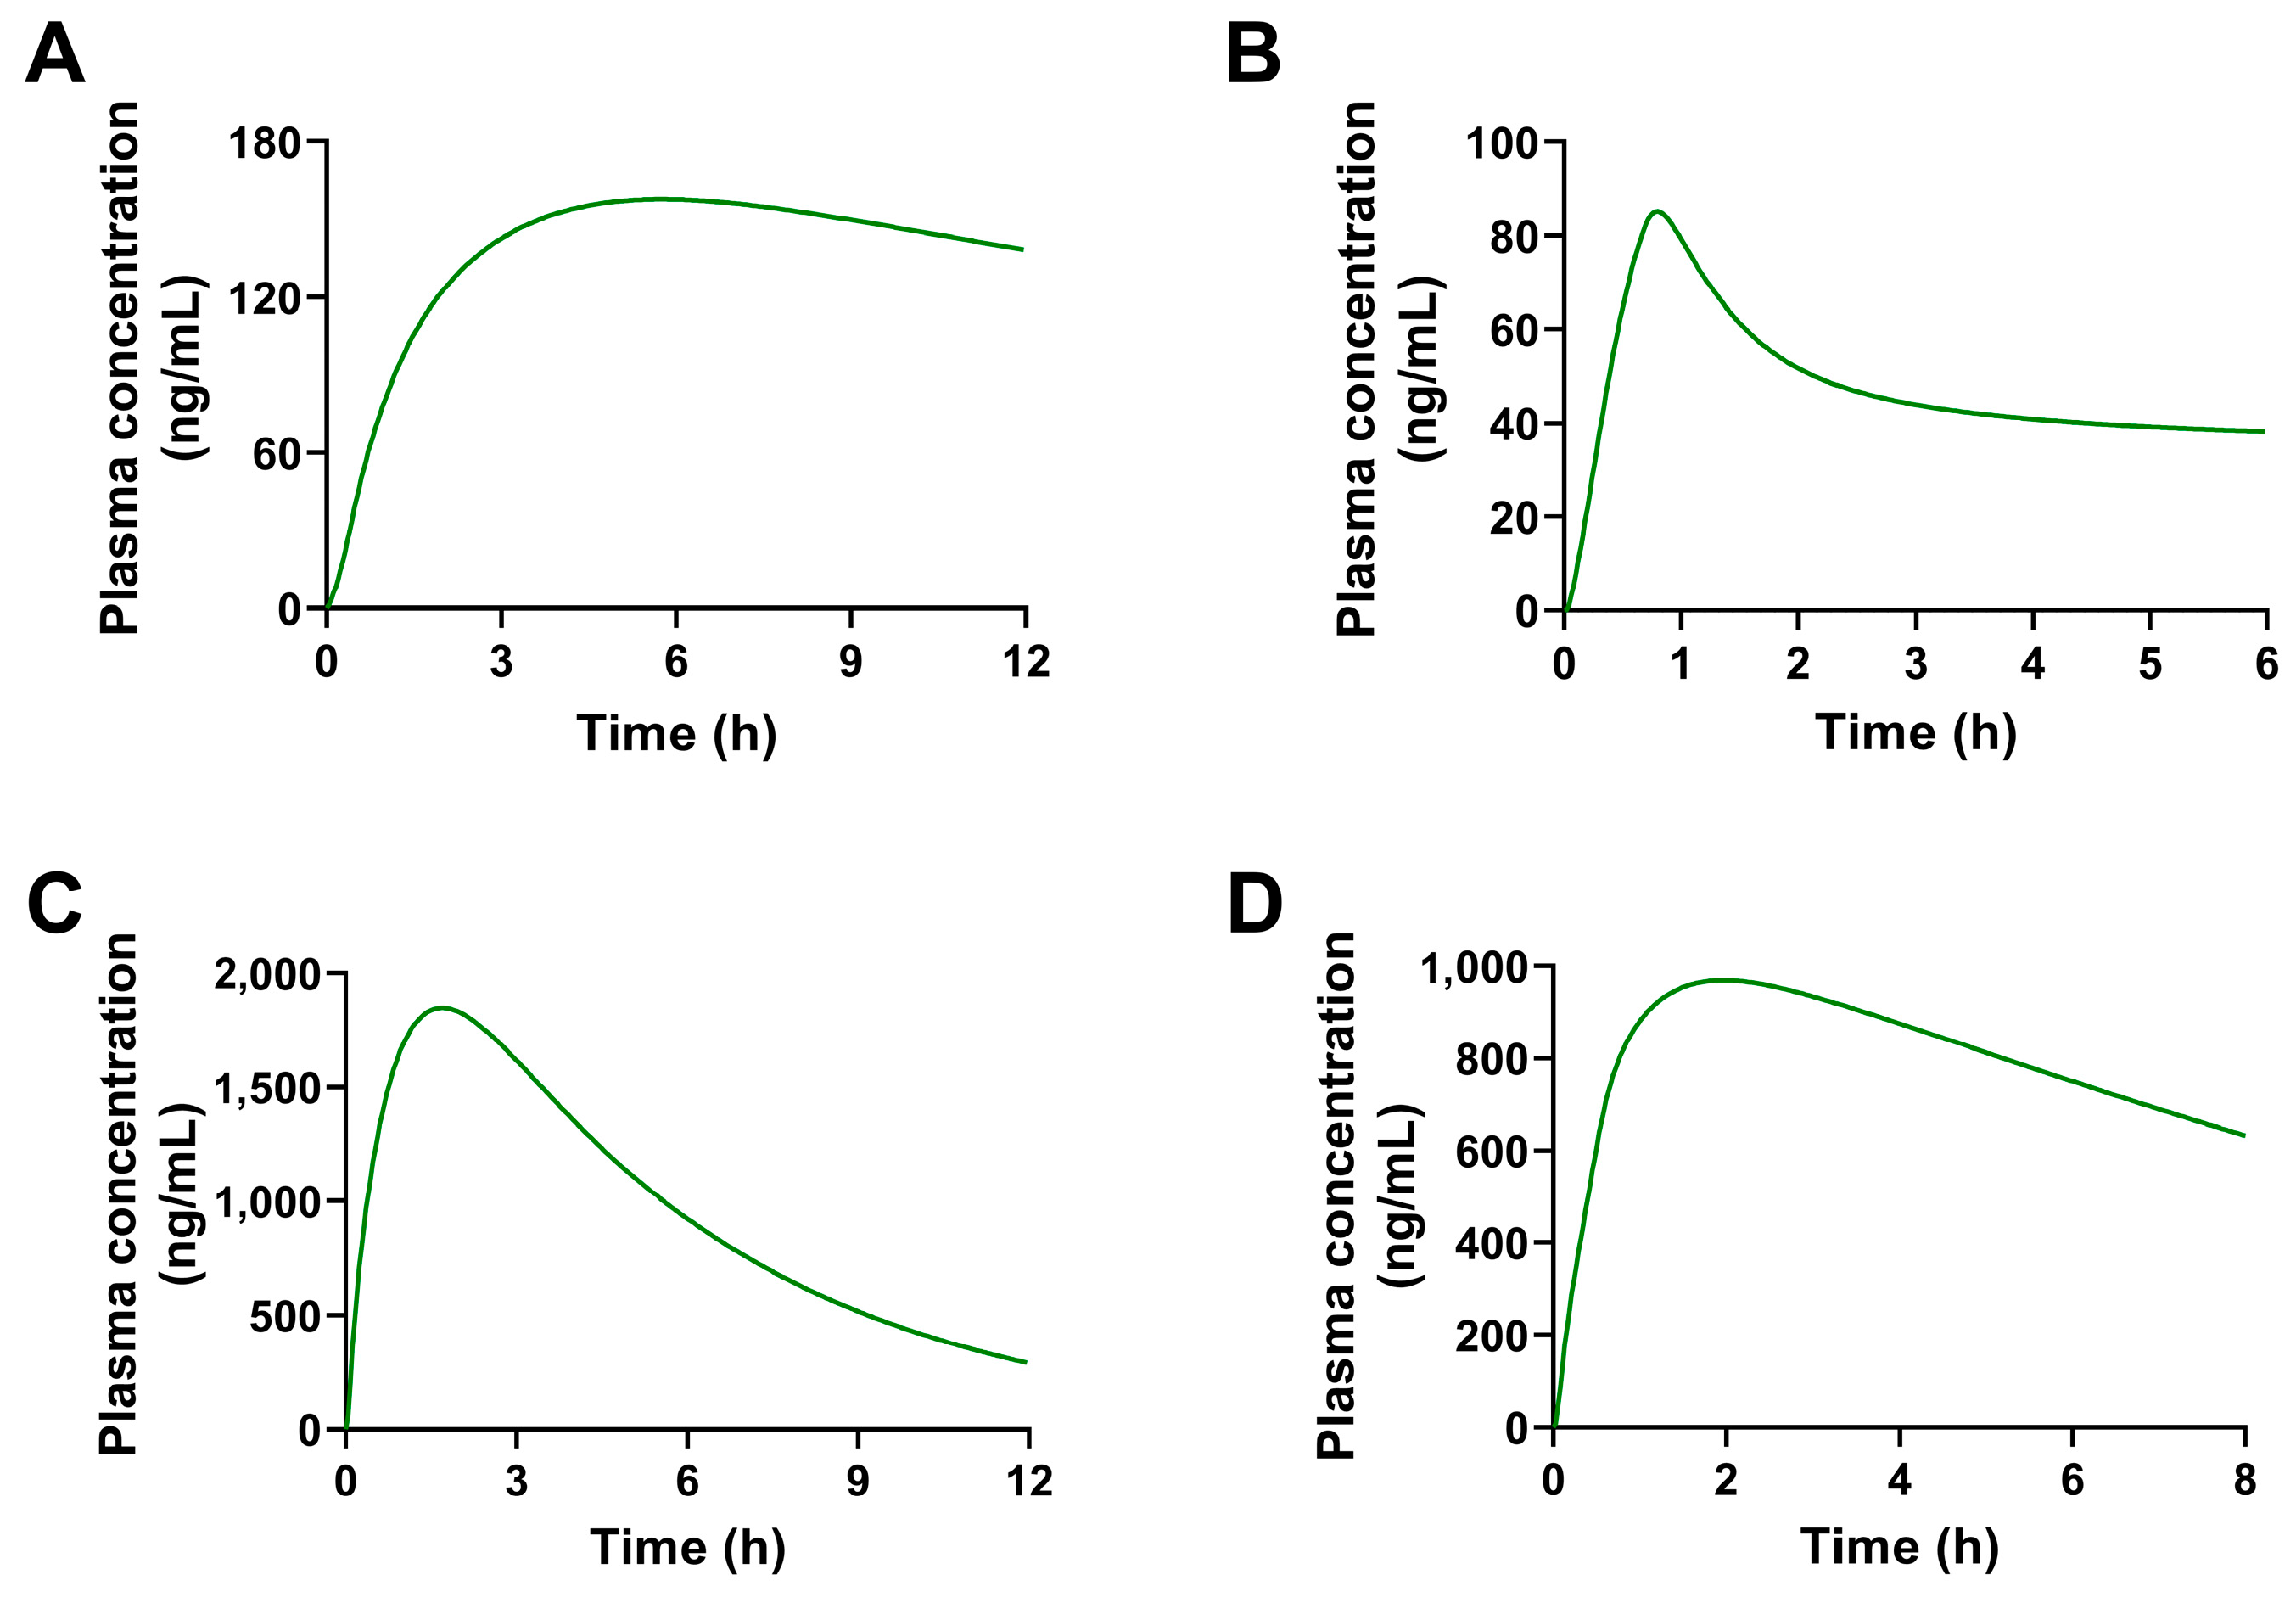
Based on the PBPK models of these four constituents in rats, a corresponding model for oral administration at the same dosage in humans was established. The predicted concentration-time curves in humans are shown in Figure 9 and the parameters are shown in Table 5. When the concentrations of 8-O-methylretusin (2), daidzin (3), and isolariciresinol (4) reached the peak values, the concentration decreased obviously with the prolonging of time. Compound 3′-methoxydadizein (1) did not show such an apparent elimination trend; whether it was due to the properties of this constituent or other reasons needs to be further verified by experiments.

3. Discussion

SPC has a long medicinal history and extensive pharmacological effects [1,2,3,4]. While the pharmacology and pharmacodynamics of SPC have been the focus of current research, pharmacokinetic studies, particularly in humans, are rarely reported and warrant further investigation. This study investigated the pharmacokinetic characteristics of 3′-methoxydadizein (1), 8-O-methylretusin (2), daidzin (3), and isolariciresinol (4) from SPC and provided a convenient method for the pharmacokinetic study in different species. The PBPK model is widely used in the fields of drug screening, pharmacokinetics or toxicokinetics, drug-drug interactions, and toxicological risk assessments [29,30,31]. In the process of establishing the PBPK models of four constituents from SPC, based on the slight secondary absorption peaks observed for these four constituents at 3 h (8-O-methylretusin) or 6 h (3′-methoxydadizein, daidzin, and isolariciresinol), it is preliminarily inferred that enterohepatic circulation may be involved in the pharmacokinetic processes of these constituents in rats; the enterohepatic circulation module in GastroPlus software has been enabled to accurately reflect the pharmacokinetic changes of constituents in rats, and also to correct the accuracy of these PBPK models and reduce the fitting deviation. Compared with the pharmacokinetic experiment, the established PBPK model can be used to predict the pharmacokinetics of different doses or species.
As mentioned in some reports and the Chinese Pharmacopoeia Commission [1,4,32], SPC contains multiple active constituents and exhibits significant pharmacological activities in treating inflammation-related diseases. Due to the variety of constituents in herbal drugs, the pharmacokinetic characteristics of each compound are influenced by each other when the herbal drugs enter the body in the form of “constituent group” [33,34]. Consequently, the pharmacokinetic characteristics of these constituents may differ from those observed when they are administered individually [16,35]. Furthermore, the clinical dosage of SPC ranges widely, from 7.5 g to 45 g [36], making pharmacokinetic studies with different dosages more frequent and the experimental process more complex.
The four constituents we selected are representative active components of SPC and their pharmacokinetic processes have been studied in our previous study [16]. Although studying the pharmacokinetic characteristics of more constituents in SPC extract would better represent the overall pharmacokinetics of this extract, the chemical constituents of SPC extract is highly diverse, making it impractical to characterize the pharmacokinetics of each compound. Therefore, four representative constituents were selected and their PBPK models were established based on the concentration-time curve profiles with good validation (R2 and FE values were all acceptable), this approach can reflect the PBPK characteristics of SPC extract to some extent. Moreover, their fitting degree to the PBPK models was high, enhancing the model’s accuracy. The established PBPK models of SPC containing different constituents can predict the pharmacokinetic process in a manner close to clinical practice and adhere to the 3R (Reduction, Replacement, and Refinement) principle, thereby avoiding more complex experiments.
The parameters we selected for modeling, including both constituent-specific properties and physiologically based pharmacokinetic parameters, influence the processes of absorption, distribution, metabolism, and elimination of these four constituents in SPC. Sensitivity analysis has revealed that parameters such as fup. CLLiver, Log D, and Rbp can significantly affect the absorption capacity of the constituents, introducing potential uncertainties into PBPK modeling. These parameters should be given particular attention during the modeling and optimization process. The Monte Carlo simulations or population-based modeling can be used to account for parameter variability, or use some surrogate data or analog constituents for initial estimates [37,38].
Although the PBPK model of these four constituents of SPC provides a more intuitive and convenient approach for predicting the pharmacokinetics of SPC in humans, this study has certain limitations when compared to the actual results. First, the predicted results by PBPK model are an integration of multiple simulation processes, including protein binding, tissue distribution, body composition, blood flow rates, and enzymatic reactions in metabolic tissues, which inherently differ from actual conditions. Second, the PBPK model for SPC established in this study primarily relied on published or internally validated equations to construct the model. Sensitivity analysis can evaluate the impact of individual parameters, screening out input parameters with large uncertainties, which can help confirm the priority of data collection or experimental research, thereby reducing the uncertainty of these input parameters and model outputs; however, the variable ranges of these parameters are not explicitly defined. Furthermore, as an extract of TCM, the pharmacokinetics of SPC lack sufficient clinical data, which imposes constraints on the application of the PBPK model. Even though there are certain differences between the results predicted by the PBPK models and the observed results, the difference may be more obvious in the prediction results of humans; our constructed PBPK models provide valuable reference points for the pharmacokinetic evaluation of multiple constituents administered together, laying the foundation for further predictions of the pharmacokinetic processes of active constituents from medicinal plants in multiple oral administrations or special populations.

4. Materials and Methods

4.1. Materials

4.1.1. Parameters for the PBPK Model

The ADMET Predictor TM (10.0) software was used to predict some required parameters; the GastroPlus TM (9.8.2) software (Simulations Plus, Inc., Lancaster, CA, USA) was used to establish the PBPK model and simulate different pharmacokinetic behaviors of these four constituents.

4.1.2. Experimental Verification Materials

For the experimental verification of the pharmacokinetic behaviors of four constituents predicted by the PBPK models in rats after oral administrated SPC, the materials used in this experiment are listed in Supplementary Data.

4.2. Methods

4.2.1. Model Parameters and Assumptions

The physicochemical and biochemical parameters of these constituents from SPC were collected, including molecular weight (MW), solubility, dissociation constant (pKa), oil-water partition coefficient (LogP), plasma free fraction (fup), blood-plasma concentration ratio (Rbp), etc. Based on the results of our previous ADME experiments of SPC [16], parameters such as blood concentration (Cmax), clearance (CL), and area under the curve (AUC) of the active constituents of SPC were collected. Additionally, we incorporated the CYP enzyme system, which influences the metabolism of constituent, into the establishing of PBPK model.
Based on the predictions from the ADMET Predictor software, these constituents are primarily metabolized by CYP1A2 or CYP2C9 in vivo, and we assumed that no involvement of other metabolic enzymes or transporters to simplify the structure of the PBPK model. CYP1A2 or CYP2C9 was primarily considered for inclusion in the modeling, the Km of CYP1A2 for 3′-methoxydadizein and 8-O-methylretusin were 44.408 and 5.409 μM, respectively; the Km of CYP2C9 for isolariciresinol was 16.423 μM, and the relevant Vmax was 9.308, 8.998, and 7.152 nM/min/nM, respectively. For daidzin, there were no predicted metabolic enzyme parameters, so the default values provided by the GastroPlus software were used eventually.
In the PBPK modeling, the tissue type was considered to be perfusion rate-limited, with the liver and kidneys identified as the primary organs for drug metabolism. Tissue-plasma partition coefficient (Kp) is the ratio of drug concentration in tissue versus drug concentration in plasma and is an important parameter for drug distribution. The Kp of tissues in rats was calculated using the Poulin and Theil equation that is in the built-in software of GastroPlus, with the assumption that these constituents enter tissues and plasma uniformly via passive diffusion, without specific binding to lipids or plasma proteins.

4.2.2. The Construction of the PBPK Model

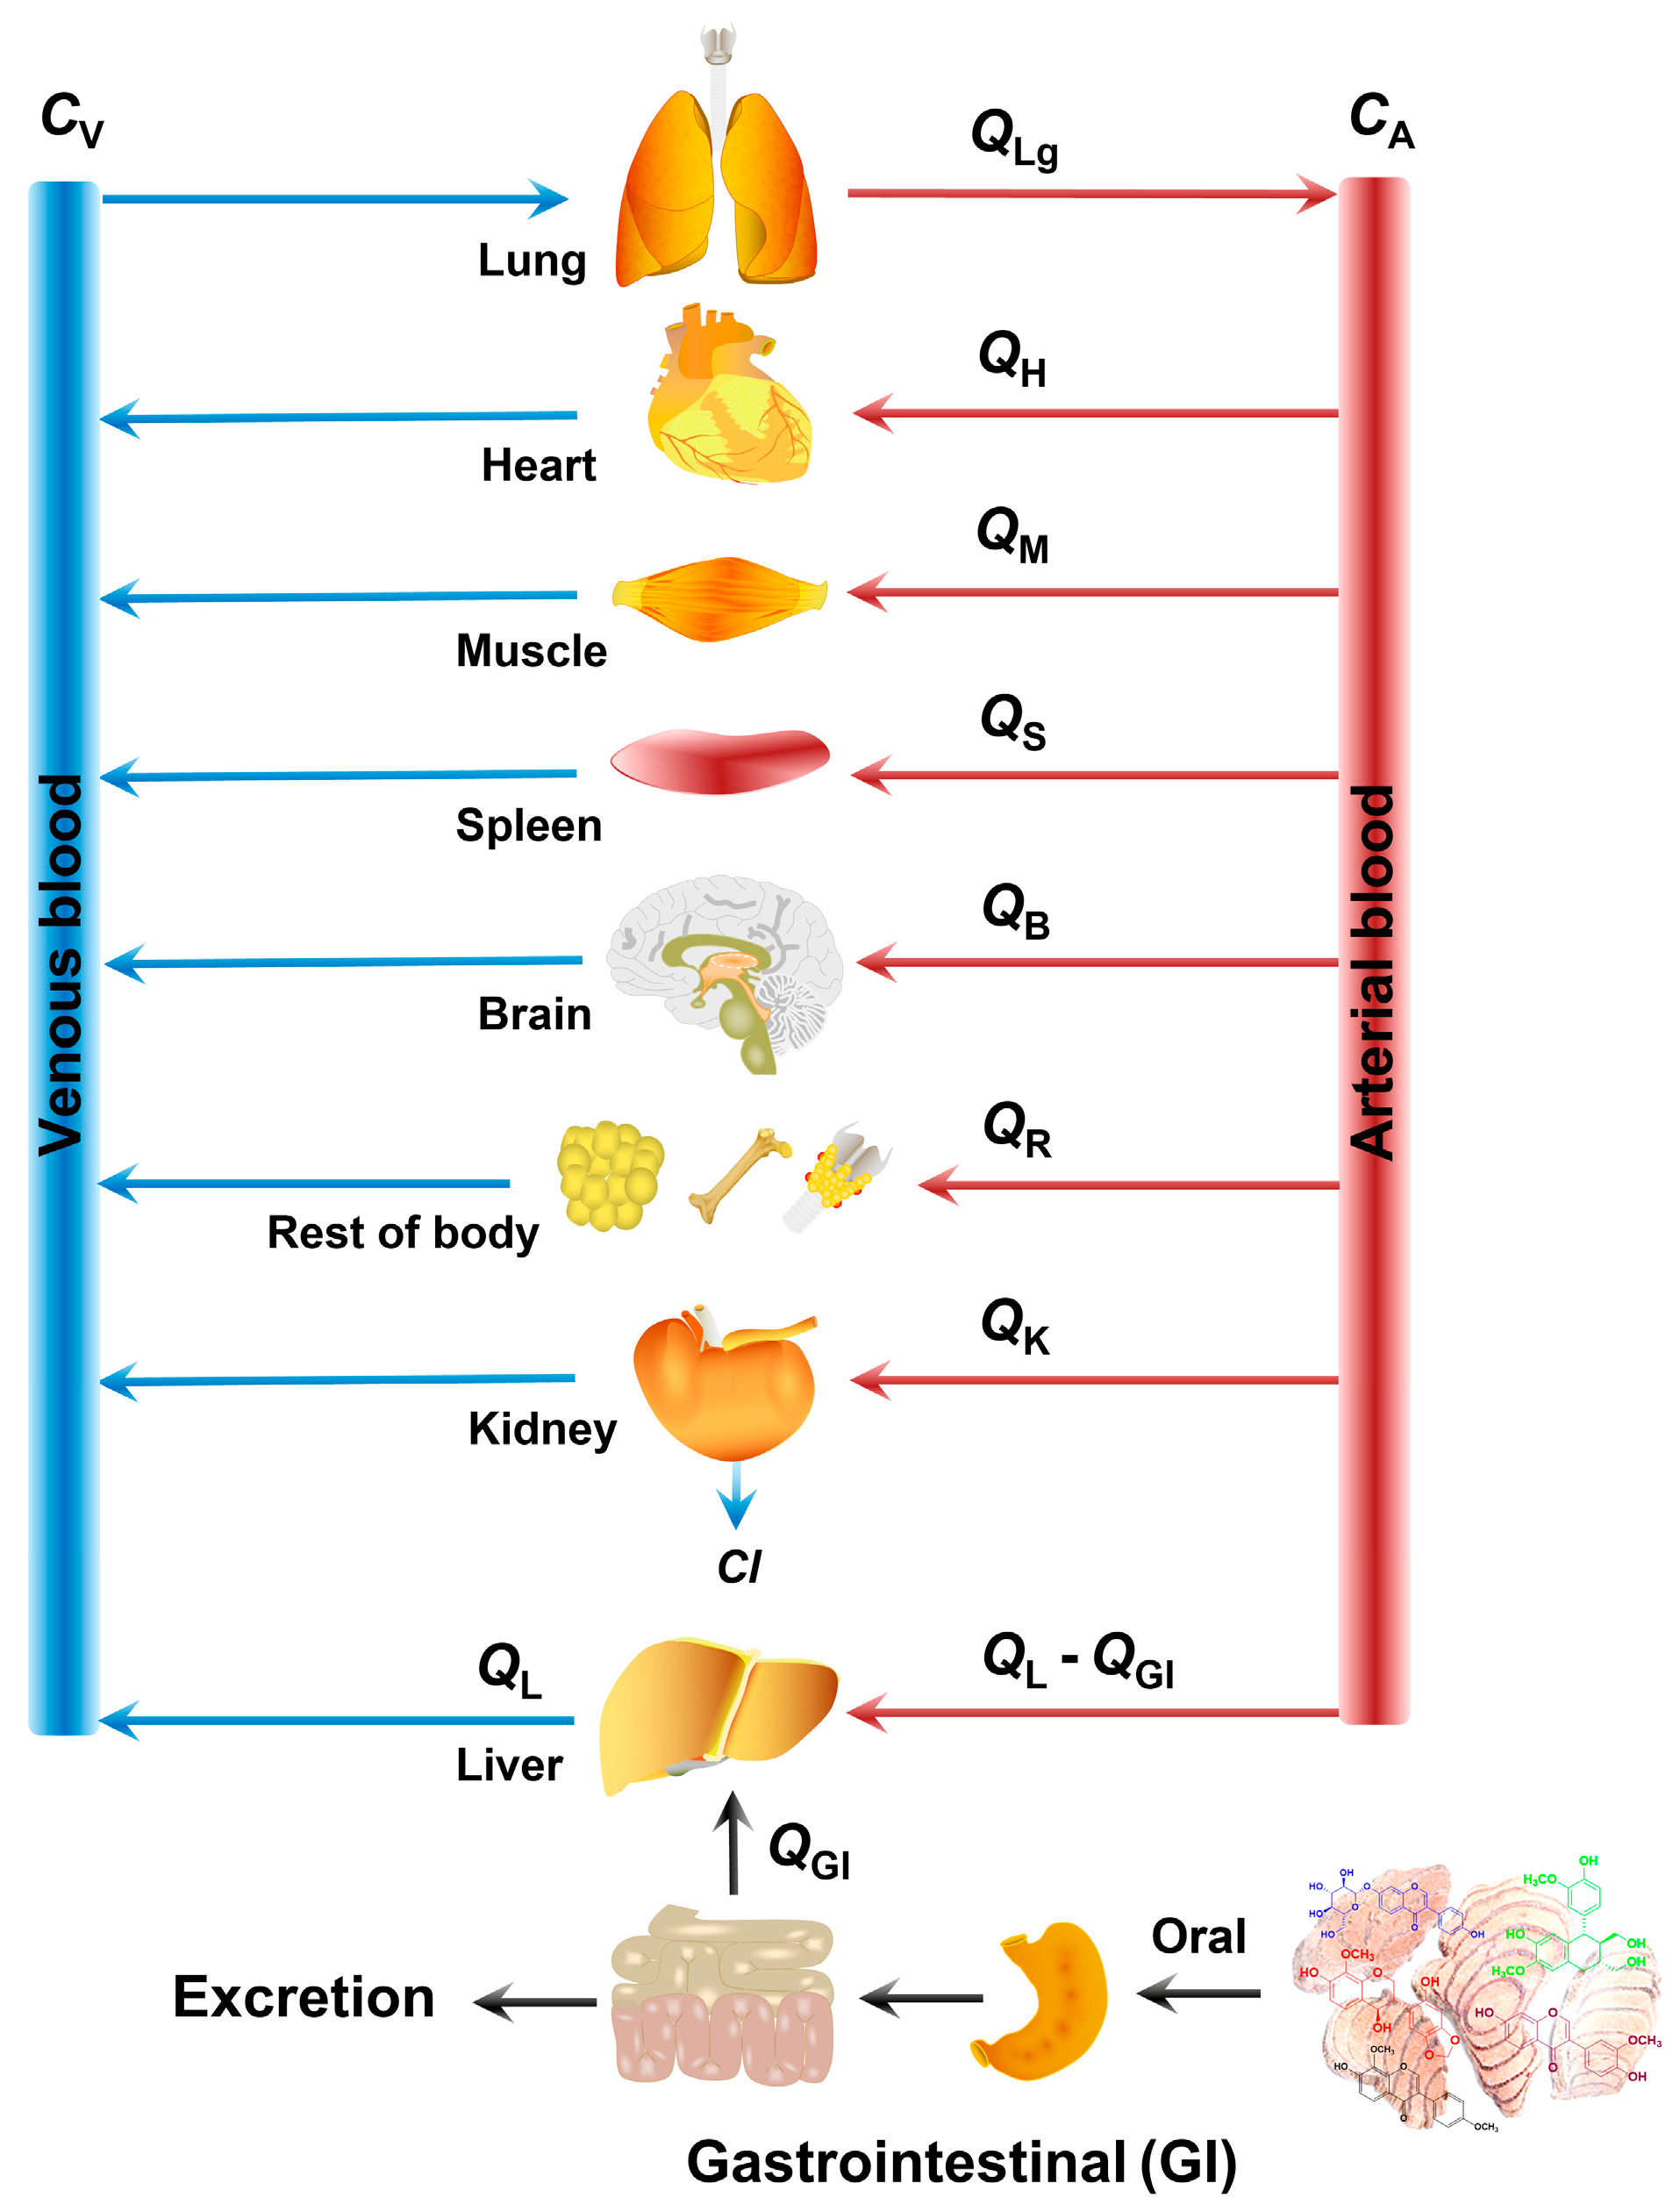
For the construction of PBPK models of these four active constituents of SPC in rats, assuming the drug is excreted mainly by the kidney and undergoes enterohepatic circulation, with blood flow rates in arteries and veins being the same and represented by Q, and the flow rates in each compartment as shown in Figure 10, the physiological pharmacokinetic process of these constituents in any given tissue can be calculated using a system of differential equations (Equation (1)). The PBPK models were constructed by GastroPlus software. In brief, the collected parameters of these constituents motioned in the previous section were all imported into GastroPlus software to simulate the concentration-time curves and gain the predicted pharmacokinetic parameters. The consistency between the calculated results (Calc.) and the observable values (Obs.) was then evaluated.
The system of differential equations was shown as follows:
C O B = C i / k i L u n g :   d C L g / d t = Q L g ( C V C L g / k L g ) / V L g L i v e r :   d C L / d t = [ ( Q L Q G I ) C A + Q G I C G I / k G I Q L C L / k L f b V m a x C L / ( K M k L + f b C L ) ] / V L K i d n e y :   d C K / d t = ( Q K C A Q K C K / k K C l K C K ) / V K H e a r t :   d C H / d t = Q H ( C A C H / k H ) / V H M u s c l e :   d C M / d t = Q M ( C A C M / k M ) / V M S p l e e n :   d C S / d t = Q S ( C A C S / k S ) / V S B r a i n :   d C B / d t = Q B ( C A C B / k B ) / V B R e s t   o f   b o d y :   d C R / d t = Q R ( C A C R / k R ) / V R A r t e r y :   d C A / d t = Q ( C L g / k L g C A ) / V A V e n o u s :   d C V / d t = ( Q H C H / k H + Q M C M / k M + Q S C S / k S + Q B C B / k B + Q R C R / k R + Q K C K / k K + Q L C L / k L Q L g C V ) / V V
COB means the drug concentration in the blood when blood flows out from tissue. Ci means the drug concentration in tissue. CA and Cv means the drug concentration in the artery and vein, respectively. Cl’ means clearance. Q means the blood flow rate of drug in tissues. ki means the concentration ratio of tissue and blood. Vi means distribution volume of drug in tissue. KM means Michaelis constant.

4.2.3. Evaluation of the PBPK Model

The values of the PBPK model were linear regression to the observed values, and the correlation coefficient R2 was calculated simultaneously. The R2 of a qualified model with acceptable simulation effects should be no less than 0.8 [26,27]. Parameters including Cmax, Tmax, and AUC of each compound in the PBPK model were calculated and compared with the corresponding observable values. Fold-error (FE) of Cal. and Obs. or Val. were calculated using Equation (2), the model is accurately constructed when FE is less than 2 [28].
FE = 10   | log ( Simulated Observed ) |

4.2.4. Sensitivity Analysis

For the sensitivity analysis of parameters, we primarily focused on the solubility of the constituents and the parameters that influence their absorption in the human body. We selected seven parameters, mainly the particle size of the constituents, the permeability (Peff), solubility, LogD, CL, Rbp, and fup of humans for sensitivity analysis, as the variations of these parameters not only affect the solubility and absorption of the constituents of SPC in vivo but also influence the distribution and metabolism. These factors, in turn, impact the accuracy of the PBPK model.

4.2.5. Prediction of the Pharmacokinetics Among Different Doses and Species

After being constructed and verified, the PBPK models were used to predict the pharmacokinetic characteristics of these four constituents in rats at different oral doses and multiple doses administration, respectively.
The pharmacokinetic fitting results of rats given 60 g crude drug/kg body weight of SPC by gavage were verified by experiments. The verification experiment was conducted according to our previous pharmacokinetic study [16]. In brief, 1.5 mL suspension of SPC was given to rats by oral administration; 300 μL blood samples from orbital venous at 0.083, 0.25, 0.5, 0.75, 1.0, 1.5, 2, 3, 4, 6, 8, and 12 h were collected and pretreated with heparin sodium. After centrifugation, the plasma samples were obtained and further processed for subsequent detection by UFLC-MS/MS; the detailed analysis method is shown in Supplementary Data (Table S1 and Figure S1). The concentration-time curve of each compound was gained, and the pharmacokinetic parameters were calculated using DAS 2.0 software (DAS 2.0, Mathematical Pharmacology Professional Committee of China, Shanghai, China). The results of these four constituents were compared with the PBPK parameters predicted in rats at an oral dose of 60 g crude drug/kg body weight of SPC.
For the pharmacokinetic characteristics extrapolated from rats to humans, the CL in humans was predicted by a single species allometric scaling of rats (SSSrat) based on Equation (3) [39]; the distribution volume (Vss) was calculated according to Equation (4) using GastroPlus software. Therefore, the PBPK models of these four constituents in humans were constructed to predict the corresponding pharmacokinetic characteristics.
CL u , human = CL u , rat × W human W rat 0.75
CLu,human and CLu,rat represent clearance of humans and rats, respectively. Whuman and Wrat represent the weight of humans and rats, respectively. In this model, an adult male weight of 70 kg and a rat weight of 0.25 kg were set as parameters for model prediction.
Vss = Vp + Ve × E/P + ∑Vt × Kp
Vp represents the volume of plasma; Ve represents the volume of erythrocyte; E/P represents the ratio of erythrocyte to plasma concentration; Vt was the volume of tissues; Kp represents the partition coefficients of plasma.

5. Conclusions

In conclusion, our study established PBPK models of four active constituents from SPC successfully, and these models can accurately predict the pharmacokinetic behavior of whole herbs in different doses and different species. TCM is a system with complex chemical constituents; the application of PBPK models to predict the pharmacokinetic characteristics of different constituents of TCM may shed light on the problems of unclear dosages caused by multiple constituents in TCM in clinical practice.

Supplementary Materials

The following supporting information can be downloaded at: https://www.mdpi.com/article/10.3390/ph17121621/s1, The instrument and analytical conditions of the UFLC-MS/MS method (Figure S1: MRM chromatograms of rat plasma; Table S1: The retention time and ion equivalent parameters of 4 constituents in rat plasma samples); The experimental C-t data of the five active compounds in rats for validation (Table S2: The experimental C-t data of the four active compounds in rats for validation); The experimental data in rats calculated by DAS 2.0.(Table S3: Compartment model parameters of 3′-methoxydaidzein; Table S4: Statistical moment parameters of 3′-methoxydaidzein; Table S5: Compartment model parameters of 8-O-methylretusin; Table S6: Statistical moment parameters of 8-O-methylretusin; Table S7: Compartment model parameters of Daidzin; Table S8: Statistical moment parameters of Daidzin; Table S9: Compartment model parameters of Isolariciresinol; Table S10: Statistical moment parameters of Isolariciresinol).

Author Contributions

Experimental design, modeling, and simulation, X.L., R.D. and T.Z.; model verification and parameters calculation, X.L., Y.L., L.L., Z.Y. and Y.Z.; original manuscript preparation, X.L. and R.D.; manuscript-review and editing, X.L. and Q.W.; supervision, Q.W. and Y.Z.; project administration and funding acquisition, X.L. and Q.W. All authors have read and agreed to the published version of the manuscript.

Funding

This work was supported by the Natural Science Foundation of Beijing Municipality (Funding NO. 7224360).

Institutional Review Board Statement

The animal procedures used in the verification of PBPK models were carried out following the National Institutes of Health Guide for the Care and Use of Laboratory Animals and authenticated and authorized by the Experimental Animal Protection and Use Committee of Peking University (Approval No. LA2021275).

Informed Consent Statement

Not applicable.

Data Availability Statement

All data are presented in the article and Supplementary Materials.

Conflicts of Interest

All of the authors listed in this article declared they have no conflicts of interest.

References

  1. Chinese Pharmacopoeia Commission. Pharmacopoeia of the People’s Republic of China, Volume I; China Medical Science and Technology Press: Beijing, China, 2020; pp. 202–203. [Google Scholar]
  2. Wang, N.; Wang, J.; Meng, X.; Li, T.; Wang, S.; Bao, Y. The pharmacological effects of Spatholobi Caulis tannin in cervical cancer and its precise therapeutic effect on related circRNA. Mol. Ther. Oncolytics 2019, 14, 121–129. [Google Scholar] [CrossRef] [PubMed]
  3. Wang, M.; Ji, H. Experience and application of Simiaosan combine with Rattan drugs in the treatment of acute gouty arthritis. Rheum. Arthritis 2020, 9, 57–59, 75. [Google Scholar]
  4. Tan, J.; Lin, H.Q.; Wang, H.; Wu, F.L.; Dong, Q.H.; Liu, J.P.; Li, P.Y. Research progress on the pharmacological activities and clinical application of Jixueteng. Pharm. Clin. Chin. Mat. Med. 2018, 9, 61–65. [Google Scholar]
  5. Tang, P.; Liu, H.; Lin, B.; Wang, W.; Chen, W.; Lu, Z.; Li, P.; Gui, S.; Zhan, Y.; Lin, B. Spatholobi Caulis dispensing granule reduces deep vein thrombus burden through antiinflammation via SIRT1 and Nrf2. Phytomedicine 2020, 77, 153285. [Google Scholar] [CrossRef]
  6. Zhang, C.; Liu, J.; He, X.; Sheng, Y.; Yang, C.; Li, H.; Xu, J.; Xu, W.; Huang, K. Caulis Spatholobi ameliorates obesity through activating brown adipose tissue and modulating the composition of gut microbiota. Int. J. Mol. Sci. 2019, 20, 5150. [Google Scholar] [CrossRef]
  7. Sun, L.; Yang, L.; Du, X.; Liu, L.; Ran, Q.; Yang, Q.; Chen, Y.; Zhu, X.; Li, Q. Ethyl-acetate extract of Spatholobi Caulis blocked the pro-metastatic support from the hemato-microenvironment of colon cancer by specific disruption of tumor-platelet adhesion. Phytomedicine 2024, 128, 155420. [Google Scholar] [CrossRef] [PubMed]
  8. Cui, Y.; Sun, W.; Li, Q.; Wang, K.; Wang, Y.; Lv, F.; Chen, X.; Peng, X.; Wang, Y.; Li, J.; et al. Effects of Caulis spatholobi polysaccharide on immunity, intestinal mucosal barrier function, and intestinal microbiota in cyclophosphamide-induced immunosuppressive chickens. Front. Vet. Sci. 2022, 18, 833842. [Google Scholar] [CrossRef]
  9. Yang, Z.; Tan, X.; Zhang, Z.; Han, J.; Qu, S.; Liu, T.; Wang, G. Ononin: A candidate anti-parasitic drug isolated from Spatholobi Caulis against infections of dactylogyrus intermedius (Monogenea). Parasitol. Int. 2022, 88, 102535. [Google Scholar] [CrossRef] [PubMed]
  10. Park, H.S.; Hur, H.J.; Kim, S.H.; Park, S.J.; Hong, M.J.; Sung, M.J.; Kwon, D.Y.; Kim, M.S. Biochanin A improves hepatic steatosis and insulin resistance by regulating the hepatic lipid and glucose metabolic pathways in diet-induced obese mice. Mol. Nutr. Food Res. 2016, 60, 1944–1955. [Google Scholar] [CrossRef]
  11. Zhang, P.; Ma, H.; Lin, X.; Qiu, F. Simultaneous quantification and rat pharmacokinetics of formononetin-7-O-β-D-glucoside and its metabolite formononetin by high-performance liquid chromatography-tandem mass spectrometry. J. Sep. Sci. 2020, 43, 2996–3005. [Google Scholar] [CrossRef]
  12. Mamagkaki, A.; Bouris, I.; Parsonidis, P.; Vlachou, I.; Gougousi, M.; Papasotiriou, I. Genistein as a dietary supplement; formulation, analysis and pharmacokinetics study. PLoS ONE 2021, 16, e0250599. [Google Scholar] [CrossRef] [PubMed]
  13. Yang, Z.; Kulkarni, K.; Zhu, W.; Hu, M. Bioavailability and pharmacokinetics of genistein: Mechanistic studies on its ADME. Anticancer Agents Med. Chem. 2012, 12, 1264–1280. [Google Scholar] [CrossRef] [PubMed]
  14. Raju, K.S.R.; Rashid, M.; Gundeti, M.; Taneia, I.; Malik, M.Y.; Singh, S.K.; Chaturvedi, S.; Challagundla, M.; Singh, S.P.; Gayen, J.R.; et al. LC-ESI-MS/MS method for the simultaneous determination of isoformononetin, daidzein, and equol in rat plasma: Application to a preclinical pharmacokinetic study. J. Chromatogr. B Anal. Technol. Biomed. Life Sci. 2019, 1129, 121776. [Google Scholar] [CrossRef] [PubMed]
  15. Li, Y.; Song, T.; Jin, X. UPLC-MS/MS assay for simultaneous determination of four compounds in rat plasma: Application to pharmacokinetic study after oral administration of Caulis Spatholobi extract. Biomed. Chromatogr. 2016, 30, 1714–1720. [Google Scholar] [CrossRef] [PubMed]
  16. Liu, X.Y.; Zhang, Y.B.; Yang, X.W.; Xu, W.; Liu, L.; Zhang, P.; Gong, Y.; Liu, N.F.; Peng, K.F. Simultaneous determination of twenty-five compounds with anti-inflammatory activity in Spatholobi Caulis by using an optimized UFLC-MS/MS method: An application to pharmacokinetic study. J. Pharm. Biomed. Anal. 2021, 204, 114267. [Google Scholar] [CrossRef]
  17. Zhang, L.; Feng, F.; Wang, X.; Liang, H.; Yao, X.; Liu, D. Dose prediction and pharmacokinetic simulation of XZP-5610, a small molecule for NASH therapy, using allometric scaling and physiologically based pharmacokinetic models. Pharmaceuticals 2024, 17, 369. [Google Scholar] [CrossRef]
  18. Gao, J.; Feng, F.; Wang, L.X.; Chong, X.M.; Wang, C.; Yin, L.H. Evaluation on the efficacy of moxifloxacin hydrochloride based on physiological pharmacokinetic models. Acta Pharma Sin. 2022, 57, 2153–2157. [Google Scholar]
  19. Choi, G.W.; Kang, D.W.; Kim, J.H.; Cho, S.J.; Lee, Y.B.; Kwon, I.H.; Cho, H.Y. Sex, age, and species differences of perfluorooctanoic acid modeled by flow- versus permeability-limited physiologically-based pharmacokinetic models. Toxicology 2024, 505, 153806. [Google Scholar] [CrossRef]
  20. Ruiz, P.; Emond, C.; McLanahan, E.D.; Joshi-Barr, S.; Mumtaz, M. Exploring mechanistic toxicity of mixtures using PBPK modeling and computational systems biology. Toxicol. Sci. 2020, 174, 38–50. [Google Scholar] [CrossRef]
  21. Bhatnagar, S.; Mukherjee, D.; Salem, A.H.; Miles, D.; Menon, R.M.; Gibbs, J.P. Dose adjustment of venetoclax when co-administered with posaconazole: Clinical drug-drug interaction predictions using a PBPK approach. Cancer Chemother. Pharmacol. 2021, 87, 465–474. [Google Scholar] [CrossRef]
  22. U.S. Department of Health and Human Services, Food and Drug Administration, CDER. The Use of Physiologically Based Pharmacokinetic Analyses-Biopharmaceutics Applications for Oral Drug Product Development, Manufacturing Changes, and Controls (Guidance for Industry); U.S. Department of Health and Human Services, Food and Drug Administration, CDER: Rockville, MD, USA, 2020; pp. 1–3. [Google Scholar]
  23. Li, X.M.; Su, B.D.; Huang, Z.W.; Ning, L.; Li, Y.B. Predicting pharmacokinetic behavior of aconitine in humans based on physiological pharmacokinetic model. Chin. Tradit. Herb. Drugs 2023, 54, 425–433. [Google Scholar]
  24. Liu, X.Y.; Zhang, Y.B.; Yang, X.W.; Wu, X.W.; Yang, Y.F.; Xu, W.; Wan, M.Q.; Gong, Y.; Liu, N.F.; Zhang, P. Biological analysis of constituents in Spatholobi Caulis by UFLC-MS/MS: Enhanced quantification and application to permeability properties study in Caco-2 cell monolayer model. J. Pharm. Biomed. Anal. 2023, 226, 115235. [Google Scholar] [CrossRef]
  25. Wu, S.; Xu, W.; Wang, F.R.; Yang, X.W. Study of the biotransformation of Tongmai formula by human intestinal flora and its intestinal permeability across the Caco-2 cell monolayer. Molecules 2015, 20, 18704–18716. [Google Scholar] [CrossRef]
  26. Yuan, Y.; He, Q.; Zhang, S.; Li, M.; Tang, Z.; Zhu, X.; Jiao, Z.; Cai, W.; Xiang, X. Application of physiologically based pharmacokinetic modeling in preclinical studies: A feasible strategy to Practice the Principles of 3Rs. Front. Pharmacol. 2022, 13, 895556. [Google Scholar] [CrossRef] [PubMed]
  27. Jogiraju, V.K.; Avvari, S.; Gollen, R.; Taft, D.R. Application of physiologically based pharmacokinetic modeling to predict drug disposition in pregnant populations. Biopharm. Drug Dispos. 2017, 38, 426–438. [Google Scholar] [CrossRef] [PubMed]
  28. Holt, K.; Nagar, S.; Korzekwa, K. Methods to Predict Volume of Distribution. Curr. Pharmacol. Rep. 2019, 5, 391–399. [Google Scholar] [CrossRef]
  29. Fan, C.; Basharat, Z.; Mah, K.; Wei, C.R. Computerional approach for drug discovery against Gardnerella vaginalis in quest for safer and effective treatments for bacterial vaginosis. Sci. Rep. 2024, 14, 17437. [Google Scholar]
  30. Cho, C.K.; Kang, P.; Jang, G.G.; Lee, Y.J.; Bae, J.W.; Choi, C.I. PBPK modeling to predict the pharmacokinetics of venlafaxine and its active metabolite in different CYP2D6 genotypes and drug–drug interactions with clarithromycin and paroxetine. Arch. Pharm. Res. 2024, 47, 481–504. [Google Scholar] [CrossRef]
  31. Kolli, A.R.; Kuczaj, A.K.; Martin, F.; Hayes, A.W.; Peitsch, M.C.; Hoeng, J. Bridging inhaled aerosol dosimetry to physiologically based pharmacokinetic modeling for toxicological assessment: Nicotine delivery systems and beyond. Crit. Rev. Toxicol. 2019, 49, 725–741. [Google Scholar] [CrossRef]
  32. Zhao, J.J.; Zheng, F.Z.; Ma, J.F.; Ma, M.Y.; Guo, J. Study on the mechanism of the drug pair-Tripterygium Wilfordii and Caulis Spatholobi in the treatment of rheumatoid arthritis based on network pharmacology. Arthritis Rheumatol. 2020, 9, 11–15, 23. [Google Scholar]
  33. Li, C.; Cheng, C.; Jia, W.W.; Yang, J.L.; Yu, X.; Olaleye, O.E. Multi-compound pharmacokinetic research on Chinese herbal medicines: Identifying potentially therapeutic compounds and characterizing their disposition and pharmacokinetics. Acta Pharm. Sin. 2021, 56, 2426–2446. [Google Scholar]
  34. Ma, B.L.; Ma, Y.M. Pharmacokinetic herb-drug interactions with traditional Chinese medicine: Progress, causes of conflicting results and suggestions for future research. Drug Metab. Rev. 2016, 48, 1–26. [Google Scholar] [CrossRef] [PubMed]
  35. Luo, L.Y.; Fan, M.X.; Zhao, H.Y.; Li, M.X.; Wu, X.; Gao, W.Y. Pharmacokinetics and bioavailability of the isoflavones formononetin and ononin and their in vitro absorption in using chamber and Caco-2 cell models. J. Agric. Food Chem. 2018, 66, 2917–2924. [Google Scholar] [CrossRef] [PubMed]
  36. Cui, Y.S.; Lian, F.M.; Yu, T.Y.; Zhao, Y.R. Clinical application and dosage of suberect spatholobus stem. J. Changchun Univ. Chin. Med. 2022, 38, 374–377. [Google Scholar]
  37. Yang, Y.; Wang, Y.; Zeng, W.; Zhou, J.; Xu, M.; Lan, Y.; Liu, L.; Shen, J.; Zhang, C.; He, Q. Physiologically-based pharmacokinetic/pharmacodynamic modeling of meropenem in critically ill patients. Sci. Rep. 2024, 14, 19269. [Google Scholar] [CrossRef] [PubMed]
  38. Ellison, C.A.; Wu, S. Application of structural and functional pharmacokinetic analogs for physiologically based pharmacokinetic model development and evaluation. Regul. Toxicol. Pharmacol. 2020, 114, 104667. [Google Scholar] [CrossRef]
  39. Patel, D.; Dierks, E. Single-species allometric scaling: A strategic approach to support drug discovery. J. Pharm. Res. Int. 2018, 22, 1–7. [Google Scholar] [CrossRef]
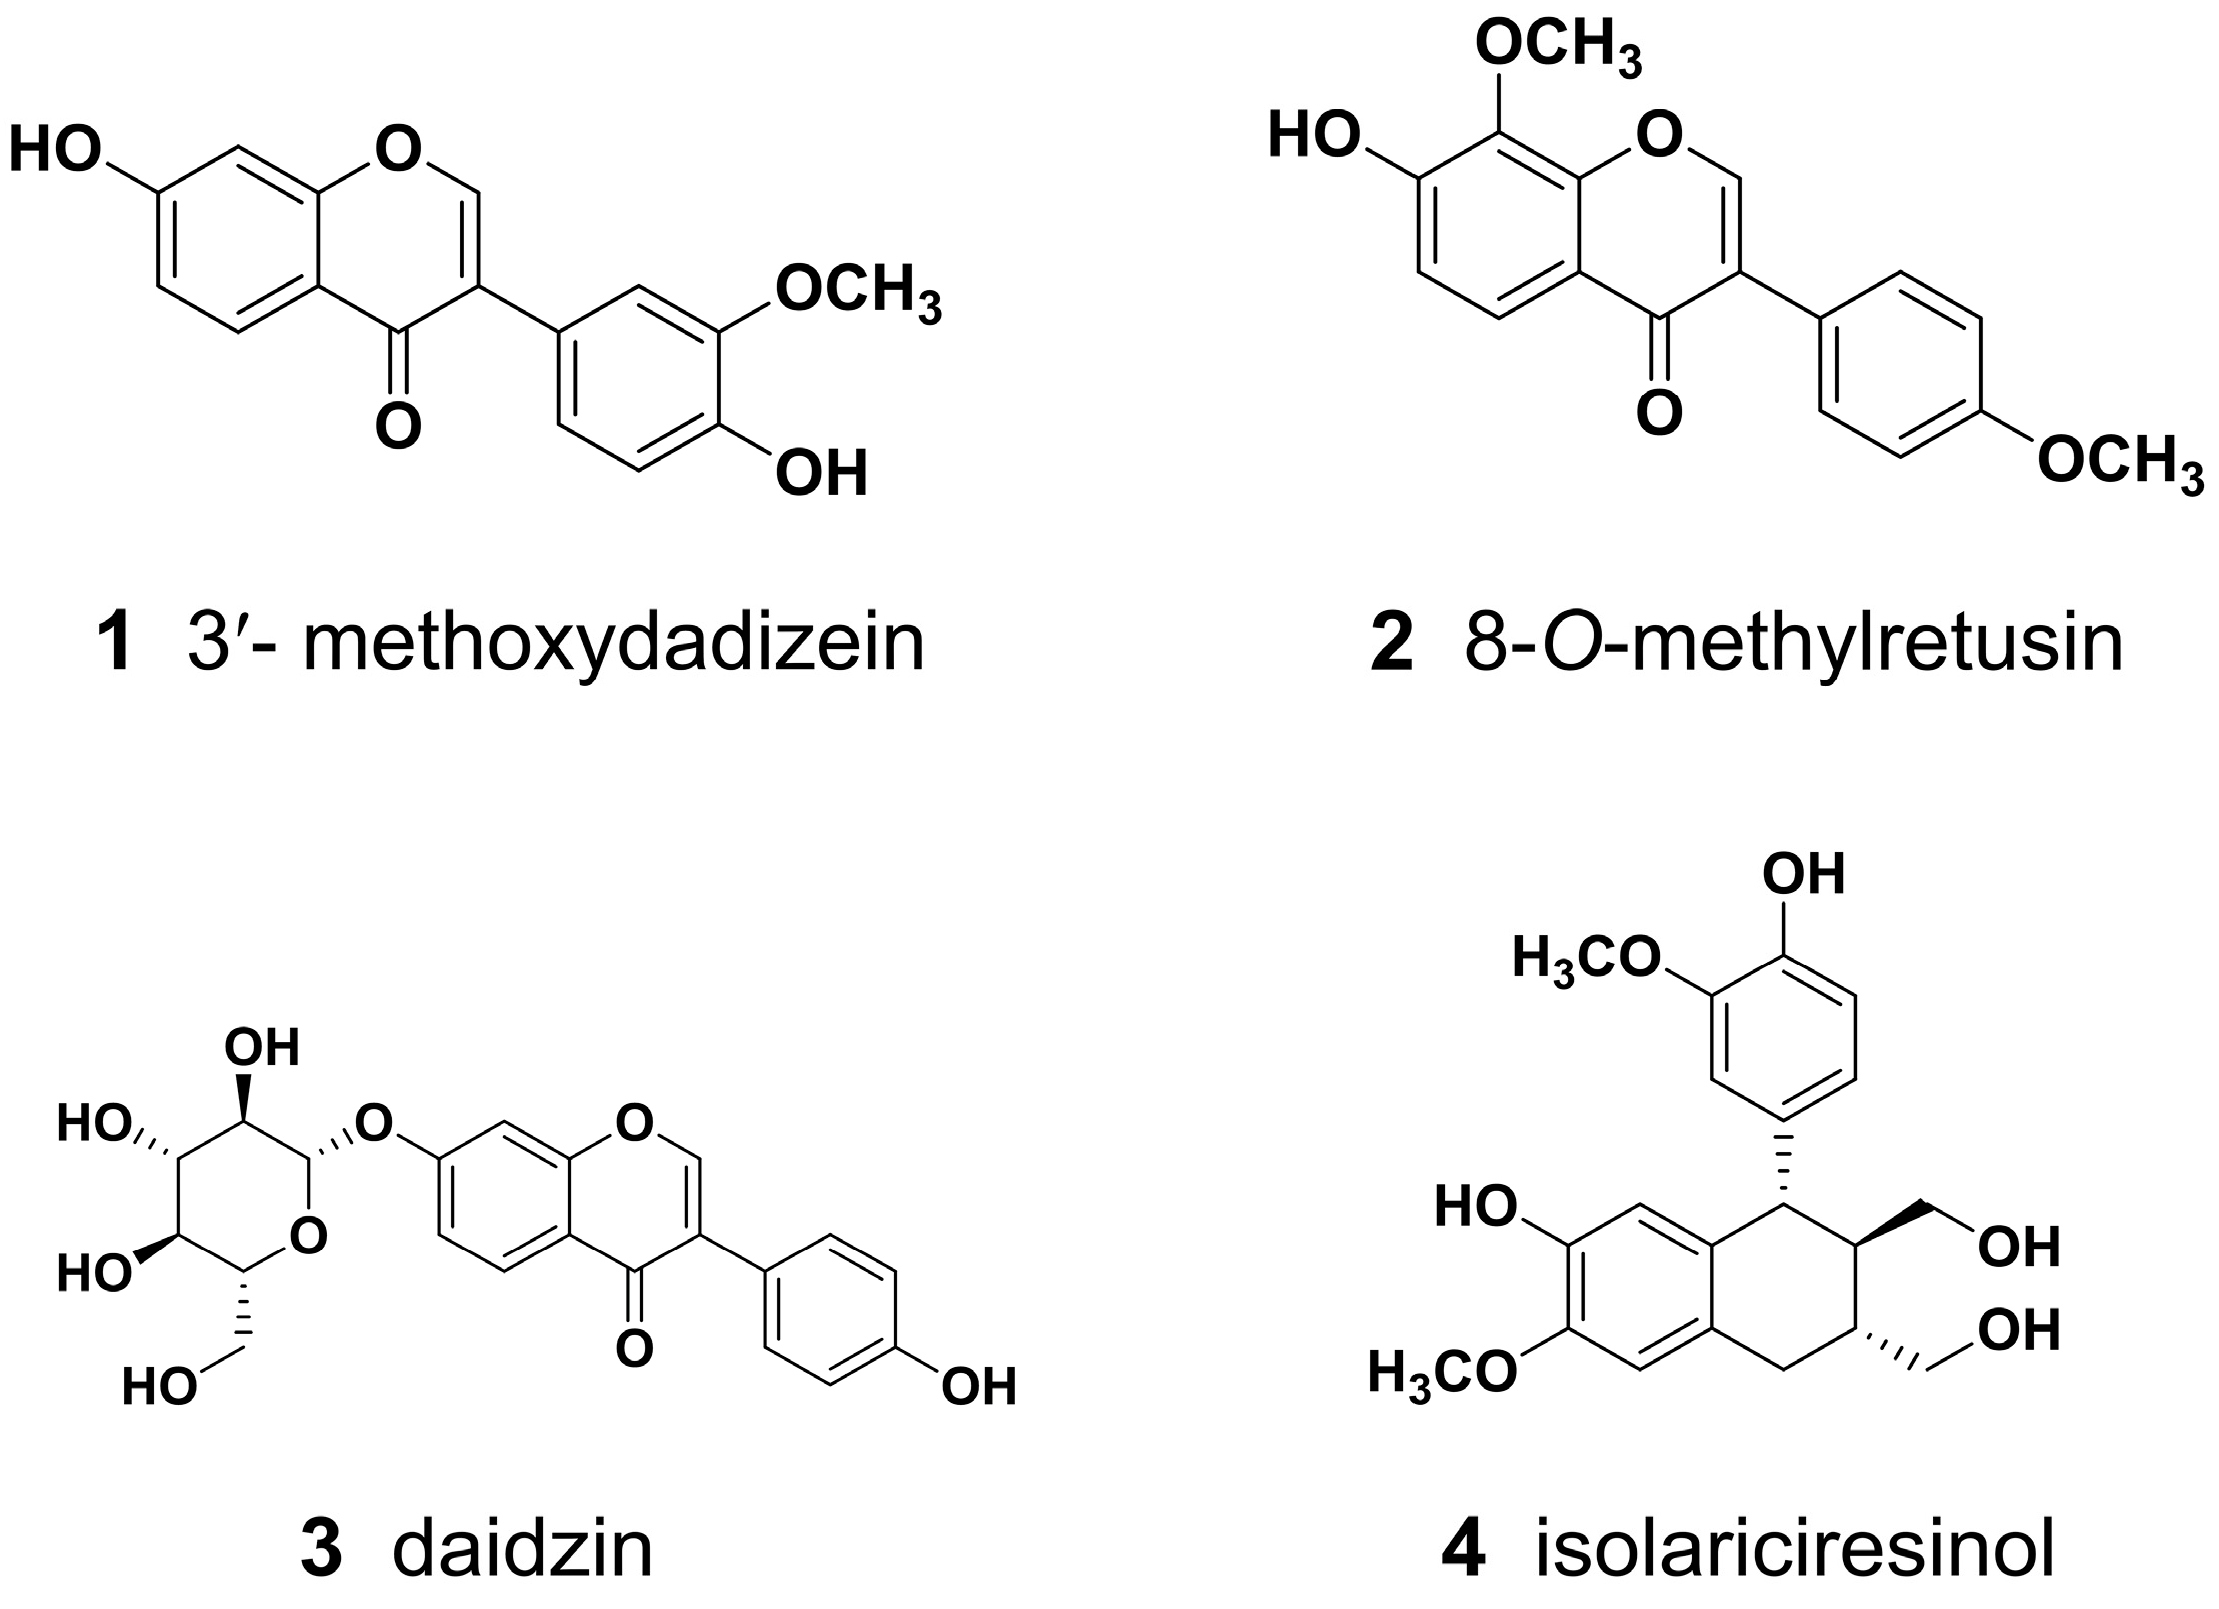
Figure 1. The four active constituents extracted from SPC.
Pharmaceuticals 17 01621 g001
Figure 2. The concentration-time curves of four constituents from SPC in rats (p.o.). observed and simulated by PBPK models. The observed and calculated concentration-time curves of 3′-methoxydadizein (A), 8-O-methylretusin (B), daidzin (C), and isolariciresinol (D), respectively (Mean ± SD, n = 5).
Pharmaceuticals 17 01621 g002
Figure 3. Correlation between observed and calculated values of four constituents in rats by gavage SPC. Correlation between observed and calculated values of 3′-methoxydadizein (A), 8-O-methylretusin (B), daidzin (C), and isolariciresinol (D), respectively. Note: The hollow circles represent the intersection of the two values; the solid line represents a linear regression.
Pharmaceuticals 17 01621 g003
Figure 4. Sensitivity analysis curves of four constituents in humans. The sensitivity of the absorption amount and AUC0→t of 3′-methoxydadizein (A), 8-O-methylretusin (B), daidzin (C), and isolariciresinol (D) to changes in particle size of constituents, Papp, Solubility, Log D, CLLiver, Rbp, and fup.
Pharmaceuticals 17 01621 g004
Figure 5. The concentration-time curves at different doses of four constituents in rats by p.o. simulated by PBPK models. The simulated concentration-time curves at different doses of 3′-methoxydadizein (A), 8-O-methylretusin (B), daidzin (C), and isolariciresinol (D).
Pharmaceuticals 17 01621 g005
Figure 6. The multiple concentration-time curves of four constituents in rats by p.o. simulated by PBPK models. The simulated multiple concentration-time curves of 3′-methoxydadizein (A), 8-O-methylretusin (B), daidzin (C), and isolariciresinol (D).
Pharmaceuticals 17 01621 g006
Figure 7. The concentration-time curves of four constituents from SPC in rats (60 g crude drug/kg body weight by p.o.). validated and simulated by PBPK models. The validated and simulated concentration-time curves at twice doses of 3′-methoxydadizein (A), 8-O-methylretusin (B), daidzin (C), and isolariciresinol (D) (Mean ± SD, n = 5).
Pharmaceuticals 17 01621 g007
Figure 8. Correlation between calculated and validated values of constituents 14 in rats by gavage 60 g crude drug/kg bodyweight of SPC. Correlation between calculated and validated values of 3′-methoxydadizein (A), 8-O-methylretusin (B), daidzin (C), and isolariciresinol (D). Note: the hollow circles represent the intersection of the two values; the solid line represents a linear regression.
Pharmaceuticals 17 01621 g008
Figure 9. The plasma concentration-time curves of four constituents in humans by p.o. simulated by PBPK models. The simulated concentration-time curves in humans of 3′-methoxydadizein (A), 8-O-methylretusin (B), daidzin (C), and isolariciresinol (D).
Pharmaceuticals 17 01621 g009
Figure 10. The physiological pharmacokinetic processes of the four constituents of SPC in rats by oral administration.
Pharmaceuticals 17 01621 g010
Table 1. The physicochemical and biochemical parameters of active constituents 14.
Parameters1234Source
MW284.27298.30416.38360.41ChemDraw 21.0
Log P2.6762.8050.5411.591ADMET Predictor
pKa8.5108.8309.6509.370ADMET Predictor
Log D2.6402.8500.5602.020GastroPlus
Solubility
(mg/mL)
0.0205
(pH 6.32)
0.0108
(pH 6.60)
0.720
(pH 6.40)
0.201
(pH 6.17)
GastroPlus
Papp (×10−5 cm/s)0.2202.4800.4000.220Our study [24,25]
Rbp,rat0.9150.8751.0440.830ADMET Predictor
Rbp,human0.8070.7770.7440.787ADMET Predictor
fup,rat8.40311.81639.93331.535ADMET Predictor
fup,human7.3947.0717.89116.139ADMET Predictor
CLrat (L/h)2.7861.9064.6697.152GastroPlus
Vssrat (L)54.7305.86017.3617.03GastroPlus
Table 2. The Kp values of constituents 14 from SPC in different rat tissues.
Kp1234
Lung0.452.420.481.25
Adipose0.076.840.152.23
Muscle0.391.190.360.70
Liver0.372.050.371.04
Spleen0.391.140.390.69
Heart0.401.670.430.92
Brain1.604.730.442.11
Kidney0.731.920.421.02
Skin1.092.720.471.35
ReproOrg0.411.930.431.02
RedMarrow0.332.510.311.17
YellowMarrow0.076.840.152.23
Rest of body0.421.160.400.71
Table 3. Comparisons of Obs. and Calc. values of four constituents from SPC in rats.
ConstituentsParametersCmax
(μg/mL)
Tmax
(h)
AUC0t
(μg∙h/mL)
AUC0
(μg∙h/mL)
1Obs.0.00390.420.00840.0090
Calc.0.00340.640.00920.0097
FE1.151.521.101.08
2Obs.0.01360.250.00970.0115
Calc.0.01300.200.01440.0146
FE1.051.251.481.27
3Obs.0.01510.210.02840.0305
Calc.0.01670.320.01960.0200
FE1.111.521.451.52
4Obs.0.02620.310.03470.0383
Calc.0.02470.320.03950.0403
FE1.061.031.141.05
Table 4. Comparisons of Calc. and Val. values of four constituents in rats at twice the oral dose of SPC.
ConstituentsParametersCmax
(μg/mL)
Tmax
(h)
AUC0t
(μg∙h/mL)
AUC0
(μg∙h/mL)
1Calc.0.00680.640.01830.0193
Val.0.00720.550.01910.0200
FE1.061.161.041.04
2Calc.0.02570.200.02880.0292
Val.0.02530.250.01530.0155
FE1.021.251.881.88
3Calc.0.03340.320.03930.0400
Val.0.02720.250.03550.0359
FE1.231.281.111.11
4Calc.0.04940.320.07910.0805
Val.0.04170.300.05570.0593
FE1.161.201.421.36
Table 5. The predicted parameters in humans of four constituents from SPC.
ConstituentsCmax
(μg/mL)
Tmax
(h)
AUC0t
(μg∙h/mL)
AUC0
(μg∙h/mL)
10.15785.761.6356.650
20.08520.8000.2862.145
31.8491.6811.63913.130
40.96991.976.35913.601
Disclaimer/Publisher’s Note: The statements, opinions and data contained in all publications are solely those of the individual author(s) and contributor(s) and not of MDPI and/or the editor(s). MDPI and/or the editor(s) disclaim responsibility for any injury to people or property resulting from any ideas, methods, instructions or products referred to in the content.