
ANN-QSAR, Molecular Docking, ADMET Predictions, and Molecular Dynamics Studies of Isothiazole Derivatives to Design New and Selective Inhibitors of HCV Polymerase NS5B

 ,
, 
 , ,
, , 
Abstract

1. Introduction
2. Results and Discussion
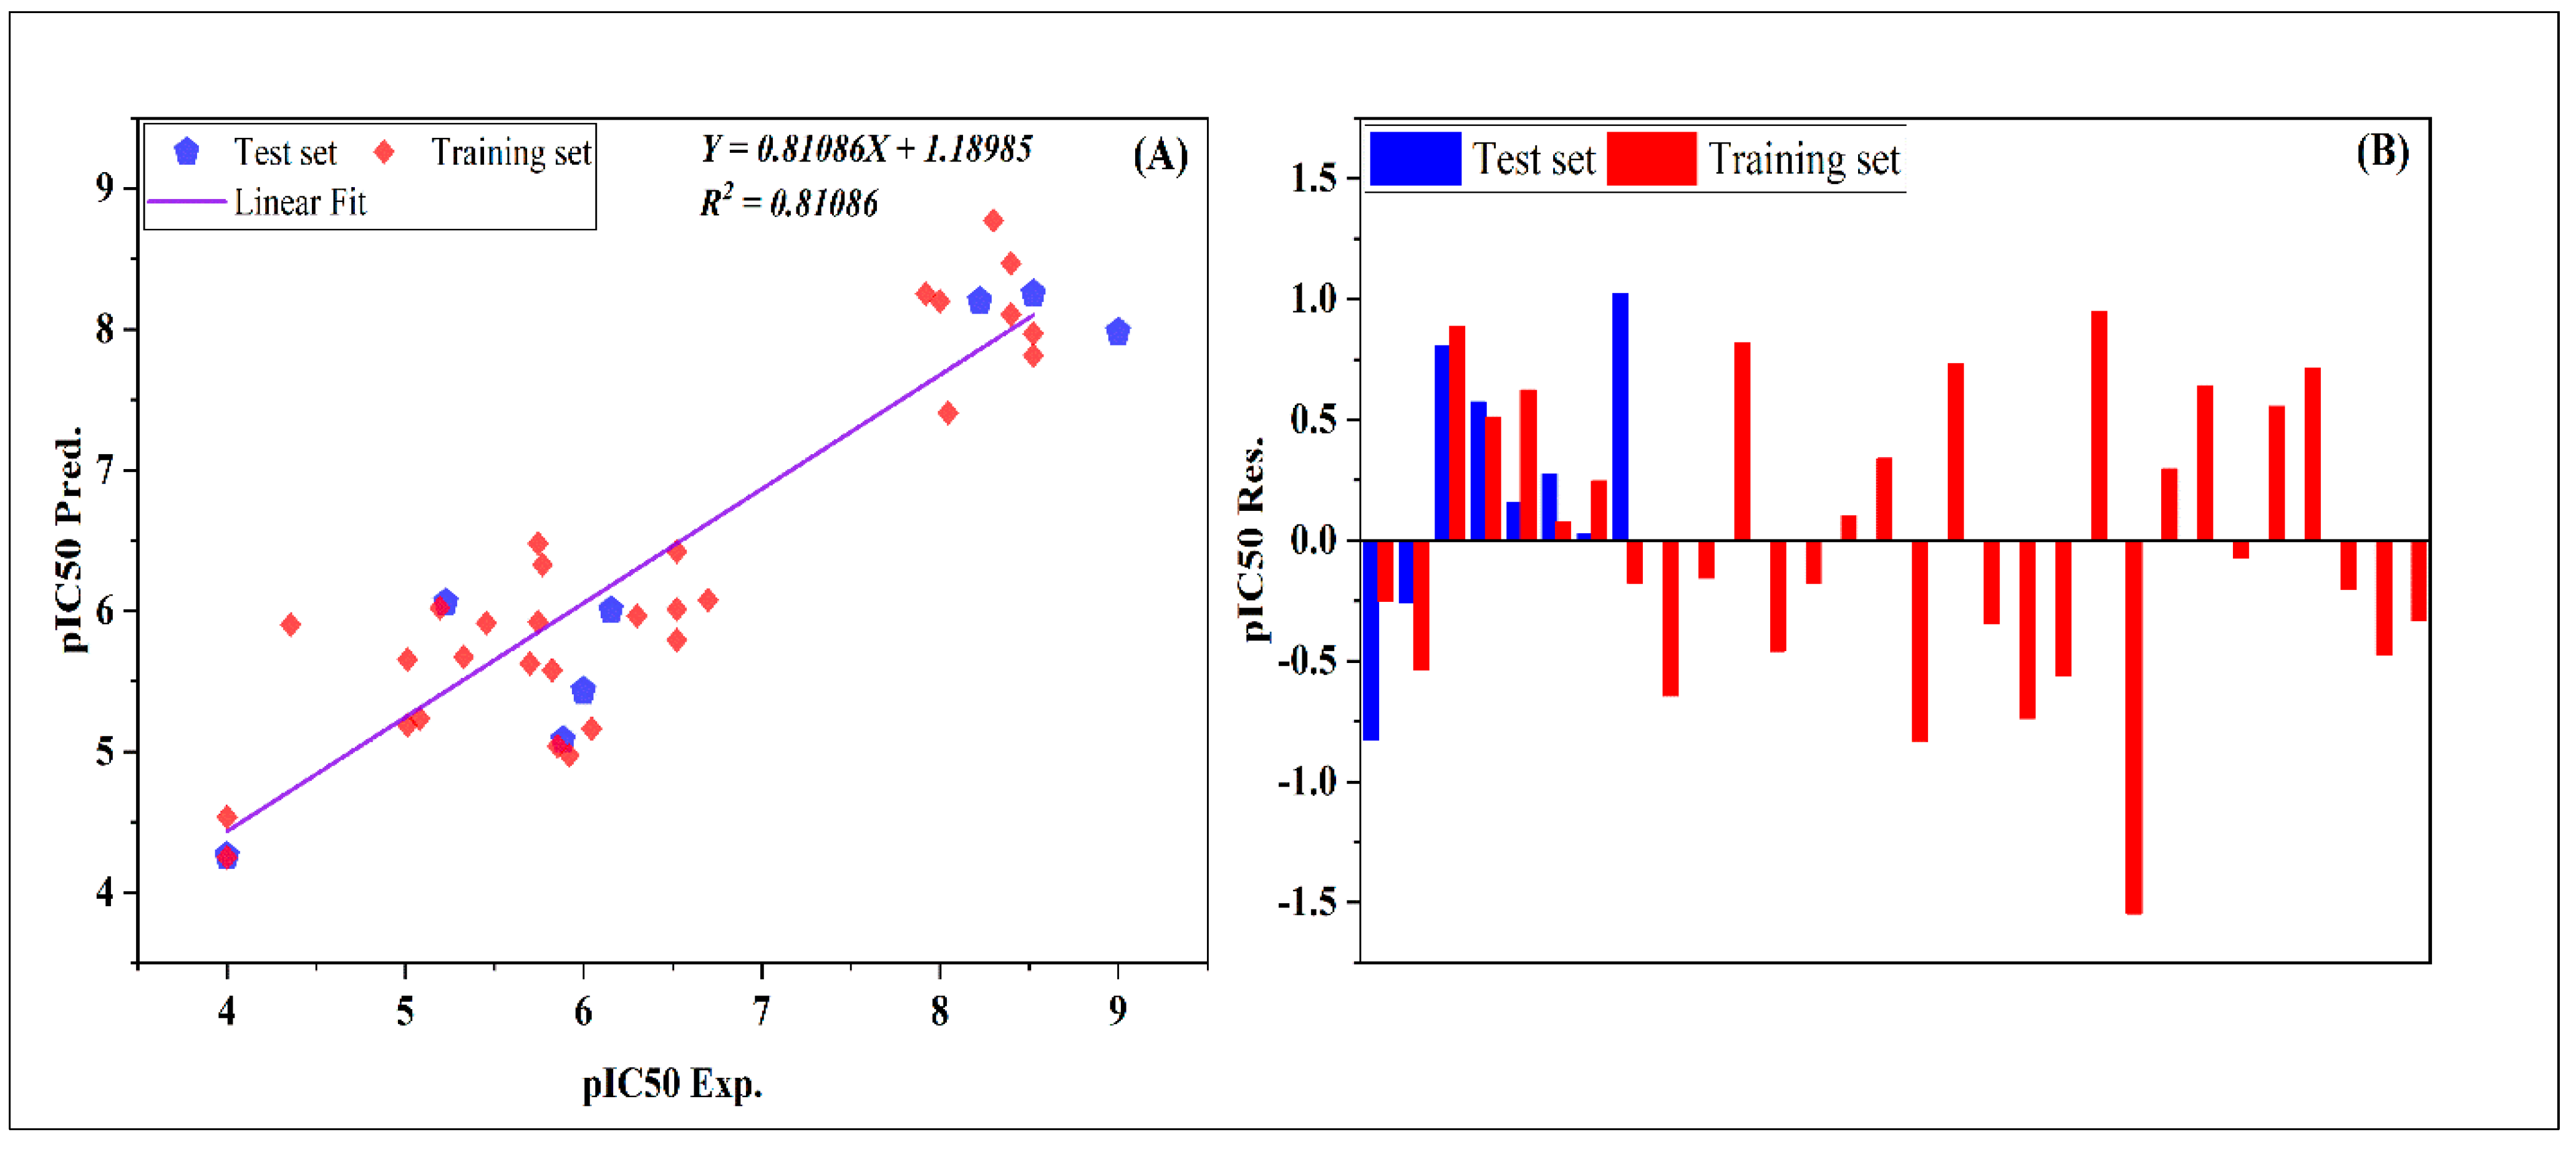
2.1. QSAR Modeling
2.2. Y-Randomization Test
2.3. The Standards of Golbraikh and Tropsha
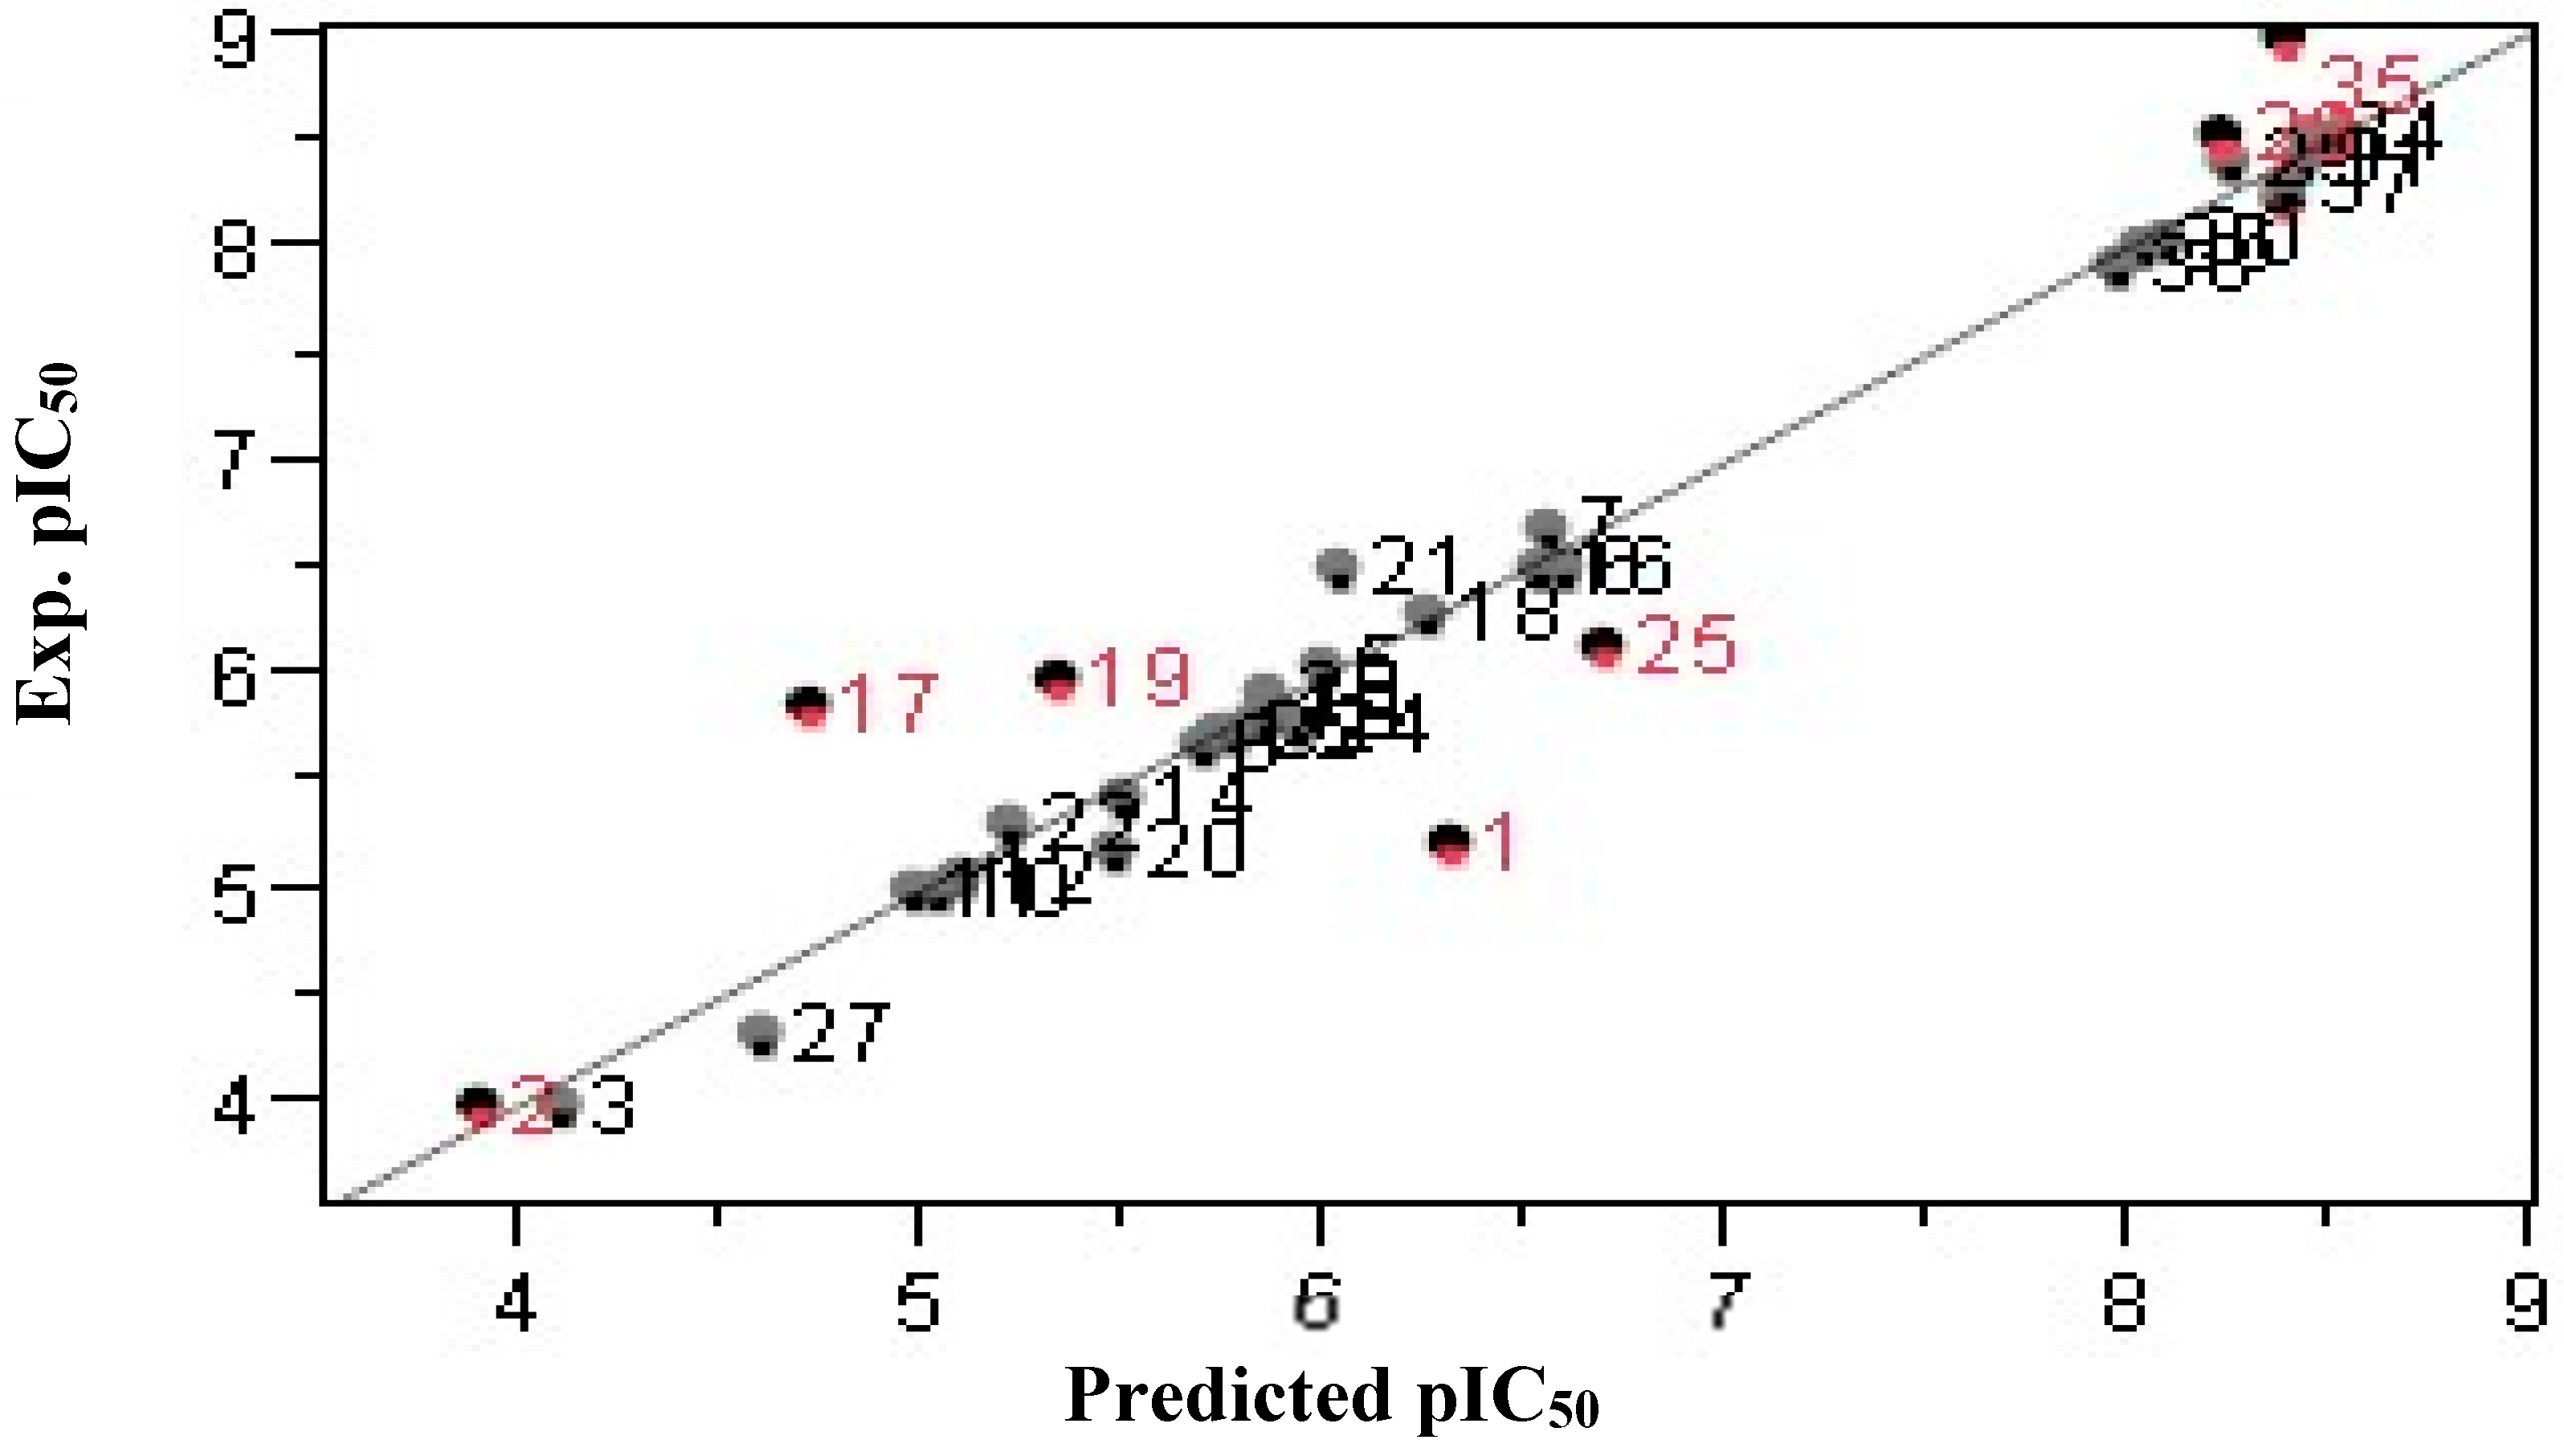
2.4. Artificial Neural Networks (ANNs)
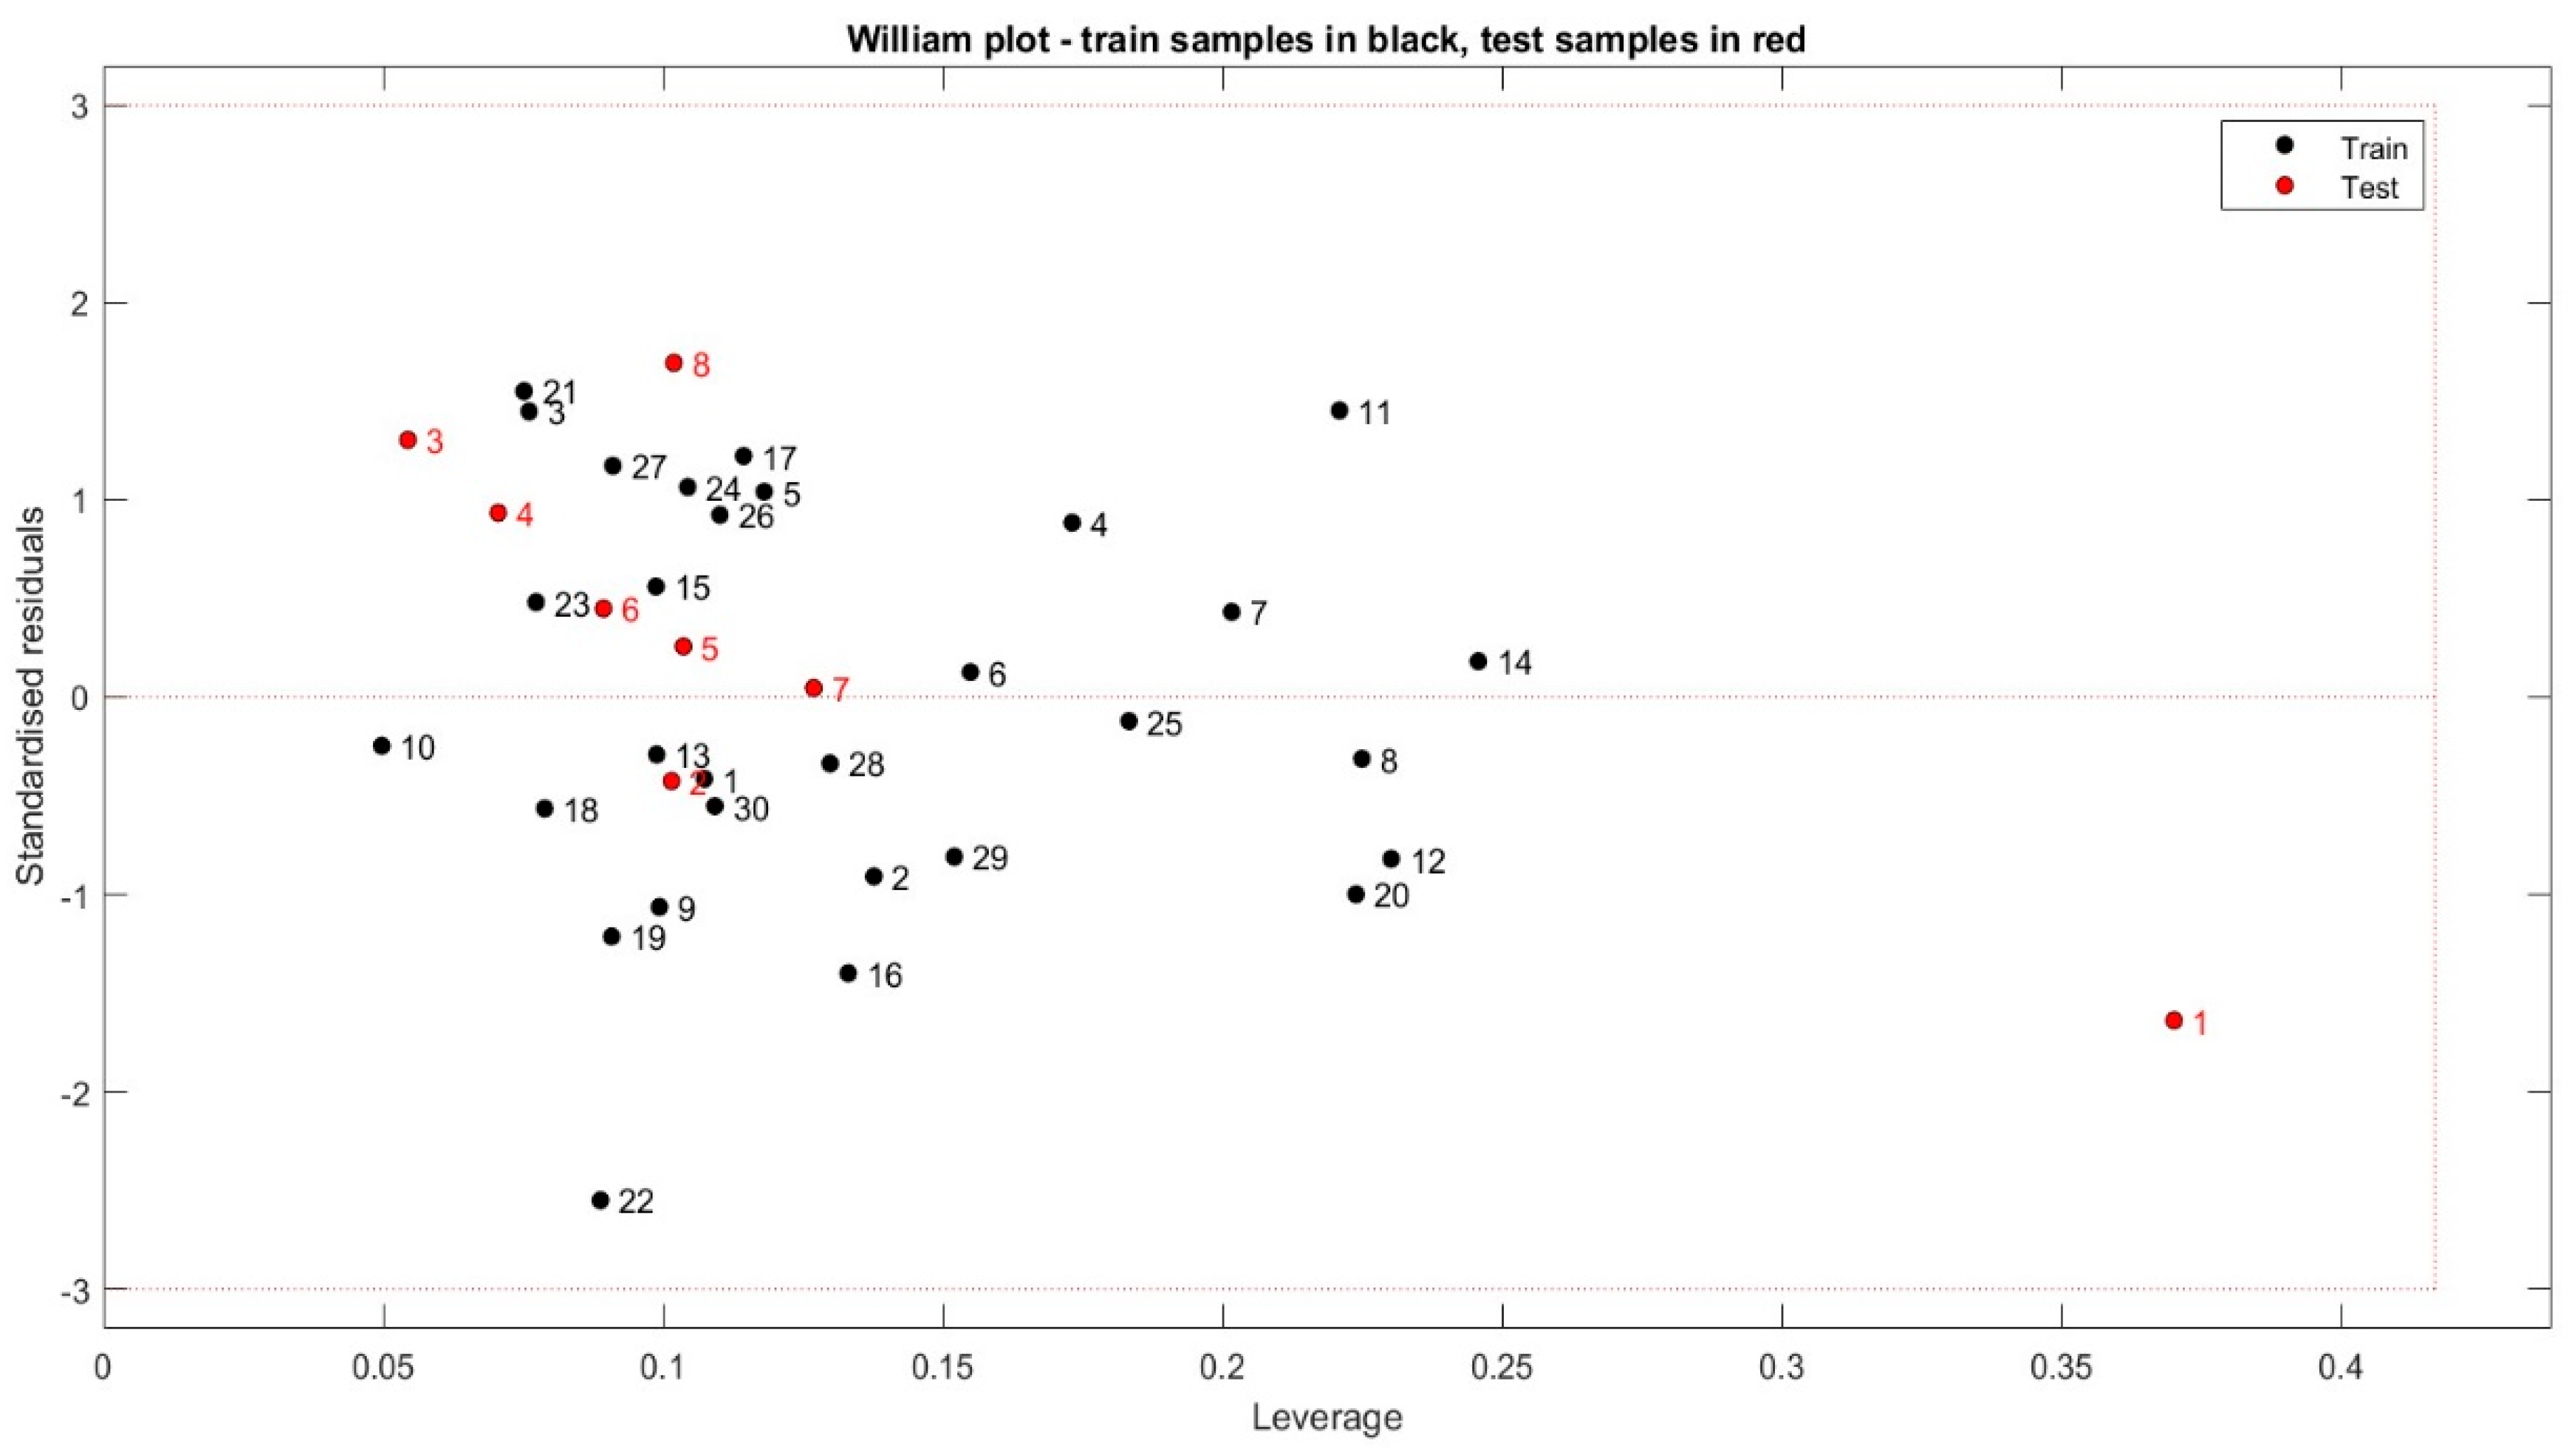
2.5. The Applicability Domain Approach
2.6. Design and Selection of New Isothiazole Derivatives
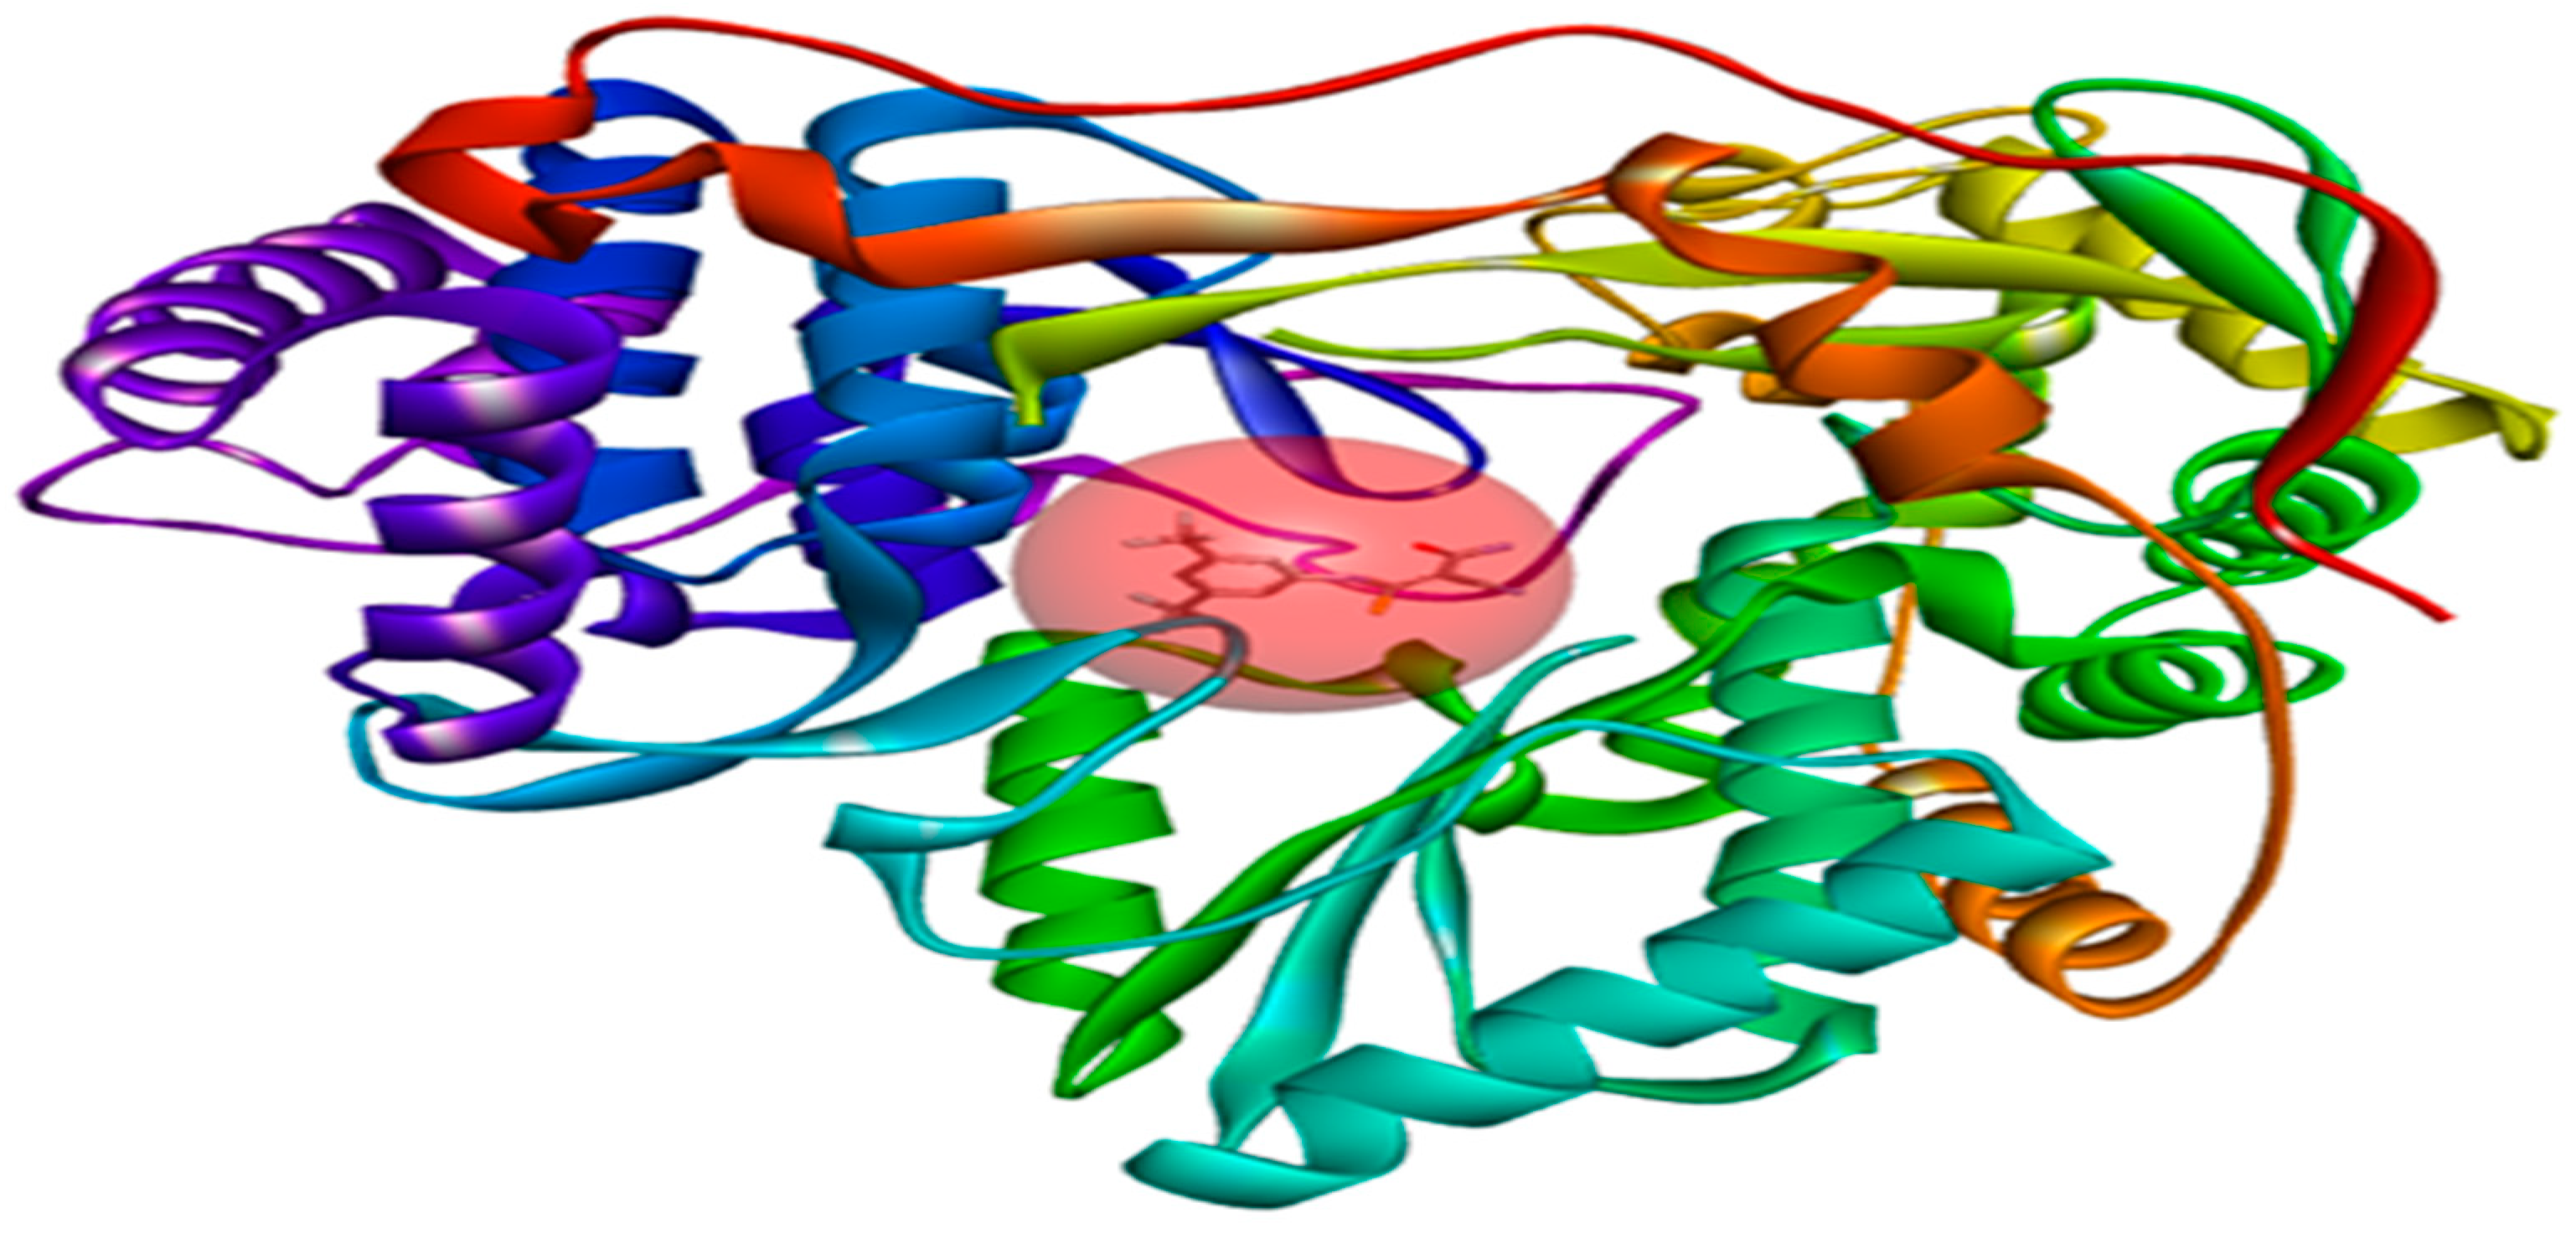
2.7. Docking Results
2.8. ADMET Investigation and Drug-likeness
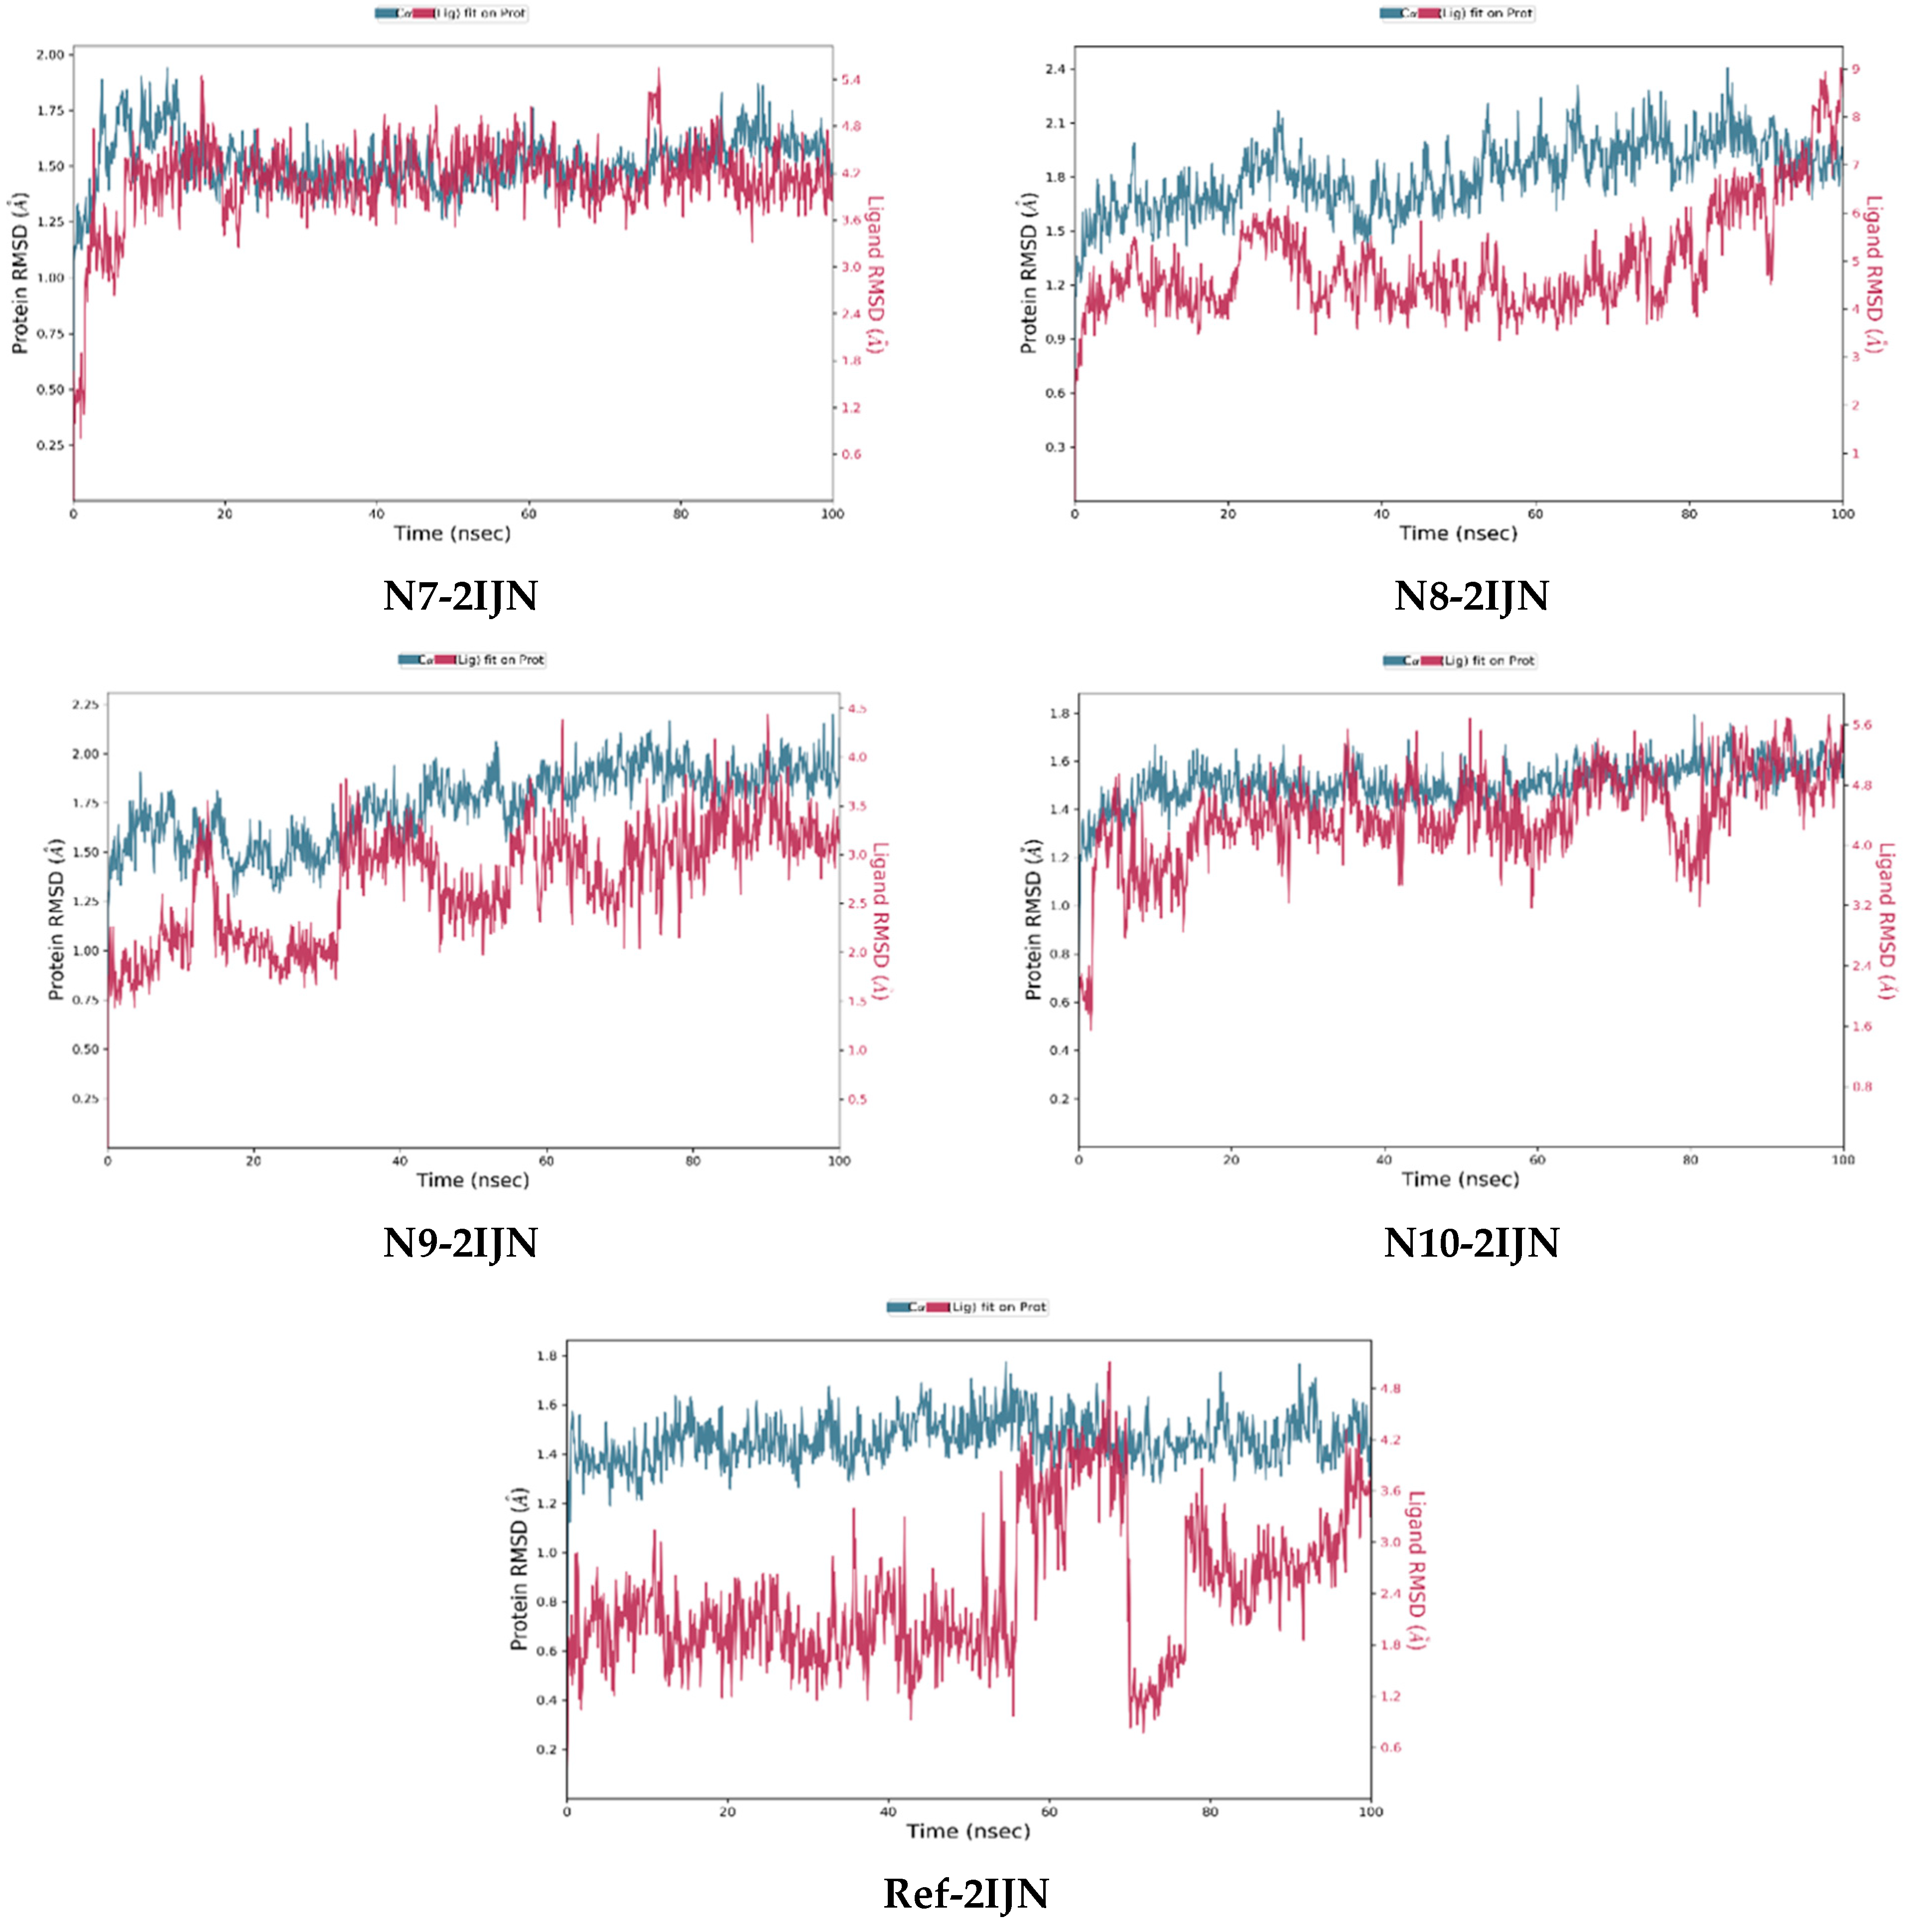
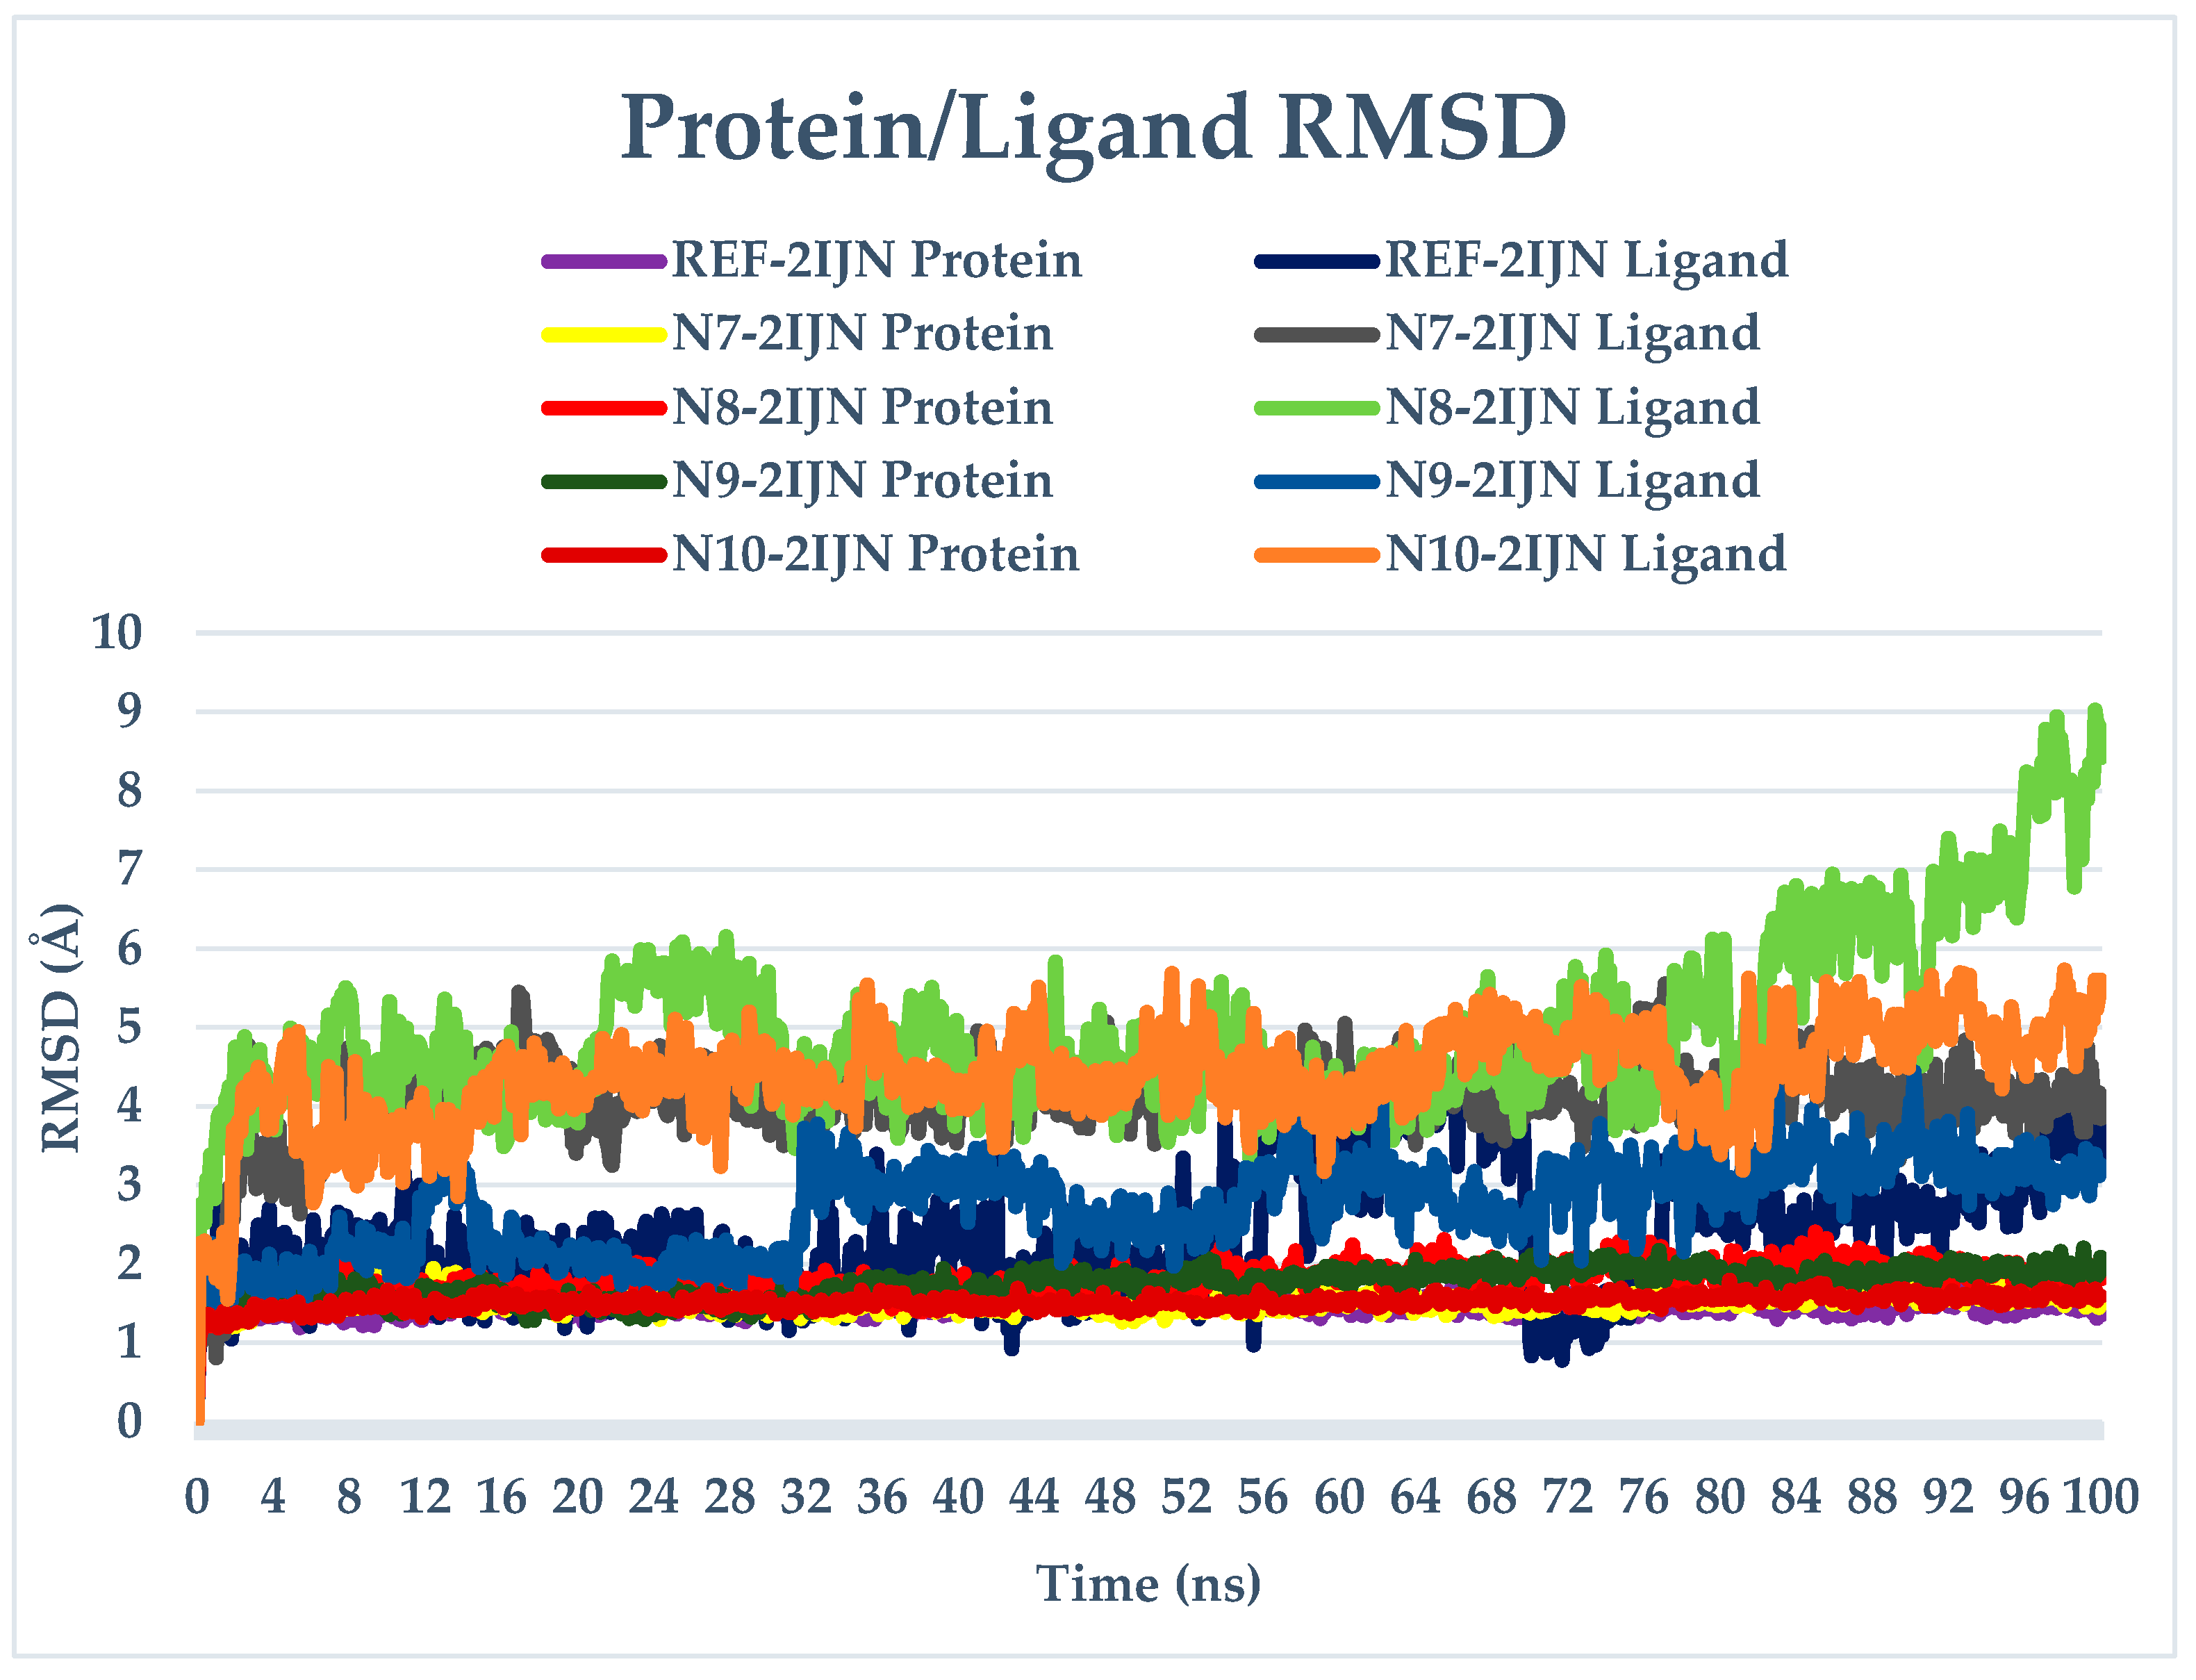
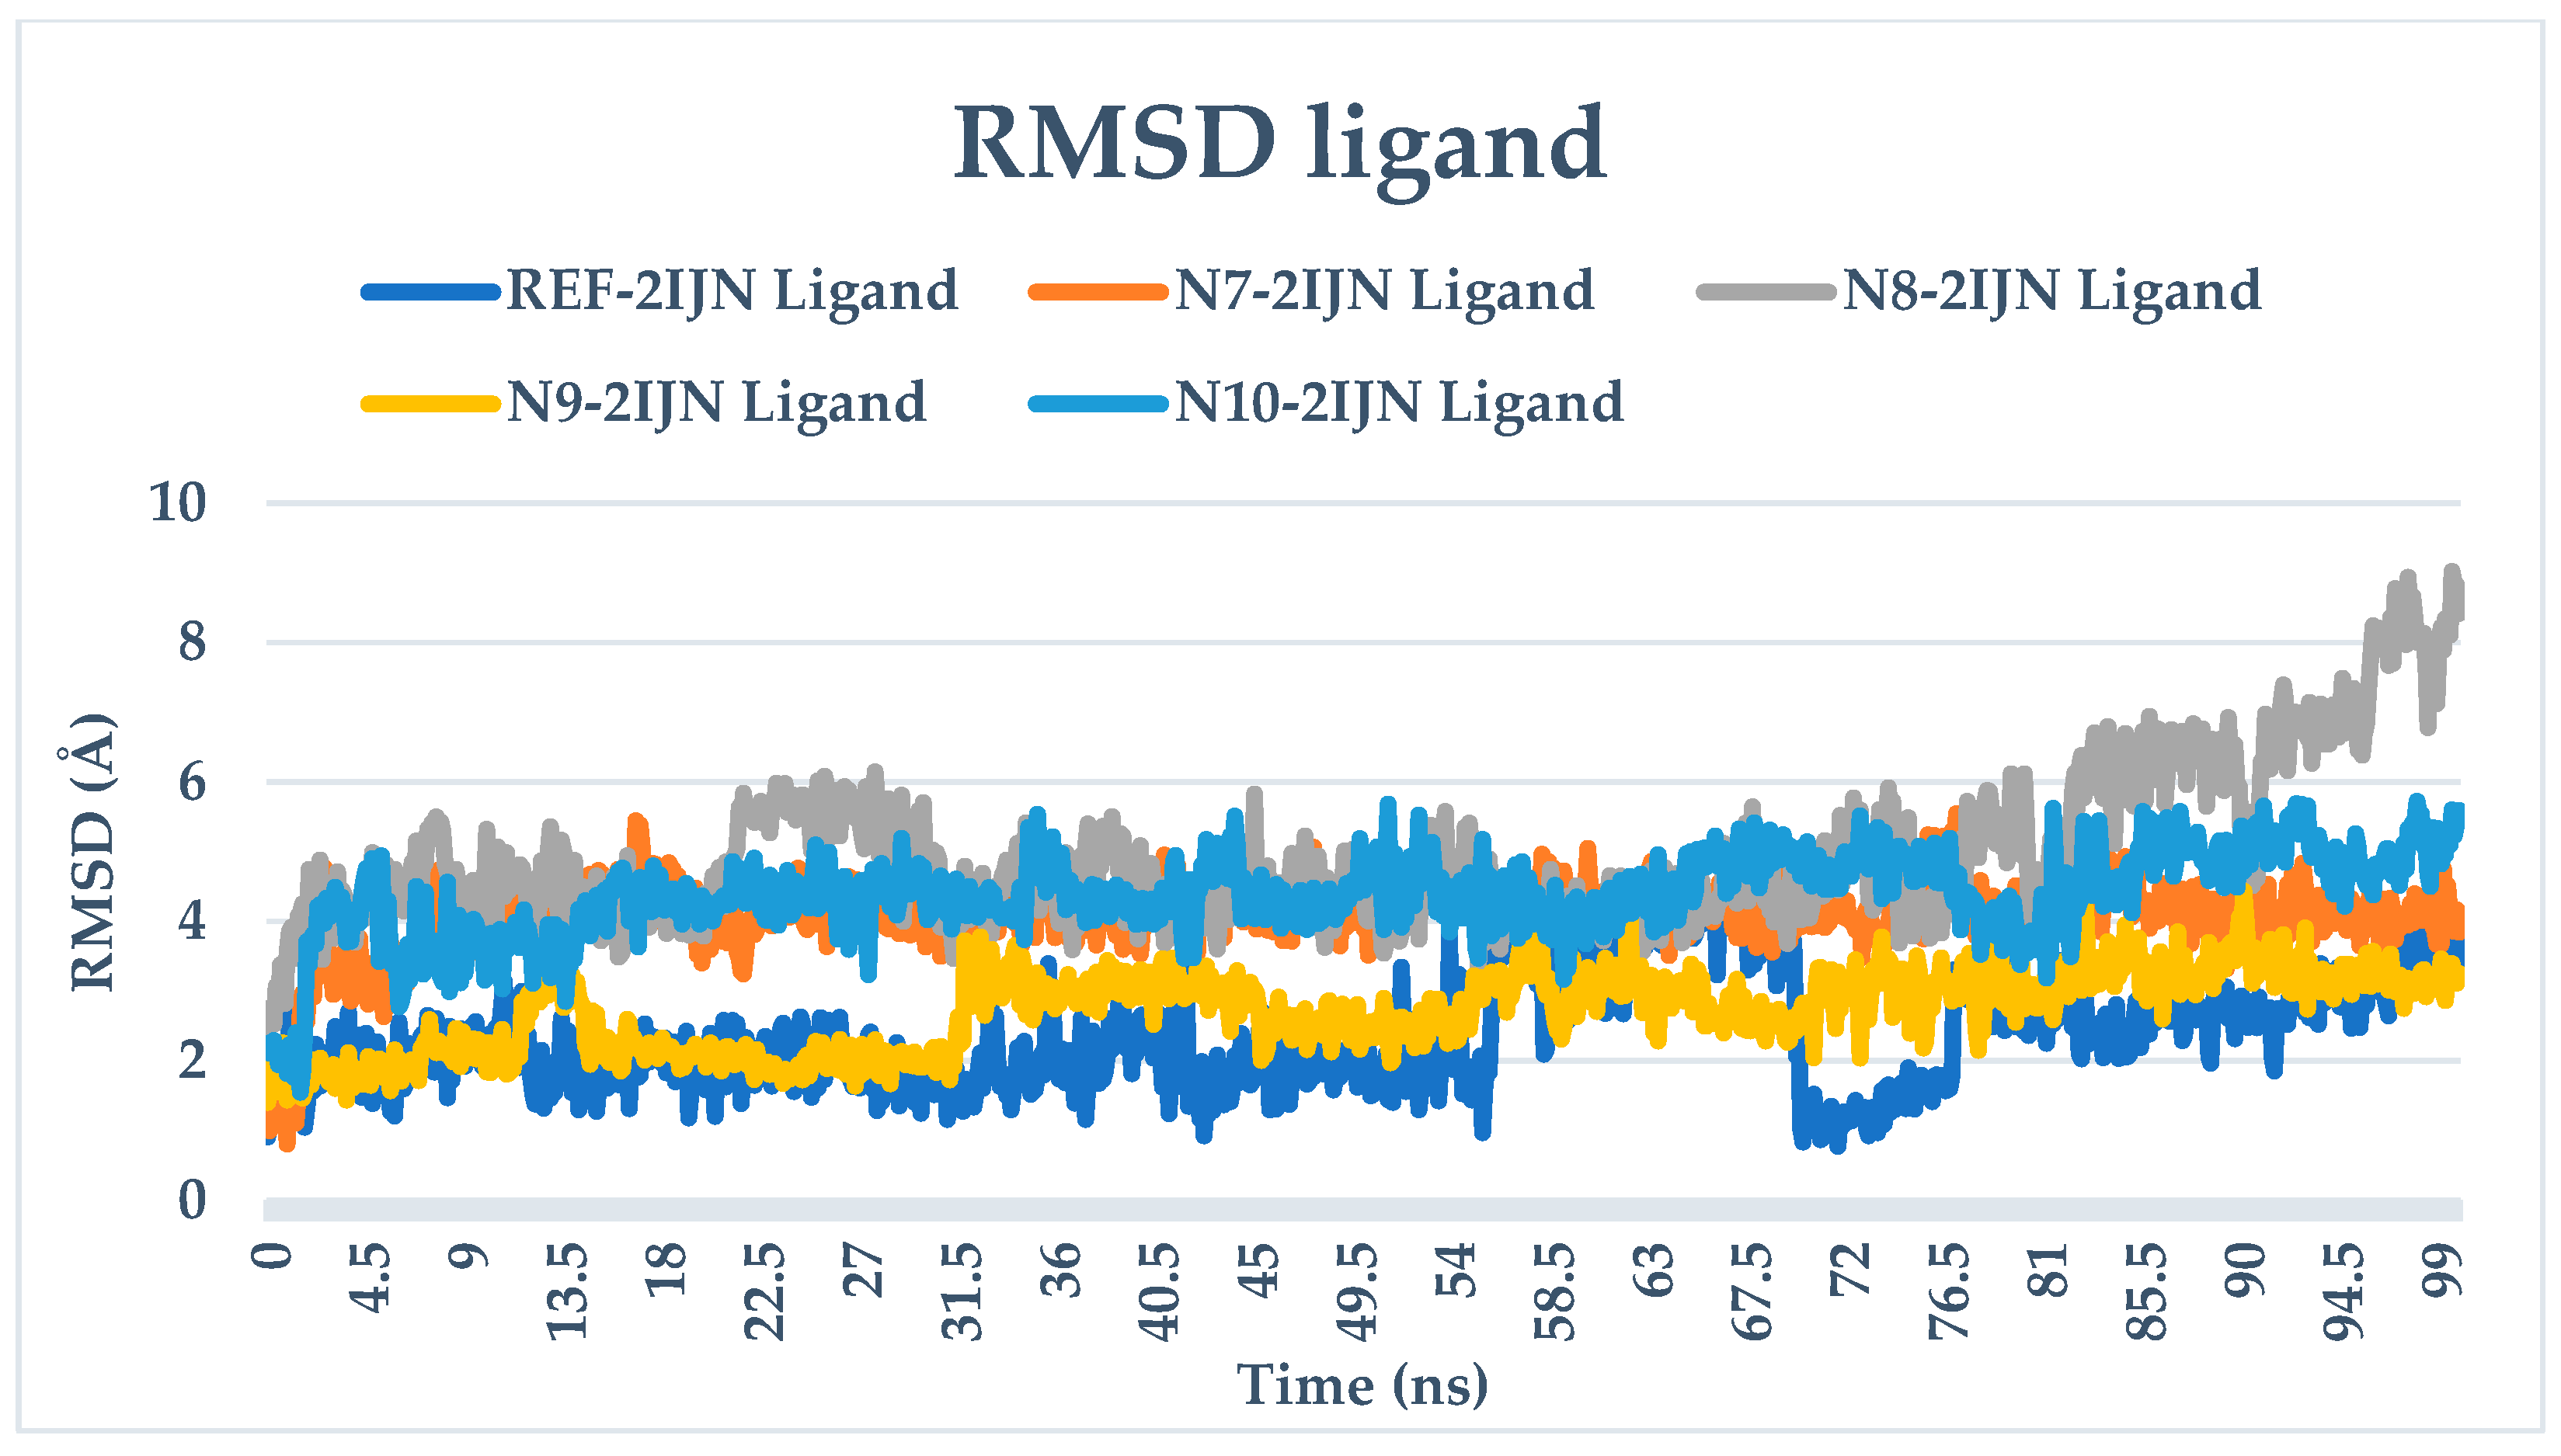
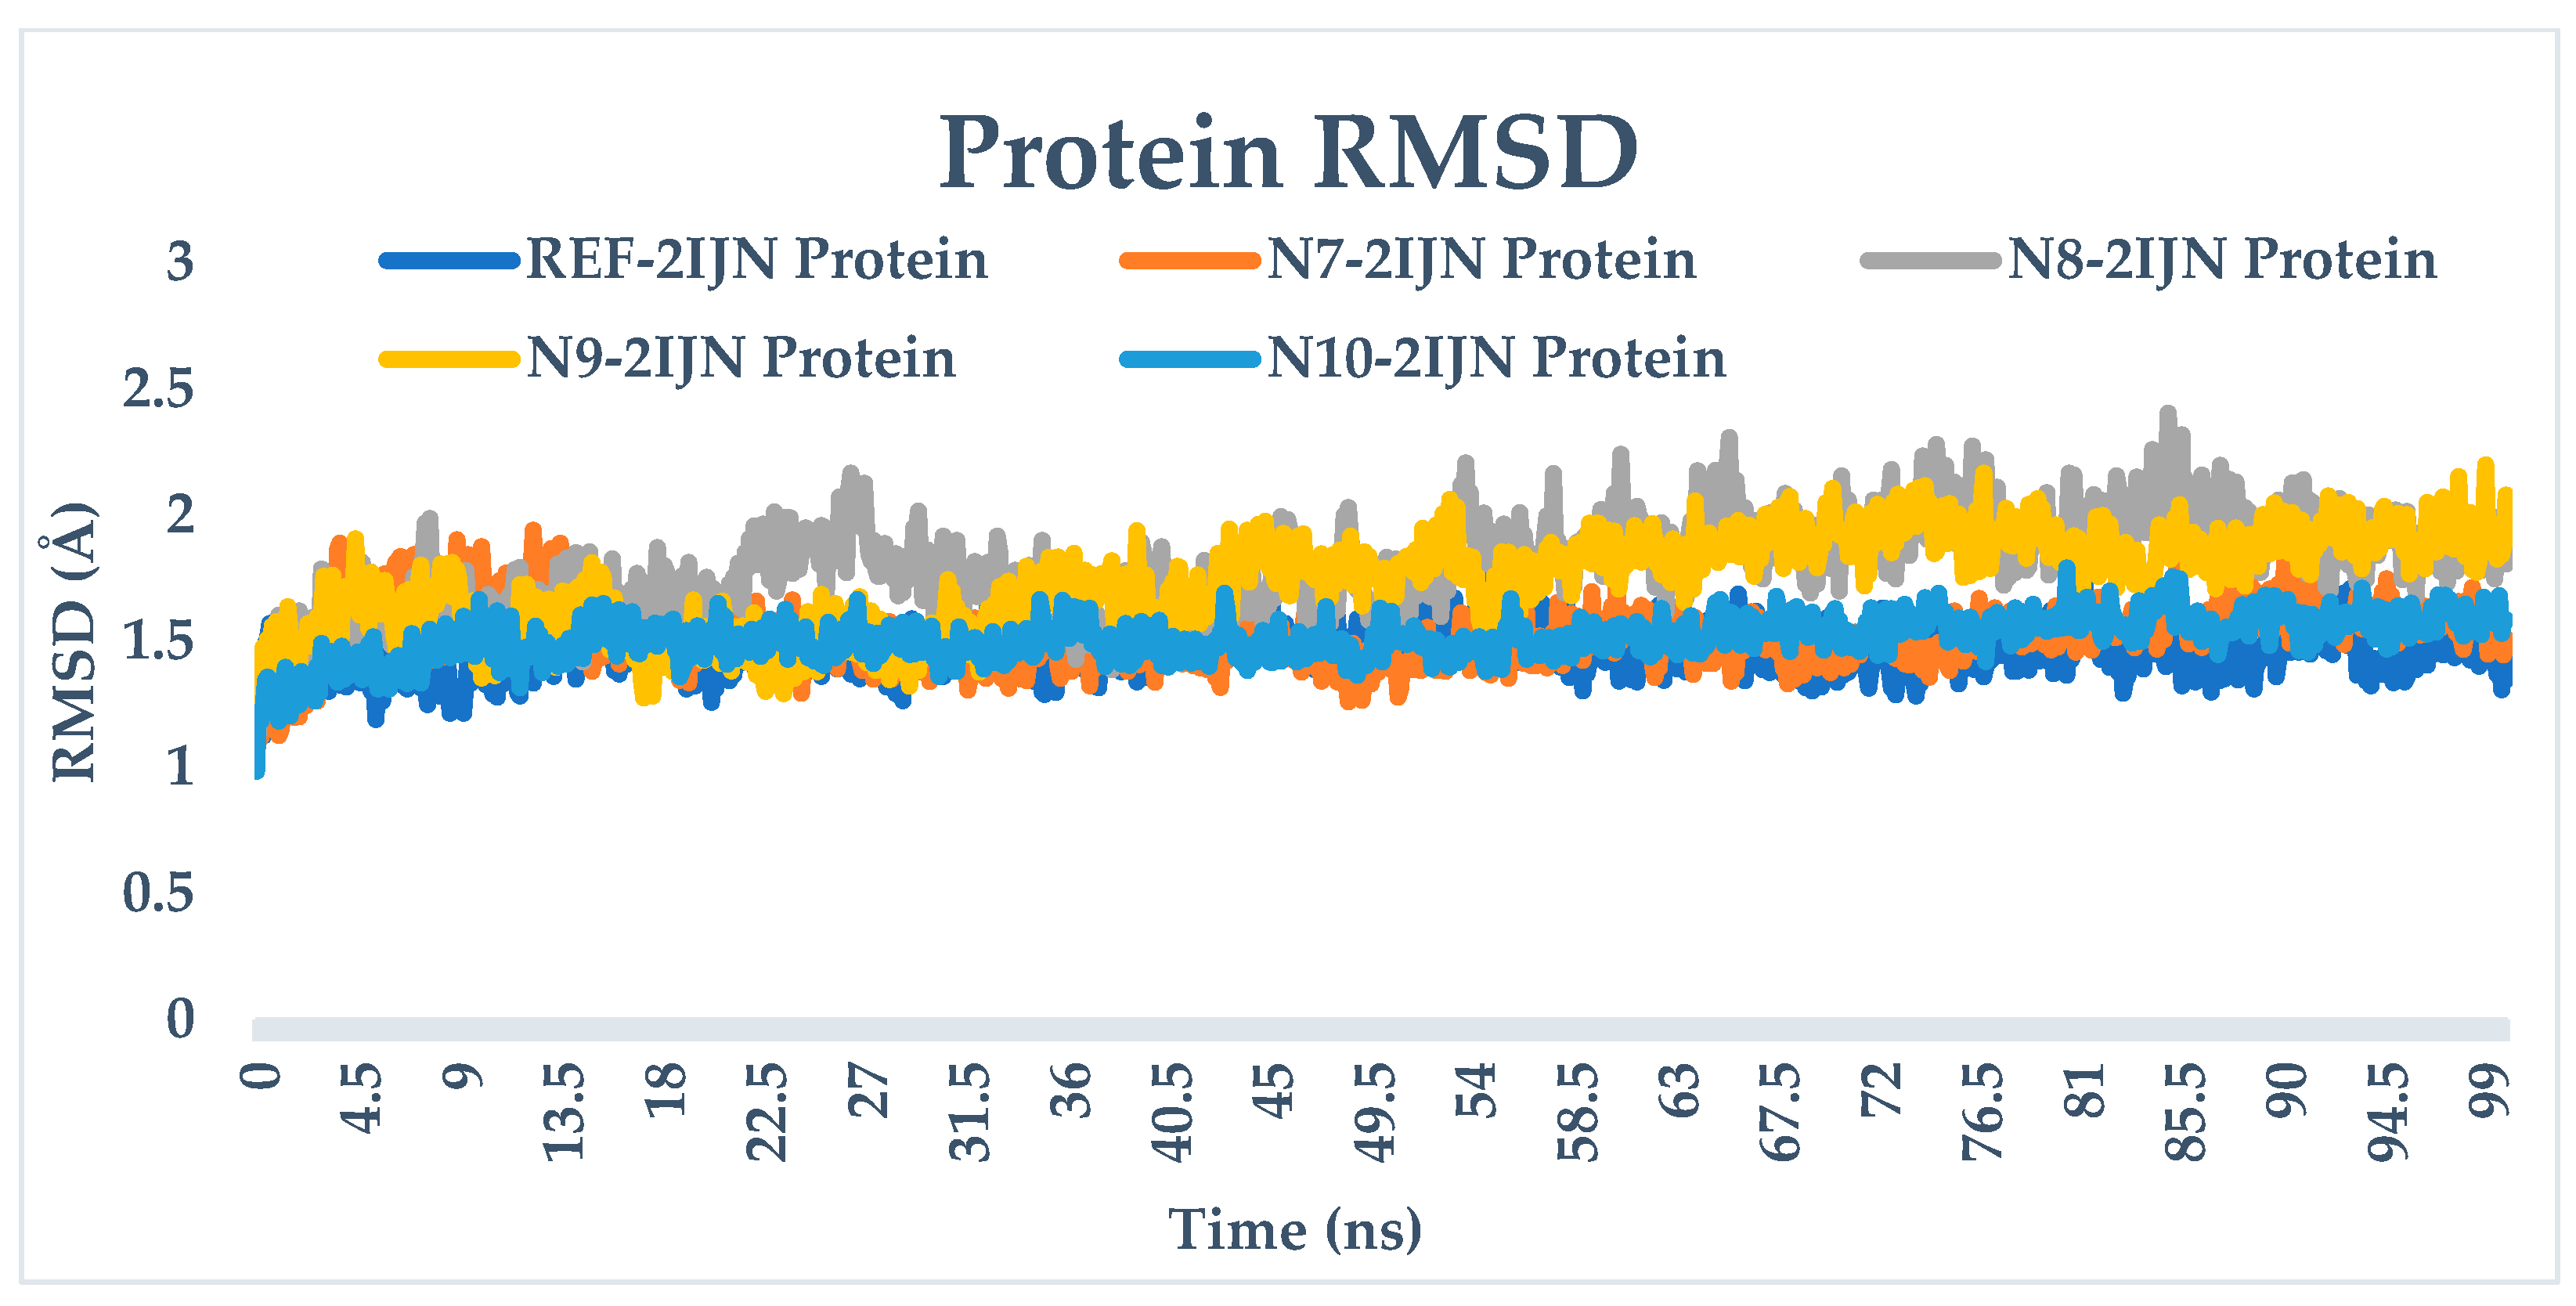
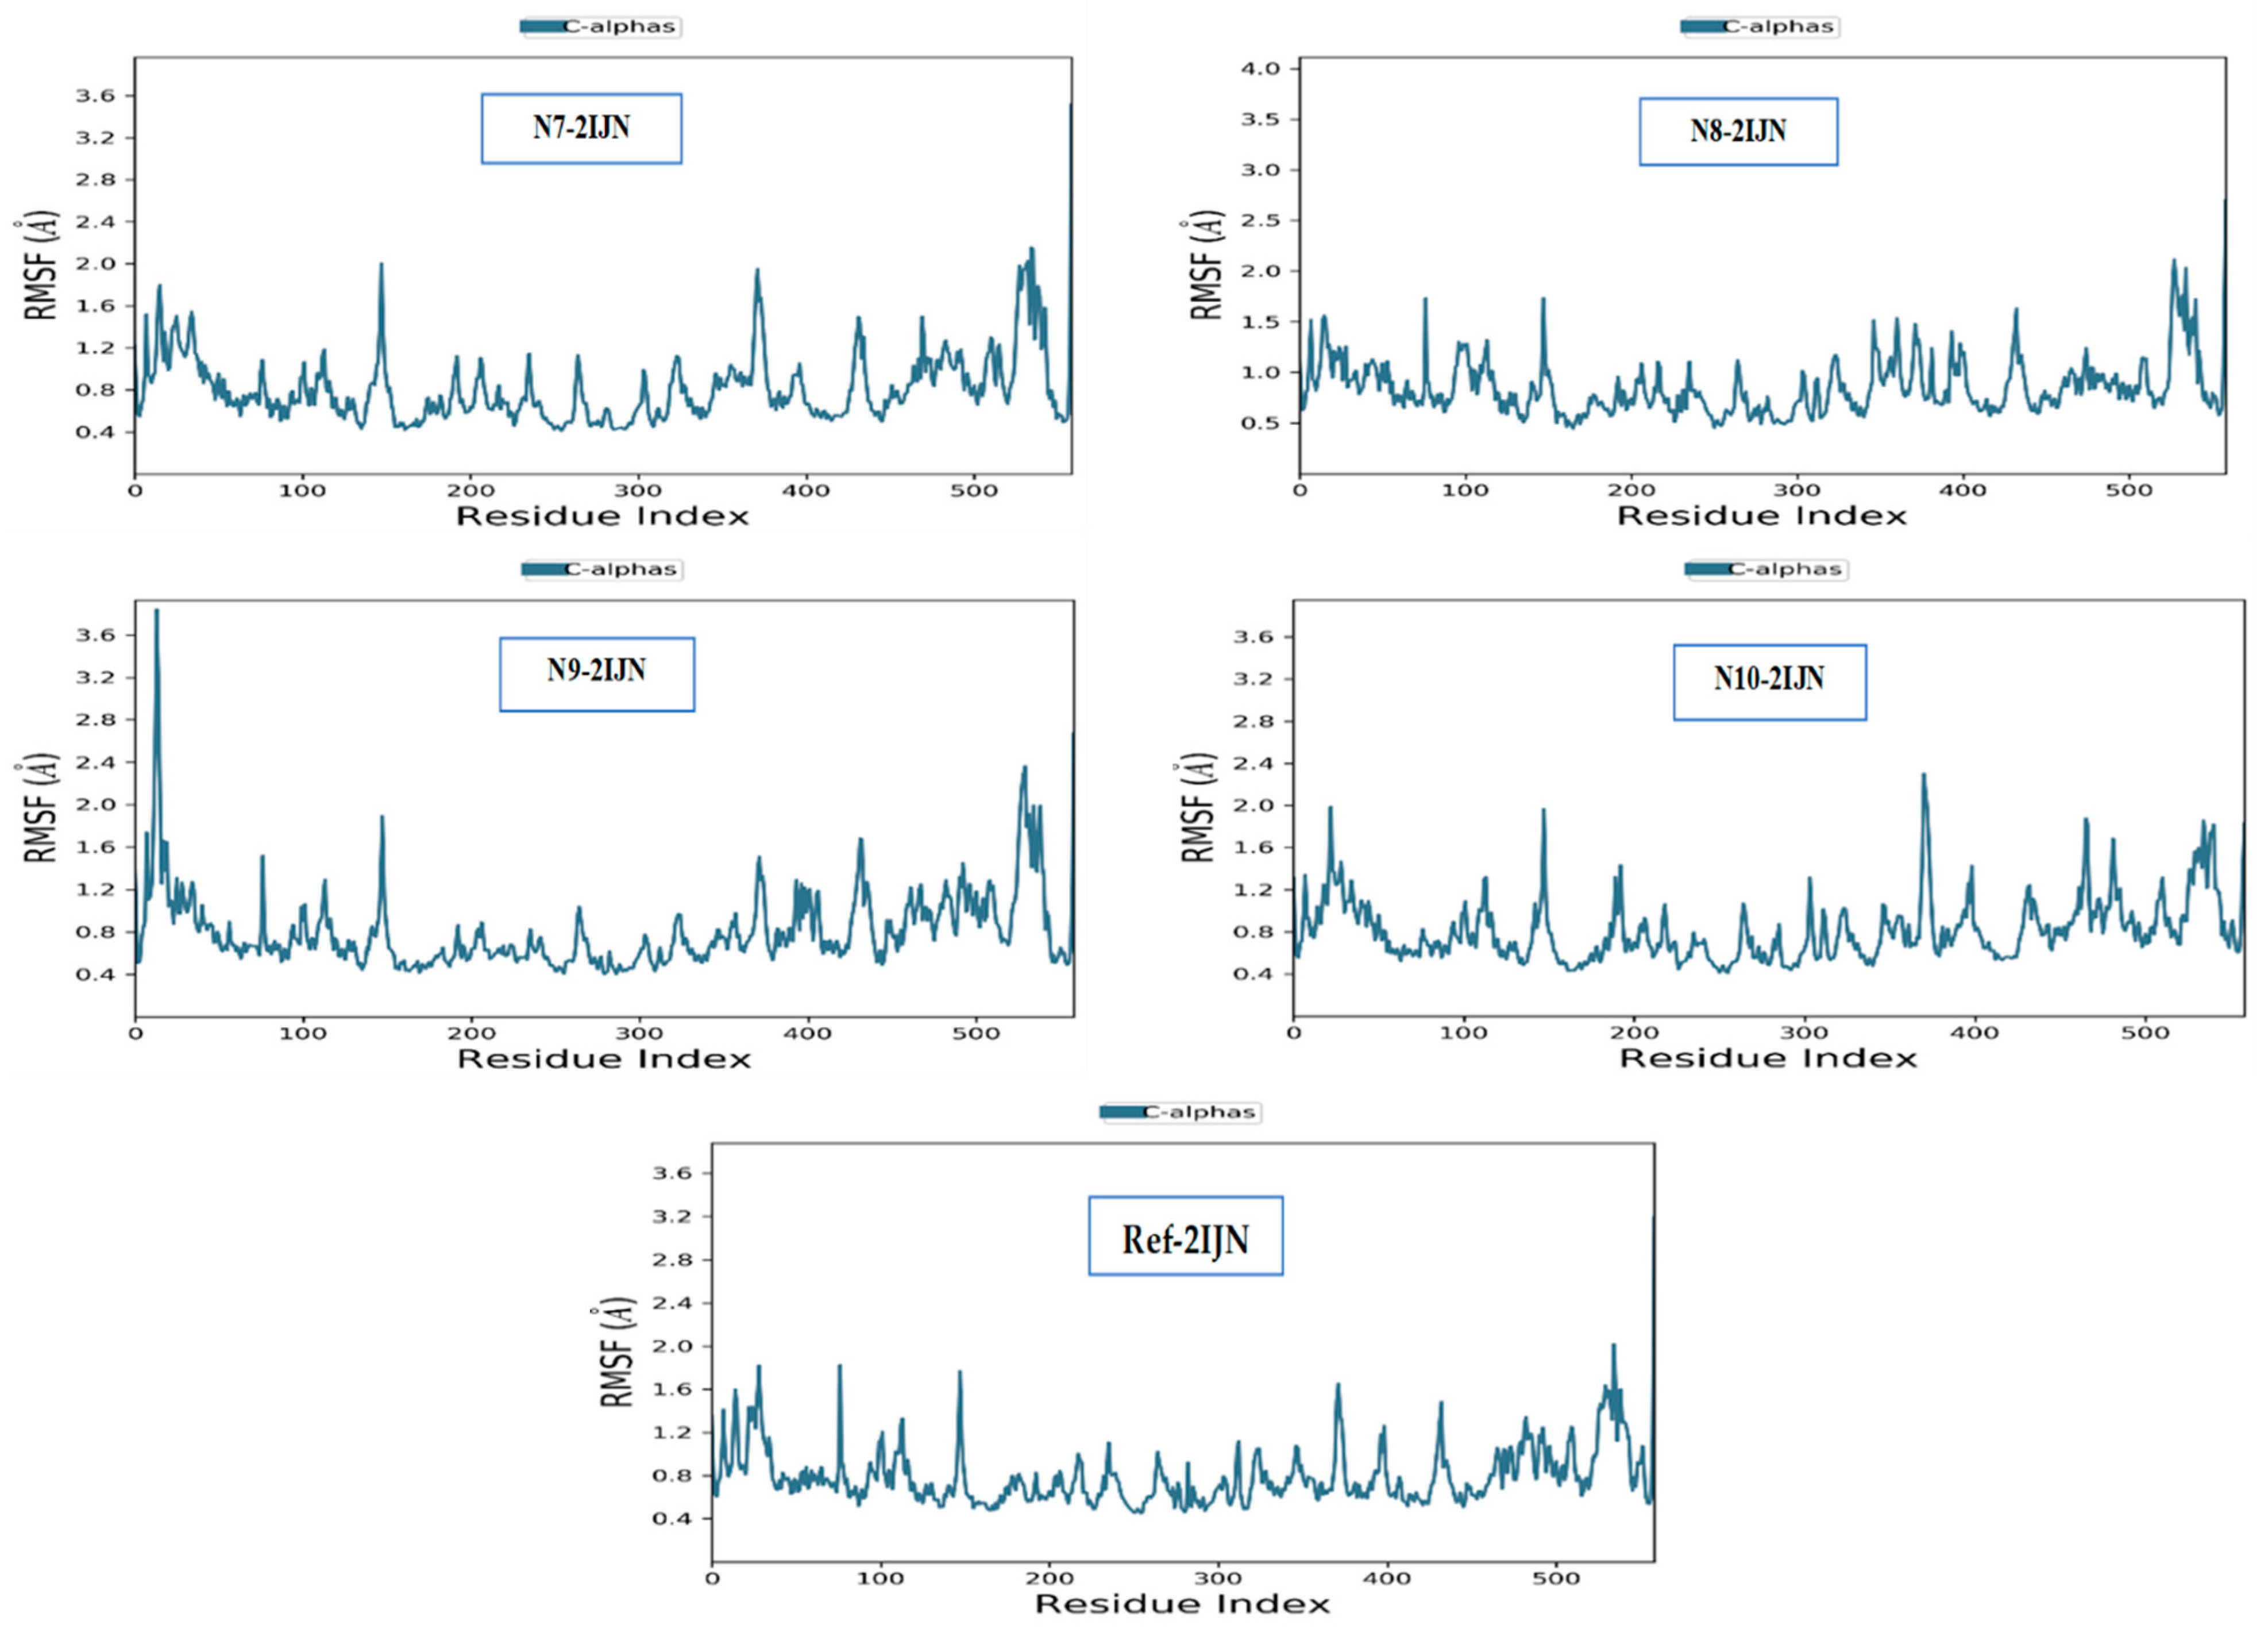
2.9. Dynamics Simulation
3. Methods and Materials
3.1. Information and Data Collection
3.2. Molecular Descriptors
3.3. QSAR Studies
- Pretreatment and division of the dataset
- Model development
3.4. The Applicability Domain Method
3.5. Molecular Docking Study
3.6. ADMET Properties and Drug-likeness
3.7. Molecular Dynamics Simulations
4. Conclusions
Supplementary Materials
Author Contributions
Funding
Institutional Review Board Statement
Informed Consent Statement
Data Availability Statement
Acknowledgments
Conflicts of Interest
References
- Adedotun, I.O.; Abdul-Hammed, M.; Hamzat, B.A.; Adepoju, A.J.; Akinboade, M.W.; Afolabi, T.I.; Ismail, U.T. Molecular docking, ADMET analysis, and bioactivity studies of phytochemicals from Phyllanthus niruri as potential inhibitors of hepatitis C virus NSB5 polymerase. J. Indian Chem. Soc. 2022, 99, 100321. [Google Scholar] [CrossRef]
- Calland, N.; Dubuisson, J.; Rouillé, Y.; Séron, K. Hepatitis C virus and natural compounds: A new antiviral approach? Viruses 2012, 4, 2197–2217. [Google Scholar] [CrossRef]
- Aloui, M.; Er-rajy, M.; Imtara, H.; Goudzal, A.; Zarougui, S.; El fadili, M.; Arthur, D.E.; Mothana, R.A.; Noman, O.M.; Tarayrah, M.; et al. QSAR modelling, molecular docking, molecular dynamic and ADMET prediction of pyrrolopyrimidine derivatives as novel Bruton’s tyrosine kinase (BTK) inhibitors. Saudi Pharm. J. 2024, 32, 101911. [Google Scholar] [CrossRef]
- Ejeh, S.; Uzairu, A.; Shallangwa, G.A.; Abechi, S.E.; Ibrahim, M.T.; Ramu, R. Cheminformatics study of some indole compounds through QSAR modeling, ADME prediction, molecular docking, and molecular dynamic simulation to identify novel inhibitors of HCV NS5B proteas. J. Indian Chem. Soc. 2023, 100, 100955. [Google Scholar] [CrossRef]
- Yan, S.; Appleby, T.; Gunic, E.; Shim, J.H.; Tasu, T.; Kim, H.; Rong, F.; Chen, H.; Hamatake, R.; Wu, J.Z.; et al. Isothiazoles as active-site inhibitors of HCV NS5B polymerase. Bioorganic Med. Chem. Lett. 2007, 17, 28–33. [Google Scholar] [CrossRef] [PubMed]
- de Vicente, J.; Hendricks, R.T.; Smith, D.B.; Fell, J.B.; Fischer, J.; Spencer, S.R.; Stengel, P.J.; Mohr, P.; Robinson, J.E.; Blake, J.F.; et al. Non-nucleoside inhibitors of HCV polymerase NS5B. Part 4: Structure-based design, synthesis, and biological evaluation of benzo[d]isothiazole-1,1-dioxides. Bioorganic Med. Chem. Lett. 2009, 19, 5652–5656. [Google Scholar] [CrossRef]
- Singh, R.; Kumar, P.; Sindhu, J.; Devi, M.; Kumar, A.; Lal, S.; Singh, D. Parsing structural fragments of thiazolidin-4-one based α-amylase inhibitors: A combined approach employing in vitro colorimetric screening and GA-MLR based QSAR modelling supported by molecular docking, molecular dynamics simulation and ADMET studies. Comput. Biol. Med. 2023, 157, 106776. [Google Scholar] [CrossRef] [PubMed]
- Alloui, M.; Belaidi, S.; Othmani, H.; Jaidane, N.E.; Hochlaf, M. Imidazole derivatives as angiotensin II AT1 receptor blockers: Benchmarks, drug-like calculations and quantitative structure-activity relationships modeling. Chem. Phys. Lett. 2018, 696, 70–78. [Google Scholar] [CrossRef]
- Khamouli, S.; Belaidi, S.; Bakhouch, M.; Chtita, S.; Hashmi, M.A.; Qais, F.A. QSAR modeling, molecular docking, ADMET prediction and molecular dynamics simulations of some 6-arylquinazolin-4-amine derivatives as DYRK1A inhibitors. J. Mol. Struct. 2022, 1258, 132659. [Google Scholar] [CrossRef]
- Dahmani, R.; Manachou, M.; Belaidi, S.; Chtita, S.; Boughdiri, S. Structural characterization and QSAR modeling of 1, 2, 4-triazole derivatives as α-glucosidase inhibitors. New J. Chem. 2021, 45, 1253–1261. [Google Scholar] [CrossRef]
- Golbraikh, A.; Tropsha, A. Beware of q2! J. Mol. Graph. Model. 2002, 20, 269–276. [Google Scholar] [CrossRef]
- Dermeche, K.; Tchouar, N.; S Belaidi, S.; Salah, T. Qualitative Structure-Activity Relationships and 2D-QSAR Modeling of TNF-α Inhibition by Thalidomide Derivatives. J. Bionanoscience 2015, 9, 395–400. [Google Scholar] [CrossRef]
- Almi, I.; Belaidi, S.; Zerroug, E.; Alloui, M.; Said, R.B.; Linguerri, R.; Hochlaf, M. QSAR investigations and structure-based virtual screening on a series of nitrobenzoxadiazole derivatives targeting human glutathione-S- transferases. J. Mol. Struct. 2020, 1211, 128015. [Google Scholar] [CrossRef]
- Soualmia, F.; Belaidi, S.; Tchouar, N.; Lanez, T.; Boudergua, S. QSAR Studies and Structure Property/Activity Relationships Applied in Pyrazine Derivatives as Antiproliferative Agents Against the BGC823. Acta Chim. Slov. 2021, 68, 882–895. [Google Scholar] [CrossRef] [PubMed]
- Morris, G.M.; Huey, R.; Lindstrom, W.; Sanner, M.F.; Belew, R.K.; Goodsell, D.S.; Olson, A.J. AutoDock4 and AutoDockTools4: Automated docking with selective receptor flexibility. J. Comput. Chem. 2009, 30, 2785–2791. [Google Scholar] [CrossRef] [PubMed]
- Fattouche, M.; Belaidi, S.; Ouassaf, M.; Chtita, S.; Al-Mogren, M.M.; Hochlaf, M. Computational studies of pyrimidine derivatives as inhibitors of human σ1 receptor using 3D-QSAR analysis, molecular docking, ADMET properties and DFT investigation. Chem. Phys. Impact. 2024, 8, 100463. [Google Scholar] [CrossRef]
- Lipinski, C.A.; Lombardo, F.; Dominy, B.W.; Feeney, P.J. Experimental and computational approaches to estimate solubility and permeability in drug discovery and development settings. Adv. Drug Deliv. Rev. 2001, 46, 3–26. [Google Scholar] [CrossRef] [PubMed]
- Ghose, A.K.; Viswanadhan, V.N.; Wendoloski, J.J. A Knowledge-Based Approach in Designing Combinatorial or Medicinal Chemistry Libraries for Drug Discovery. 1. A Qualitative and Quantitative Characterization of Known Drug Databases. J. Comb. Chem. 1999, 1, 55–68. [Google Scholar] [CrossRef] [PubMed]
- Veber, D.F.; Johnson, S.R.; Cheng, H.Y.; Smith, B.R.; Ward, K.W.; Kapple, K.D. Molecular Properties That Influence the Oral Bioavailability of Drug Candidates. J. Med. Chem. 2002, 45, 2615–2623. [Google Scholar] [CrossRef]
- Mishra, S.; Dahima, R. In vitro ADME studies of TUG-891, a GPR-120 inhibitor using Swiss ADME predictor. J. Drug Deliv. Ther. 2019, 9, 366–369. [Google Scholar] [CrossRef]
- Brunton, L.; Chabner, B.A.; Knollman, B. Goodman and Gilman’s The Pharmacological Basis of Therapeutics, 12th ed.; McGraw Hill LLC: New York, NY, USA, 2011; 1808p, ISBN 0071769390/9780071769396. [Google Scholar]
- Nour, H.; Abdou, A.; Belaidi, S.; Jamal, J.E.; Elmakssoudi, A.; Dakir, M.; Chtita, S. Discovery of promising cholinesterase inhibitors for Alzheimer’s disease treatment through DFT, docking, and molecular dynamics studies of eugenol derivatives. J. Chin. Chem. Soc. 2022, 69, 1534–1551. [Google Scholar]
- Chem Office. Available online: https://support.revvitysignals.com/hc/en-us/articles/4408268473492 (accessed on 10 October 2024).
- Belaidi, S.; Salah, T.; Melkemi, N.; Sinha, L.; Prasad, O. Structure Activity Relationship and Quantitative Structure-Activity Relationships Modeling of Antitrypanosomal Activities of Alkyldiamine Cryptolepine Derivatives. J. Comput. Theor. Nanosci. 2015, 1, 2421–2427. [Google Scholar] [CrossRef]
- HyperChem (Molecular Modelling System), Professional 8.0; Hypercube, Inc.: Gainesville, FL, USA, 2008.
- Frisch, M.J.; Trucks, G.W.; Schlegel, H.B.; Scuseria, G.E.; Robb, M.A.; Cheeseman, J.R.; Scalmani, G.; Barone, V.; Mennucci, B.; Petersson, G.A.; et al. Gaussian09, revision B.01.; Gaussian Inc.: Wallingford, CT, USA, 2010. [Google Scholar]
- Chemaxon. Available online: https://dl.chemaxon.com/docs/HTML/docs164110/MarvinSketch.html (accessed on 10 October 2024).
- Apablaza, G.; Montoya, L.; Morales-Verdejo, C.; Mellado, M.; Cuellar, M.; Lagos, C.F.; Soto-Delgado, J.; Chung, H.; Pessoa-Mahana, C.D.; Mella, J. 2D-QSAR and 3D-QSAR/CoMSIA Studies on a Series of (R)-2-((2-(1H-Indol-2-yl)ethyl)amino)-1-Phenylethan-1-ol with Human β3-Adrenergic Activity. Molecules 2017, 22, 404. [Google Scholar] [CrossRef]
- XLSTAT, version 2014.5.03; Addinsoft: Paris, France. Available online: https://www.xlstat.com (accessed on 10 October 2024).
- Chtita, S.; Belhassan, A.; Bakhouch, M.; Taourati, A.I.; Aouidate, A.; Belaidi, S.; Moutaabbid, M.; Belaaouad, S.; Bouachrine, M.; Lakhlifi, T. QSAR study of unsymmetrical aromatic disulfides as potent avian SARS-CoV main protease inhibitors using quantum chemical descriptors and statistical methods. Chemom. Intell. Lab. Syst. 2021, 210, 104266. [Google Scholar] [CrossRef] [PubMed]
- Aggoun, S.; Belaidi, S.; Ghamri, M.; Abchir, O.; Chtita, S. Artificial Neural Network and Multiple Regression Analysis Applied to 2D-QSAR Studies: The Case of Imidazolidine-2,4-dione as PTP1B Inhibiton. Philipp. J. Sci. 2024, 153, 333–346. [Google Scholar] [CrossRef]
- Tropsha, A. Best practices for QSAR model development, validation, and exploitation. Mol. Inform. 2010, 29, 476–488. [Google Scholar] [CrossRef] [PubMed]
- Roy, K.; Chakraborty, P.; Mitra, I.; Ojha, P.K.; Kar, S.; Das, R.N. Some Case Studies on Application of “rm2” Metrics for Judging Quality of Quantitative Structure-Activity Relationship Predictions: Emphasis on Scaling of Response Data. J. Comp. Chem. 2013, 34, 1071–1082. [Google Scholar] [CrossRef]
- Wang, Z.; Sun, H.; Yao, X.; Li, D.; Xu, L.; Li, Y.; Tian, S.; Hou, T. Comprehensive evaluation of ten docking programs on a diverse set of protein-ligand complexes: The prediction accuracy of sampling power and scoring power. Phys. Chem. Chem. Phys. 2016, 18, 12964–12975. [Google Scholar] [CrossRef]
- Mobley, D.L.; Graves, A.P.; Chodera, J.D.; McReynolds, A.C.; Shoichet, B.K.; Dill, K.A. Predicting absolute ligand binding free energies to a simple model site. J. Mol. Biol. 2007, 371, 1118–1134. [Google Scholar] [CrossRef]
- Hanwell, M.D.; Curtis, D.E.; Lonie, D.C.; Vandermeersch, T.; Zurek, E.; Hutchison, G.R. Avogadro: An advanced semantic chemical editor, visualization, and analysis platform. J. Chem. Inform. 2012, 4, 17. [Google Scholar]
- Guex, N.; Peitsch, M.C. SWISS-MODEL and the Swiss-PdbViewer: An environment for comparative protein modeling. J. Electrophor. 1997, 18, 2714–2723. [Google Scholar]
- Khamouli, S.; Belaidi, S.; Ouassaf, M.; Lanez, T.; Belaaouad, S.; Chtita, S. Multi-combined 3D-QSAR, docking molecular and ADMET prediction of 5-azaindazole derivatives as LRRK2 tyrosine kinase inhibitors. J. Biomol. Struct. Dyn. 2022, 40, 1285–1298. [Google Scholar] [PubMed]
- Abchir, O.; Daoui, O.; Belaidi, S.; Ouassaf, M.; Qais, F.A.; ElKhattabi, S.; Belaaouad, S.; Chtita, S. Design of novel benzimidazole derivatives as potential α-amylase inhibitors using QSAR, pharmacokinetics, molecular docking, and Molecular Dynamics Simulation Studies. J. Mol. Model. 2022, 28, 106. [Google Scholar]
- Nour, H.; Abchir, O.; Belaidi, S.; Chtita, S. Research of new acetylcholinesterase inhibitors based on QSAR and molecular docking studies of benzene-based carbamate derivatives. J. Struct. Chem. 2022, 33, 1935–1946. [Google Scholar]
- Abchir, O.; Nour, H.; Daoui, O.; Yamari, I.; ElKhattabi, S.; El Kouali, M.; Talbi, M.; Errougui, A.; Chtita, S. Structure-based virtual screening, ADMET analysis, and molecular dynamics simulation of Moroccan natural compounds as candidates for the SARS-COV-2 inhibitors. J. Nat. Prod. Res. 2023, 8, e202301092. [Google Scholar]
- Daina, A.; Michielin, O.; Zoete, V. SwissADME: A free web tool to evaluate pharmacokinetics, drug-likeness and medicinal chemistry friendliness of small molecules. Sci. Rep. 2017, 7, 42717. [Google Scholar] [CrossRef]
- Pkcsm. 25 July 2022. Available online: https://biosig.lab.uq.edu.au/pkcsm/prediction (accessed on 10 October 2024).
- Derki, N.E.H.; Kerassa, A.; Belaidi, S.; Derki, M.; Yamari, I.; Samadi, A.; Chtita, S. Computer-Aided Strategy on 5-(Substituted benzylidene) Thiazolidine-2, 4-Diones to Develop New and Potent PTP1B Inhibitors: QSAR Modeling, Molecular Docking, Molecular Dynamics. Molecules 2024, 29, 822. [Google Scholar] [CrossRef]
- Schrodinger, System, Maestro-Desmond Interoperability Tools, Software (2021). Schrödinger, LLC: New York, NY, USA, 2017.
- Mouhsin, M.; Abchir, O.; El Otmani, F.S.; Oumghar, A.A.; Oubenali, M.; Chtita, S.; Mbarki, M.; Gamouh, A. Identification of novel NLRP3 inhibitors: A comprehensive approach using 2D-QSAR, molecular docking, molecular dynamics simulation and drug-likeness evaluation. Chem. Pap. 2023, 78, 1193–1204. [Google Scholar] [CrossRef]
- Mohamed, A.S.; Elmi, A.; Spina, R.; Kordofani, M.A.; Laurain-Mattar, D.; Nour, H.; Abchir, O.; Chtita, S. In vitro and in silico analysis for elucidation of antioxidant potential of Djiboutian Avicennia marina (Forsk.) Vierh. Phytochemicals. J. Biomol. Struct. Dyn. 2023, 42, 3410–3425. [Google Scholar]


| No | Structure | pIC50 Exp. | pIC50 Pred MLR | pIC50 Res. MLR | No | Structure | pIC50 Exp. | pIC50 Pred MLR | pIC50 Res. MLR | No | Structure | pIC50 Exp. | pIC50 Pred MLR | pIC50 Res. MLR |
|---|---|---|---|---|---|---|---|---|---|---|---|---|---|---|
| 1 * |  | 5.229 | 6.055 | −0.826 | 14 |  | 5.456 | 5.913 | −0.457 | 27 |  | 4.357 | 5.903 | −1.546 |
| 2 * | 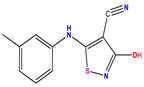 | 4 | 4.256 | −0.256 | 15 | 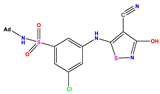 | 5.745 | 5.920 | −0.175 | 28 * | 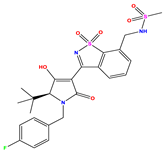 | 8.523 | 8.251 | 0.273 |
| 3 | 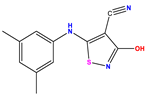 | 4 | 4.248 | −0.248 | 16 |  | 6.523 | 6.423 | 0.100 | 29 |  | 8.398 | 8.104 | 0.294 |
| 4 |  | 4 | 4.536 | −0.536 | 17 * |  | 5.886 | 5.081 | 0.805 | 30 |  | 8.046 | 7.406 | 0.640 |
| 5 |  | 6.046 | 5.162 | 0.884 | 18 |  | 6.301 | 5.963 | 0.338 | 31 |  | 8.398 | 8.468 | −0.070 |
| 6 | 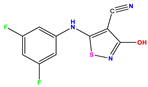 | 6.523 | 6.012 | 0.511 | 19 * |  | 6.000 | 5.428 | 0.572 | 32 * | 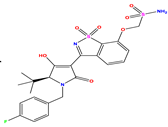 | 8.222 | 8.194 | 0.028 |
| 7 | 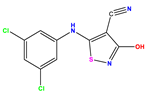 | 6.699 | 6.078 | 0.621 | 20 | 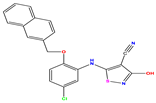 | 5.194 | 6.022 | −0.828 | 33 | 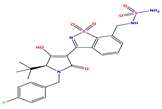 | 8.523 | 7.970 | 0.554 |
| 8 |  | 5.699 | 5.625 | 0.074 | 21 |  | 6.523 | 5.793 | 0.731 | 34 | 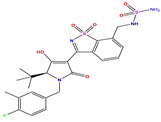 | 8.523 | 7.813 | 0.711 |
| 9 | 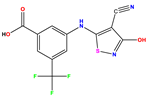 | 5.824 | 5.579 | 0.245 | 22 | 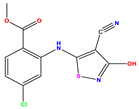 | 5.328 | 5.672 | −0.344 | 35 * | 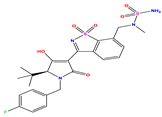 | 9.000 | 7.980 | 1.020 |
| 10 | 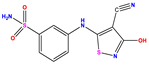 | 5.013 | 5.187 | −0.174 | 23 | 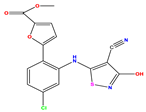 | 5.7450 | 6.479 | −0.734 | 36 | 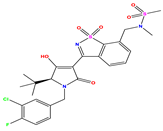 | 8.000 | 8.199 | −0.199 |
| 11 | 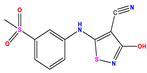 | 5.013 | 5.654 | −0.641 | 24 |  | 5.770 | 6.329 | −0.559 | 37 |  | 8.301 | 8.774 | −0.473 |
| 12 |  | 5.081 | 5.234 | −0.153 | 25 * |  | 6.155 | 6.000 | 0.155 | 38 |  | 7.921 | 8.252 | −0.331 |
| 13 |  | 5.854 | 5.039 | 0.815 | 26 |  | 5.921 | 4.974 | 0.947 |
| Compound | ET × 103 (a.u.) | D | Log D | EHOMO (Hartree) | ELUMO (Hartree) | μ (Debye) | MW (amu) | Log P | H (kcal/mol) | SAG (Å2) | MV (Å3) | MR (Å3) | Pol (Å3) | PSA | HBA | HBD | NRB |
|---|---|---|---|---|---|---|---|---|---|---|---|---|---|---|---|---|---|
| 1 | −46.177 | 1.67 | 2.82 | −0.242 | −0.071 | 1.810 | 353.24 | 2.62 | −14.53 | 477.12 | 771.34 | 73.92 | 25.87 | 68.94 | 4 | 2 | 4 |
| 2 | −28.905 | 1.41 | 1.58 | −0.219 | −0.048 | 4.288 | 231.27 | 1.63 | −14.70 | 419.16 | 666.43 | 67.77 | 24.58 | 68.94 | 4 | 2 | 2 |
| 3 | −29.975 | 1.36 | 2.09 | −0.217 | −0.047 | 4.723 | 245.30 | 1.78 | −13.50 | 444.25 | 718.33 | 72.05 | 26.42 | 68.94 | 4 | 2 | 2 |
| 4 | −30.951 | 1.45 | 0.91 | −0.218 | −0.048 | 3.136 | 247.27 | 0.48 | −17.46 | 438.57 | 691.79 | 69.86 | 25.22 | 78.17 | 5 | 2 | 3 |
| 5 | −30.535 | 1.54 | 1.21 | −0.227 | −0.056 | 2.783 | 235.24 | 0.88 | −15.60 | 396.96 | 624.19 | 63.61 | 22.66 | 68.94 | 4 | 2 | 2 |
| 6 | −33.235 | 1.60 | 1.35 | −0.234 | −0.061 | 2.473 | 253.23 | 0.28 | −15.27 | 402.73 | 633.09 | 63.74 | 22.56 | 68.94 | 4 | 2 | 2 |
| 7 | −52.847 | 1.68 | 2.28 | −0.237 | −0.065 | 2.169 | 286.14 | 1.03 | −15.13 | 438.73 | 699.99 | 72.92 | 26.60 | 68.94 | 4 | 2 | 2 |
| 8 | −43.207 | 1.59 | 1.95 | −0.237 | −0.077 | 1.583 | 343.28 | 1.46 | −15.59 | 517.44 | 831.23 | 79.47 | 28.70 | 95.24 | 6 | 2 | 5 |
| 9 | −42.137 | 1.73 | 1.11 | −0.238 | −0.079 | 0.160 | 329.25 | 1.43 | −20.12 | 477.16 | 768.35 | 74.70 | 26.87 | 106.20 | 6 | 3 | 4 |
| 10 | −44.268 | 1.73 | 0.09 | −0.237 | −0.067 | 6.065 | 296.32 | −0.38 | −22.14 | 466.46 | 750.30 | 76.74 | 25.24 | 129.10 | 7 | 4 | 3 |
| 11 | −43.832 | 1.61 | 0.09 | −0.236 | −0.066 | 5.411 | 295.33 | −0.12 | −18.31 | 473.90 | 763.51 | 77.15 | 25.72 | 103.10 | 6 | 2 | 3 |
| 12 | −47.042 | 1.45 | 1.38 | −0.235 | −0.065 | 5.266 | 337.41 | 1.09 | −16.55 | 566.21 | 922.15 | 91.03 | 31.22 | 103.10 | 6 | 2 | 6 |
| 13 | −54.868 | 1.52 | 1.99 | −0.230 | −0.059 | 4.570 | 430.54 | 1.56 | −17.18 | 631.84 | 1102.08 | 116.07 | 41.26 | 115.10 | 7 | 3 | 4 |
| 14 | −64.039 | 1.59 | 2.87 | −0.241 | −0.069 | 5.493 | 498.54 | 2.12 | −16.33 | 635.45 | 1140.42 | 121.28 | 42.83 | 115.10 | 7 | 3 | 5 |
| 15 | −67.374 | 1.58 | 2.59 | −0.238 | −0.066 | 3.742 | 464.98 | 1.33 | −17.08 | 639.26 | 1124.87 | 120.78 | 43.19 | 115.10 | 7 | 3 | 4 |
| 16 | −106.968 | 1.89 | 2.71 | −0.239 | −0.069 | 2.538 | 364.14 | 2.10 | −14.74 | 467.63 | 754.57 | 76.24 | 26.94 | 68.94 | 4 | 2 | 3 |
| 17 | −36.168 | 1.45 | 2.57 | −0.210 | −0.052 | 3.185 | 309.34 | 0.98 | −17.73 | 494.08 | 835.14 | 94.45 | 33.04 | 78.17 | 5 | 2 | 4 |
| 18 | −38.868 | 1.50 | 2.71 | −0.212 | −0.057 | 2.209 | 327.33 | 0.37 | −17.48 | 500.90 | 845.54 | 94.58 | 32.95 | 78.17 | 5 | 2 | 4 |
| 19 | −49.745 | 1.48 | 3.34 | −0.217 | −0.052 | 4.245 | 357.81 | 1.28 | −17.61 | 538.48 | 926.12 | 103.33 | 36.81 | 78.17 | 5 | 2 | 5 |
| 20 | −53.926 | 1.49 | 4.23 | −0.222 | −0.053 | 4.547 | 407.87 | 1.35 | −18.02 | 605.89 | 1050.80 | 121.53 | 42.99 | 78.17 | 5 | 2 | 5 |
| 21 | −107.201 | 1.66 | 3.40 | −0.218 | −0.053 | 3.099 | 402.27 | 1.55 | −17.62 | 553.40 | 947.86 | 106.15 | 37.51 | 78.17 | 5 | 2 | 5 |
| 22 | −46.542 | 1.59 | 2.98 | −0.232 | −0.075 | 1.317 | 309.73 | 0.67 | −14.85 | 458.40 | 764.45 | 78.97 | 29.07 | 95.24 | 6 | 2 | 4 |
| 23 | −52.769 | 1.59 | 2.30 | −0.225 | −0.075 | 2.307 | 375.79 | −0.36 | −17.73 | 569.35 | 948.94 | 99.61 | 35.89 | 108.40 | 7 | 2 | 5 |
| 24 | −111.382 | 1.64 | 4.39 | −0.221 | −0.053 | 4.531 | 452.32 | 1.62 | −17.96 | 613.82 | 1069.24 | 124.34 | 43.69 | 78.17 | 5 | 2 | 5 |
| 25 | −52.847 | 1.68 | 2.28 | −0.231 | −0.063 | 3.524 | 286.14 | 1.03 | −16.00 | 430.48 | 690.94 | 72.92 | 26.60 | 68.94 | 4 | 2 | 2 |
| 26 | −30.535 | 1.54 | 1.21 | −0.223 | −0.052 | 2.814 | 235.24 | 0.88 | −15.67 | 397.98 | 624.03 | 63.61 | 22.66 | 68.94 | 4 | 2 | 2 |
| 27 | −43.881 | 1.72 | 2.02 | −0.226 | −0.073 | 3.893 | 292.31 | 0.91 | −16.20 | 454.15 | 720.65 | 76.94 | 27.65 | 81.83 | 5 | 2 | 2 |
| 28 | −66.447 | 1.46 | 1.85 | −0.249 | −0.095 | 14.364 | 535.61 | 0.07 | −12.75 | 732.13 | 1312.48 | 140.68 | 46.92 | 133.20 | 8 | 2 | 6 |
| 29 | −67.517 | 1.44 | 1.33 | −0.239 | −0.091 | 15.026 | 549.63 | 0.23 | −11.23 | 767.26 | 1362.44 | 144.97 | 48.75 | 133.20 | 8 | 2 | 6 |
| 30 | −66.988 | 1.46 | 1.81 | −0.249 | −0.089 | 8.792 | 536.59 | −0.10 | −12.24 | 743.98 | 1308.79 | 138.80 | 46.20 | 130.40 | 9 | 1 | 7 |
| 31 | −66.012 | 1.42 | 1.39 | −0.247 | −0.105 | 7.393 | 534.62 | 0.45 | −9.20 | 744.36 | 1322.28 | 141.38 | 47.40 | 121.20 | 8 | 1 | 7 |
| 32 | −67.424 | 1.54 | 2.05 | −0.248 | −0.102 | 16.776 | 537.58 | −0.36 | −15.97 | 719.88 | 1289.88 | 138.39 | 45.72 | 156.40 | 9 | 2 | 7 |
| 33 | −66.884 | 1.55 | 2.30 | −0.246 | −0.100 | 15.592 | 536.59 | −0.19 | −14.50 | 726.61 | 1290.06 | 140.27 | 46.43 | 159.20 | 9 | 3 | 6 |
| 34 | −67.954 | 1.52 | 1.78 | −0.239 | −0.095 | 13.200 | 550.62 | −0.03 | −14.36 | 748.20 | 1339.66 | 144.55 | 48.27 | 159.20 | 9 | 3 | 6 |
| 35 | −67.953 | 1.49 | 2.07 | −0.244 | −0.095 | 13.237 | 550.02 | −0.27 | −12.13 | 735.69 | 1327.01 | 145.17 | 47.27 | 150.40 | 9 | 2 | 6 |
| 36 | −80.023 | 1.47 | 1.03 | −0.248 | −0.092 | 10.387 | 584.08 | −0.24 | −9.47 | 760.07 | 1380.74 | 150.30 | 50.68 | 124.40 | 9 | 1 | 6 |
| 37 | −67.518 | 1.40 | 1.10 | −0.248 | −0.100 | 3.504 | 563.66 | 0.14 | −7.42 | 772.22 | 1390.55 | 149.86 | 50.59 | 124.40 | 8 | 1 | 6 |
| 38 | −69.624 | 1.47 | 1.06 | −0.244 | −0.089 | 11.480 | 575.67 | 0.31 | −10.15 | 778.96 | 1413.42 | 153.12 | 51.65 | 124.40 | 8 | 1 | 6 |
| (Variables) | MW (amu) | Log P | HBA | ELUMO (Hartree) | VIF |
|---|---|---|---|---|---|
| MW | 1 | 5.197 | |||
| Log P | −0.239 | 1 | 2.060 | ||
| HBA | 0.850 | −0.548 | 1 | 7.402 | |
| ELUMO | −0.748 | 0.516 | −0.832 | 1 | 3.506 |
| Average R | 0.351 |
| Average R2 | 0.139 |
| Average Q2 | −0.243 |
| cRp2 | 0.747 |
| Parameter | Threshold Score | Model Score |
|---|---|---|
| Q2LOO | Q2Loo > 0.5 | 0.737 |
| 0.874 | ||
| < 0.1 | 0.011 | |
| < 0.1 | 0.064 | |
| K | 0.85 ≤ K ≤ 1.15 | 1.037 |
| K′ | 0.85 ≤ K′ ≤ 1.15 | 0.958 |
| < 0.3 | 0.198 | |
| r2m | r2m > 0.5 | 0.766 |
| r’2m | r’2m> 0.5 | 0.623 |
| Compounds | Pred.pIC50 ANN | Compounds | Pred.pIC50 ANN |
|---|---|---|---|
| M1 | 6.30 | M20 | 5.47 |
| M2 | 3.90 | M21 | 6.03 |
| M3 | 4.09 | M22 | 5.20 |
| M4 | 4.08 | M23 | 5.78 |
| M5 | 5.10 | M24 | 5.93 |
| M6 | 6.58 | M25 | 6.69 |
| M7 | 6.56 | M26 | 5.86 |
| M8 | 5.70 | M27 | 4.59 |
| M9 | 5.83 | M28 | 8.22 |
| M10 | 5.03 | M29 | 8.25 |
| M11 | 4.97 | M30 | 8.08 |
| M12 | 5.09 | M31 | 8.41 |
| M13 | 5.85 | M32 | 8.39 |
| M14 | 5.48 | M33 | 8.52 |
| M15 | 5.74 | M34 | 8.45 |
| M16 | 6.54 | M35 | 8.38 |
| M17 | 4.71 | M36 | 8.03 |
| M18 | 6.24 | M37 | 8.37 |
| M19 | 5.34 | M38 | 7.97 |
 | |||||||
| Compound | R Substituent | MW | Log P | HBA | ELUMO (Hartree) | pIC50 | h |
| N7 |  | 523.62 | −0.73 | 8 | −0.101 | 8.968 | 0.281 |
| N8 |  | 535.63 | −0.33 | 8 | −0.098 | 8.657 | 0.191 |
| N9 |  | 509.55 | 0.64 | 8 | −0.105 | 8.061 | 0.133 |
| N10 |  | 524.62 | 0.90 | 7 | −0.092 | 8.097 | 0.144 |
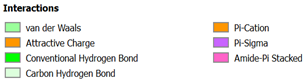
| Compounds | Score (kcal/Mol) | 3D Visualization | 2D Visualization |
|---|---|---|---|
| N7-2IJN | −8 |  |  |
| N8-2IJN | −8.1 |  |  |
| N9-2IJN | −9.3 |  |  |
| N10-2IJN | −8.5 |  | 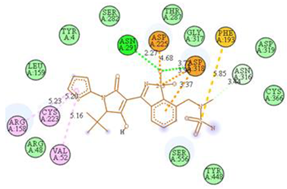 |
| Reference (221)-2IJN | −7.5 |  |  |
 | |||
| Parameters | N7 | N8 | N9 | N10 | Compound 221 |
|---|---|---|---|---|---|
| MW | 523.63 | 535.64 | 509.56 | 524.63 | 357.28 |
| Rotatable Bonds | 6 | 8 | 6 | 6 | 6 |
| H-bond acceptors | 7 | 7 | 8 | 7 | 4 |
| H-bond donors | 3 | 3 | 2 | 2 | 3 |
| TPSA | 193.22 | 193.22 | 193.23 | 195.44 | 117.71 |
| Log P | 1.2585 | 4.36 | 1.0749 | 2.1484 | 3.79 |
| BBB permeant | −1.137 | −1.148 | −1.861 | −1.626 | −1.183 |
| P-gp substrate | Yes | Yes | No | No | No |
| LogKp | −2.794 | −2.786 | −2.752 | −2.743 | −2.818 |
| CYP1A2 inhibitor | No | No | No | No | Yes |
| CYP2C19 inhibitor | No | No | No | No | Yes |
| CYP2C9 inhibitor | No | No | No | No | No |
| CYP2D6 inhibitor | No | No | No | No | No |
| CYP3A4 inhibitor | Yes | Yes | No | Yes | No |
| AMES toxicity | No | No | Yes | No | No |
| hERG I inhibitor | No | No | No | No | No |
| Skin sensitization | No | No | No | No | No |
Disclaimer/Publisher’s Note: The statements, opinions and data contained in all publications are solely those of the individual author(s) and contributor(s) and not of MDPI and/or the editor(s). MDPI and/or the editor(s) disclaim responsibility for any injury to people or property resulting from any ideas, methods, instructions or products referred to in the content. |
© 2024 by the authors. Licensee MDPI, Basel, Switzerland. This article is an open access article distributed under the terms and conditions of the Creative Commons Attribution (CC BY) license (https://creativecommons.org/licenses/by/4.0/).
Share and Cite
Fattouche, M.; Belaidi, S.; Abchir, O.; Al-Shaar, W.; Younes, K.; Al-Mogren, M.M.; Chtita, S.; Soualmia, F.; Hochlaf, M. ANN-QSAR, Molecular Docking, ADMET Predictions, and Molecular Dynamics Studies of Isothiazole Derivatives to Design New and Selective Inhibitors of HCV Polymerase NS5B. Pharmaceuticals 2024, 17, 1712. https://doi.org/10.3390/ph17121712
Fattouche M, Belaidi S, Abchir O, Al-Shaar W, Younes K, Al-Mogren MM, Chtita S, Soualmia F, Hochlaf M. ANN-QSAR, Molecular Docking, ADMET Predictions, and Molecular Dynamics Studies of Isothiazole Derivatives to Design New and Selective Inhibitors of HCV Polymerase NS5B. Pharmaceuticals. 2024; 17(12):1712. https://doi.org/10.3390/ph17121712
Chicago/Turabian StyleFattouche, Maroua, Salah Belaidi, Oussama Abchir, Walid Al-Shaar, Khaled Younes, Muneerah Mogren Al-Mogren, Samir Chtita, Fatima Soualmia, and Majdi Hochlaf. 2024. "ANN-QSAR, Molecular Docking, ADMET Predictions, and Molecular Dynamics Studies of Isothiazole Derivatives to Design New and Selective Inhibitors of HCV Polymerase NS5B" Pharmaceuticals 17, no. 12: 1712. https://doi.org/10.3390/ph17121712
APA StyleFattouche, M., Belaidi, S., Abchir, O., Al-Shaar, W., Younes, K., Al-Mogren, M. M., Chtita, S., Soualmia, F., & Hochlaf, M. (2024). ANN-QSAR, Molecular Docking, ADMET Predictions, and Molecular Dynamics Studies of Isothiazole Derivatives to Design New and Selective Inhibitors of HCV Polymerase NS5B. Pharmaceuticals, 17(12), 1712. https://doi.org/10.3390/ph17121712