
Evaluating Prognosis of Gastrointestinal Metastatic Neuroendocrine Tumors: Constructing a Novel Prognostic Nomogram Based on NETPET Score and Metabolic Parameters from PET/CT Imaging


Abstract
:1. Introduction
2. Results
2.1. Patient Characteristics
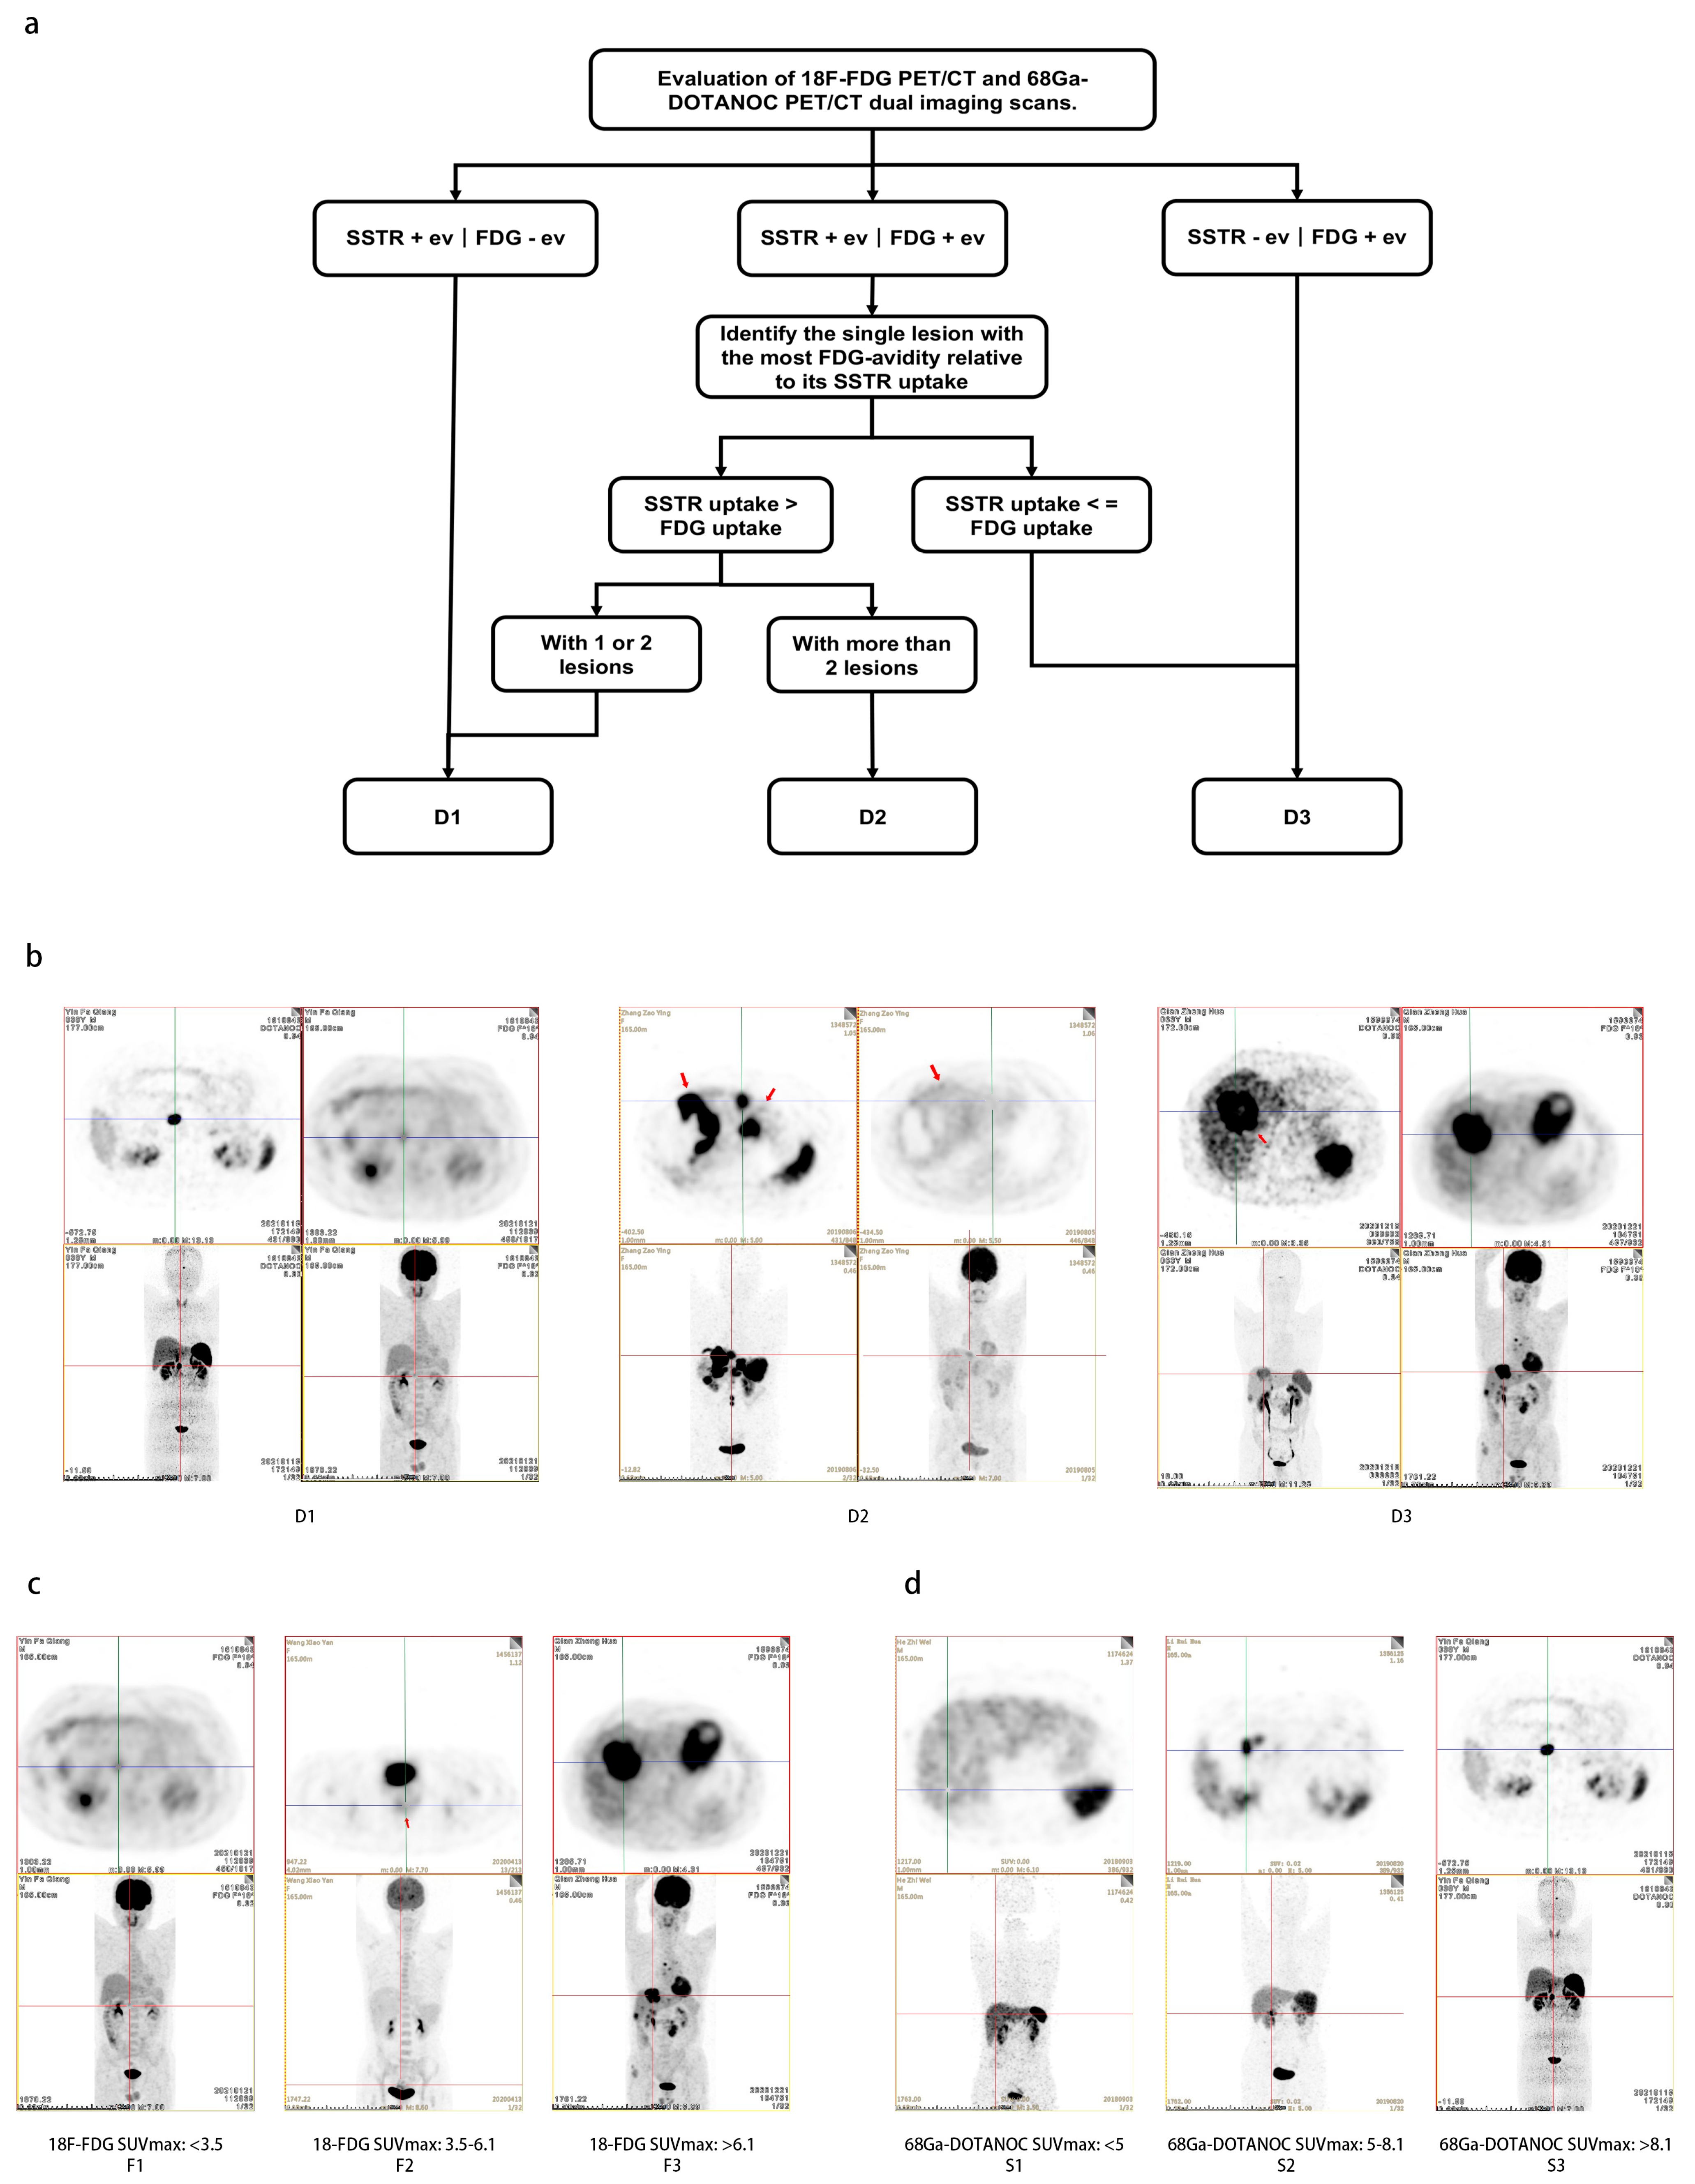
2.2. Construction of the Novel Grading Systems
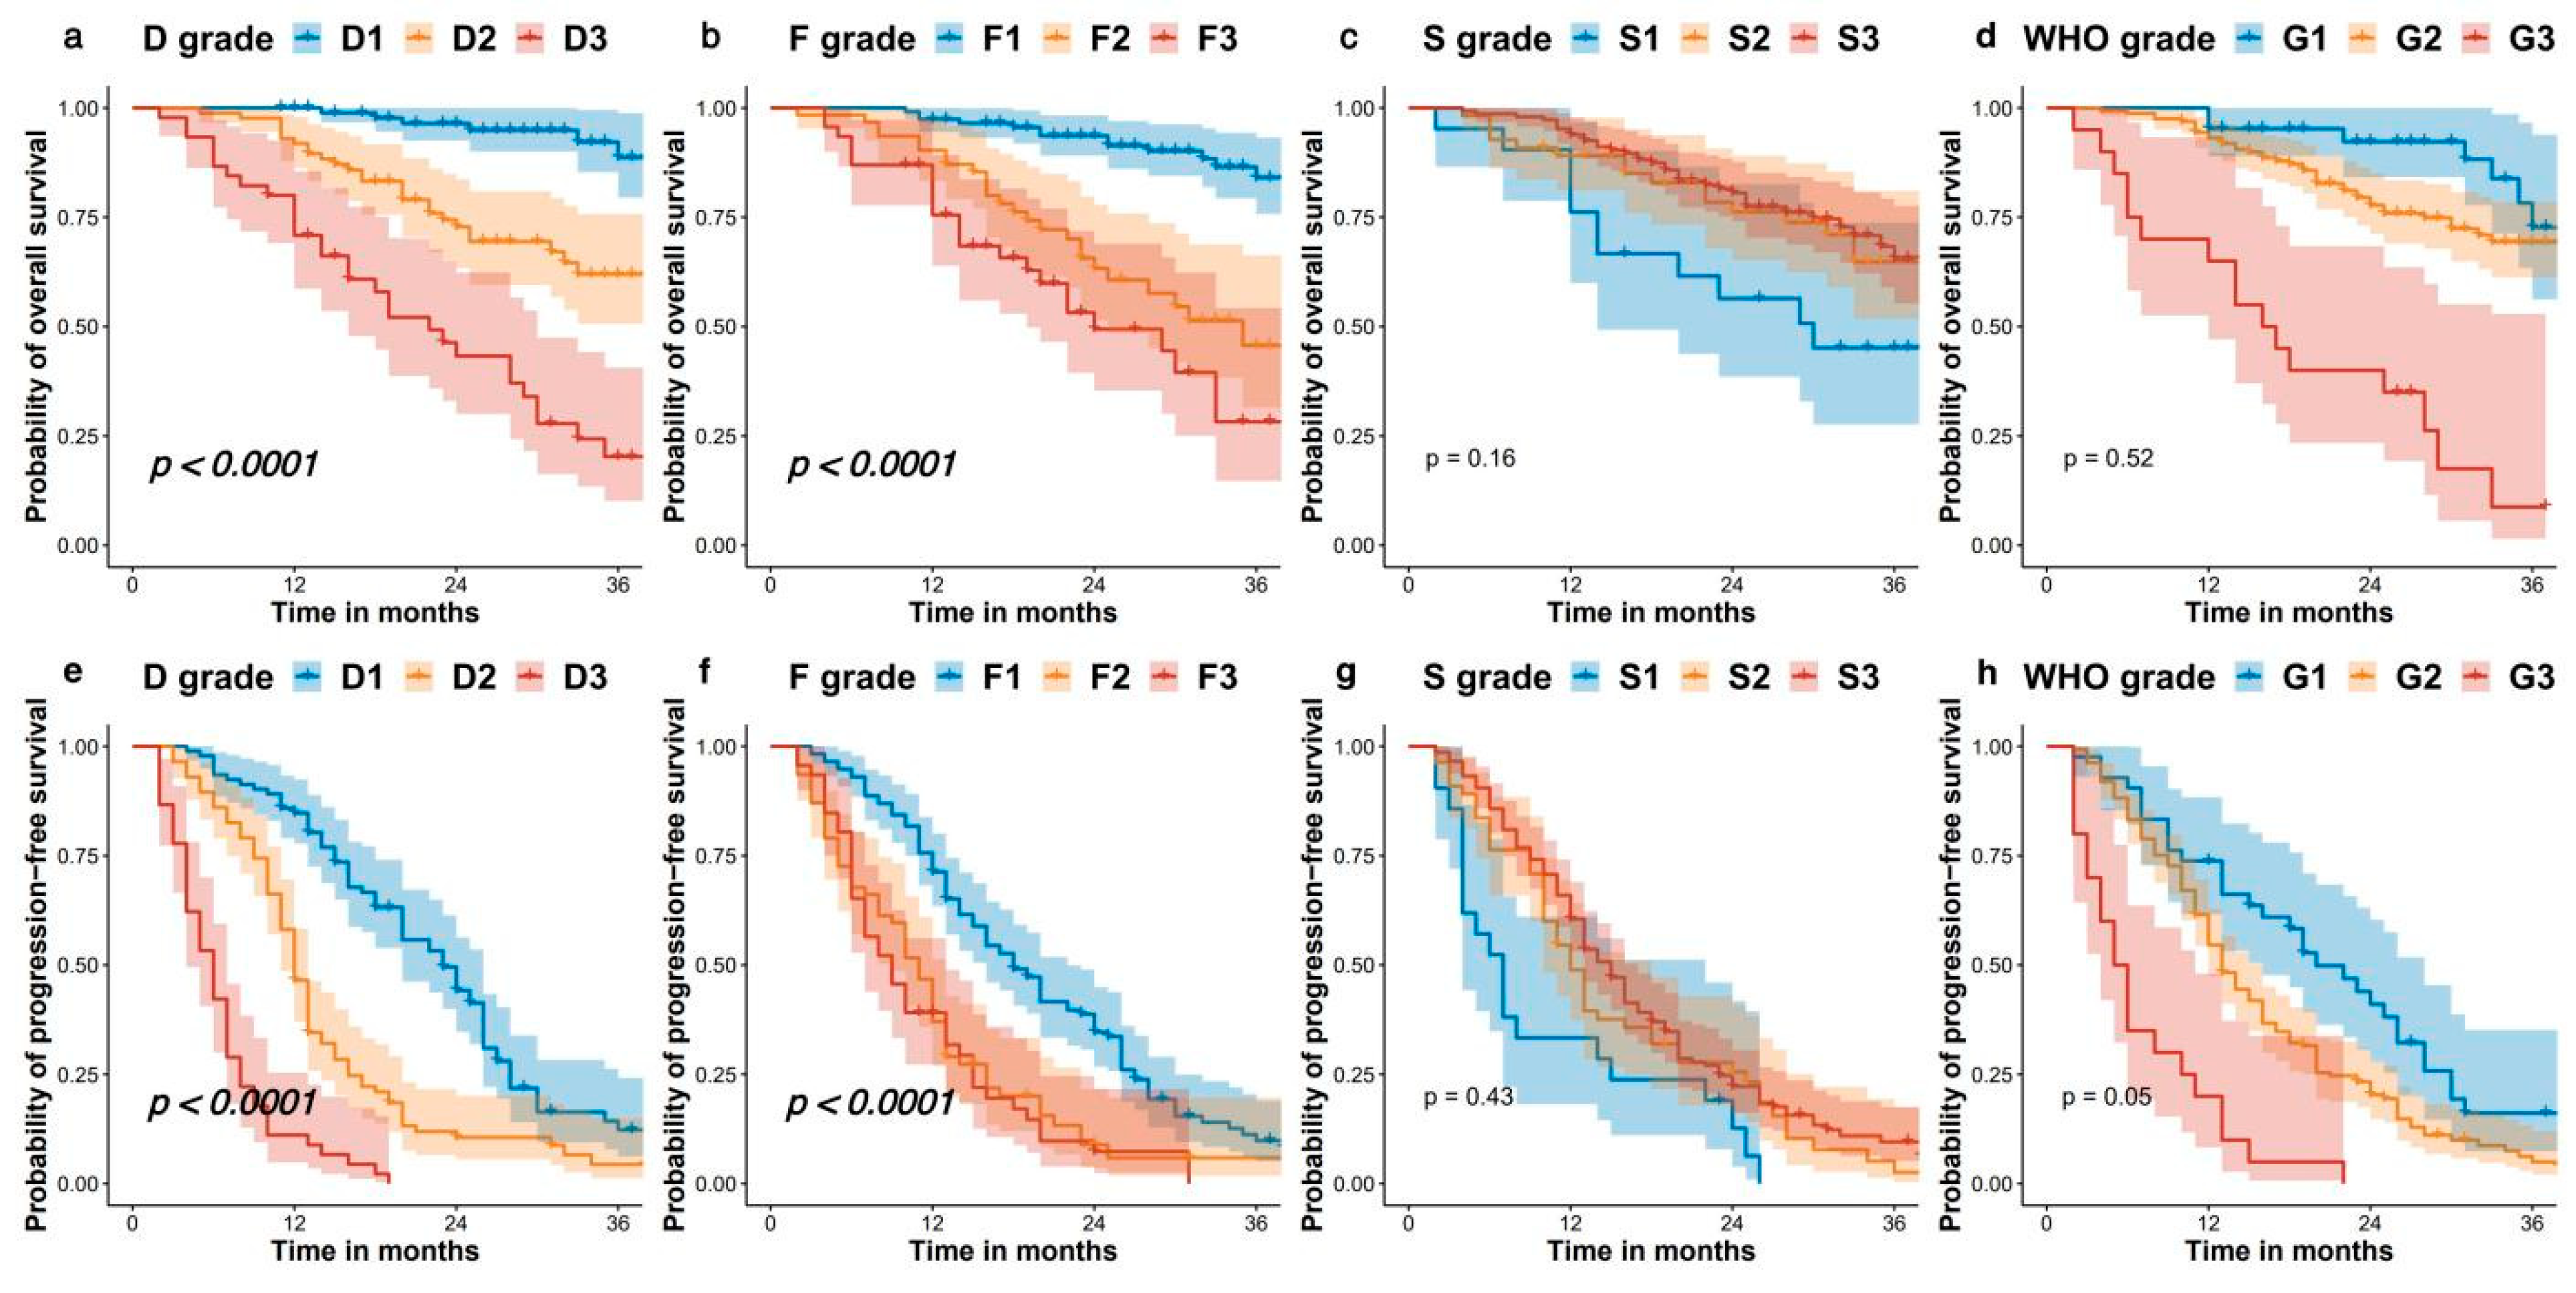
2.3. Overall Survival and Progression-Free Survival for Patients
2.4. Comparing the Prognostic Value of D Grade, F Grade, S Grade, and WHO Grading System
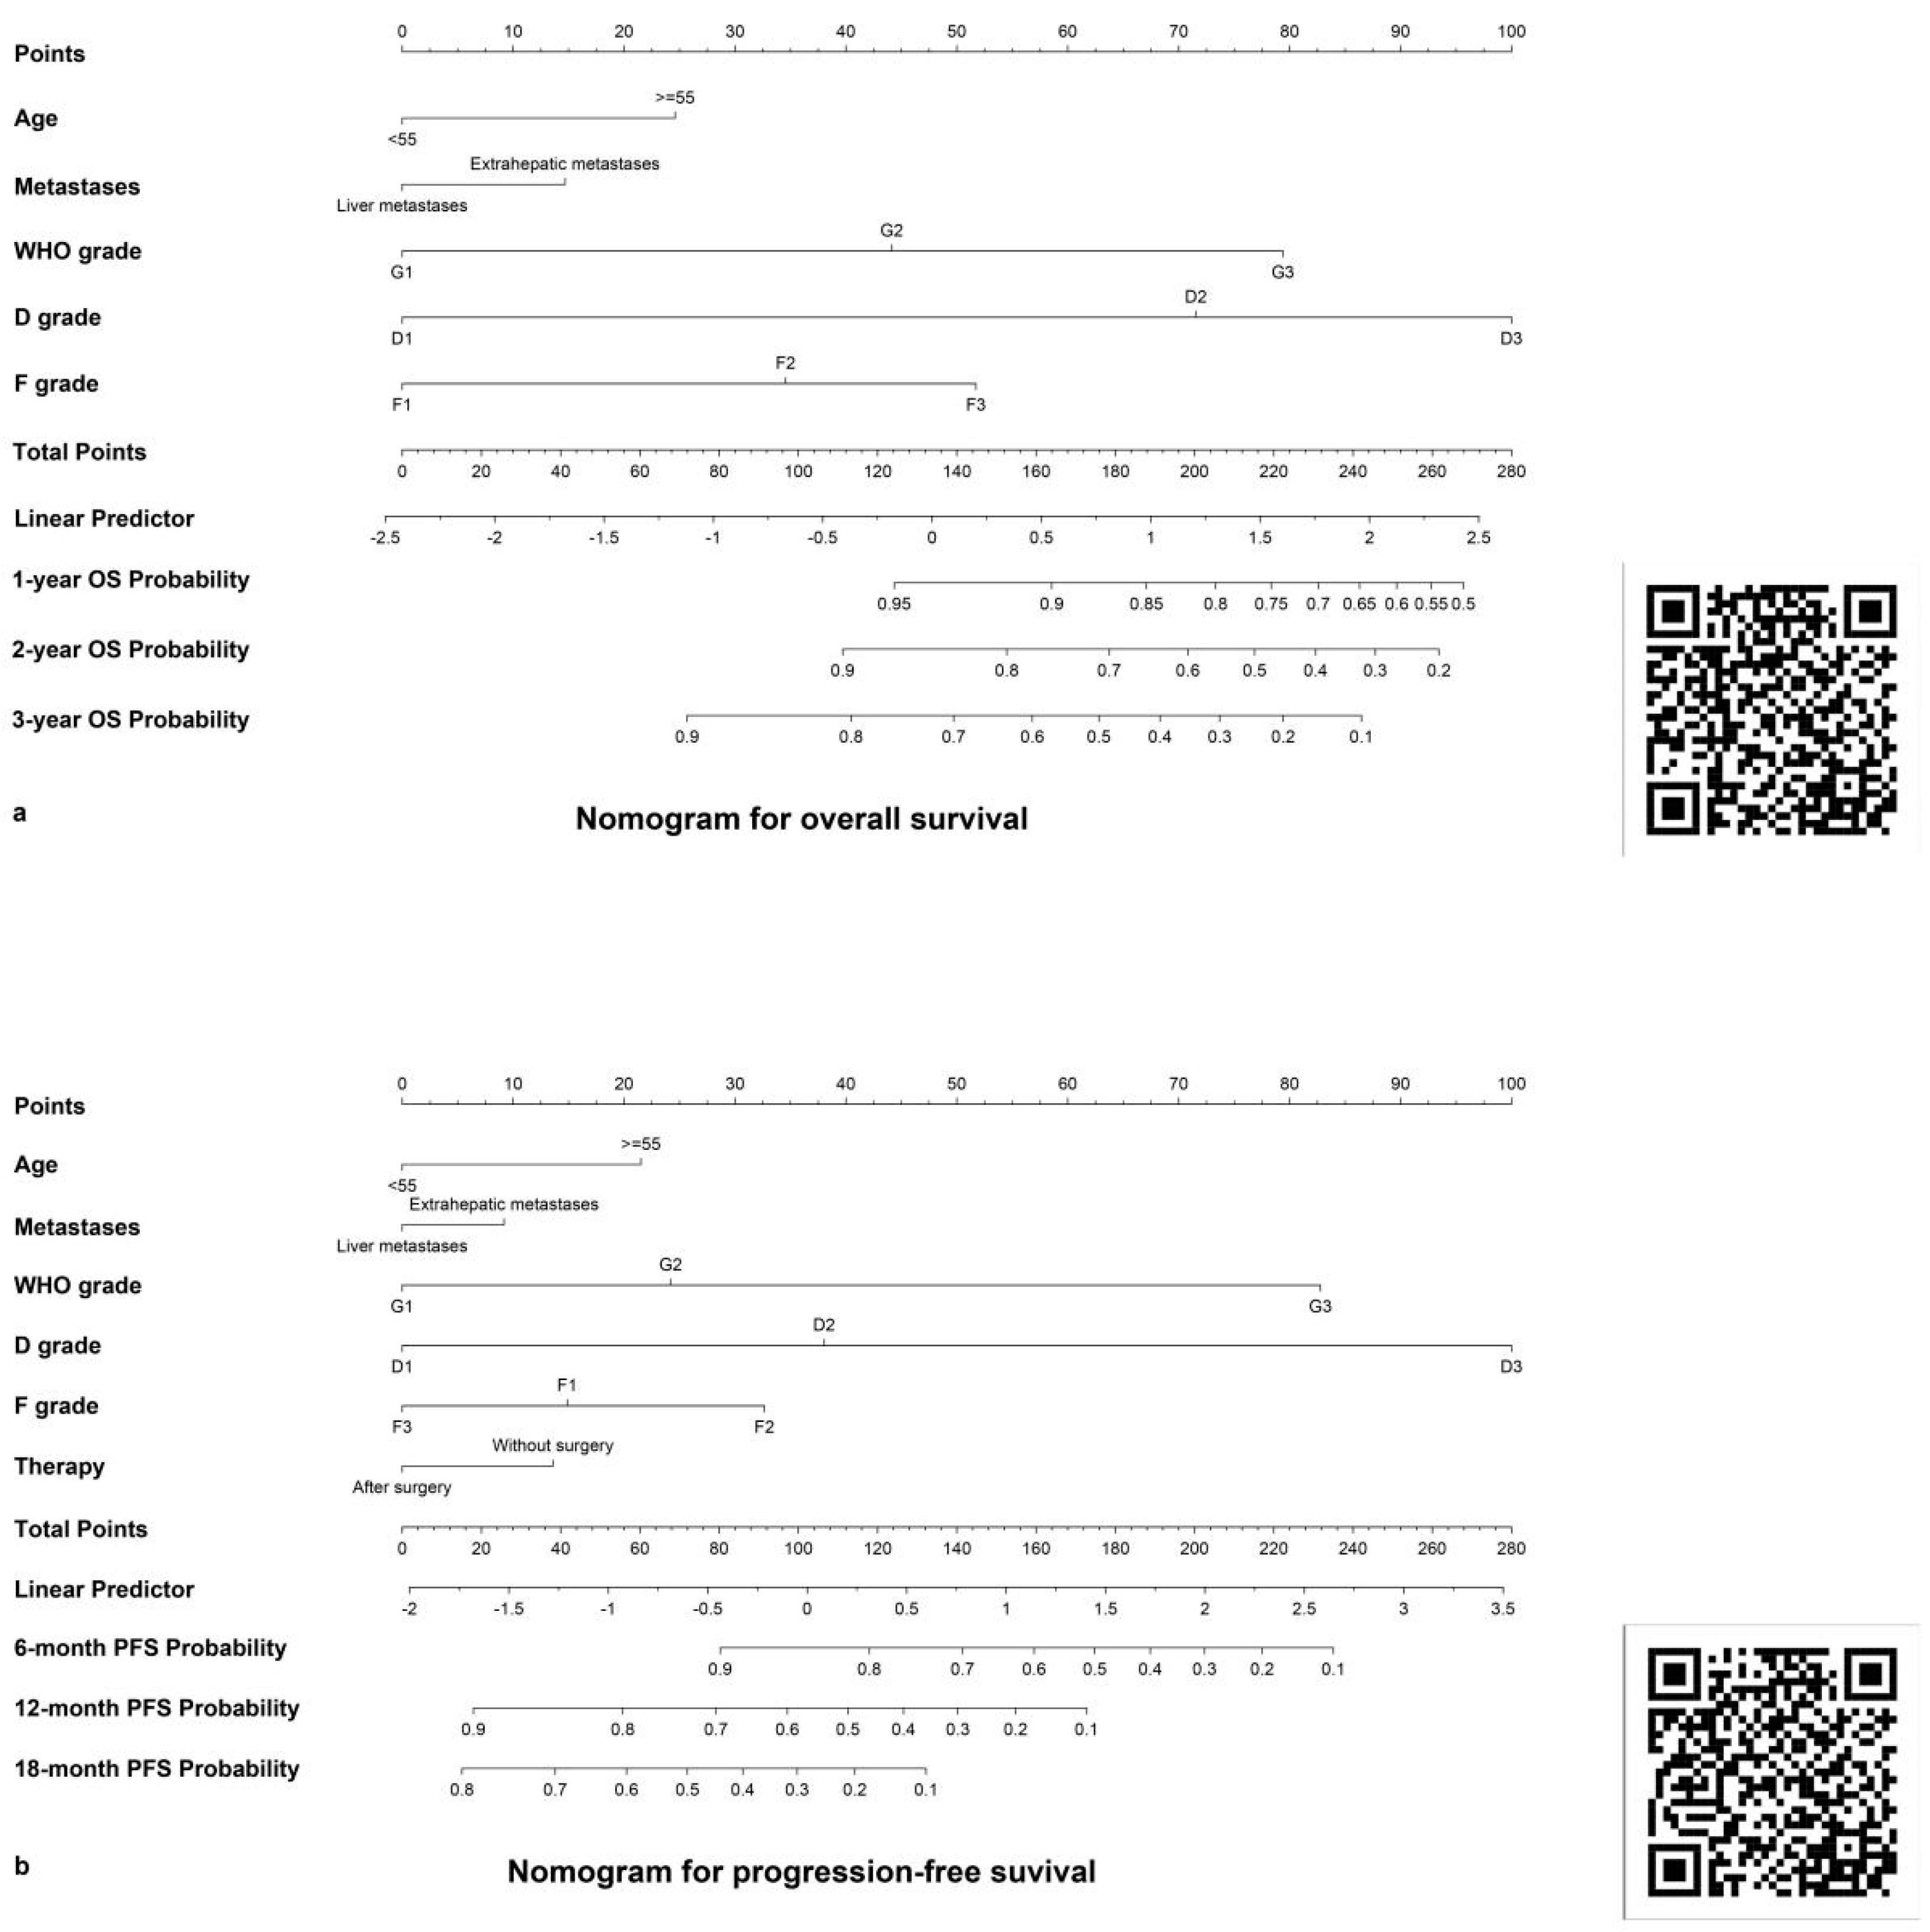
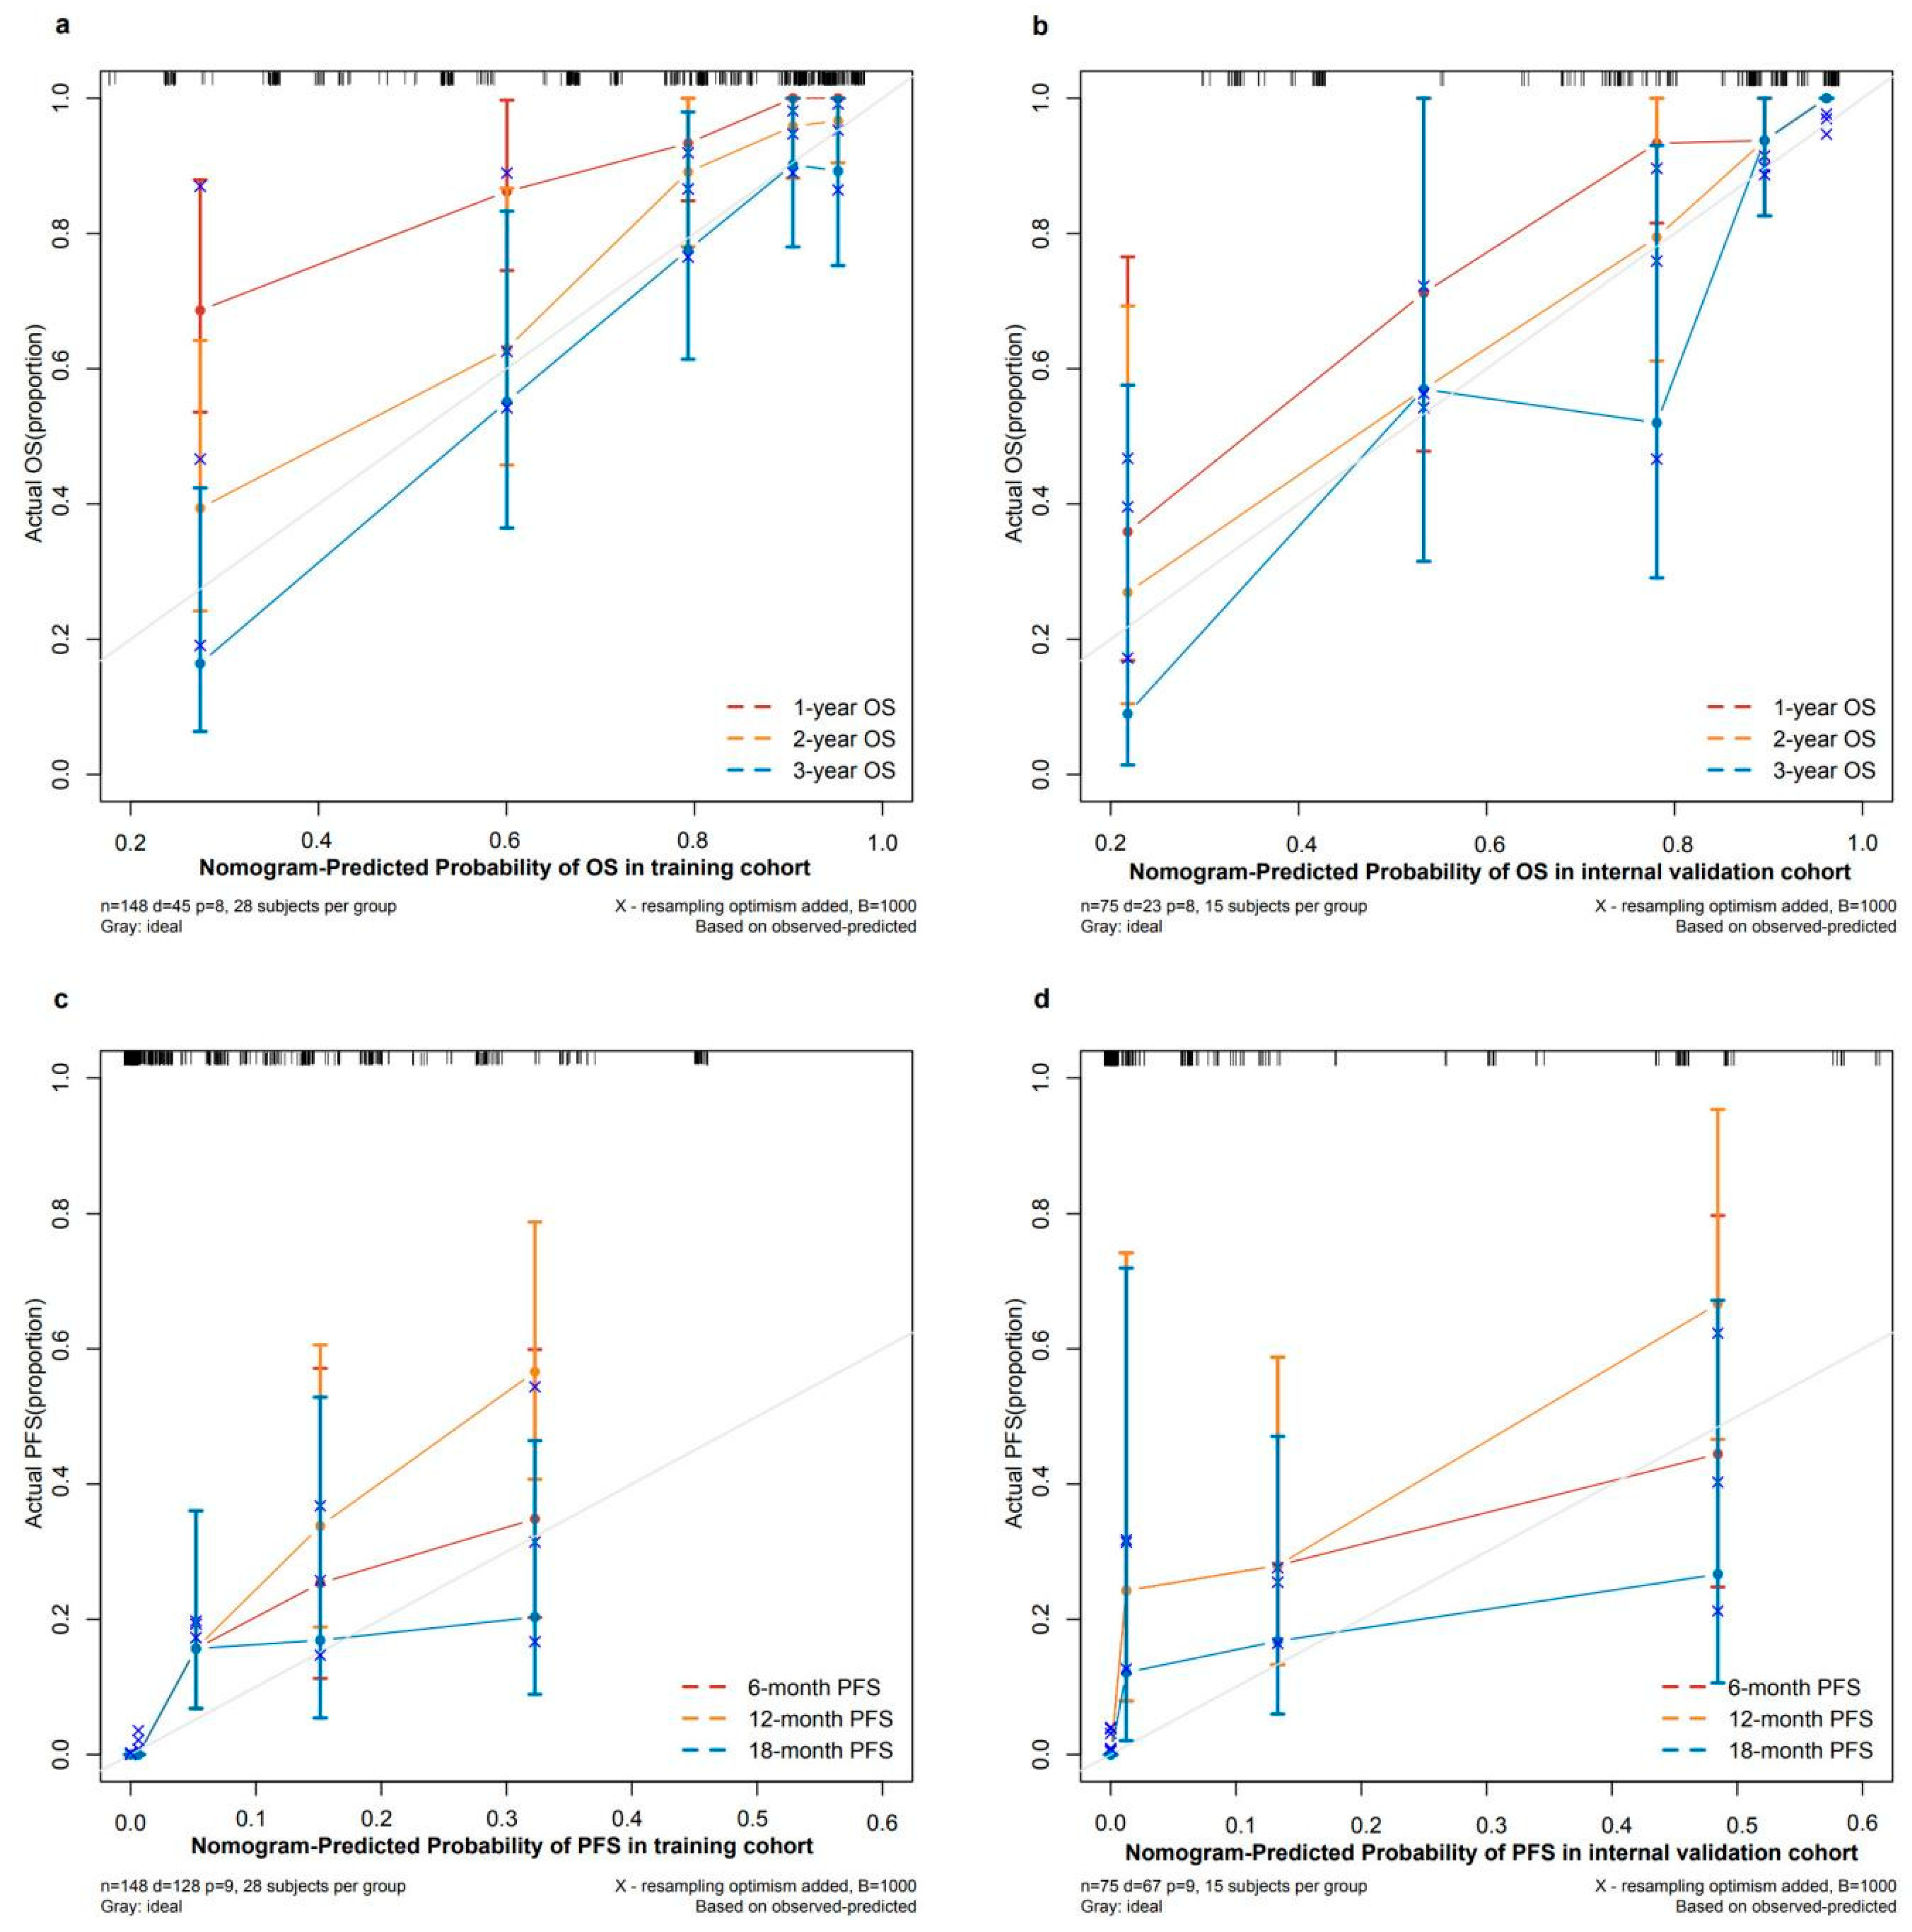
2.5. Construction and Validation of the Nomograms
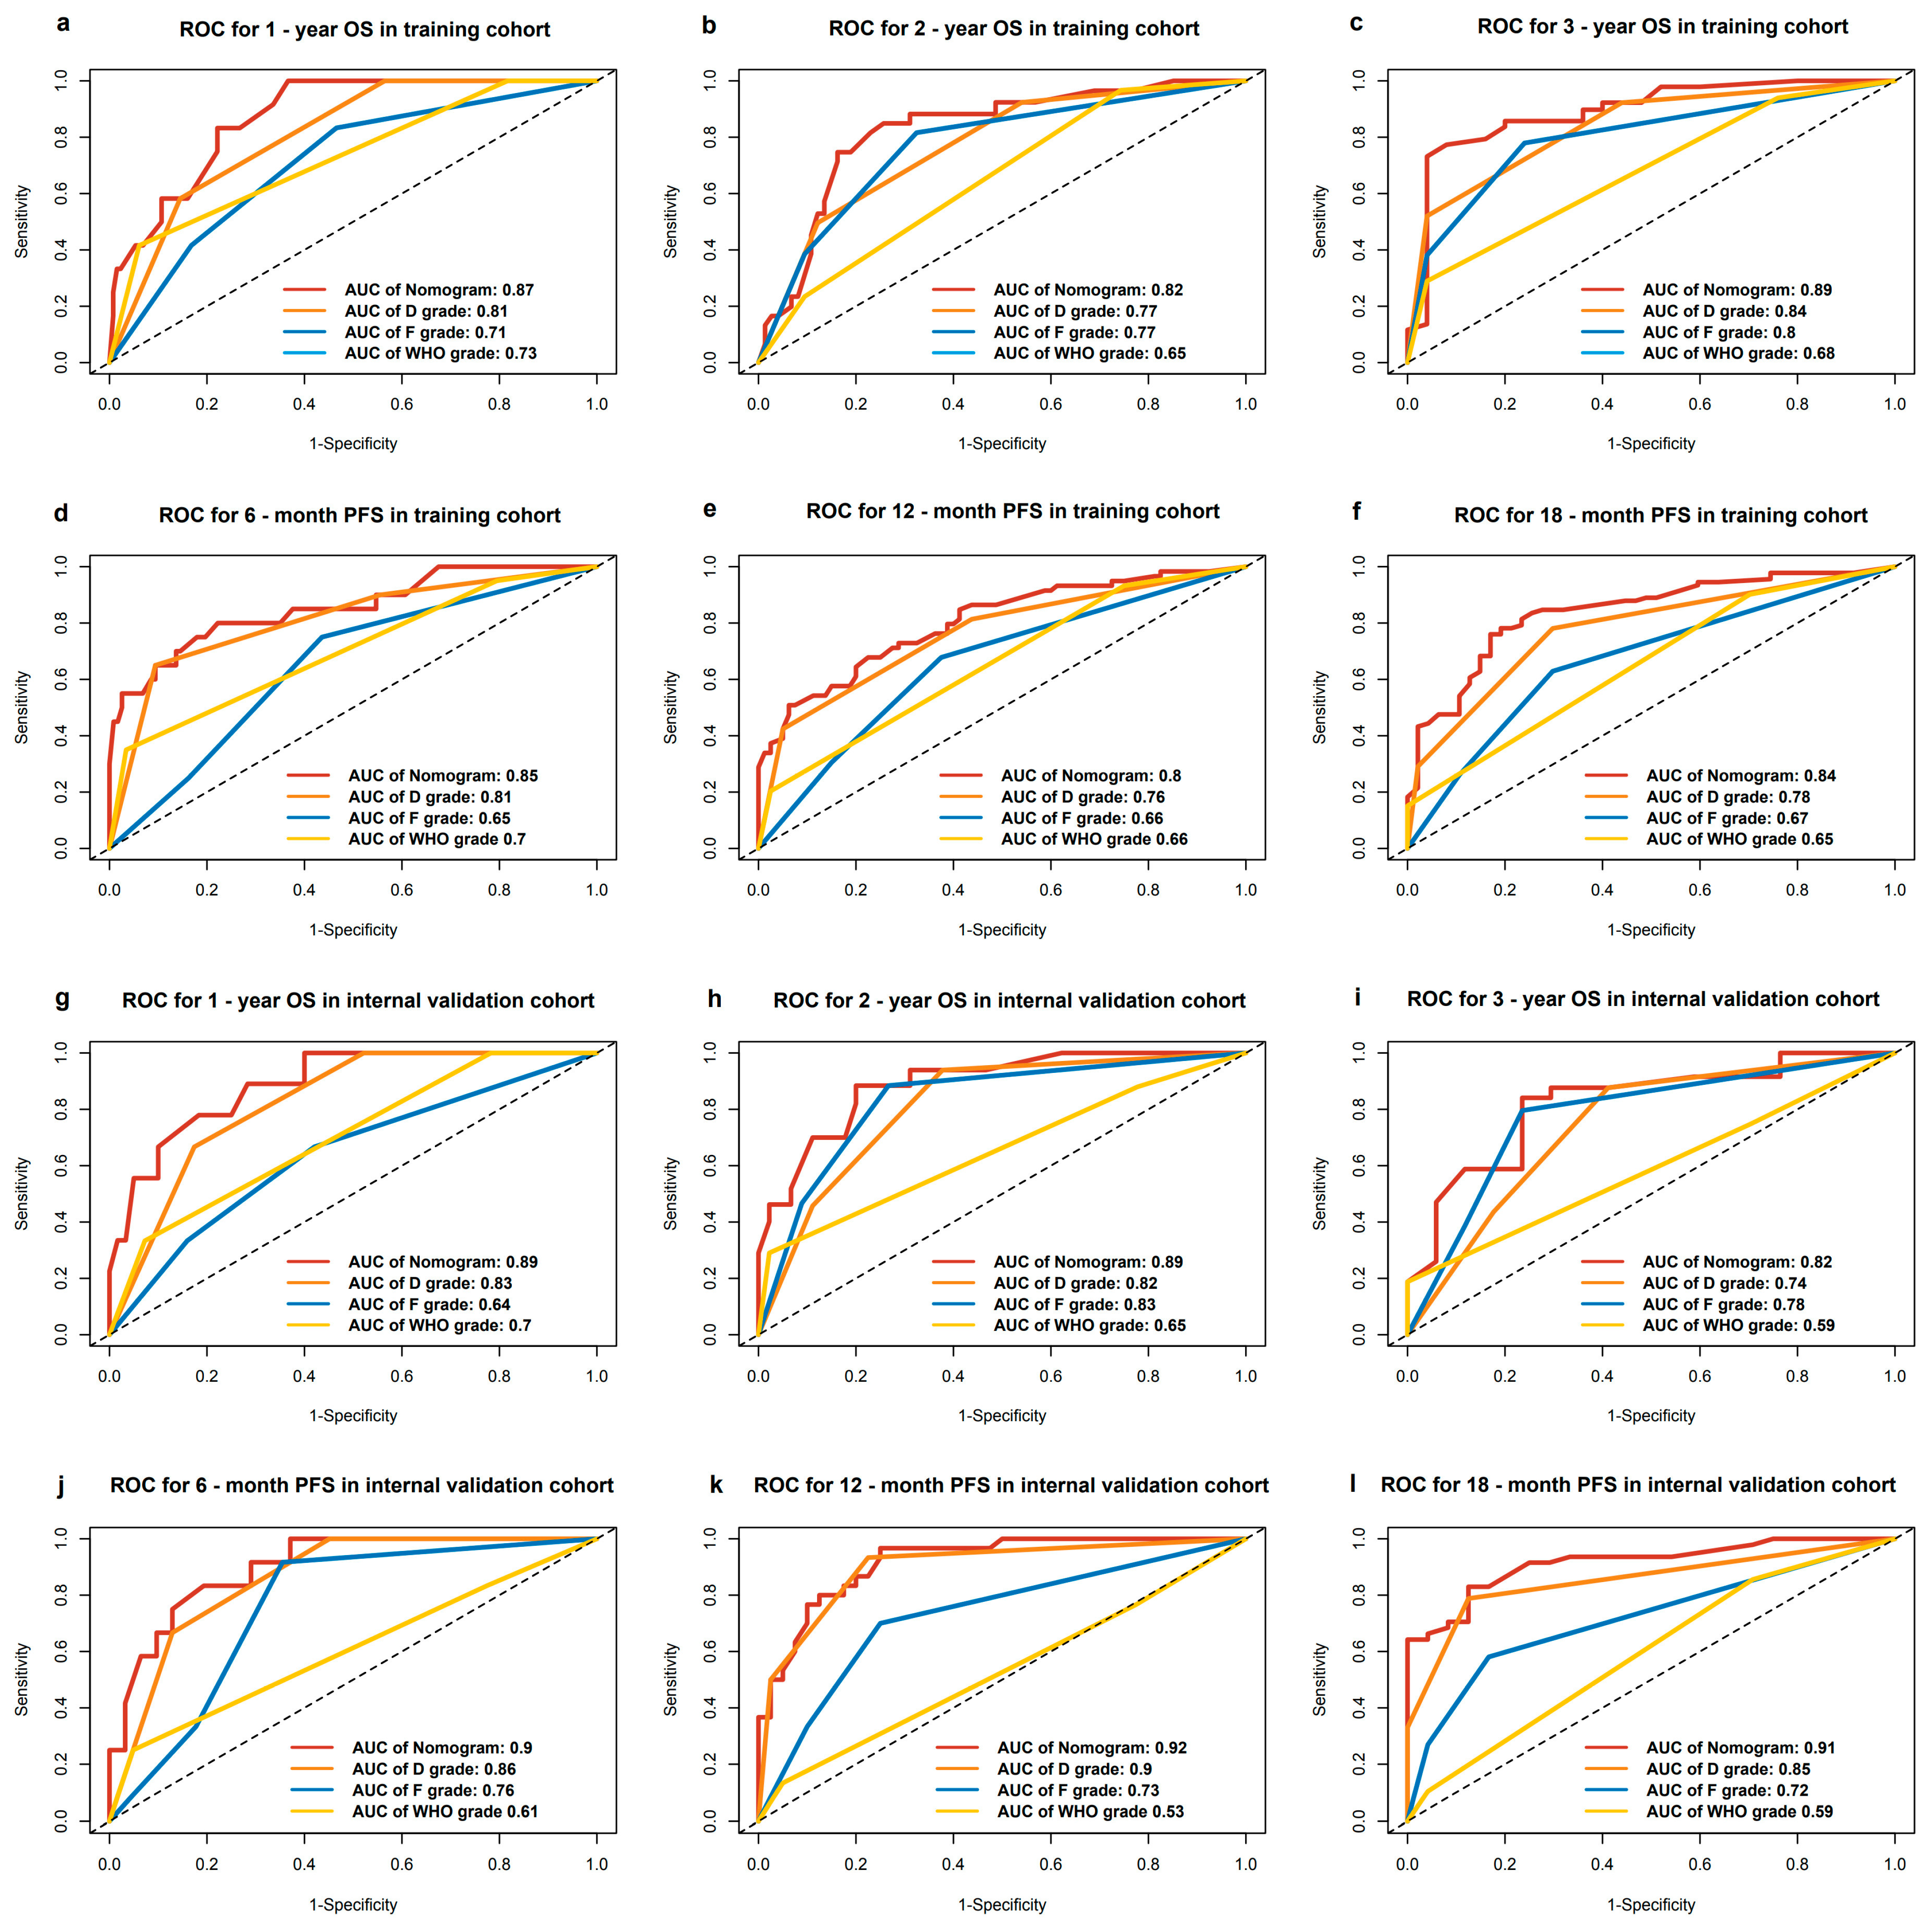
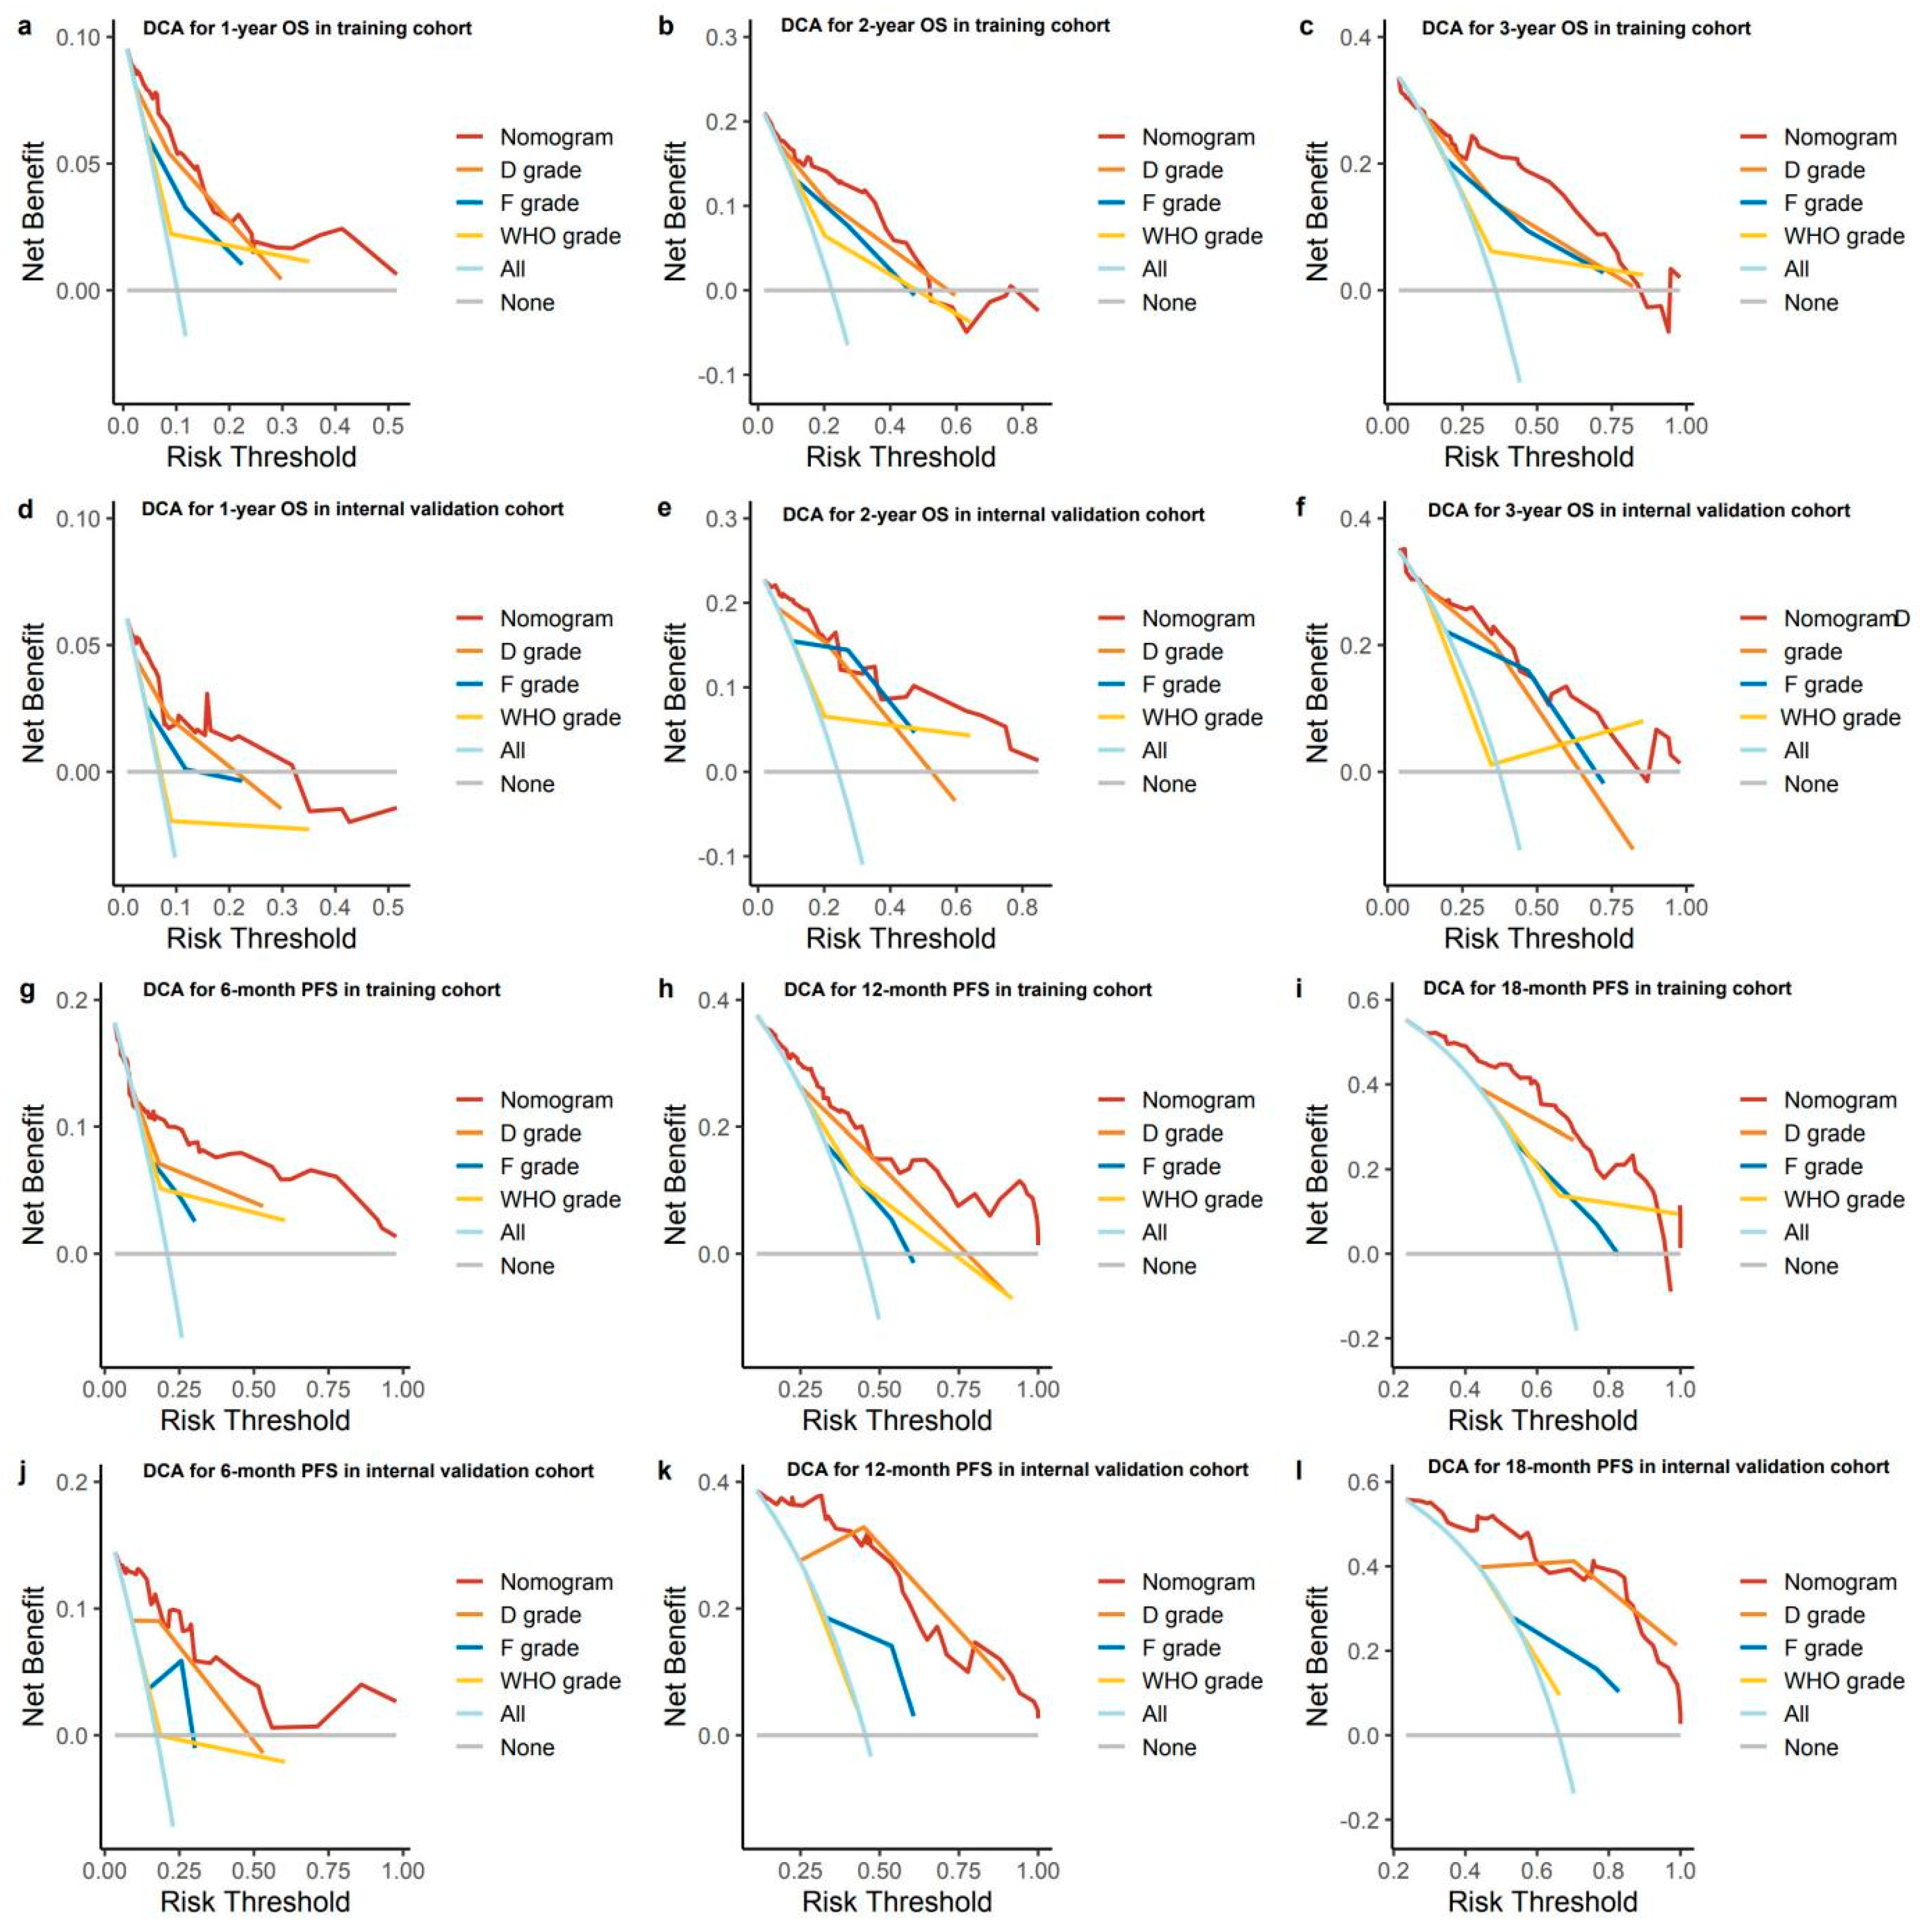
2.6. Validating and Comparing the Prognostic Value of Nomogram, D Grading System, F Grading System, and WHO Grading System
2.7. Establishment of New Risk Classification and Online Models for Convenient Clinical Use
3. Discussion
4. Materials and Methods
4.1. PET/CT Imaging Information Acquisition and Analyses
4.2. Treatment and Follow-Up
4.3. Statistical Analyses
4.4. The Construction of a Portable Nomogram
5. Conclusions
Supplementary Materials
Author Contributions
Funding
Institutional Review Board Statement
Informed Consent Statement
Data Availability Statement
Conflicts of Interest
References
- Shah, M.H.; Goldner, W.S.; Halfdanarson, T.R.; Bergsland, E.; Berlin, J.D.; Halperin, D.; Chan, J.; Kulke, M.H.; Benson, A.B.; Blaszkowsky, L.S.; et al. NCCN Guidelines Insights: Neuroendocrine and Adrenal Tumors, Version 2.2018. J. Natl. Compr. Cancer Netw. 2018, 16, 693–702. [Google Scholar] [CrossRef]
- Dasari, A.; Shen, C.; Halperin, D.; Zhao, B.; Zhou, S.; Xu, Y.; Shih, T.; Yao, J.C. Trends in the Incidence, Prevalence, and Survival Outcomes in Patients With Neuroendocrine Tumors in the United States. JAMA Oncol. 2017, 3, 1335–1342. [Google Scholar] [CrossRef] [PubMed]
- Xu, Z.; Wang, L.; Dai, S.; Chen, M.; Li, F.; Sun, J.; Luo, F. Epidemiologic Trends of and Factors Associated With Overall Survival for Patients With Gastroenteropancreatic Neuroendocrine Tumors in the United States. JAMA Netw. Open 2021, 4, e2124750. [Google Scholar] [CrossRef] [PubMed]
- Klöppel, G. Classification and pathology of gastroenteropancreatic neuroendocrine neoplasms. Endocr. Relat. Cancer 2011, 18 (Suppl. 1), S1–S16. [Google Scholar] [CrossRef]
- Lawrence, B.; Gustafsson, B.I.; Chan, A.; Svejda, B.; Kidd, M.; Modlin, I.M. The epidemiology of gastroenteropancreatic neuroendocrine tumors. Endocrinol. Metab. Clin. N. Am. 2011, 40, 1–18. [Google Scholar] [CrossRef]
- Riihimäki, M.; Hemminki, A.; Sundquist, K.; Sundquist, J.; Hemminki, K. The epidemiology of metastases in neuroendocrine tumors. Int. J. Cancer 2016, 139, 2679–2686. [Google Scholar] [CrossRef]
- Fazio, N.; Milione, M. Heterogeneity of grade 3 gastroenteropancreatic neuroendocrine carcinomas: New insights and treatment implications. Cancer Treat. Rev. 2016, 50, 61–67. [Google Scholar] [CrossRef] [PubMed]
- Pellat, A.; Cottereau, A.S.; Terris, B.; Coriat, R. Neuroendocrine Carcinomas of the Digestive Tract: What Is New? Cancers 2021, 13, 3766. [Google Scholar] [CrossRef]
- Pavel, M.; Öberg, K.; Falconi, M.; Krenning, E.P.; Sundin, A.; Perren, A.; Berruti, A. Gastroenteropancreatic neuroendocrine neoplasms: ESMO Clinical Practice Guidelines for diagnosis, treatment and follow-up. Ann. Oncol. 2020, 31, 844–860. [Google Scholar] [CrossRef]
- Kidd, M.; Modlin, I.; Öberg, K. Towards a new classification of gastroenteropancreatic neuroendocrine neoplasms. Nat. Rev. Clin. Oncol. 2016, 13, 691–705. [Google Scholar] [CrossRef]
- Boellaard, R.; Delgado-Bolton, R.; Oyen, W.J.G.; Giammarile, F.; Tatsch, K.; Eschner, W.; Verzijlbergen, F.J.; Barrington, S.F.; Pike, L.C.; Weber, W.A.; et al. FDG PET/CT: EANM procedure guidelines for tumour imaging: Version 2.0. Eur. J. Nucl. Med. Mol. Imaging 2015, 42, 328–354. [Google Scholar] [CrossRef]
- Aberle, D.R.; Chiles, C.; Gatsonis, C.; Hillman, B.J.; Johnson, C.D.; McClennan, B.L.; Mitchell, D.G.; Pisano, E.D.; Schnall, M.D.; Sorensen, A.G. Imaging and cancer: Research strategy of the American College of Radiology Imaging Network. Radiology 2005, 235, 741–751. [Google Scholar] [CrossRef]
- Bastiaannet, E.; Groen, H.; Jager, P.L.; Cobben, D.C.P.; van der Graaf, W.T.A.; Vaalburg, W.; Hoekstra, H.J. The value of FDG-PET in the detection, grading and response to therapy of soft tissue and bone sarcomas; a systematic review and meta-analysis. Cancer Treat. Rev. 2004, 30, 83–101. [Google Scholar] [CrossRef]
- Borst, G.R.; Belderbos, J.S.A.; Boellaard, R.; Comans, E.F.I.; De Jaeger, K.; Lammertsma, A.A.; Lebesque, J.V. Standardised FDG uptake: A prognostic factor for inoperable non-small cell lung cancer. Eur. J. Cancer 2005, 41, 1533–1541. [Google Scholar] [CrossRef]
- Kwekkeboom, D.J.; Krenning, E.P.; Scheidhauer, K.; Lewington, V.; Lebtahi, R.; Grossman, A.; Vitek, P.; Sundin, A.; Plöckinger, U. ENETS Consensus Guidelines for the Standards of Care in Neuroendocrine Tumors: Somatostatin receptor imaging with (111)In-pentetreotide. Neuroendocrinology 2009, 90, 184–189. [Google Scholar] [CrossRef]
- Antunes, P.; Ginj, M.; Zhang, H.; Waser, B.; Baum, R.P.; Reubi, J.C.; Maecke, H. Are radiogallium-labelled DOTA-conjugated somatostatin analogues superior to those labelled with other radiometals? Eur. J. Nucl. Med. Mol. Imaging 2007, 34, 982–993. [Google Scholar] [CrossRef]
- Oberg, K.E.; Reubi, J.-C.; Kwekkeboom, D.J.; Krenning, E.P. Role of somatostatins in gastroenteropancreatic neuroendocrine tumor development and therapy. Gastroenterology 2010, 139, 742–753.e1. [Google Scholar] [CrossRef] [PubMed]
- Buchmann, I.; Henze, M.; Engelbrecht, S.; Eisenhut, M.; Runz, A.; Schäfer, M.; Schilling, T.; Haufe, S.; Herrmann, T.; Haberkorn, U. Comparison of 68Ga-DOTATOC PET and 111In-DTPAOC (Octreoscan) SPECT in patients with neuroendocrine tumours. Eur. J. Nucl. Med. Mol. Imaging 2007, 34, 1617–1626. [Google Scholar] [CrossRef]
- Sadowski, S.M.; Neychev, V.; Millo, C.; Shih, J.; Nilubol, N.; Herscovitch, P.; Pacak, K.; Marx, S.J.; Kebebew, E. Prospective Study of 68Ga-DOTATATE Positron Emission Tomography/Computed Tomography for Detecting Gastro-Entero-Pancreatic Neuroendocrine Tumors and Unknown Primary Sites. J. Clin. Oncol. 2016, 34, 588–596. [Google Scholar] [CrossRef] [PubMed]
- Refardt, J.; Hofland, J.; Kwadwo, A.; Nicolas, G.P.; Rottenburger, C.; Fani, M.; Wild, D.; Christ, E. Theranostics in neuroendocrine tumors: An overview of current approaches and future challenges. Rev. Endocr. Metab. Disord. 2021, 22, 581–594. [Google Scholar] [CrossRef] [PubMed]
- Skoura, E.; Michopoulou, S.; Mohmaduvesh, M.; Panagiotidis, E.; Al Harbi, M.; Toumpanakis, C.; Almukhailed, O.; Kayani, I.; Syed, R.; Navalkissoor, S.; et al. The Impact of 68Ga-DOTATATE PET/CT Imaging on Management of Patients with Neuroendocrine Tumors: Experience from a National Referral Center in the United Kingdom. J. Nucl. Med. 2016, 57, 34–40. [Google Scholar] [CrossRef]
- Tirosh, A.; Kebebew, E. The utility of 68Ga-DOTATATE positron-emission tomography/computed tomography in the diagnosis, management, follow-up and prognosis of neuroendocrine tumors. Future Oncol. 2018, 14, 111–122. [Google Scholar] [CrossRef]
- Campana, D.; Ambrosini, V.; Pezzilli, R.; Fanti, S.; Labate, A.M.M.; Santini, D.; Ceccarelli, C.; Nori, F.; Franchi, R.; Corinaldesi, R.; et al. Standardized uptake values of (68)Ga-DOTANOC PET: A promising prognostic tool in neuroendocrine tumors. J. Nucl. Med. 2010, 51, 353–359. [Google Scholar] [CrossRef] [PubMed]
- Gabriel, M.; Oberauer, A.; Dobrozemsky, G.; Decristoforo, C.; Putzer, D.; Kendler, D.; Uprimny, C.; Kovacs, P.; Bale, R.; Virgolini, I.J. 68Ga-DOTA-Tyr3-octreotide PET for assessing response to somatostatin-receptor-mediated radionuclide therapy. J. Nucl. Med. 2009, 50, 1427–1434. [Google Scholar] [CrossRef] [PubMed]
- Binderup, T.; Knigge, U.; Loft, A.; Federspiel, B.; Kjaer, A. 18F-fluorodeoxyglucose positron emission tomography predicts survival of patients with neuroendocrine tumors. Clin. Cancer Res. 2010, 16, 978–985. [Google Scholar] [CrossRef] [PubMed]
- Langen Stokmo, H.; Aly, M.; Bowitz Lothe, I.M.; Borja, A.J.; Mehdizadeh Seraj, S.; Ghorpade, R.; Miao, X.; Hjortland, G.O.; Malinen, E.; Sorbye, H.; et al. Volumetric parameters from [18 F]FDG PET/CT predicts survival in patients with high-grade gastroenteropancreatic neuroendocrine neoplasms. J. Neuroendocrinol. 2022, 34, e13170. [Google Scholar] [CrossRef] [PubMed]
- Thapa, P.; Ranade, R.; Ostwal, V.; Shrikhande, S.V.; Goel, M.; Basu, S. Performance of 177Lu-DOTATATE-based peptide receptor radionuclide therapy in metastatic gastroenteropancreatic neuroendocrine tumor: A multiparametric response evaluation correlating with primary tumor site, tumor proliferation index, and dual tracer imaging characteristics. Nucl. Med. Commun. 2016, 37, 1030–1037. [Google Scholar]
- Ambrosini, V.; Campana, D.; Polverari, G.; Peterle, C.; Diodato, S.; Ricci, C.; Allegri, V.; Casadei, R.; Tomassetti, P.; Fanti, S. Prognostic Value of 68Ga-DOTANOC PET/CT SUVmax in Patients with Neuroendocrine Tumors of the Pancreas. J. Nucl. Med. 2015, 56, 1843–1848. [Google Scholar] [CrossRef]
- Chan, D.L.; Pavlakis, N.; Schembri, G.P.; Bernard, E.J.; Hsiao, E.; Hayes, A.; Barnes, T.; Diakos, C.; Khasraw, M.; Samra, J.; et al. Dual Somatostatin Receptor/FDG PET/CT Imaging in Metastatic Neuroendocrine Tumours: Proposal for a Novel Grading Scheme with Prognostic Significance. Theranostics 2017, 7, 1149–1158. [Google Scholar] [CrossRef]
- Hindié, E. The NETPET Score: Combining FDG and Somatostatin Receptor Imaging for Optimal Management of Patients with Metastatic Well-Differentiated Neuroendocrine Tumors. Theranostics 2017, 7, 1159–1163. [Google Scholar] [CrossRef]
- Has Simsek, D.; Kuyumcu, S.; Turkmen, C.; Sanlı, Y.; Aykan, F.; Unal, S.; Adalet, I. Can complementary 68Ga-DOTATATE and 18F-FDG PET/CT establish the missing link between histopathology and therapeutic approach in gastroenteropancreatic neuroendocrine tumors? J. Nucl. Med. 2014, 55, 1811–1817. [Google Scholar] [CrossRef]
- Rindi, G.; Wiedenmann, B. Neuroendocrine neoplasms of the gut and pancreas: New insights. Nat. Rev. Endocrinol. 2011, 8, 54–64. [Google Scholar] [CrossRef]
- Virgolini, I.; Ambrosini, V.; Bomanji, J.B.; Baum, R.P.; Fanti, S.; Gabriel, M.; Papathanasiou, N.D.; Pepe, G.; Oyen, W.; De Cristoforo, C.; et al. Procedure guidelines for PET/CT tumour imaging with 68Ga-DOTA-conjugated peptides: 68Ga-DOTA-TOC, 68Ga-DOTA-NOC, 68Ga-DOTA-TATE. Eur. J. Nucl. Med. Mol. Imaging 2010, 37, 2004–2010. [Google Scholar] [CrossRef] [PubMed]
- Treglia, G.; Castaldi, P.; Rindi, G.; Giordano, A.; Rufini, V. Diagnostic performance of Gallium-68 somatostatin receptor PET and PET/CT in patients with thoracic and gastroenteropancreatic neuroendocrine tumours: A meta-analysis. Endocrine 2012, 42, 80–87. [Google Scholar] [CrossRef]
- Ambrosini, V.; Campana, D.; Tomassetti, P.; Fanti, S. 68Ga-labelled peptides for diagnosis of gastroenteropancreatic NET. Eur. J. Nucl. Med. Mol. Imaging 2012, 39 (Suppl. 1), S52–S60. [Google Scholar] [CrossRef] [PubMed]
- Ambrosini, V.; Zanoni, L.; Filice, A.; Lamberti, G.; Argalia, G.; Fortunati, E.; Campana, D.; Versari, A.; Fanti, S. Radiolabeled Somatostatin Analogues for Diagnosis and Treatment of Neuroendocrine Tumors. Cancers 2022, 14, 1055. [Google Scholar] [CrossRef] [PubMed]
- van Essen, M.; Sundin, A.; Krenning, E.P.; Kwekkeboom, D.J. Neuroendocrine tumours: The role of imaging for diagnosis and therapy. Nat. Rev. Endocrinol. 2014, 10, 102–114. [Google Scholar] [CrossRef]
- Panda, A.; Garg, I.; Johnson, G.B.; Truty, M.J.; Halfdanarson, T.R.; Goenka, A.H. Molecular radionuclide imaging of pancreatic neoplasms. Lancet Gastroenterol. Hepatol. 2019, 4, 559–570. [Google Scholar] [CrossRef]
- Ambrosini, V.; Kunikowska, J.; Baudin, E.; Bodei, L.; Bouvier, C.; Capdevila, J.; Cremonesi, M.; de Herder, W.W.; Dromain, C.; Falconi, M.; et al. Consensus on molecular imaging and theranostics in neuroendocrine neoplasms. Eur. J. Cancer 2021, 146, 56–73. [Google Scholar] [CrossRef]
- Kayani, I.; Bomanji, J.B.; Groves, A.; Conway, G.; Gacinovic, S.; Win, T.; Dickson, J.; Caplin, M.; Ell, P.J. Functional imaging of neuroendocrine tumors with combined PET/CT using 68Ga-DOTATATE (DOTA-DPhe1,Tyr3-octreotate) and 18F-FDG. Cancer 2008, 112, 2447–2455. [Google Scholar] [CrossRef]
- Chan, D.L.; Hayes, A.R.; Karfis, I.; Conner, A.; Furtado O’Mahony, L.; Mileva, M.; Bernard, E.; Roach, P.; Marin, G.; Pavlakis, N.; et al. Dual [68Ga]DOTATATE and [18F]FDG PET/CT in patients with metastatic gastroenteropancreatic neuroendocrine neoplasms: A multicentre validation of the NETPET score. Br. J. Cancer 2023, 128, 549–555. [Google Scholar] [CrossRef] [PubMed]
- Chan, D.L.; Ulaner, G.A.; Pattison, D.; Wyld, D.; Ladwa, R.; Kirchner, J.; Li, B.T.; Lai, W.V.; Pavlakis, N.; Roach, P.J.; et al. Dual PET Imaging in Bronchial Neuroendocrine Neoplasms: The NETPET Score as a Prognostic Biomarker. J. Nucl. Med. 2021, 62, 1278–1284. [Google Scholar] [CrossRef]
- Tirosh, A.; Papadakis, G.Z.; Millo, C.; Hammoud, D.; Sadowski, S.M.; Herscovitch, P.; Pacak, K.; Marx, S.J.; Yang, L.; Nockel, P.; et al. Prognostic Utility of Total 68Ga-DOTATATE-Avid Tumor Volume in Patients With Neuroendocrine Tumors. Gastroenterology 2018, 154, 998–1008.e1. [Google Scholar] [CrossRef] [PubMed]
- Toriihara, A.; Baratto, L.; Nobashi, T.; Park, S.; Hatami, N.; Davidzon, G.; Kunz, P.L.; Iagaru, A. Prognostic value of somatostatin receptor expressing tumor volume calculated from 68Ga-DOTATATE PET/CT in patients with well-differentiated neuroendocrine tumors. Eur. J. Nucl. Med. Mol. Imaging 2019, 46, 2244–2251. [Google Scholar] [CrossRef]
- Zhang, J.; Liu, Q.; Singh, A.; Schuchardt, C.; Kulkarni, H.R.; Baum, R.P. Prognostic Value of 18F-FDG PET/CT in a Large Cohort of Patients with Advanced Metastatic Neuroendocrine Neoplasms Treated with Peptide Receptor Radionuclide Therapy. J. Nucl. Med. 2020, 61, 1560–1569. [Google Scholar] [CrossRef]
- Huang, D.; Wu, J.; Zhong, H.; Li, Y.; Han, Y.; He, Y.; Chen, Y.; Lin, S.; Pang, H. [68Ga]Ga-FAPI PET for the evaluation of digestive system tumors: Systematic review and meta-analysis. Eur. J. Nucl. Med. Mol. Imaging 2023, 50, 908–920. [Google Scholar] [CrossRef]
- Lee, H.; Nakamoto, R.; Moore, S.E.; Pantel, A.R.; Eads, J.R.; Aparici, C.M.; Pryma, D.A. Combined Quantification of 18F-FDG and 68Ga-DOTATATE PET/CT for Prognosis in High-Grade Gastroenteropancreatic Neuroendocrine Neoplasms. Acad. Radiol. 2022, 29, 1308–1316. [Google Scholar] [CrossRef]
- Rossi, R.E.; Ciafardini, C.; Sciola, V.; Conte, D.; Massironi, S. Chromogranin A in the Follow-up of Gastroenteropancreatic Neuroendocrine Neoplasms: Is It Really Game Over? A Systematic Review and Meta-analysis. Pancreas 2018, 47, 1249–1255. [Google Scholar] [CrossRef]
- Massironi, S.; Conte, D.; Sciola, V.; Spampatti, M.P.; Ciafardini, C.; Valenti, L.; Rossi, R.E.; Peracchi, M. Plasma chromogranin A response to octreotide test: Prognostic value for clinical outcome in endocrine digestive tumors. Am. J. Gastroenterol. 2010, 105, 2072–2078. [Google Scholar] [CrossRef] [PubMed]
- Malczewska, A.; Kos-Kudła, B.; Kidd, M.; Drozdov, I.; Bodei, L.; Matar, S.; Oberg, K.; Modlin, I.M. The clinical applications of a multigene liquid biopsy (NETest) in neuroendocrine tumors. Adv. Med. Sci. 2020, 65, 18–29. [Google Scholar] [CrossRef] [PubMed]
- Modlin, I.M.; Kidd, M.; Malczewska, A.; Drozdov, I.; Bodei, L.; Matar, S.; Chung, K.-M. The NETest: The Clinical Utility of Multigene Blood Analysis in the Diagnosis and Management of Neuroendocrine Tumors. Endocrinol. Metab. Clin. N. Am. 2018, 47, 485–504. [Google Scholar] [CrossRef]
- van Treijen, M.J.C.; van der Zee, D.; Heeres, B.C.; Staal, F.C.R.; Vriens, M.R.; Saveur, L.J.; Verbeek, W.H.M.; Korse, C.M.; Maas, M.; Valk, G.D.; et al. Blood Molecular Genomic Analysis Predicts the Disease Course of Gastroenteropancreatic Neuroendocrine Tumor Patients: A Validation Study of the Predictive Value of the NETest®. Neuroendocrinology 2021, 111, 586–598. [Google Scholar] [CrossRef] [PubMed]
- Modlin, I.M.; Kidd, M.; Frilling, A.; Falconi, M.; Filosso, P.L.; Malczewska, A.; Kitz, A. Molecular Genomic Assessment Using a Blood-based mRNA Signature (NETest) is Cost-effective and Predicts Neuroendocrine Tumor Recurrence With 94% Accuracy. Ann. Surg. 2021, 274, 481–490. [Google Scholar] [CrossRef]
- Malczewska, A.; Kidd, M.; Matar, S.; Kos-Kudła, B.; Bodei, L.; Oberg, K.; Modlin, I.M. An Assessment of Circulating Chromogranin A as a Biomarker of Bronchopulmonary Neuroendocrine Neoplasia: A Systematic Review and Meta-Analysis. Neuroendocrinology 2020, 110, 198–216. [Google Scholar] [CrossRef] [PubMed]
- Lv, Y.; Han, X.; Xu, X.-F.; Ji, Y.; Zhou, Y.-H.; Sun, H.-C.; Zhou, J.; Fan, J.; Lou, W.-H.; Huang, C. Risk factors affecting prognosis in metachronous liver metastases from WHO classification G1 and G2 gastroenteropancreatic neuroendocrine tumors after initial R0 surgical resection. BMC Cancer 2019, 19, 335. [Google Scholar] [CrossRef]
- Zhao, F.; Huang, L.; Wang, Z.; Wei, F.; Xiao, T.; Liu, Q. Epidemiological trends and novel prognostic evaluation approaches of patients with stage II-IV colorectal neuroendocrine neoplasms: A population-based study with external validation. Front. Endocrinol. 2023, 14, 1061187. [Google Scholar] [CrossRef] [PubMed]
- Xie, S.; Li, L.; Wang, X.; Li, L. Development and validation of a nomogram for predicting the overall survival of patients with gastroenteropancreatic neuroendocrine neoplasms. Medicine 2021, 100, e24223. [Google Scholar] [CrossRef]
- Xu, G.; Xiao, Y.; Hu, H.; Jin, B.; Wu, X.a.; Wan, X.; Zheng, Y.; Xu, H.; Lu, X.; Sang, X.; et al. A Nomogram to Predict Individual Survival of Patients with Liver-Limited Metastases from Gastroenteropancreatic Neuroendocrine Neoplasms: A US Population-Based Cohort Analysis and Chinese Multicenter Cohort Validation Study. Neuroendocrinology 2022, 112, 263–275. [Google Scholar] [CrossRef] [PubMed]
- Berghmans, T.; Dusart, M.; Paesmans, M.; Hossein-Foucher, C.; Buvat, I.; Castaigne, C.; Scherpereel, A.; Mascaux, C.; Moreau, M.; Roelandts, M.; et al. Primary tumor standardized uptake value (SUVmax) measured on fluorodeoxyglucose positron emission tomography (FDG-PET) is of prognostic value for survival in non-small cell lung cancer (NSCLC): A systematic review and meta-analysis (MA) by the European Lung Cancer Working Party for the IASLC Lung Cancer Staging Project. J. Thorac. Oncol. 2008, 3, 6–12. [Google Scholar]
- Na, F.; Wang, J.; Li, C.; Deng, L.; Xue, J.; Lu, Y. Primary tumor standardized uptake value measured on F18-Fluorodeoxyglucose positron emission tomography is of prediction value for survival and local control in non-small-cell lung cancer receiving radiotherapy: Meta-analysis. J. Thorac. Oncol. 2014, 9, 834–842. [Google Scholar] [CrossRef]
- Lan, L.; Zhang, S.; Xu, T.; Liu, H.; Wang, W.; Feng, Y.; Wang, L.; Chen, Y.; Qiu, L. Prospective Comparison of 68Ga-FAPI versus 18F-FDG PET/CT for Tumor Staging in Biliary Tract Cancers. Radiology 2022, 304, 648–657. [Google Scholar] [CrossRef]
- Xu, L.; Si, H.; Su, H.; Wang, F.; Wu, J.; She, Y.; Hu, X.; Xie, D.; Zhao, D.; Li, Q.; et al. The number of metastatic lymph nodes is more predictive of prognosis than location-based N stage for nonsmall cell lung cancer: A retrospective cohort study. Int. J. Surg. 2023, 109, 4126–4134. [Google Scholar] [CrossRef] [PubMed]
- Zhang, C.; Zhao, S.; Wang, X. Analysis of the risk factor of insufficient examined lymph nodes in stage II colon cancer from the perspective of stage migration: A retrospective study combined with external validation. Int. J. Surg. 2022, 101, 106628. [Google Scholar] [CrossRef] [PubMed]
- Huang, B.; Feng, Y.; Zhu, L.; Xu, T.; Huang, L.; Cai, G. Smaller tumor size is associated with poor survival in stage II colon cancer: An analysis of 7,719 patients in the SEER database. Int. J. Surg. 2016, 33 Pt. A, 157–163. [Google Scholar] [CrossRef]
- Hallemeier, C.L.; Moughan, J.; Haddock, M.G.; Herskovic, A.M.; Minsky, B.D.; Suntharalingam, M.; Zeitzer, K.L.; Garg, M.K.; Greenwald, B.D.; Komaki, R.U.; et al. Association of Radiotherapy Duration With Clinical Outcomes in Patients With Esophageal Cancer Treated in NRG Oncology Trials: A Secondary Analysis of NRG Oncology Randomized Clinical Trials. JAMA Netw. Open 2023, 6, e238504. [Google Scholar] [CrossRef] [PubMed]
- Eisenhauer, E.A.; Therasse, P.; Bogaerts, J.; Schwartz, L.H.; Sargent, D.; Ford, R.; Dancey, J.; Arbuck, S.; Gwyther, S.; Mooney, M.; et al. New response evaluation criteria in solid tumours: Revised RECIST guideline (version 1.1). Eur. J. Cancer 2009, 45, 228–247. [Google Scholar] [CrossRef] [PubMed]
- Bloniarz, A.; Liu, H.; Zhang, C.-H.; Sekhon, J.S.; Yu, B. Lasso adjustments of treatment effect estimates in randomized experiments. Proc. Natl. Acad. Sci. USA 2016, 113, 7383–7390. [Google Scholar] [CrossRef] [PubMed]
- Liu, M.; Li, Q.; Zhang, J.; Chen, Y. Development and Validation of a Predictive Model Based on LASSO Regression: Predicting the Risk of Early Recurrence of Atrial Fibrillation after Radiofrequency Catheter Ablation. Diagnostics 2023, 13, 3403. [Google Scholar] [CrossRef]


| Characteristics | Total | Training Dataset | Internal Validation Dataset | p-Value |
|---|---|---|---|---|
| (N = 223) | (N = 148) | (N = 75) | ||
| Age | ||||
| <55 | 113 (50.7%) | 78 (52.7%) | 35 (46.7%) | 0.478 |
| ≥55 | 110 (49.3%) | 70 (47.3%) | 40 (53.3%) | |
| Sex | ||||
| Male | 130 (58.3%) | 80 (54.1%) | 50 (66.7%) | 0.097 |
| Female | 93 (41.7%) | 68 (45.9%) | 25 (33.3%) | |
| Primary tumor site | ||||
| Stomach | 33 (14.8%) | 25 (16.9%) | 8 (10.7%) | 0.439 |
| Small intestine | 51 (22.9%) | 34 (23.0%) | 17 (22.7%) | |
| Colorectum | 139 (62.3%) | 89 (60.1%) | 50 (66.7%) | |
| Extrehepatic metastases | ||||
| No | 32 (14.3%) | 25 (16.9%) | 7 (9.3%) | 0.187 |
| Yes | 191 (85.7%) | 123 (83.1%) | 68 (90.7%) | |
| Therapy | ||||
| Without surgery | 105 (47.1%) | 72 (48.6%) | 33 (44.0%) | 0.606 |
| After surgery | 118 (52.9%) | 76 (51.4%) | 42 (56.0%) | |
| WHO Grade | ||||
| G1 | 42 (18.8%) | 26 (17.6%) | 16 (21.3%) | 0.767 |
| G2 | 161 (72.2%) | 108 (73.0%) | 53 (70.7%) | |
| G3 | 20 (9.0%) | 14 (9.5%) | 6 (8.0%) | |
| D | ||||
| D1 | 92 (41.3%) | 58 (39.2%) | 34 (45.3%) | 0.514 |
| D2 | 86 (38.6%) | 61 (41.2%) | 25 (33.3%) | |
| D3 | 45 (20.2%) | 29 (19.6%) | 16 (21.3%) | |
| F | ||||
| F1 | 115 (51.6%) | 73 (49.3%) | 42 (56.0%) | 0.595 |
| F2 | 62 (27.8%) | 44 (29.7%) | 18 (24.0%) | |
| F3 | 46 (20.6%) | 31 (20.9%) | 15 (20.0%) | |
| S | ||||
| S1 | 21 (9.4%) | 14 (9.5%) | 7 (9.3%) | 0.986 |
| S2 | 55 (24.7%) | 36 (24.3%) | 19 (25.3%) | |
| S3 | 147 (65.9%) | 98 (66.2%) | 49 (65.3%) | |
| FDG SUVmax | ||||
| Mean (SD) | 4.32 (4.09) | 4.31 (3.94) | 4.34 (4.39) | 0.967 |
| Median [Min, Max] | 3.40 [0, 23.8] | 3.55 [0, 23.8] | 3.20 [0, 20.2] | |
| SSA SUVmax | ||||
| Mean (SD) | 14.0 (9.42) | 13.4 (8.57) | 15.1 (10.9) | 0.243 |
| Median [Min, Max] | 13.5 [0, 49.3] | 12.5 [0, 46.8] | 15.0 [0, 49.3] | |
| NETPET score | 0.023 | |||
| P1 | 65 (29.1%) | 37 (25.0%) | 28 (37.3%) | |
| P2a | 27 (12.1%) | 21 (14.2%) | 6 (8.0%) | |
| P2b | 86 (38.6%) | 61 (41.2%) | 25 (33.3%) | |
| P3a | 3 (1.3%) | 3 (2.0%) | 0 (0%) | |
| P3b | 16 (7.2%) | 11 (7.4%) | 5 (6.7%) | |
| P4a | 7 (3.1%) | 1 (0.7%) | 6 (8.0%) | |
| P4b | 11 (4.9%) | 9 (6.1%) | 2 (2.7%) | |
| P5 | 8 (3.6%) | 5 (3.4%) | 3 (4.0%) |
| System | Overall Survival | Progression-Free Survival | ||||||
|---|---|---|---|---|---|---|---|---|
| C-Index (95% CI) | AIC | LR Test | R2 | C-Index (95% CI) | AIC | LR Test | R2 | |
| D grade | 0.763 (0.714–0.812) | 603.02 | 56.82 | 0.237 | 0.724 (0.690–0.758) | 1672.51 | 96.84 | 0.345 |
| F grade | 0.727 (0.770–0.785) | 621.37 | 38.46 | 0.167 | 0.630 (0.593–0.667) | 1735.05 | 34.3 | 0.143 |
| S grade | 0.566 (0.500–0.634) | 655.19 | 4.65 | 0.022 | 0.556 (0.514–0.598) | 1761.48 | 7.87 | 0.035 |
| WHO grade | 0.650 (0.592–0.709) | 629.26 | 30.58 | 0.135 | 0.592 (0.552–0.631) | 1769.43 | −0.08 | 0 |
| Characteristics | Training Cohort | Internal Validation Cohort | ||||||
|---|---|---|---|---|---|---|---|---|
| Univariate Cox Regression | Multivariate Cox Regression | Univariate Cox Regression | Multivariate Cox Regression | |||||
| HR (95% CI) | p-Value | HR (95% CI) | p-Value | HR (95% CI) | p-Value | HR (95% CI) | p-Value | |
| Age | ||||||||
| <55 | Reference | Reference | Reference | Reference | ||||
| ≥55 | 2.21 (1.21–4.05) | 0.010 | 1.56 (0.8–3.03) | 0.188 | 5.70 (1.93–16.79) | 0.002 | 3.79 (1.19–12.06) | 0.024 |
| Extrehepatic metastases | ||||||||
| No | Reference | Reference | Reference | Reference | ||||
| Yes | 2.27 (0.89–5.78) | 0.087 | 1.3 (0.49–3.45) | 0.592 | 0.80 (0.19–3.43) | 0.764 | 0.51 (0.09–2.71) | 0.427 |
| WHO Grade | ||||||||
| G1 | Reference | Reference | Reference | Reference | ||||
| G2 | 3.17 (0.97–10.39) | 0.057 | 2.22 (0.64–7.74) | 0.209 | 1.20 (0.39–3.68) | 0.744 | 0.91 (0.27–3.04) | 0.881 |
| G3 | 14.41 (3.97–52.3) | <0.001 | 4.21 (1.03–17.25) | 0.045 | 9.38 (2.35–37.46) | 0.002 | 3.25 (0.69–15.46) | 0.138 |
| D | ||||||||
| D1 | Reference | Reference | Reference | Reference | ||||
| D2 | 3.82 (1.52–9.63) | 0.005 | 3.66 (1.41–9.5) | 0.008 | 6.05 (1.65 −22.09) | 0.007 | 4.7 (1.27–18.49) | 0.020 |
| D3 | 15 (5.78–38.91) | <0.001 | 6.12 (2.02–18.57) | <0.001 | 11.79 (3.23–43.11) | <0.001 | 6.34 (1.59–25.30) | 0.009 |
| F | ||||||||
| F1 | Reference | Reference | Reference | Reference | ||||
| F2 | 2.92 (1.41–6.06) | 0.004 | 1.87 (0.85–4.13) | 0.121 | 5.6 (1.86–16.83) | 0.002 | 2.83 (0.72–11.11) | 0.137 |
| F3 | 5.39 (2.74–12.86) | <0.001 | 2.55 (1.02–6.39) | 0.045 | 7.87 (2.61–23.7) | <0.001 | 3.05 (0.75–12.51) | 0.121 |
| Characteristics | Training Cohort | Internal Validation Cohort | ||||||
|---|---|---|---|---|---|---|---|---|
| Univariate Cox Regression | Multivariate Cox Regression | Univariate Cox Regression | Multivariate Cox Regression | |||||
| HR (95% CI) | p-Value | HR (95% CI) | p-Value | HR (95% CI) | p-Value | HR (95% CI) | p-Value | |
| Age | ||||||||
| <55 | Reference | Reference | Reference | |||||
| ≥55 | 1.72 (1.21–2.44) | 0.003 | 1.54 (1.05–2.25) | 0.027 | 3.30 (1.93–5.63) | <0.001 | 3.57 (1.98–6.44) | <0.001 |
| Extrehepatic metastases | ||||||||
| No | Reference | Reference | Reference | |||||
| Yes | 1.50 (0.93–2.43) | 0.097 | 1.2 (0.72–1.99) | 0.477 | 1.14 (0.49–2.64) | 0.768 | 1.45 (0.54–3.9) | 0.467 |
| Therapy | ||||||||
| Without surgery | Reference | Reference | Reference | |||||
| After surgery | 0.64 (0.45–0.91) | 0.013 | 0.76 (0.52–1.11) | 0.159 | 0.69 (0.42–1.12) | 0.137 | 0.66 (0.38–1.15) | 0.142 |
| WHO Grade | ||||||||
| G1 | Reference | Reference | Reference | |||||
| G2 | 1.82 (1.11–2.99) | 0.018 | 1.62 (0.95–2.76) | 0.076 | 1.46 (0.78–2.73) | 0.231 | 1.11 (0.57–2.16) | 0.753 |
| G3 | 8.14 (3.93–16.84) | <0.001 | 5.2 (2.35–11.54) | <0.001 | 3.64 (1.35–9.83) | 0.011 | 2.41 (0.75–7.8) | 0.142 |
| D | ||||||||
| D1 | Reference | Reference | Reference | |||||
| D2 | 2.11 (1.40–3.17) | <0.001 | 2.13 (1.38–3.31) | <0.001 | 3.36 (1.88–5.99) | <0.001 | 2.99 (1.42–6.29) | 0.004 |
| D3 | 7.93 (4.72–13.31) | <0.001 | 7.33 (3.59–15) | <0.001 | 15.24 (7.21–32.23) | <0.001 | 25.1 (8.57–73.46) | <0.001 |
| F | ||||||||
| F1 | Reference | Reference | Reference | |||||
| F2 | 1.93 (1.28–2.90) | 0.002 | 1.42 (0.92–2.21) | 0.114 | 2.52 (1.41–4.51) | 0.002 | 1.7 (0.8–3.6) | 0.164 |
| F3 | 2.34 (1.48–3.68) | <0.001 | 0.74 (0.4–1.38) | 0.347 | 3.23 (1.64–6.36) | <0.001 | 0.63 (0.25–1.61) | 0.337 |
| System | Overall Survival | Progression-Free Survival | ||||||
|---|---|---|---|---|---|---|---|---|
| C-Index (95% CI) | AIC | LR Test | R2 | C-Index (95% CI) | AIC | LR Test | R2 | |
| Nomogram | 0.810 (0.767–0.874) | 354.44 | 54.24 | 0.32 | 0.741 (0.692–0.789) | 993.3 | 83.78 | 0.433 |
| D grade | 0.759 (0.700–0.821) | 355.16 | 39.52 | 0.252 | 0.700 (0.653–0.748) | 1009.36 | 53.71 | 0.305 |
| F grade | 0.710 (0.637–0.783) | 373.17 | 21.35 | 0.146 | 0.617 (0.569–0.666) | 1046.31 | 16.76 | 0.107 |
| WHO grade | 0.661 (0.590–0.732) | 373.02 | 21.66 | 0.147 | 0.613 (0.569–0.657) | 1036.43 | 26.74 | 0.165 |
| System | Overall Survival | Progression-Free Survival | ||||||
|---|---|---|---|---|---|---|---|---|
| C-Index (95% CI) | AIC | LR Test | R2 | C-Index (95% CI) | AIC | LR Test | R2 | |
| Nomogram | 0.849 (0.781–0.849) | 158.03 | 35.89 | 0.419 | 0.824 (0.778–0.871) | 410.79 | 76.17 | 0.639 |
| D grade | 0.779 (0.698–0.860) | 162.29 | 19.23 | 0.249 | 0.772 (0.729–0.815) | 425.51 | 47.45 | 0.47 |
| F grade | 0.760 (0.664–0.855) | 164.11 | 17.81 | 0.233 | 0.649 (0.594–0.704) | 457.92 | 15.4 | 0.182 |
| WHO grade | 0.633 (0.527–0.738) | 171.19 | 10.73 | 0.147 | 0.555 (0.478–0.633) | 467.38 | 5.58 | 0.072 |
Disclaimer/Publisher’s Note: The statements, opinions and data contained in all publications are solely those of the individual author(s) and contributor(s) and not of MDPI and/or the editor(s). MDPI and/or the editor(s) disclaim responsibility for any injury to people or property resulting from any ideas, methods, instructions or products referred to in the content. |
© 2024 by the authors. Licensee MDPI, Basel, Switzerland. This article is an open access article distributed under the terms and conditions of the Creative Commons Attribution (CC BY) license (https://creativecommons.org/licenses/by/4.0/).
Share and Cite
Liu, Y.; Cui, R.; Wang, Z.; Lin, Q.; Tang, W.; Zhang, B.; Li, G.; Wang, Z. Evaluating Prognosis of Gastrointestinal Metastatic Neuroendocrine Tumors: Constructing a Novel Prognostic Nomogram Based on NETPET Score and Metabolic Parameters from PET/CT Imaging. Pharmaceuticals 2024, 17, 373. https://doi.org/10.3390/ph17030373
Liu Y, Cui R, Wang Z, Lin Q, Tang W, Zhang B, Li G, Wang Z. Evaluating Prognosis of Gastrointestinal Metastatic Neuroendocrine Tumors: Constructing a Novel Prognostic Nomogram Based on NETPET Score and Metabolic Parameters from PET/CT Imaging. Pharmaceuticals. 2024; 17(3):373. https://doi.org/10.3390/ph17030373
Chicago/Turabian StyleLiu, Yifan, Ruizhe Cui, Zhixiong Wang, Qi Lin, Wei Tang, Bing Zhang, Guanghua Li, and Zhao Wang. 2024. "Evaluating Prognosis of Gastrointestinal Metastatic Neuroendocrine Tumors: Constructing a Novel Prognostic Nomogram Based on NETPET Score and Metabolic Parameters from PET/CT Imaging" Pharmaceuticals 17, no. 3: 373. https://doi.org/10.3390/ph17030373
APA StyleLiu, Y., Cui, R., Wang, Z., Lin, Q., Tang, W., Zhang, B., Li, G., & Wang, Z. (2024). Evaluating Prognosis of Gastrointestinal Metastatic Neuroendocrine Tumors: Constructing a Novel Prognostic Nomogram Based on NETPET Score and Metabolic Parameters from PET/CT Imaging. Pharmaceuticals, 17(3), 373. https://doi.org/10.3390/ph17030373