
Guidance on Selecting Optimal Steady-State Tacrolimus Concentrations for Continuous IV Perfusion: Insights from Physiologically Based Pharmacokinetic Modeling
Abstract
:1. Introduction
2. Results
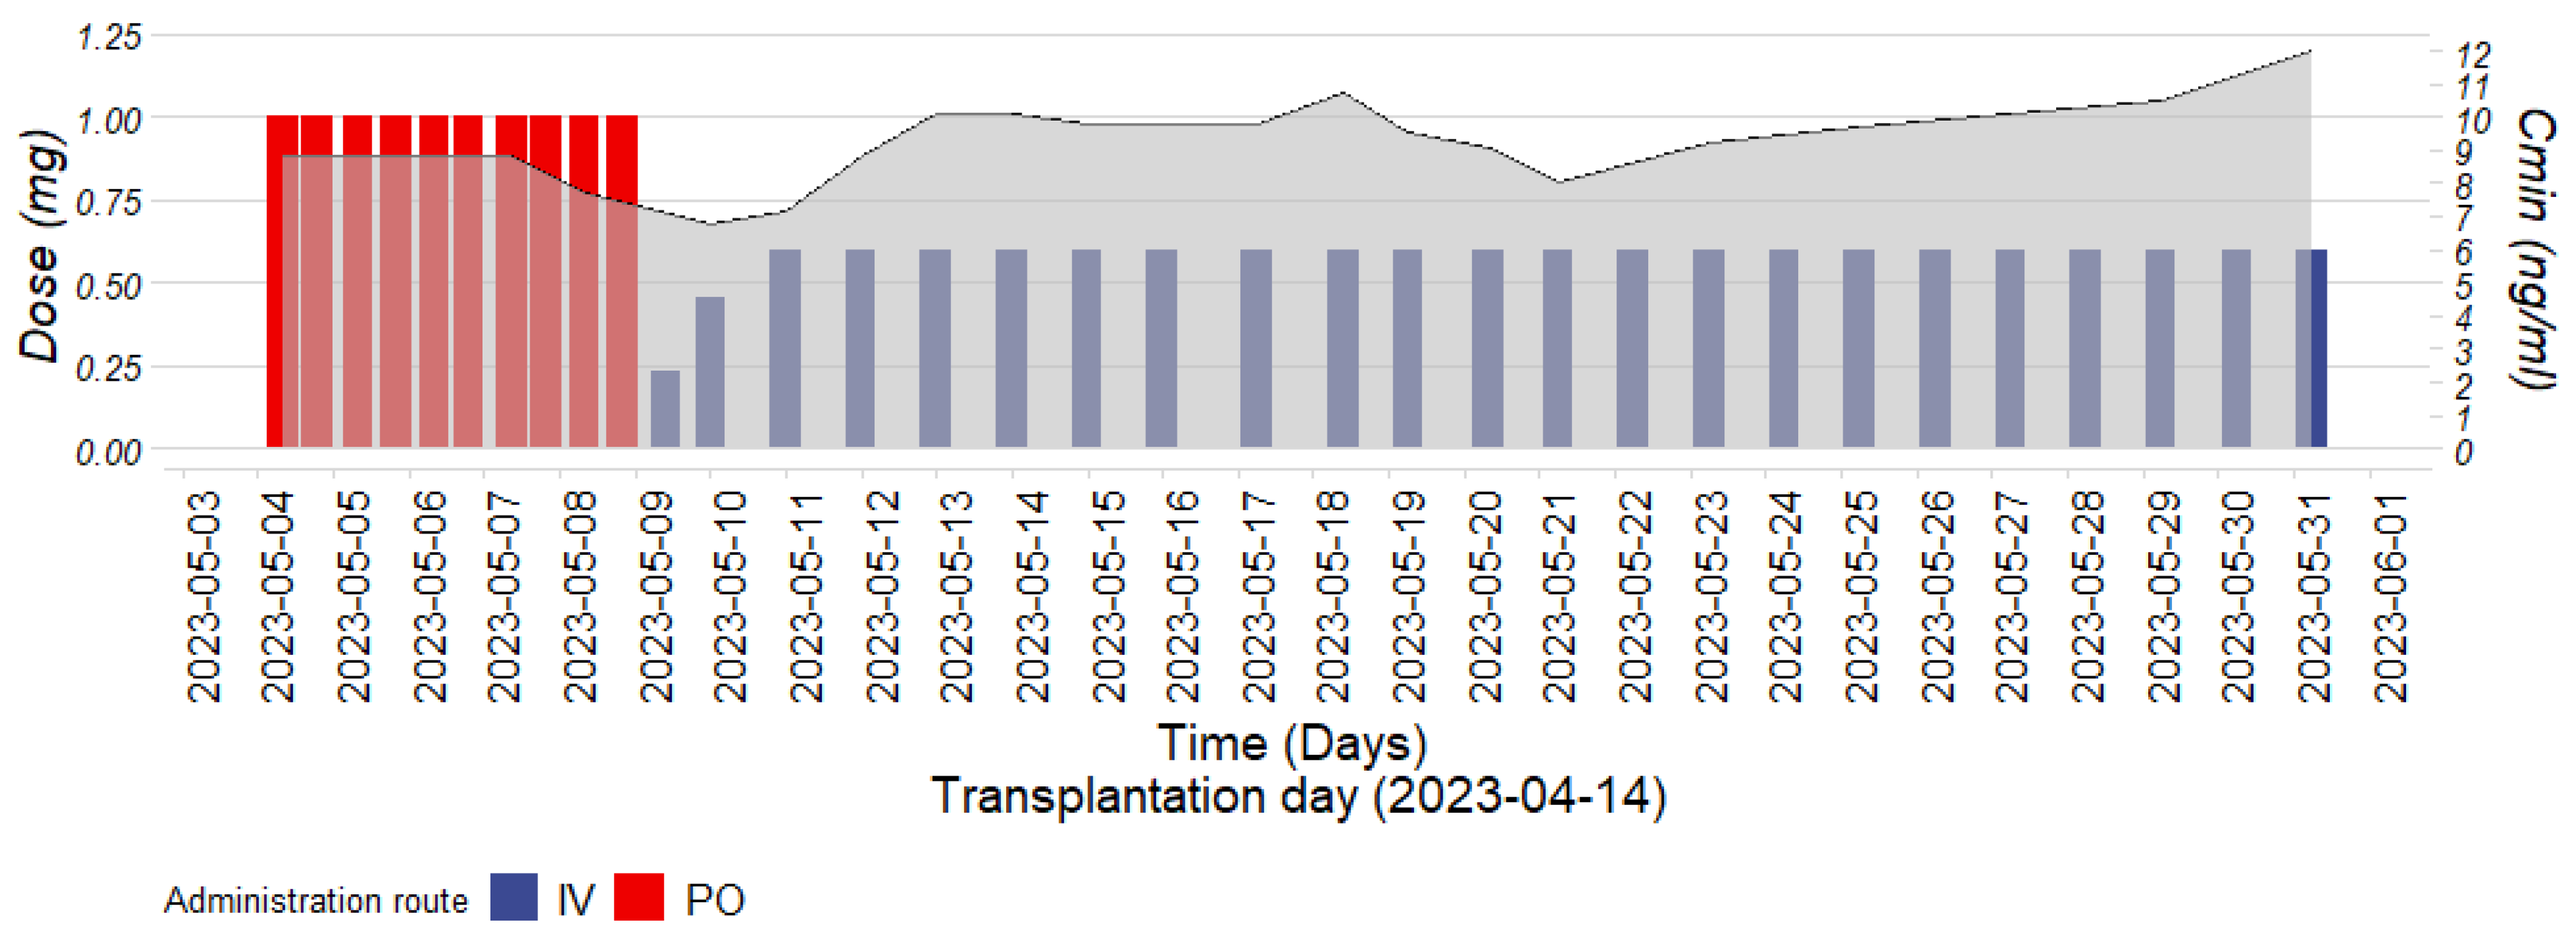
2.1. Clinical Case
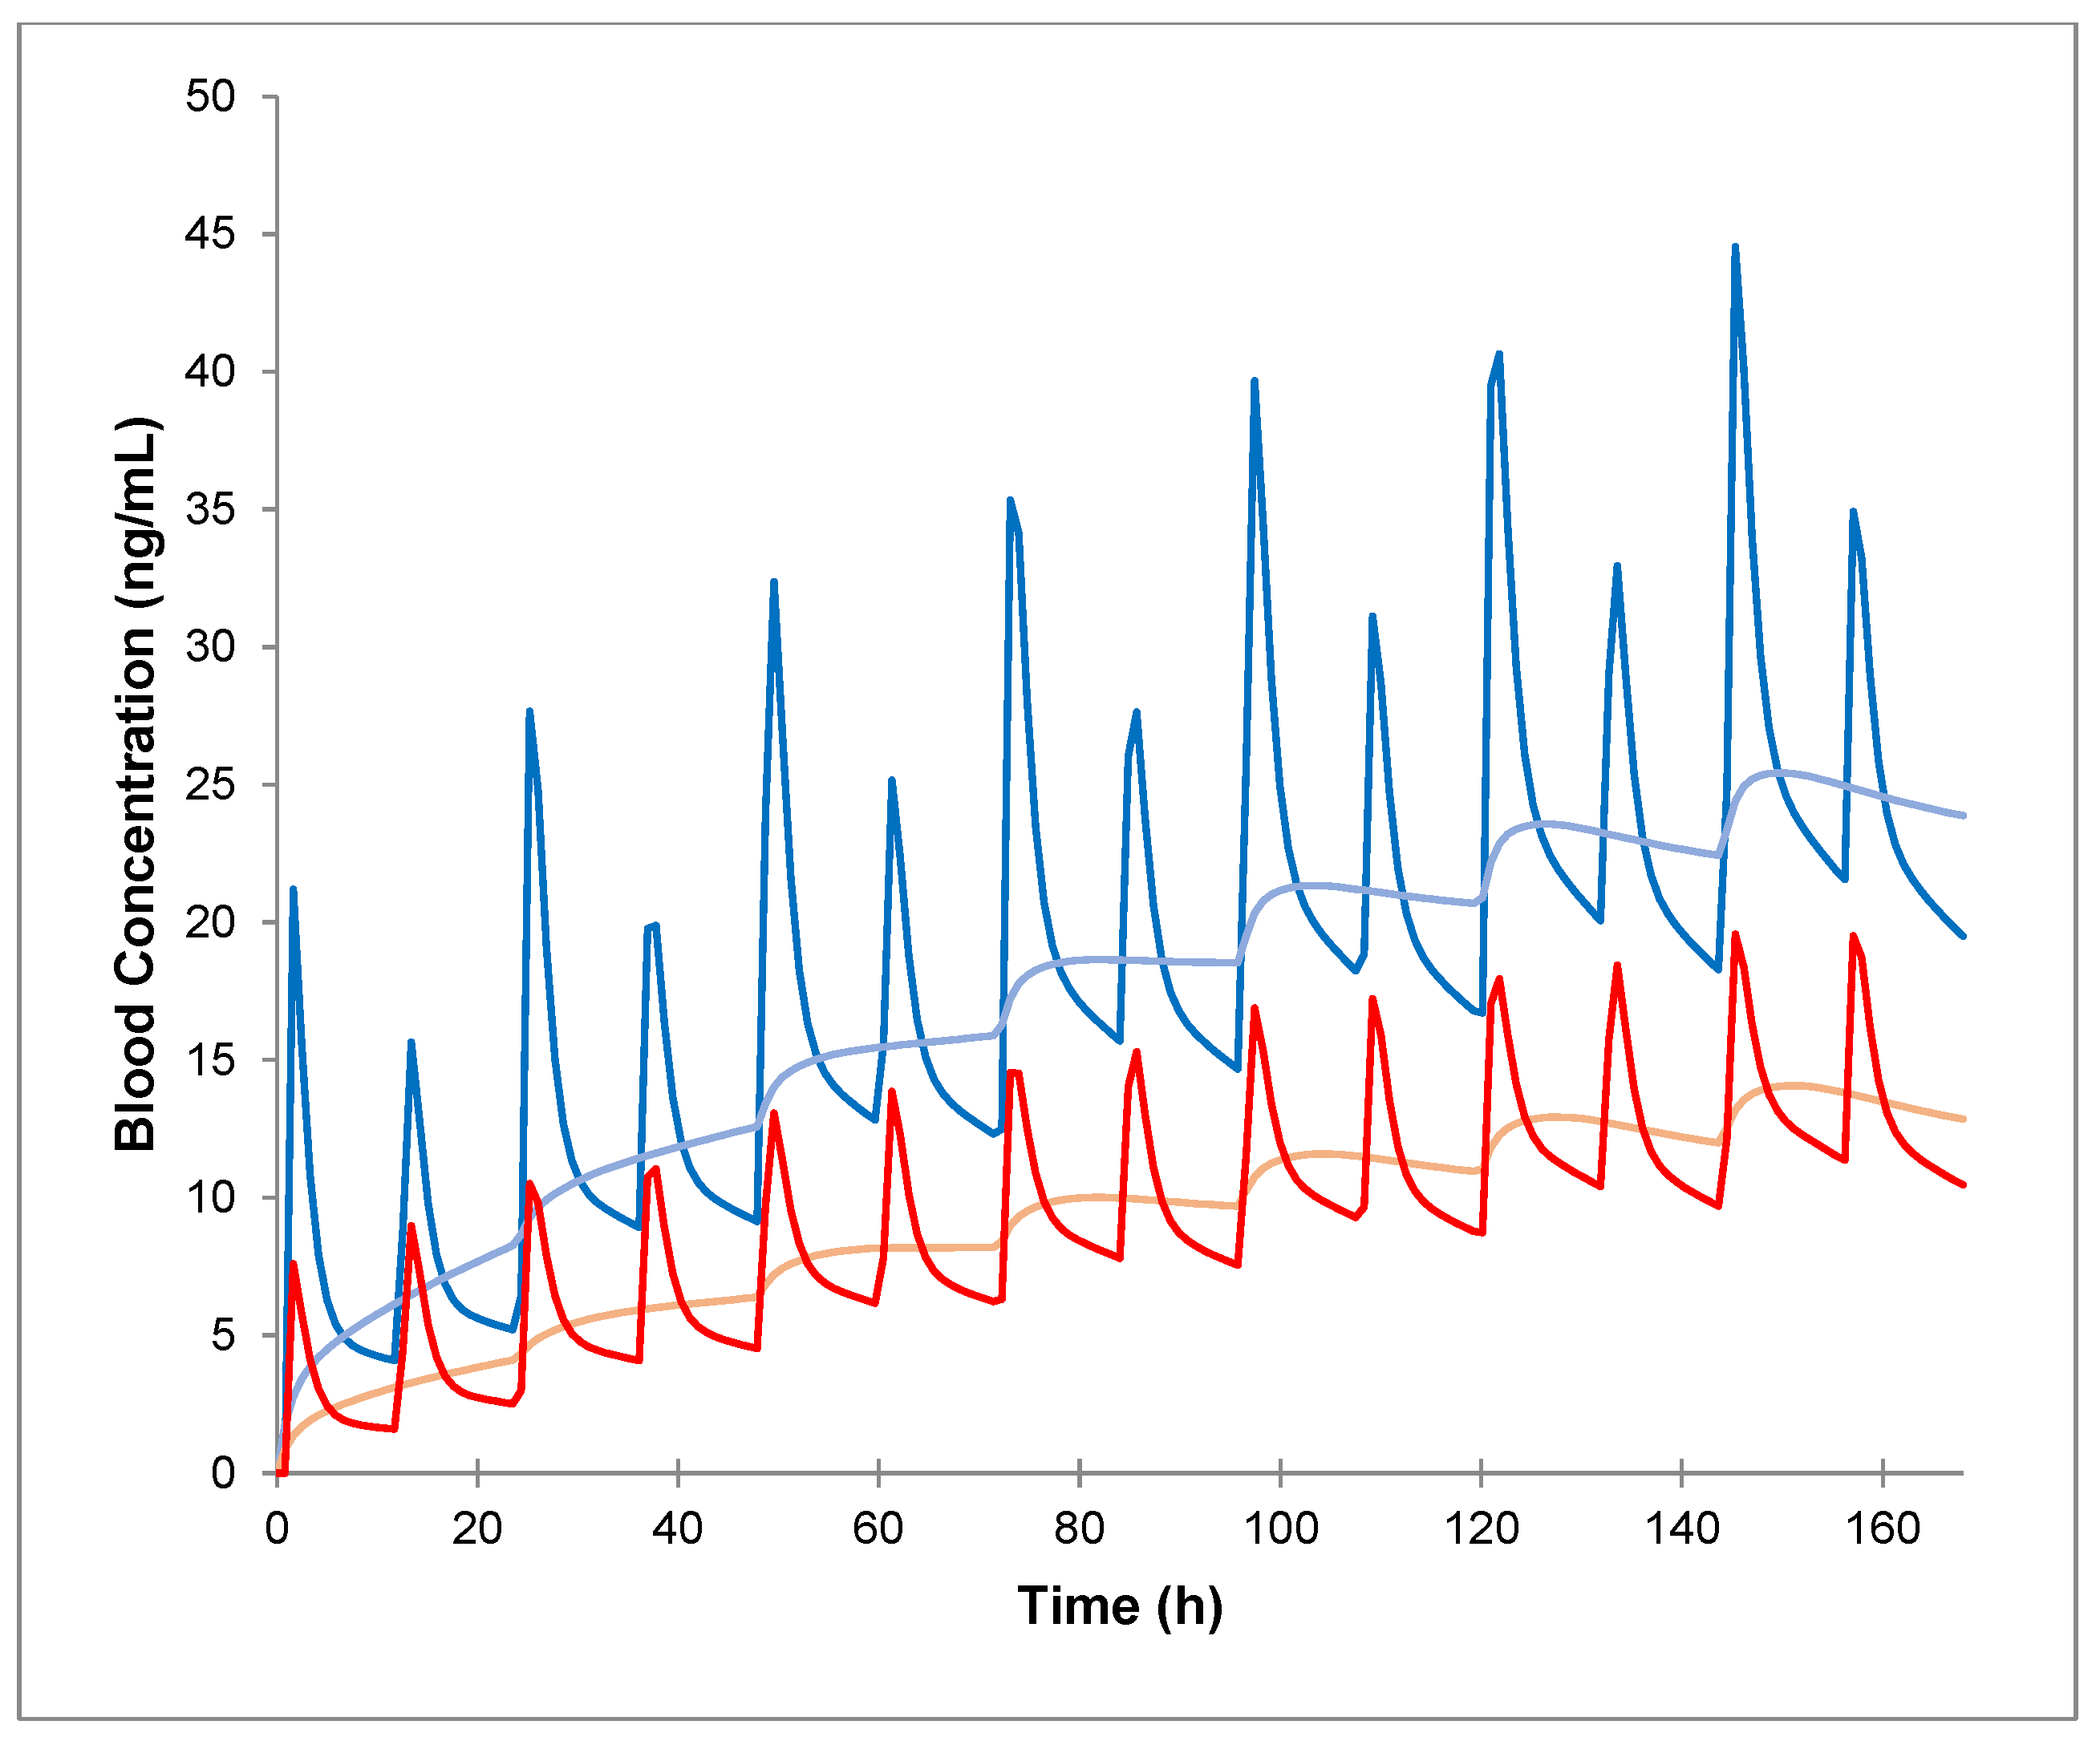
2.2. PBPK Simulation of Tacrolimus after IV Infusion and PO Administration in Healthy Volunteers and Application to the Clinical Case Using Virtal Twining
2.3. Predicted Pharmacokinetic Parameters of Tacrolimus after PO Administration and IV Infusion in Donors, Recipients and in Both Donors and Recipients Expressing CYP3A5 (1*/1*)
2.4. Predicted Tacrolimus PO/IV Dose and Css/Cmin Ratios in Healthy Volunteers following PO and IV Administration of the CYP3A Inhibitor Itraconazole
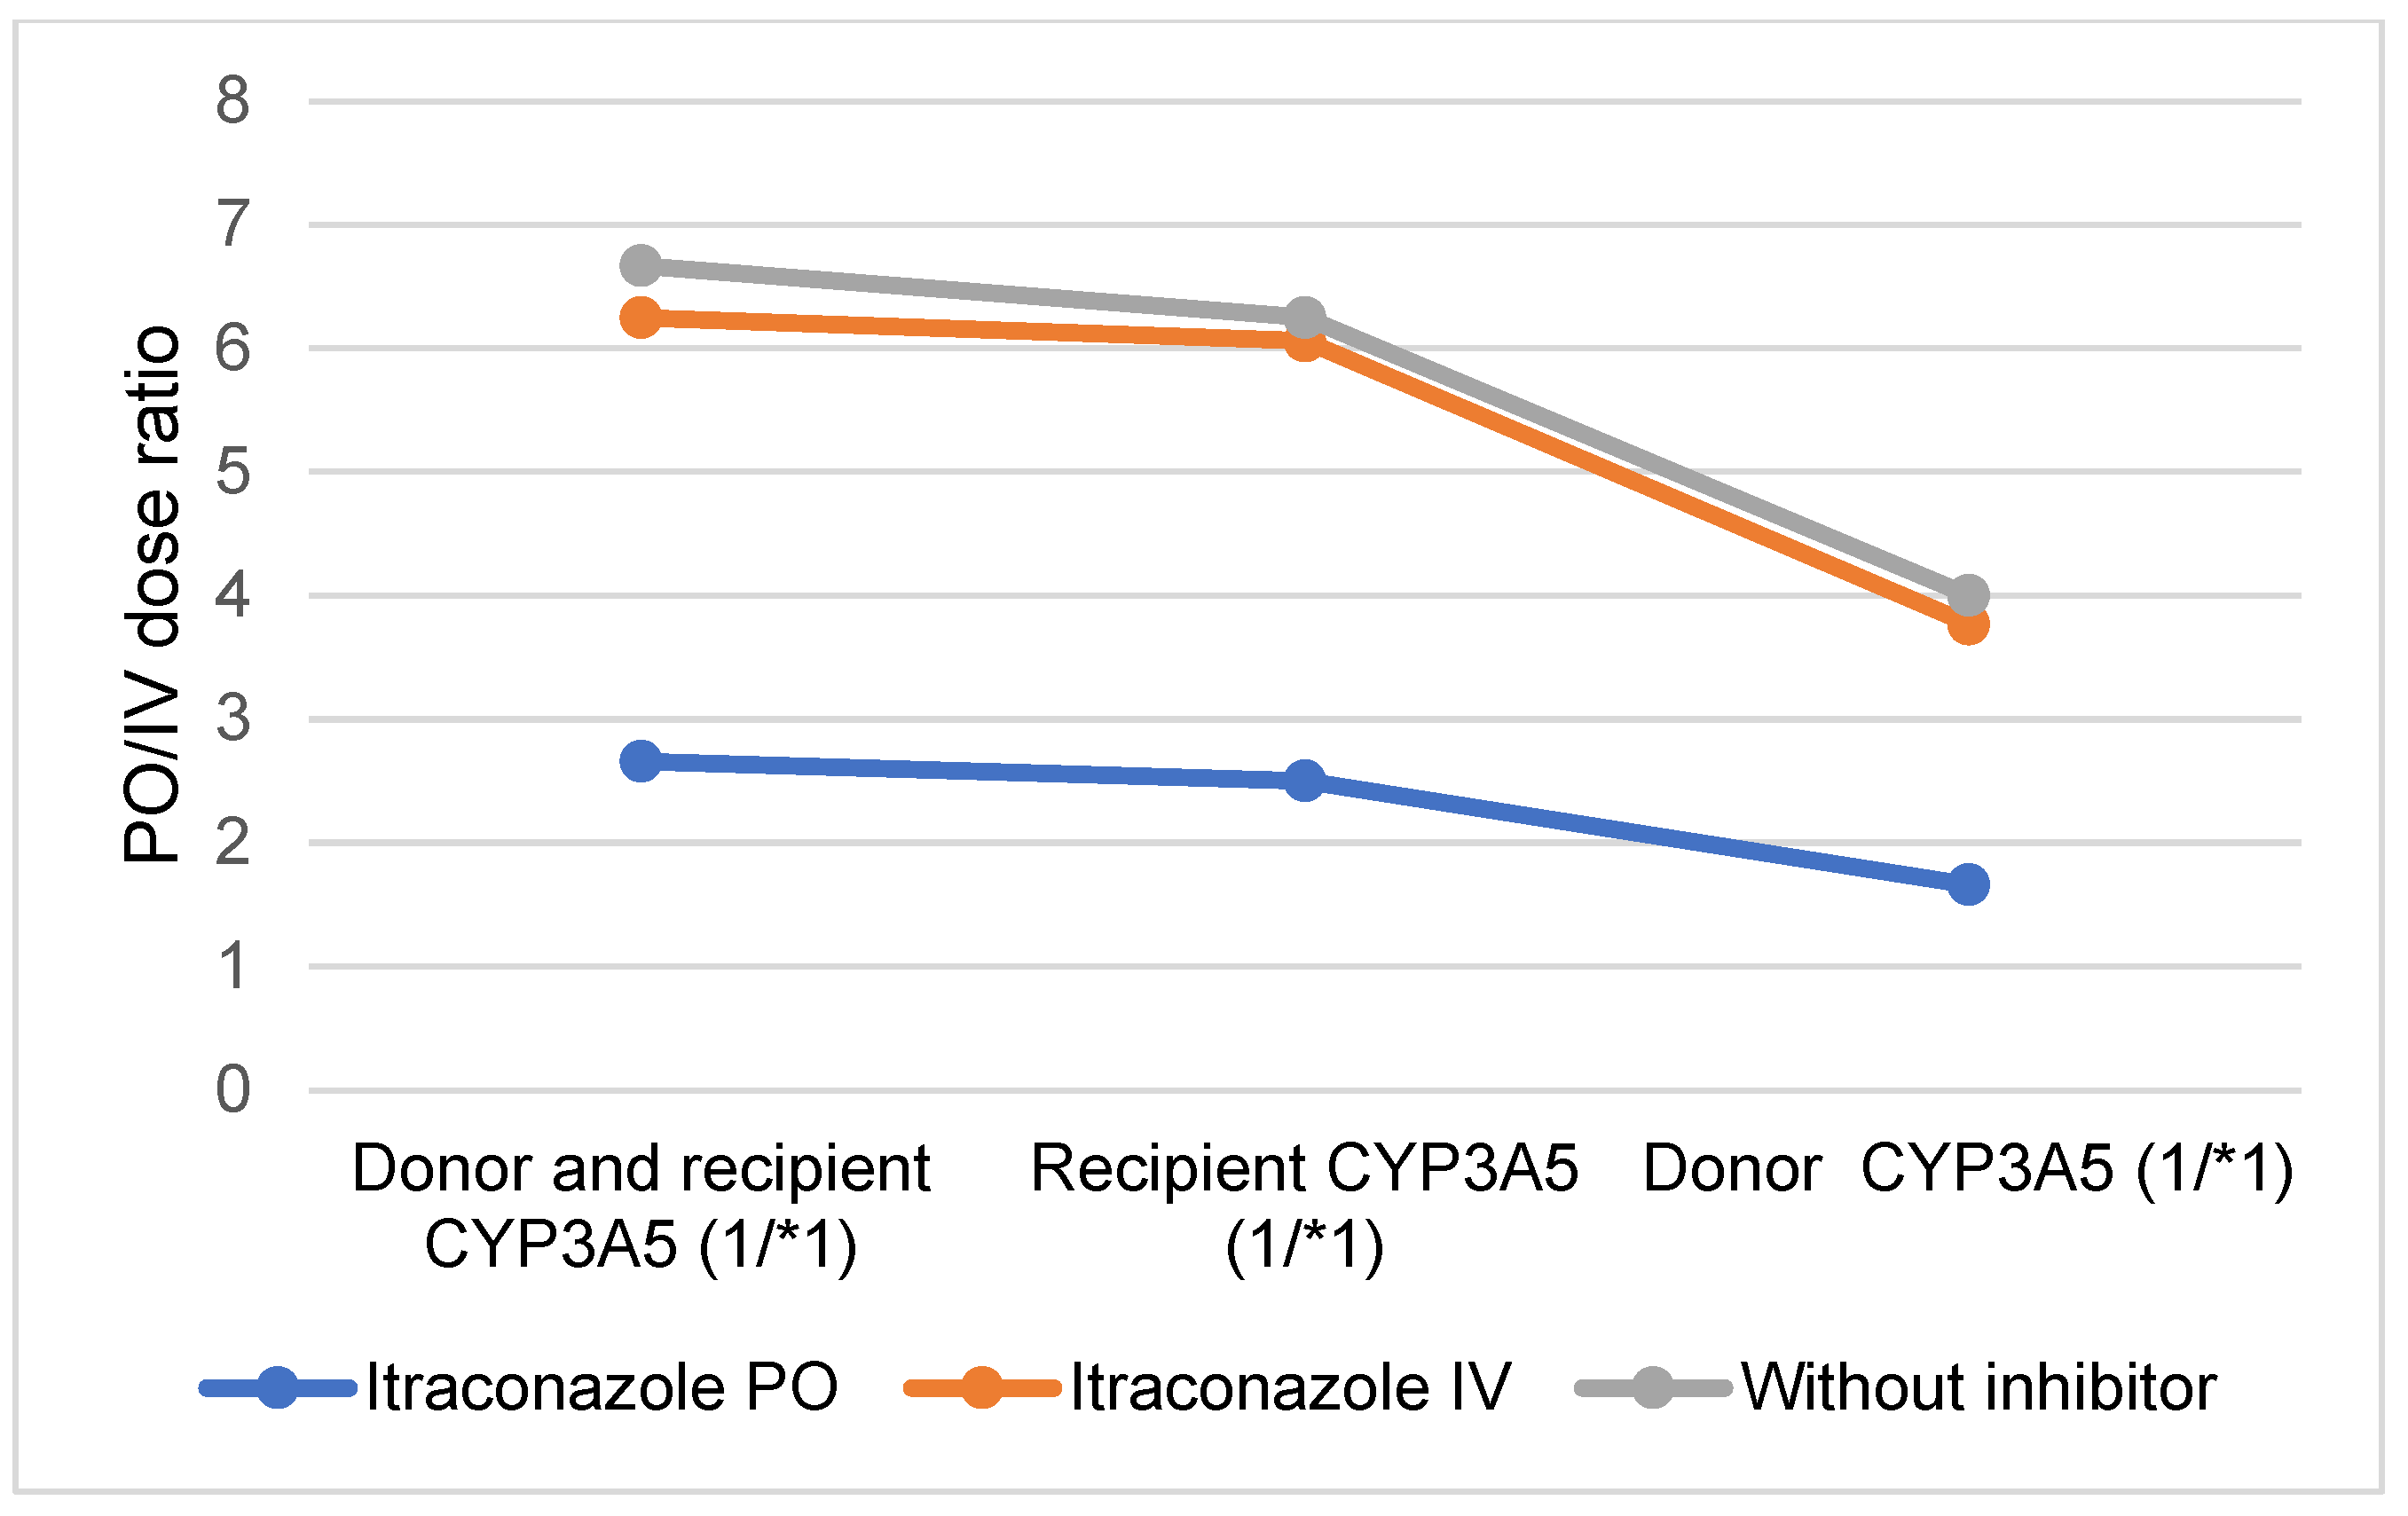
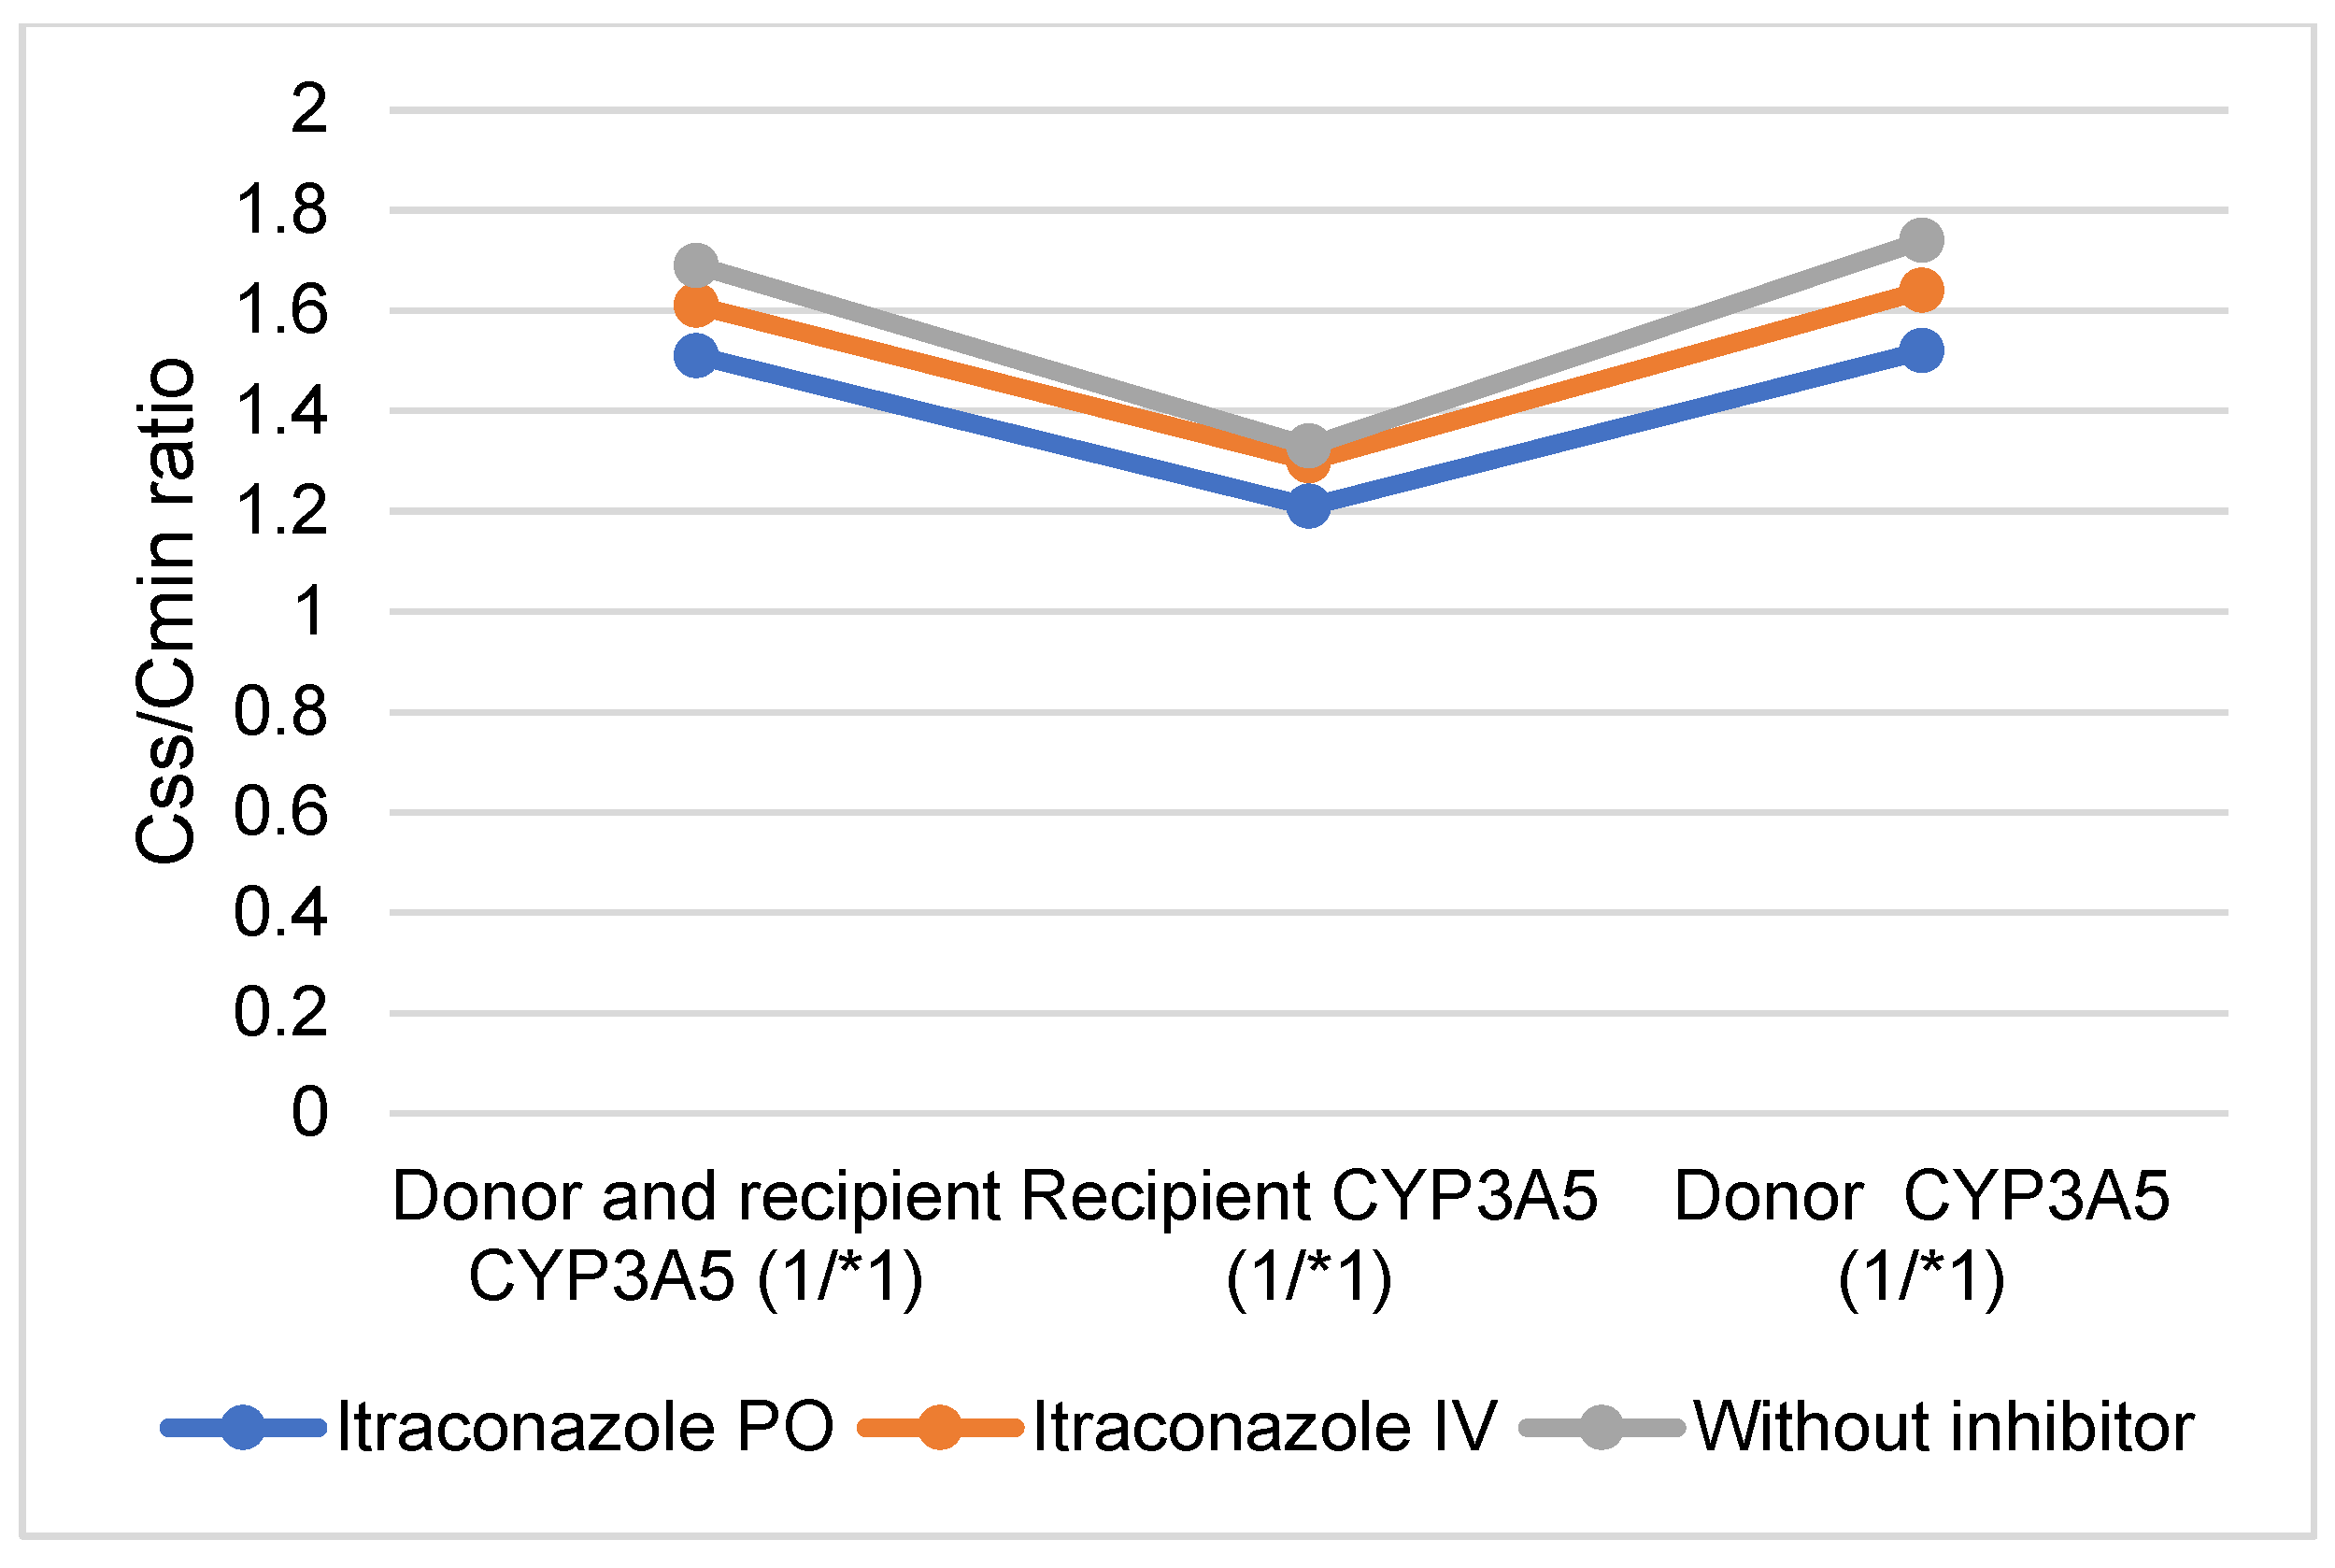
2.5. Comparison of PO and IV Tacrolimus: Predicted PO and IV Tacrolimus Doses and Css/Cmin Ratios Following PO and IV Administration of the CYP3A Inhibitor Itraconazole in Donors, Recipients, and in Both Donors and Recipients Expressing CYP3A5 (*1/*1)
3. Discussion
4. Materials and Methods
PBPK Simulation
5. Conclusions
Supplementary Materials
Author Contributions
Funding
Institutional Review Board Statement
Informed Consent Statement
Data Availability Statement
Conflicts of Interest
References
- Henkel, L.; Jehn, U.; Thölking, G.; Reuter, S. Tacrolimus—Why pharmacokinetics matter in the clinic. Front. Transplant. 2023, 2, 1160752. [Google Scholar] [CrossRef]
- Abu-Elmagd, K.M.; Fung, J.J.; Alessiani, M.; Jain, A.; Takaya, S.; Venkataramanan, R.; Warty, V.S.; Shannon, W.; Todo, S.; Tzakis, A. Strategy of FK 506 Therapy in Liver Transplant Patients: Effect of Graft Function. Transplant. Proc. 1991, 23, 2771–2774. [Google Scholar]
- Brooks, E.; Tett, S.E.; Isbel, N.M.; Staatz, C.E. Population Pharmacokinetic Modelling and Bayesian Estimation of Tacrolimus Exposure: Is this Clinically Useful for Dosage Prediction Yet? Clin. Pharmacokinet. 2016, 55, 1295–1335. [Google Scholar] [CrossRef]
- Gérard, C.; Stocco, J.; Hulin, A.; Blanchet, B.; Verstuyft, C.; Durand, F.; Conti, F.; Duvoux, C.; Tod, M. Determination of the Most Influential Sources of Variability in Tacrolimus Trough Blood Concentrations in Adult Liver Transplant Recipients: A Bottom-Up Approach. AAPS J. 2014, 16, 379–391. [Google Scholar] [CrossRef]
- Wallemacq, P.; Armstrong, V.W.; Brunet, M.; Haufroid, V.; Holt, D.W.; Johnston, A.; Kuypers, D.; Le Meur, Y.; Marquet, P.; Oellerich, M.; et al. Opportunities to optimize tacrolimus therapy in solid organ transplantation: Report of the European consensus conference. Ther. Drug Monit. 2009, 31, 139–152. [Google Scholar] [CrossRef]
- Brunet, M.; van Gelder, T.; Åsberg, A.; Haufroid, V.; Hesselink, D.A.; Langman, L.; Lemaitre, F.; Marquet, P.; Seger, C.; Shipkova, M.; et al. Therapeutic Drug Monitoring of Tacrolimus-Personalized Therapy: Second Consensus Report. Ther. Drug Monit. 2019, 41, 261–307. [Google Scholar] [CrossRef]
- Udomkarnjananun, S.; Francke, M.I.; De Winter, B.C.; Mulder, M.B.; Baan, C.C.; Metselaar, H.J.; Hoed, C.M.D.; Hesselink, D.A. Therapeutic drug monitoring of immunosuppressive drugs in hepatology and gastroenterology. Best Pract. Res. Clin. Gastroenterol. 2021, 54-55, 101756. [Google Scholar] [CrossRef]
- Kourkoumpetis, T.; Levitsky, J. Immunosuppressive Drug Levels in Liver Transplant Recipients: Impact in Decision Making. Semin. Liver Dis. 2019, 39, 414–421. [Google Scholar] [CrossRef]
- Garrity, E.R.; I Hertz, M.; Trulock, E.P.; Keenan, R.; Love, R. Suggested guidelines for the use of tacrolimus in lung-transplant recipients. J. Heart Lung Transplant. 1999, 18, 175–176. [Google Scholar] [CrossRef]
- Mould, D.R.; Upton, R.N. Basic Concepts in Population Modeling, Simulation, and Model-Based Drug Development. CPT Pharmacomet. Syst. Pharmacol. 2012, 1, e6. [Google Scholar] [CrossRef] [PubMed]
- Pei, L.; Li, R.; Zhou, H.; Du, W.; Gu, Y.; Jiang, Y.; Wang, Y.; Chen, X.; Sun, J.; Zhu, J. A Physiologically Based Pharmacokinetic Approach to Recommend an Individual Dose of Tacrolimus in Adult Heart Transplant Recipients. Pharmaceutics 2023, 15, 2580. [Google Scholar] [CrossRef] [PubMed]
- Hong, E.; Carmanov, E.; Shi, A.; Chung, P.S.; Rao, A.P.; Forrester, K.; Beringer, P.M. Application of Physiologically Based Pharmacokinetic Modeling to Predict Drug–Drug Interactions between Elexacaftor/Tezacaftor/Ivacaftor and Tacrolimus in Lung Transplant Recipients. Pharmaceutics 2023, 15, 1438. [Google Scholar] [CrossRef] [PubMed]
- Itohara, K.; Yano, I.; Nakagawa, S.; Yonezawa, A.; Omura, T.; Imai, S.; Nakagawa, T.; Sawada, A.; Kobayashi, T.; Tochio, A.; et al. Extrapolation of physiologically based pharmacokinetic model for tacrolimus from renal to liver transplant patients. Drug Metab. Pharmacokinet. 2021, 42, 100423. [Google Scholar] [CrossRef] [PubMed]
- Coppola, P.; Kerwash, E.; Cole, S. Use of Physiologically Based Pharmacokinetic Modeling for Hepatically Cleared Drugs in Pregnancy: Regulatory Perspective. J. Clin. Pharmacol. 2023, 63, S62–S80. [Google Scholar] [CrossRef] [PubMed]
- Van der Veken, M.; Brouwers, J.; Ozbey, A.C.; Umehara, K.; Stillhart, C.; Knops, N.; Augustijns, P.; Parrott, N.J. Investigating Tacrolimus Disposition in Paediatric Patients with a Physiologically Based Pharmacokinetic Model Incorporating CYP3A4 Ontogeny, Mechanistic Absorption and Red Blood Cell Binding. Pharmaceutics 2023, 15, 2231. [Google Scholar] [CrossRef] [PubMed]
- Polasek, T.M.; Tucker, G.T.; Sorich, M.J.; Wiese, M.D.; Mohan, T.; Rostami-Hodjegan, A.; Korprasertthaworn, P.; Perera, V.; Rowland, A. Prediction of olanzapine exposure in individual patients using physiologically based pharmacokinetic modelling and simulation. Br. J. Clin. Pharmacol. 2018, 84, 462–476. [Google Scholar] [CrossRef] [PubMed]
- Decrocq-Rudler, M.-A.; Kwong, A.H.-X.P.C.; Meunier, L.; Fraisse, J.M.; Ursic-Bedoya, J.; Khier, S. Can We Predict Individual Concentrations of Tacrolimus After Liver Transplantation? Application and Tweaking of a Published Population Pharmacokinetic Model in Clinical Practice. Ther. Drug Monit. 2021, 43, 490–498. [Google Scholar] [CrossRef] [PubMed]
- Costanzo, M.R.; Dipchand, A.; Starling, R.; Anderson, A.; Chan, M.; Desai, S.; Fedson, S.; Fisher, P.; Gonzales-Stawinski, G.; Martinelli, L.; et al. The International Society of Heart and Lung Transplantation Guidelines for the care of heart transplant recipients. J. Heart Lung Transplant. 2010, 29, 914–956. [Google Scholar] [CrossRef] [PubMed]
- Kuan, W.-Y.J.; Châteauvert, N.; Leclerc, V.; Drolet, B. Tacrolimus Dose-Conversion Ratios Based on Switching of Formulations for Patients with Solid Organ Transplants. Can. J. Hosp. Pharm. 2021, 74, 317–326. [Google Scholar] [CrossRef]
- Sam, W.J.; Aw, M.; Quak, S.H.; Lim, S.M.; Charles, B.G.; Chan, S.Y.; Ho, P.C. Population pharmacokinetics of tacrolimus in Asian paediatric liver transplant patients. Br. J. Clin. Pharmacol. 2000, 50, 531–541. [Google Scholar] [CrossRef]
- Størset, E.; Holford, N.; Midtvedt, K.; Bremer, S.; Bergan, S.; Åsberg, A. Importance of hematocrit for a tacrolimus target concentration strategy. Eur. J. Clin. Pharmacol. 2013, 70, 65–77. [Google Scholar] [CrossRef] [PubMed]
- He, J.; Yu, Y.; Yin, C.; Liu, H.; Zou, H.; Ma, J.; Yang, W.; Liu, Y.; Zhong, L.; Chen, X. Clinically significant drug-drug interaction between tacrolimus and fluconazole in stable renal transplant recipient and literature review. J. Clin. Pharm. Ther. 2019, 45, 264–269. [Google Scholar] [CrossRef] [PubMed]
- Pasternak, A.L.; Marcath, L.A.; Li, Y.; Nguyen, V.; Gersch, C.L.; Rae, J.M.; Frame, D.; Scappaticci, G.; Kidwell, K.M.; Hertz, D.L. Impact of Pharmacogenetics on Intravenous Tacrolimus Exposure and Conversions to Oral Therapy. Transpl. Cell. Ther. 2021, 28, 19.e1–19.e7. [Google Scholar] [CrossRef] [PubMed]
- Uesugi, M.; Masuda, S.; Shinke, H.; Nish-ioka, Y.; Matsubara, K.; Fujimoto, Y.; Uemoto, S. Influence of the cytochrome P450 3A5 * 3 genotype in a graft liver on the occurrence of acute cellular rejection after living-donor liver transplantation: 1672. Hepatology 2013, 58, 1014A. [Google Scholar]
- Thelen, K.; Dressman, J.B. Cytochrome P450-mediated metabolism in the human gut wall. J. Pharm. Pharmacol. 2009, 61, 541–558. [Google Scholar] [CrossRef] [PubMed]
- Vanhove, T.; Bouwsma, H.; Hilbrands, L.; Swen, J.J.; Spriet, I.; Annaert, P.; Vanaudenaerde, B.; Verleden, G.; Vos, R.; Kuypers, D.R.J. Determinants of the Magnitude of Interaction Between Tacrolimus and Voriconazole/Posaconazole in Solid Organ Recipients. Am. J. Transplant. 2017, 17, 2372–2380. [Google Scholar] [CrossRef]
- Suetsugu, K.; Ikesue, H.; Miyamoto, T.; Shiratsuchi, M.; Yamamoto-Taguchi, N.; Tsuchiya, Y.; Matsukawa, K.; Uchida, M.; Watanabe, H.; Akashi, K.; et al. Analysis of the variable factors influencing tacrolimus blood concentration during the switch from continuous intravenous infusion to oral administration after allogeneic hematopoietic stem cell transplantation. Int. J. Hematol. 2016, 105, 361–368. [Google Scholar] [CrossRef] [PubMed]
- Leather, H.; Boyette, R.M.; Tian, L.; Wingard, J.R. Pharmacokinetic evaluation of the drug interaction between intravenous itraconazole and intravenous tacrolimus or intravenous cyclosporin A in allogeneic hematopoietic stem cell transplant recipients. Biol. Blood Marrow Transplant. 2006, 12, 325–334. [Google Scholar] [CrossRef] [PubMed]
- Kato, M. Intestinal first-pass metabolism of CYP3A4 substrates. Drug Metab. Pharmacokinet. 2008, 23, 87–94. [Google Scholar] [CrossRef]
- Antignac, M.; Barrou, B.; Farinotti, R.; Lechat, P.; Urien, S. Population pharmacokinetics and bioavailability of tacrolimus in kidney transplant patients. Br. J. Clin. Pharmacol. 2007, 64, 750–757. [Google Scholar] [CrossRef]
- Iwasaki, K. Metabolism of tacrolimus (FK506) and recent topics in clinical pharmacokinetics. Drug Metab. Pharmacokinet. 2007, 22, 328–335. [Google Scholar] [CrossRef] [PubMed]
- Hashida, T.; Masuda, S.; Uemoto, S.; Saito, H.; Tanaka, K.; Inui, K.; Bs, T.H. Pharmacokinetic and prognostic significance of intestinal MDR1 expression in recipients of living-donor liver transplantation. Clin. Pharmacol. Ther. 2001, 69, 308–316. [Google Scholar] [CrossRef] [PubMed]
- Saitoh, H.; Saikachi, Y.; Kobayashi, M.; Yamaguchi, M.; Oda, M.; Yuhki, Y.; Achiwa, K.; Tadano, K.; Takahashi, Y.; Aungst, B.J. Limited interaction between tacrolimus and P-glycoprotein in the rat small intestine. Eur. J. Pharm. Sci. 2006, 28, 34–42. [Google Scholar] [CrossRef] [PubMed]
- Chetty, M.; Johnson, T.N.; Polak, S.; Salem, F.; Doki, K.; Rostami-Hodjegan, A. Physiologically based pharmacokinetic modelling to guide drug delivery in older people. Adv. Drug Deliv. Rev. 2018, 135, 85–96. [Google Scholar] [CrossRef] [PubMed]
- Hong, Y.; Ishizuka, T.; Watanabe, A.; Tachibana, M.; Lee, M.; Ishizuka, H.; LaCreta, F.; Abutarif, M. Model-based assessments of CYP3A-mediated drug-drug interaction risk of milademetan. Clin. Transl. Sci. 2021, 14, 2220–2230. [Google Scholar] [CrossRef] [PubMed]
- Gertz, M.; Houston, J.B.; Galetin, A. Physiologically Based Pharmacokinetic Modeling of Intestinal First-Pass Metabolism of CYP3A Substrates with High Intestinal Extraction. Drug Metab. Dispos. 2011, 39, 1633–1642. [Google Scholar] [CrossRef] [PubMed]
- Gertz, M.; Harrison, A.; Houston, J.B.; Galetin, A. Prediction of Human Intestinal First-Pass Metabolism of 25 CYP3A Substrates from In Vitro Clearance and Permeability Data. Drug Metab. Dispos. 2010, 38, 1147–1158. [Google Scholar] [CrossRef]
- Emoto, C.; Johnson, T.N.; Hahn, D.; Christians, U.; Alloway, R.R.; Vinks, A.A.; Fukuda, T. A Theoretical Physiologically-Based Pharmacokinetic Approach to Ascertain Covariates Explaining the Large Interpatient Variability in Tacrolimus Disposition. CPT Pharmacomet. Syst. Pharmacol. 2019, 8, 273–284. [Google Scholar] [CrossRef]
- Dai, Y.; Hebert, M.F.; Isoherranen, N.; Davis, C.L.; Marsh, C.; Shen, D.D.; Thummel, K.E. Effect of cyp3a5 Polymorphism on tacrolimus metabolic clearance in vitro. Drug Metab. Dispos. 2006, 34, 836–847. [Google Scholar] [CrossRef]
- Möller, A.; Iwasaki, K.; Kawamura, A.; Teramura, Y.; Shiraga, T.; Hata, T.; Schäfer, A.; Undre, N.A. The disposition of 14C-labeled tacrolimus after intravenous and oral administration in healthy human subjects. Drug Metab. Dispos. 1999, 27, 633–636. [Google Scholar] [PubMed]
- Shirasaka, Y.; Chang, S.-Y.; Grubb, M.F.; Peng, C.-C.; Thummel, K.E.; Isoherranen, N.; Rodrigues, A.D. Effect of CYP3A5 expression on the inhibition of CYP3A-catalyzed drug metabolism: Impact on modeling CYP3A-mediated drug-drug interactions. Drug Metab. Dispos. 2013, 41, 1566–1574. [Google Scholar] [CrossRef] [PubMed]


| Administration Route PO | Administration Route IV | ||||||||
|---|---|---|---|---|---|---|---|---|---|
| Dose PO (mg/12 H) | AUCτ (ng/mL·h) (Geometric Mean) | Cmin (ng/mL) | Dose IV (mg/24 H) | AUCτ (ng/mL·h) (Geometric Mean) | Css (ng/mL) | Ratio AUCτ | Ratio PO/IV Dose | Ratio Css/Cmin | |
| Healthy volunteers | 1 | 95.29 [90%CI 81.84–110.95] | 5.77 [90%CI 4.86–6.84] | 0.47 | 95.91 [90%CI 87.59–105.02] | 8.06 [90%CI 7.36–8.83] | 1.00 | 4.25 | 1.40 |
| Clinical case (virtual twin) | 1 | 103.67 [90%CI 86.19–124.70] | 7.09 [90%CI 5.83–8.62] | 0.51 | 104.84 [90%CI 85.43–128.65] | 8.85 [90%CI 6.82–10.21] | 0.99 | 3.92 | 1.25 |
| Both donor and recipient expressing CYP3A5 (*1/*1) | 1 | 30.76 [90%CI 28.11–33.65] | 1.50 [95%CI 1.34–1.67] | 0.30 | 30.27 [90%CI 28.31–32.37] | 2.53 [90%CI 2.36–2.70] | 1.00 | 6.67 | 1.69 |
| Donor expressing CYP3A5 (*1/*1) | 1 | 50.52 [90%CI 45.41–56.21] | 2.44 [90%CI 2.16–2.76] | 0.50 | 50.80 [90%CI 47.16–54.73] | 4.24 [90%CI 3.94–4.57] | 0.99 | 4.0 | 1.74 |
| Recipient expressing CYP3A5 (*1/*1) | 1 | 78.55 [90%CI 71.71–86.03] | 5.05 [90%CI 4.58–5.57] | 0.32 | 79.78 [90%CI 74.45–85.49] | 6.72 [90%CI 3.94–4.57] | 0.98 | 6.25 | 1.33 |
| CYP3A inhibitor (itraconazole PO) healthy volunteers | 1 | 333.11 [90%CI 258.88–388.14] | 22.62 [90%CI 19.16–26.71] | 1.15 | 335.60 [90%CI 301.76–373.22] | 29.03 [90%CI 26.11–32.27] | 0.99 | 1.74 | 1.28 |
| CYP3A inhibitor (itraconazole IV) healthy volunteers | 1 | 158.85 [90%CI 134.31–187.88] | 10.36 [90%CI 8.62–12.46] | 0.50 | 159.62 [90%CI 143.20–178.58] | 13.94 [90%CI 12.49–15.56] | 1.00 | 4.00 | 1.35 |
Disclaimer/Publisher’s Note: The statements, opinions and data contained in all publications are solely those of the individual author(s) and contributor(s) and not of MDPI and/or the editor(s). MDPI and/or the editor(s) disclaim responsibility for any injury to people or property resulting from any ideas, methods, instructions or products referred to in the content. |
© 2024 by the authors. Licensee MDPI, Basel, Switzerland. This article is an open access article distributed under the terms and conditions of the Creative Commons Attribution (CC BY) license (https://creativecommons.org/licenses/by/4.0/).
Share and Cite
Martischang, R.; Nikolaou, A.; Daali, Y.; Samer, C.F.; Terrier, J. Guidance on Selecting Optimal Steady-State Tacrolimus Concentrations for Continuous IV Perfusion: Insights from Physiologically Based Pharmacokinetic Modeling. Pharmaceuticals 2024, 17, 1047. https://doi.org/10.3390/ph17081047
Martischang R, Nikolaou A, Daali Y, Samer CF, Terrier J. Guidance on Selecting Optimal Steady-State Tacrolimus Concentrations for Continuous IV Perfusion: Insights from Physiologically Based Pharmacokinetic Modeling. Pharmaceuticals. 2024; 17(8):1047. https://doi.org/10.3390/ph17081047
Chicago/Turabian StyleMartischang, Romain, Argyro Nikolaou, Youssef Daali, Caroline Flora Samer, and Jean Terrier. 2024. "Guidance on Selecting Optimal Steady-State Tacrolimus Concentrations for Continuous IV Perfusion: Insights from Physiologically Based Pharmacokinetic Modeling" Pharmaceuticals 17, no. 8: 1047. https://doi.org/10.3390/ph17081047